Article

Early Effect of Pine Biochar on Peach-Tree Planting on Microbial Community Composition and Enzymatic Activity

1
Department of Crop and Soil Sciences, North Carolina State University, Raleigh, NC 27607, USA
2
Department of Horticultural Sciences, North Carolina State University, Raleigh, NC 27607, USA
*
Author to whom correspondence should be addressed.
Appl. Sci. 2021, 11(4), 1473; https://doi.org/10.3390/app11041473
Submission received: 23 December 2020 / Revised: 17 January 2021 / Accepted: 1 February 2021 / Published: 6 February 2021
(This article belongs to the Special Issue Microbial Processes and Nutrient Chemistry in Soils)

Abstract

:
Biochar offers several benefits as a soil amendment, including increased soil fertility, carbon sequestration, and water-holding capacity in nutrient-poor soils. In this study, soil samples with and without biochar additives were collected for two consecutive years from an experimental field plot to examine its effect on the microbial community structure and functions in sandy soils under peach-trees (Prunus persica). The four treatments evaluated consisted of two different rates of biochar incorporated into the soil (5%, and 10%, v/v), one “dynamic” surface application of biochar, and a 0% biochar control. Fatty acid methyl ester (FAME) analysis was used to assess the microbial community structure, and enzyme activities involved in C, N, P, and S nutrient cycling were used as a means of assessing soil functionality. Total FAME and bacterial indicators increased by 18% and 12%, respectively, in the 10% incorporated and 5% surface applied treatments. Biochar applications increased β-glucosaminidase and arylsulfatase activities, 5–30% and 12–46%, respectively. β-glucosidase and acid phosphatase activities decreased by approximately 18–35% and 5–22% in the 0–15 cm soils. The overall results suggest that biochar’s addition to the sandy soils stimulated microbial activity, contributing to the increased mean weight diameter (MWD), C sequestration, and consequential soil health. The changes in microbial community structure and functions may be useful predictors of modifications in soil organic matter (SOM) dynamics due to the long-term application of pine biochar in these systems.

1. Introduction

Biochar is a product of pyrolysis, the thermal degradation of organic materials in the absence of air. The residual solid of the pyrolysis process is distinguished from charcoal by its generally high carbon content and use in soil management as a soil amendment [1]. Among its many reported benefits to soil fertility, biochar can increase soil physical and chemical properties, which encourages soil microbial community activities [2] and soil health [3]. The improvements in soil health through biochar in agricultural systems typically translate into profits and benefits to plant growth/productivity and food quality [4,5]. The chemical compositions and physical structures of biochar are determined by several factors, including feedstock, pyrolysis system, and pyrolysis temperature [6,7]. These factors also play essential roles in determining how different biochar types impact soil properties and functions and microbial communities [6].
Soil microbial communities are a crucial biological factor and a potential indicator of soil health, affecting nutrient cycles and plant growth, and the cycling of soil organic matter (SOM) [8,9,10]. However, establishing universal methods of evaluating biochar’s impacts on soil properties and microbial community functions are ongoing. Several studies have reported that the pyrolyzed soil additive may variably affect the multitude of microbial assemblages that comprise soil communities. Wang et al. [11] found that biochar’s addition influences microbial dynamics through changes in soil physical structure. Other studies suggest that biochar affects soil chemistry changes such as pH or cation exchange capacity (CEC) [12,13] altering the community structure. Farrell et al. [14] reported that the labile C contained in biochar might serve as a substrate for the growth of specific microbial communities and stimulate their activity. Additionally, biochar’s physically porous nature provides a micro-environment for less disturbed soil microbial community structural formation and protection from predation [15]. Studies using molecular methods of evaluation have shown that biochar indirectly or directly causes soil microbial group changes.
Despite the growing popularity of next-generation sequencing methods, which allow for detailed analysis of soil microbial communities, the determination of soil organisms’ fatty acid patterns is still one of the most commonly used methods for testing microbial biomass and community structures [16]. Ester-linked fatty acid methyl ester (EL-FAME) profiling provides a rapid, inexpensive, reproducible, and reliable approach to characterize the existing microbial community of soil. This method’s major advantage is that it specifically describes the structure of the living microbiota, as phospholipids are rapidly converted into neutral lipids upon microbial death [17]. The method involves in-situ hydrolysis and the fatty acids’ methylation, which free the fatty acids from soil organic matter [18]. The major microbial groups profiled are distinguished by indicator fatty acids (biomarkers). Fungal population biomarkers include saprophytic (18:1ω9c, 18:2ω6c, 18:3ω6c, and 20:5ω3) and arbuscular mycorrhiza (16:1ω 5c, 20:1ω9c, 20:2ω6c, and 22:1ω9c) indicators. Bacterial indicators include Gram-positive bacteria (i.e., i15:0, a15:0, i17:0, and a17:0), Gram-negative bacteria (i.e., cy17:0, cy19:0, i13:0 3OH and i17:0 3OH), and actinomycetes (10 Me16:0, 10 Me17:0 and 10 Me18:0) [18]. Although this method provides a historical evaluation of the microbial communities of a soil, the interpretation of EL-FAME profiles from whole soil communities can be challenging as phospholipid fatty acid (PLFA) compounds are not at all specific to organisms and are shared across microbial communities [19]. Despite its limitations, the EL-FAME method can be used to describe the size, and structure of microbial communities in soils that may rapidly respond to plant and soil characteristics changes because of different nutrient availability, substrate’s quality and quantity, root exudates, and rhizodeposits [20]. Furthermore, the method is used as an indicator of the biological component for soil health assessments [21,22]. Studies suggest elevated microbial biomass and significant microbial community composition and function variations have occurred due to biochar addition to soils [23]. Studies using phospholipid fatty acid (PLFA) analysis found increased concentrations of gram-positive bacteria and Actinobacteria biomarkers [24,25] and elevated fungal/bacterial ratios [24]. Nevertheless, biochar was responsible for decreasing the gram-positive/gram-negative relationship in another study [26].
Soil enzyme activities (EAs) are used as key soil health indicators of soil function owing to the sensitivity of enzymes to changes in soil nutrient transformation and SOM dynamics due to variations in land use, management, pollution, and climate [27]. Since the stabilization of OM additions into soil organic carbon (SOC) is mediated by microbial processing [28,29], the activity of enzymes that transform SOM and other minerals has been proposed to be a fundamental driver of elemental turnover. As a result, assays of EAs are useful when describing responses to management practices such as tillage and OM inputs because of their fast response, sensitivity, and adaptability to ecosystem changes [28]. Four EAs have been evaluated as soil health indicators due to the essential roles played in the cycling reactions that release bioavailable C (β-glucosidase), N, and C (β-glucosaminidase), P (acid phosphomonoesterase), and S (arylsulfatase) nutrients [30]. Foster et al. [31] studied the impact of pinewood biochar on soils under maize production. They found that biochar increased β-glucosaminidase activity but decreased the activities of β-glucosidase and acid phosphatase. However, in another study by Bayley et al. [32], biochar’s addition had different results depending on soil characteristics and EA assayed. For example, β-glucosidase activity increased with a 2% biochar addition in sandy loam and silt loam soils while the activity decreased in sandy soil. Additional studies evaluating pinewood biochar’s effects on different soil types and crop production systems using the four EAs as proxies representing C, N, P, and S cycling status are needed.
In the Sandhills region of North Carolina, peach-tree production is a critical economic sector. These soils are fragile due to their sandy texture and low SOM content (0.60%), and pinewood biochar amendments can improve soil health. This project’s related work has already demonstrated that pinewood biochar increased TC and macro-aggregates fractions, while active C decreased. Moreover, biochar significantly increased soil activity, as revealed by the biogeochemical cycle index, CNPS activity [33].
This study evaluated pinewood biochar’s impact at different rates on microbial community structure and nutrient cycling in soils under peach trees. This information can help producers optimize the rates of biochar applications to soils. Soil physicochemical properties, including the SOM dynamics, were also used to explore the potential mechanisms influencing the changes in the soil microbial community. Based on previous results [33], we hypothesized that biochar would alter the soil microbial community structure and the soil EAs involved in nutrient cycling based on the depth of incorporation (incorporation and surface) and application rates (5% and 10%).

2. Materials and Methods

2.1. Site Description and Soil Sampling

A detailed description of the field site and experimental design is given in Frene et al. [32]. In short, the peach-tree orchard was established in 2017 at the Sandhills Research Station in Jackson Springs, NC (35.21° N, 79.63° W). The soil is classified as a sandy, Kaolinitic, thermic Grossarenic Kandiuduits with a pH of 5.8. The study site is located in a semi-arid region where the annual average temperature is 15.4 °C, and the average annual precipitation is 117 cm. Generally, most precipitation was received during September 2018 and April 2019 months.
The peach-tree (Contender variety) orchard study is set up in a randomized block design. Each treatment plot (block) consisted of 6 subplots (replicates) with six trees, considered as replicates. The trees grown at a spacing of 5.5 m within the row and 6.0 m between rows were irrigated with micro-sprinklers and fertilized at the standard commercial rate. There were four different treatments evaluated that included two rates of biochar incorporated into the soil (5%-Inc and 10%-Inc v/v), one surface application of 5% (5%-Sur) to the dripline annually, and the untreated control (CT). The biochar was obtained from pine-tree wood, which was pyrolyzed at atmospheric pressure and approximately 550 °C. The pyrolyzed wood was incorporated to a depth of 30 cm in 2017. The biochar has a pH (H2O) of 5.4, cation exchange capacity (CEC) of 189.3 c·mol·kg−1, organic carbon content of 676.0 g·kg−1, total N content of 3.91 g·kg−1, total phosphorus (P) content of 0.933 g·kg−1, and an ash content of 37.1%.
The soil samples were collected from two different depths (0–15 and 15–30 cm) in August 2018 and July 2019. During samplings, the environmental conditions were similar, with average precipitation and temperatures of 100 mm and 25 °C, respectively. Six combined subsamples were taken in each treatment, immediately sealed in plastic bags, placed on ice in coolers, and transported to the laboratory. For EL-FAME, soils were sieved (2 mm) and stored at −20 °C, and for soil chemical and soil enzyme activity measurements, subsamples were air-dried and sieved (2 mm).

2.2. Soil Chemical Analysis

Selected chemical analysis performed on all soil samples included gravimetric soil moisture, total C (TC) and total N (TN) content, active C (POXC), and pH analyses were published previously [33]. Briefly, gravimetric soil moisture was determined on 10 g subsamples by oven-drying at 105 °C for 24 h and subsequently used for soil dry weight correction. Total C and Total N were determined by automated dry combustion using a LECO Tru-Spec CN analyzer by IELS (NCSU, Raleigh, NC, USA). The labile soil C pool (POXC) was measured using the Permanganate-oxidizable carbon method described by Culman et al. [34]. Briefly, 5 g of air-dried soil was weighed into polypropylene 50-mL screw-top centrifuge tubes. To each tube, 18 mL of deionized water and 2 mL of 0.2 M KMnO4 stock solution were added, and tubes were shaken for precisely 2 min, at 240 oscillations per minute on an oscillating shaker. Tubes were allowed to settle for precisely 10 min, then 0.5 mL of the supernatant was transferred into a second 50-mL centrifuge tube and mixed with 49.5 mL of deionized water. An aliquot (200 μL) of each sample was loaded into a 96-well plate containing a set of internal standards, including a blank of deionized water, four standard stock solutions (0.00005, 0.0001, 0.00015, and 0.0002 mol L−1 KMnO4), a soil standard and a solution standard (laboratory reference samples). The KMnO4 stock solution concentration was 0.2 M [34,35]. All internal standards were analytically replicated on each plate. Sample absorbance was read with a Genesis UV/Vis Spectrophotometer. Soil pH was measured at a soil-water ratio of 1:2.5, using a compound electrode (Accumet, Westford, MA, USA).

2.3. Soil Water-Stable Aggregate Analysis and Calculation

Water-stable aggregates were separated by a wet-sieving method adapted from Elliot [36]. A 10 g representative sample of 2 mm sieved soil was submerged in deionized water at temperature room, and the sample was shaken for 10 min at 250 rpm. Two sieves sizes (250 µm and 53 µm) were used to generate the three aggregate size fractions: (1) >2000 µm (macro-aggregates); (2) 53–250 µm (micro-aggregates); (3) <53 µm (soil particles). The aggregate fractions retained on each sieve were rinsed into pre-weighed aluminum pans, oven-dried at 60 °C, and then reweighed. The index of aggregate stability, mean weight diameter (MWD), is based on a weighted average of the three aggregate size classes, which was calculated using the following equation [37]:
MWD = i = 1 3 P i S i
where Si is the average diameter (µm) for particles in its fraction and Pi is the weight percentage of the fraction in the whole soil.

2.4. Fatty Acid Methyl Ester (EL-FAME) Analysis

Microbial community structure was determined using the ester-linked fatty acid methyl ester (EL-FAME) analysis method by Schutter and Dick [38]. The EL-FAME method was performed following four steps: (1) saponification and methylation of ester-linked fatty acids by incubation of 3 g of soil in 15 mL of 0.2 M KOH in methanol at 37 °C for 1h, during which time the samples were vortexed every 10 min, and at the end of the incubation, 3 mLs of 1.0 M acetic acid was added to the mixture to neutralize the pH; (2) the FAMEs were partition into an organic phase by adding 10 mL of hexane followed by centrifugation at 480× g for 10 min; (3) the hexane layer was transferred to a clean glass test tube, and the hexane evaporated under a stream of N2; and (4) the FAMEs were dissolved in 300 µL of 1:1 hexane:methyl-tert butyl ether containing a 19: 0 internal standard (methyl nonadecanoate acid) and transferred to a gas chromatography (GC) vial for analysis. Using this protocol, the extracted FAMEs were analyzed in a Agilent 7890B GC Series (Wilmington, DE, USA) equipped with a flame ionization detector and a fused silica capillary column (25 m × 0.2 mm) using H2 (ultra-high purity) as the carrier gas. The temperature program was ramped from 170 °C to 250 °C at 5 °C min−1 as previously done by Gardner et al. [20]. Fatty acids were identified and quantified by comparison of retention times and peak areas to components of standards. FAME concentrations (nmol g−1 soil) were calculated by comparing peak areas to an analytical standard (19:0, Sigma Chemical Co., St. Louis, MO, USA) calibration curve, which was used to calculate molar percent (mol %). The FAMEs are described by the number of C atoms, followed by a colon, the number of double bonds, and the position of the first double bond from the methyl (ω) end of the molecule. Cis isomers are indicated by c, and branched fatty acids are indicated by the prefixes i and a for iso and anteiso, respectively. Other notations are Me for methyl, OH for hydroxyl, and cy for cyclopropane. Twenty-six fatty acids (FAME) consistently present in the samples were used for the data analysis, with fourteen of the twenty-six FAMEs representing different bacterial and fungal biomarkers [39,40,41,42]. FAMEs with a carbon chain length of 14 and higher were used to calculate total FAME (nmol g−1 soil), which is used to estimate microbial biomass and community structure in agricultural soils. Different FAME profile indicators were used to represent saprophytic fungi (SaproFung), (i18:0, 18:1ω5c, 18:1ω6c, 18:1ω7c, 18:1ω9c, 18:2ω6c, 18:3ω6c), arbuscular mycorrhizal fungi (AMF), (16:1ω5c), gram-positive bacteria (GP), (i14:0, a14:0, i15:0, a15:0, i16:0, a16:0, i17:0, a17:0, i19:0, a19:0), gram-negative bacteria (GN), (cy17:0ω6c, cy19:0ω7c), and actinobacteria (10 Me16:0, 10 Me17:0, 10 Me17:1ω7c, 10 Me18:0, 10 Me18:1ω7c, 10 Me19:1ω7c). Total bacteria was calculated based on the summation of the abundance of gram-positive, gram-negative, and actinomycetes biomarkers. The fungal sum was calculated based on the total sum of saprophytic fungi (SaproFung) and AMF biomarkers. The fungal/bacterial (F:B) ratio was calculated by dividing the fungal sum by the bacterial sum. Microbial stress indicators, including FAME ratios of cyclo 17:0 to its precursor 16:1ω7 (cy:pre), SaproFung to total bacteria (SF:TB), and AMF to bacteria (AMF:TB), were calculated as previously done to evaluate conservative management by [43]. The Shannon’s diversity index [37] was calculated as follows:
H =   i = 1 26 p i ( ln   p i )

2.5. Soil Enzymatic Activities

Soil biogeochemical cycling potential was assessed based on the activity of extracellular hydrolytic enzymes, including β-1,4-glucosidase (BG), acid phosphatase (PME), arylsulfatase (AS), and N-acetyl-β-1,4-glucosaminidase (NAG). Activity rates were determined on air-dried soil samples (0.5 g < 2 mm), which were incubated at 37 °C with their appropriate substrate (p-nitrophenyl derivate) at each enzyme’s optimal pH, as described by [44,45]. The enzyme activity rates were determined based on the colorimetric determination of p-nitrophenol released as a reaction product at 400 nm. All enzyme activities were assayed in duplicate with one control, to which substrate was added after incubation and subtracted from the sample value.

2.6. Statistical Analysis

All statistical analyses were performed in R [46]. Two-way analysis of variance (ANOVA) with Fisher’s Least Significant Difference (LDS) pairwise comparisons at p < 0.05 were used to assess differences between biochar applications and sample collection years. Interactions between all of the main effects were evaluated. Principal component analysis (PCA) ordination plotting was performed using FAME groups to visualize the most relevant patterns of change to the microbial community structure with and without biochar addition in the data graphically. Redundancy analysis (RDA) was used to determine which environmental factors were related to the composition of soil microbial communities represented by the relative abundance of individual FAMEs using the R package vegan [47]. Monte Carlo permutation tests were applied to compute statistical significance (n = 499).

3. Results

3.1. Soil Physicochemical Properties

The physicochemical properties of the soil samples are shown in Supplementary Table S1. The complete analysis of soil TC, TN, and POXC is discussed in Frene et al. [33]. Briefly, the TC in the soils collected at 0–15 cm depth varied in response to the biochar application rates (p = 0.0116). TC of 5%-Inc and 10%-Inc soils respectively increased by 7% and 15% compared to the control treatment for both years. In contrast, TN decreased ~ 8% with biochar for both years in all samples except for 10%-Inc in 2019 (+7%) treated soils. The biochar application rates significantly lowered the POXC values by 8% in 2018, and the rate increased by 2% during the following year compared to the control. Soil pH did not differ significantly due to the biochar applications (p > 0.05). However, the soils experienced increased alkalinity over-time (p = 0.0317). C:N ratio increased with the addition of biochar (p = 0.00726).
At the lower depths (15–30 cm), TC, TN, and pH varied significantly between the years (p = 0.003, p = 002, p = 0.0005, respectively) but not between treatments. Both TC and TN increased from 2018 to 2019, while soil pH decreased. TC and TN values in control soils were greater than the treated soil for both years, and control soil was more alkaline in 2019. POXC did not vary by biochar application or year (p > 0.05). The C:N ratio was highest in the biochar incorporated soils, and was lowest in the control.
The applications of biochar significantly affected the physical parameters measured. MWD increased significantly in 2018 at both sampling depths (0–15: p = 0.0413 and 15–30: p = 0.0228). No significant differences in gravimetric soil moisture were found between treatments or years at both depths (p > 0.05).

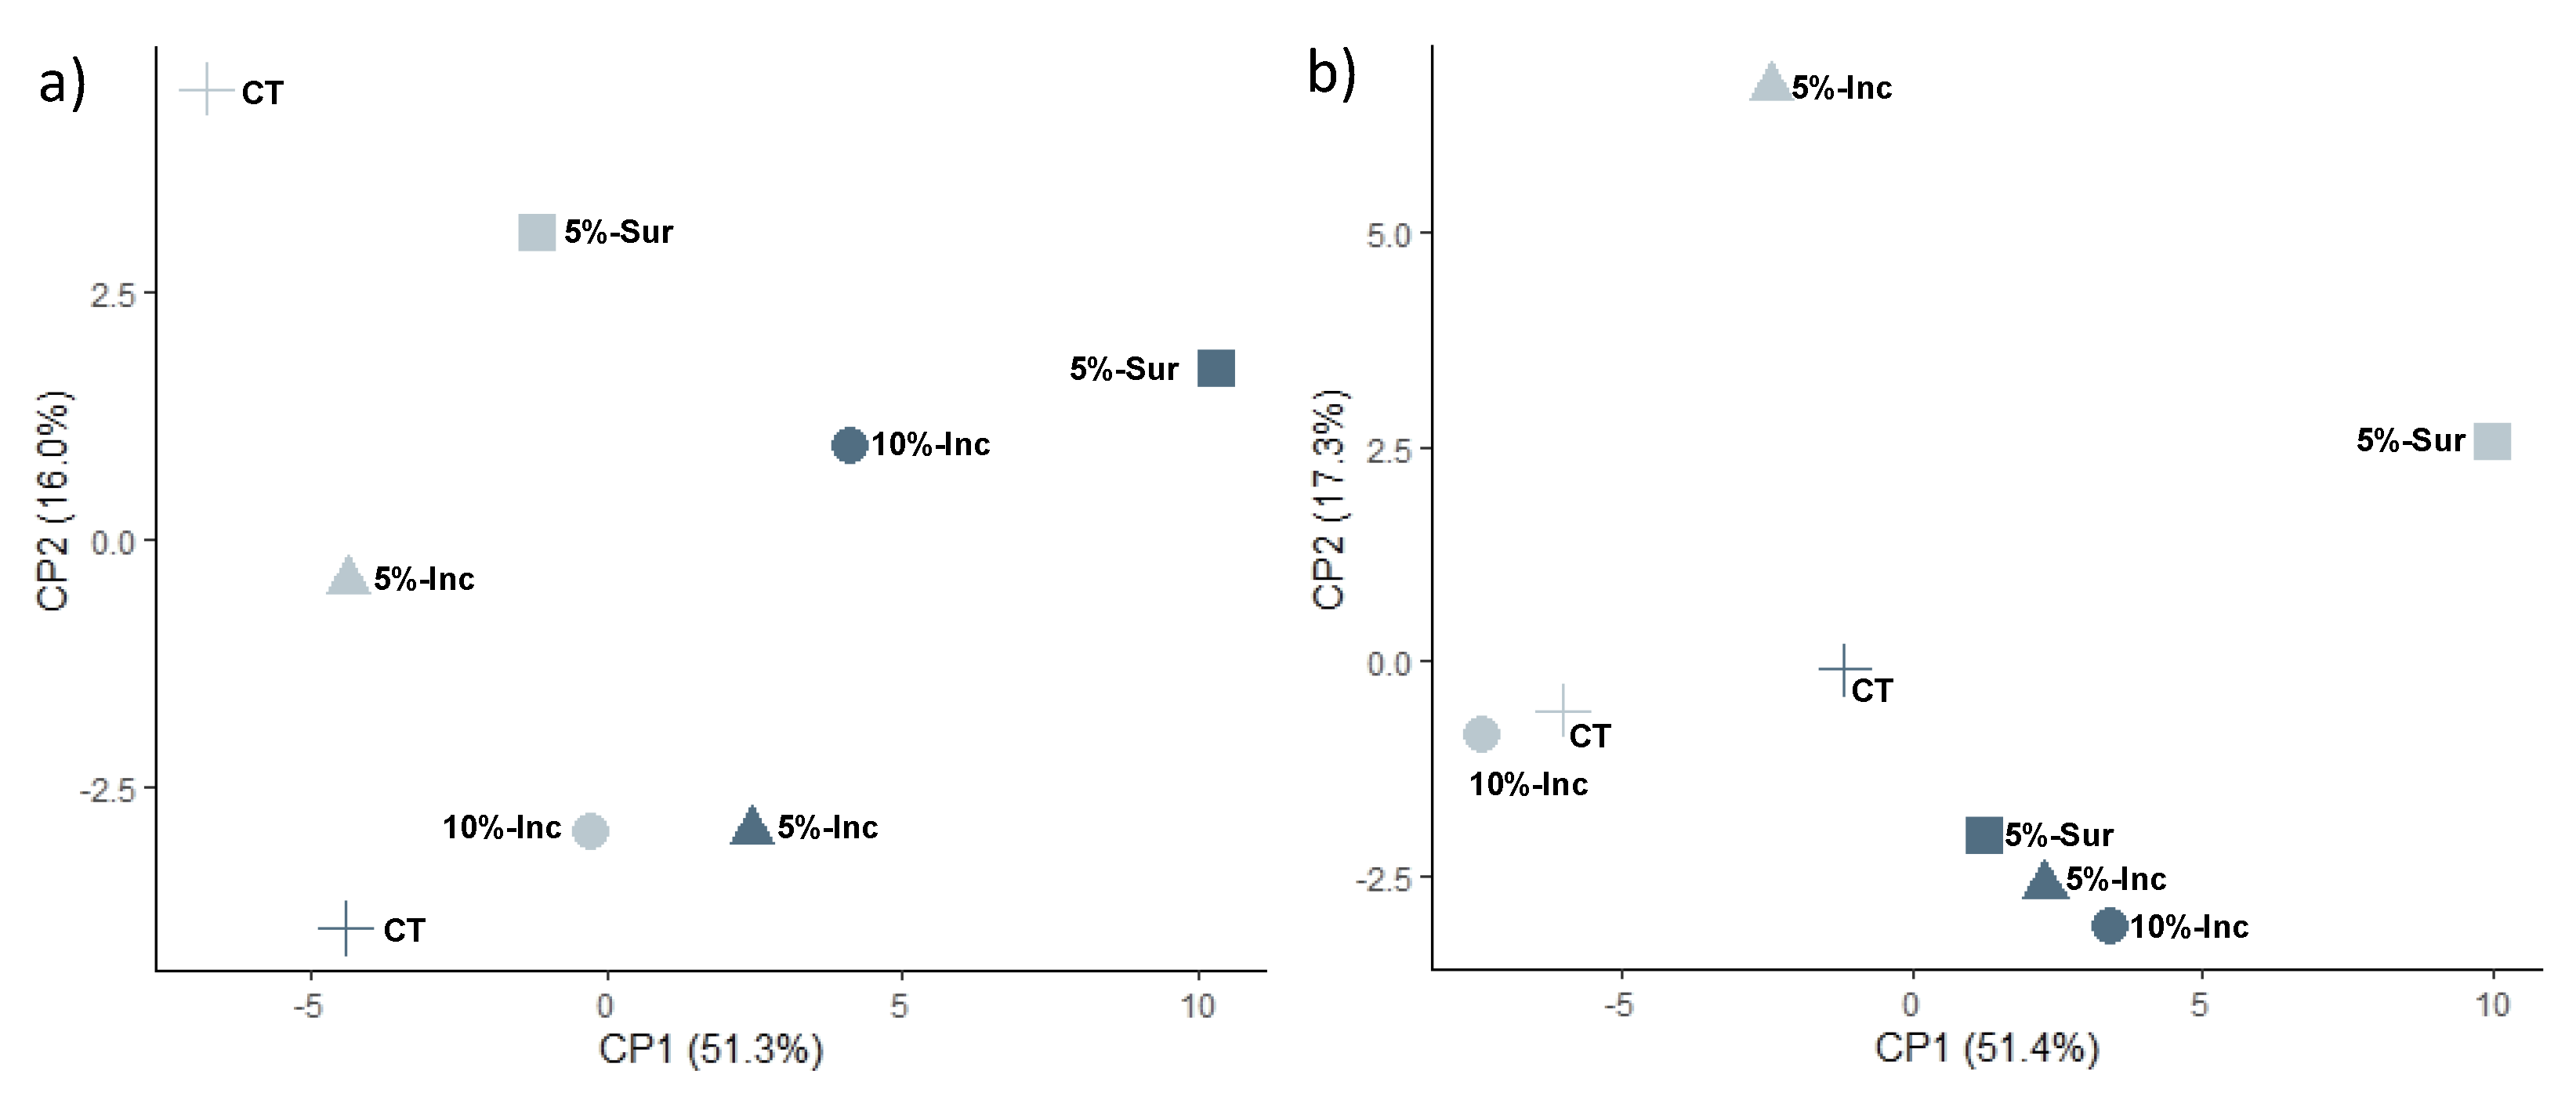
3.2. Soil Microbial Community Structure Based on FAME Analysis

A higher abundance of total abundance of FAME indicators was detected in the 2019 (p < 0.05) samples collected at 0–15 cm depth (Table 1). The addition of biochar resulted in 21%, 23%, and 36% increases in total microbial FAME contents, bacteria (total bacteria, GramPos, GramNeg, and Actino), and fungi indicators (total fungi, SF, and AMF) from 2018 to 2019 in the 5%-Inc, 5%-Sur, and 10%-Inc soils. However, compared to the control, bacteria (total bacteria, GramPos, GramNeg, and Actino) and fungi indicators (total fungi, SF, and AMF) were detected at 6% and 18% higher concentrations in the 2018 5%-Sur and 10%-Inc treatments, respectively.
FAME group comparisons of the 2018 and 2019 samples taken at 15–30 cm revealed no significant differences between biochar treatments (Table 1). However, FAME indicators reflecting microbial community size and bacteria and fungi community structure increased from 2018 to 2019 (p < 0.01). The highest total fungi and SF were detected in the control soil for both years, except for total fungi abundance in the 2018 5%-Sur soils. Total FAMEs and bacteria indicators (total bacteria, GramPos, GramNeg, and Actino) were detected at 15% and 29% lower concentrations in the 2018 collection of the 5%-Sur and 5%-Inc samples compared to 2019 (Table 1). Compared to the 2018 soils, the total FAMEs, and bacteria indicators (total bacteria, GramPos, GramNeg, and Actino) were at least 20% higher in the 2019 biochar added treatments.
Significant differences in the F:B ratio was detected between years at both depths (0–15: p = 0.0232 and 15–30: p = 0.0298) and between treatments at 15–30 cm (p = 0.0282). The highest F:B ratios were detected in the 5%-Sur sample at 0–15 cm and in the control at 15–30 cm (Table 2). The G+/G− ratio increased with biochar’s addition in 2018 and decreased in 2019, but these differences between treatments were not significant (Table 2). At 15–30 cm, the G+/G- ratio showed negligible differences after the addition of biochar. AMF/SF and AMF/TB were significantly different between years (p < 0.01). Although the differences are trivial, AMF/SF and AMF/TB ratios were lower in the control, than the biochar-applied treatments at 0–15 cm, while an opposite trend occurred at 15–30 cm. No differences were detected for SF/TB at 0–15 cm, but at 15–30 cm, the control was significantly greater than the biochar-applied treatments (p = 0.0429). Significant differences in the cy/pre ratio in the 0–15 cm soils were also found between biochar application rates and years (p = 0.0001 and p = 0.0001); the control was significantly higher than the biochar treated soils. At soil depths of 15–30 cm, the cy/pre ratio was significantly greater during 2018 (p = 0.0001). Using ANOVA negligible differences were detected by Shannon diversity index (SD) comparisons. However, at 0–15 cm, the SD values increased in the 10%-Inc and 5%-Sur soils for both years. While at 15–30 cm, 5%-Sur decreased, and 10%-Inc increased from 2018 to 2019.
Principal component analysis (PCA) was conducted using the individual FAMEs (mol %) that were detected in all the treatments (Figure 1). At soil depth of 0–15 cm, principal component 1 (PC1) and principal component 2 (PC2) accounted for 51.3 and 16.0% of the total variation, respectively (Figure 1a). When plotted, PCA illustrated clear separations between the sample years. The 2018 samples clustered with negative values of PC1 samples, and the 2019 biochar additions samples were grouped with the same component’s positive values. PC2 values for 5%-Sur soils were greater compared to both incorporated (Inc) soil treatments. Principal component 1 (PC1) and principal component 2 (PC2) accounted for 51.4% and 17.3% of the total variation respectively at the 15–30 cm depth. Like the 0–15 cm 2019 samples, the 15–30 cm depth clustered positively with PC1, but in the 2018 sample, the control and 10%-Inc gathered and have smaller PC2 values than 5%-Inc and 5%-Sur (Figure 1b).

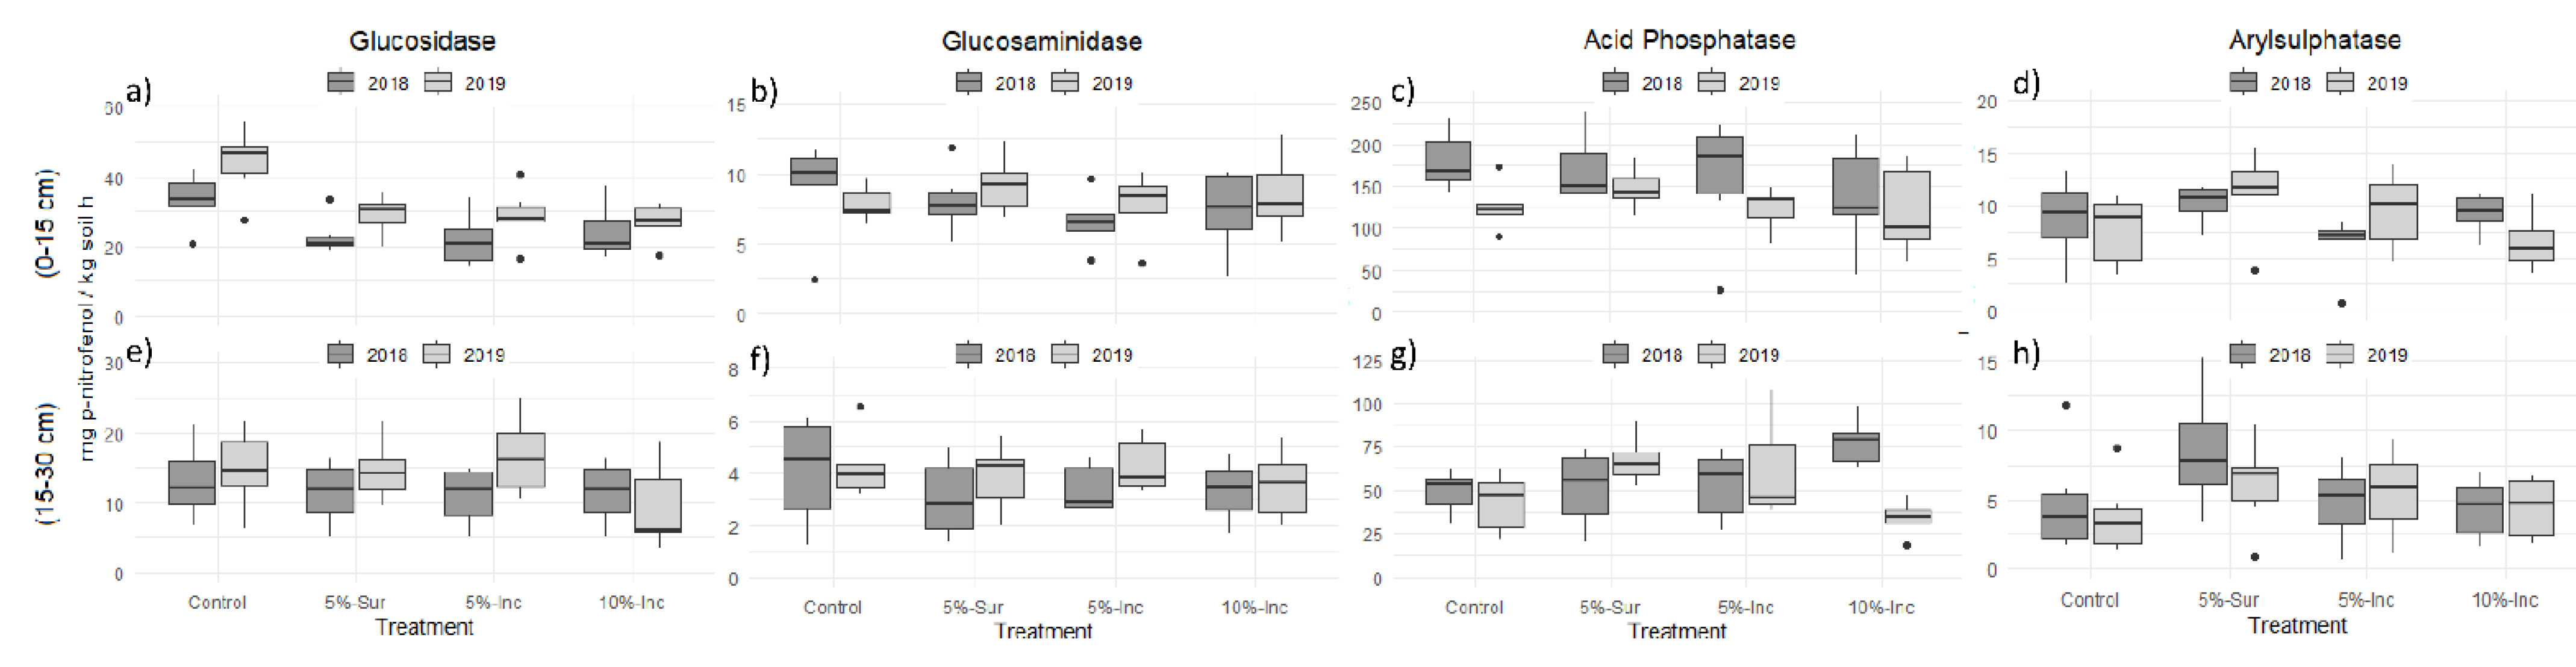
3.3. Soil Nutrient Cycling Based on Enzymes Activities

Although the results of enzyme activity measures varied by biochar application rates, the overall activities ranked with PME> BG> AS > NAG at both depths (Figure 2). At 0–15 cm, BG activities in the control samples increased from 2018 to 2019. The biochar-amended soils trended similarly, but EAs were significantly lower compared to the control. PME activities decreased significantly in the control, but the treated soils’ lower activities were not significantly different from each other over time.
Compared to the control samples, BG and PME activities decreased by approximately 18–35% and 5–22%, respectively, only PME increased 17% in 5%-Inc (Figure 2a,c). NAG increased 5–30% in 2019, and for both years, AS increased 12–46% in the biochar treated soils (Figure 2b,d). NAG and AS activities in the 5%-Inc soils were 28% lower in 2018. AS activity in the 10%-Inc samples decreased by 15% in 2019.
The differences in biochar treatments at 15–30 cm depth were not significant for any EAs. However, BG activities increased in all soils except for the 12% decrease in the 10%-Inc soils (Figure 2e). NAG activities showed a 10% increase from 2018 to 2019 in the biochar amended samples (Figure 2f). PME and AS activities increased in the treated soils compared to the controls, resulting in respective increases of 5–40% and 23–56% in the biochar-treated samples (Figure 2g,h).

3.4. Correlations and RDA Analysis

Based on Pearson correlation analysis, FAME indicators were significantly and positively correlated with chemical parameters (TC, TN, and POXC) and EAs related to C (BG) and P (PME) cycling. C:N ratio was negatively correlated with total FAME, bacterial FAMEs (total bacteria, GramPos, GramNeg, and Actino), SaproFungi, and Fungi (Figure 3).
Redundancy analysis (RDA) was performed on the enzyme activities and physio-chemical parameters used as environmental variables (Figure 4a). The first and second axes accounted for 33.59% and 2.47% of the total variation between enzyme activities and soil C and N pools, respectively. The EAs were, significantly correlated with TN (F = 3.35, p = 0.002), soil moisture (F = 2.77, p = 0.061) and TC (F = 2.02, p = 0.098) at a p-value of less than 0.1 based on Monte Carlo permutation tests.
The potential relationships occurring between EAs and the microbial community structure was assessed by RDA using FAME data (Figure 4b). The first and second axes, respectively, accounted for 41.8% and 4.89% of the total variation. Soil enzyme activities, including β-glucosidase (F = 9.20, p = 0.001), β-glucosaminidase (F = 3.63, p = 0.024), and acid phosphatase (F = 3.59, p = 0.035) activities of different biochar treatments were significantly correlated with FAME indicators based on Monte Carlo permutation tests. Results of the RDA between soil nutrients and microbial community composition (FAME indicators) are shown in Figure 4c. The first and second axes accounted for 43.54% and 0.43% of the total variation in microbial community composition and structure. The microbial community composition was not significantly correlated with the physical-chemical parameters.

4. Discussion

The addition of biochar generally enhances soil properties, including CEC, water retention, TC, or TN in soils. However, studies evaluating the first years of biochar applications and their relationship to the microbial community have received less attention than its influences on soil physicochemical properties [2,8]. Our previous study showed that the first two years of pinewood biochar application to the sandy soil investigated experienced an 18% increase in TC, and showed signs of improvements in C sequestration and SOM dynamics [33]. The TC increase in biochar incorporated (10%-Inc) in the 0–15 cm soils support claims reported in other studies that suggest a contributing role of biochar in C sequestration [8]. The beneficial effect produced by the biochar amendments could be due to the stimulation of soil microorganisms’ metabolism, consequently leading to increased cycling of nutrients trapped in biomass residue. This study provides an insight into the compositional and functional responses of the soil microbial community to biochar amended sandy soils.
Our results indicated that the total FAMEs, an index of microbial community size, increased in the three biochar amended soil treatments by the second year (2019). Increased soil microbial community size in the pinewood biochar treatments after two years may be explained by the changes in SOM dynamics and soil aggregation (significant and positive correlation). After the first year, the soil health indicator of microbial transformations, C/N ratios, were higher in the biochar-treated soil than the control. This trend continued, being more pronounced in the second year, potentially due to biochar’s microbial use as a substrate. However, elevated C/N ratios suggest slow transformation and recycling of organic matter [48]. Biochar contains a small amount of labile organic C, caused by the breakdown of the pyrolyzed material’s original chemical structure [49]. However, the biochar’s woody parent material has a C-rich structure (67.6%) with a high proportion of aromatic compound structures, explaining why it took until the second year for the effects to reach this detection level. The additional, high surface area of this type of biochar may adsorb water-nutrients such as soluble C that facilitate microbial colonization [50] and enhance soil aggregation [11]. The greater microbial abundance detected can contribute to increases in microbial extracellular polymeric substances (EPS), classified as polysaccharides that can heighten soil particles’ aggregation and benefit plants by maintaining moisture and trapping nutrients [29,51]. Slight changes in microbial composition occurred after the first year of the biochar additions. However, a significant change appeared after the second year. These results suggest that time is a critical factor controlling soil microbial biomass and composition [52].
In our research, both total bacteria and fungi increased similarly, but only gram-positive bacteria increased significantly with the addition of pine-biochar. Gram-positive bacteria play an essential role in the degradation of aromatic soil C and can utilize biochar C for growth [14,53]. Luo et al. [54] examined bacterial assimilation of 13C labeled biochar substrates and reported greater radiolabel incorporation within gram-positive bacteria. Additionally, gram-positive bacteria and saprotrophic fungi are generally responsible for SOM and litter breakdown, while gram-negative bacteria often fill a more specialized niche as nitrifiers or methane oxidizers [55]. The gram-negative bacteria and actinomycete groups in our peach-tree soils increased with biochar, but the differences were not significant. G+/G− ratios revealed the bacterial community shift to a more gram-positive bacteria-dominated community. Gram-negative bacteria use C sources that are relatively labile, while Gram-positive bacteria use C sources derived from soil organic matter that is more recalcitrant [56]. The initial addition of biochar may result in more significant soil recalcitrant C in the first year. After its breakdown and utilization by gram-positive bacteria, the remaining labile C source may have contributed to the increased detection of gram-negative bacteria during the second year [56].
With the slight increase in microbial biomass due to adding biochar to the study soils, the microbial diversity increased proportionality, particularly when 5%-Sur and 10%-Inc biochar were added. The effect of biochar on soil microbial communities is very complex. Wang et al. [11] showed that biochar had a more significant impact on microbial community composition than microbial biomass. Our results showed that biochar has a differential impact on different bacterial types, e.g., the increase of gram-positive bacteria during the first year might to lead an increase in the Shannon diversity index. Additionally, one of the limitations of EL-FAME is the difficulty of differentiating dead microorganisms or plant origin residues [57]. The cyclopropyl fatty acids reportedly increases during the stationary phase of growth that follows substrate depletion in many species and is used as starvation stress indicators [58]. The cy/pre ratios in the biochar added samples were significantly lower than the control treatment for both years in the 0–15 cm soils (Table 2), indicating an actively growing microbial community, as evidenced by the increase in the total FAME indicators (Table 1).
The PCA separated the biochar amended plots from the control treatments along the first axis, particularly in 2019. The separation appeared to be influenced by higher FAME indicator concentrations. RDA analysis of the microbial community showed a strong association with enzyme activities (Figure 4b), suggesting that the microbial community’s functional activities drive the metabolic cycling status of nutrients in soils. The RDA analysis did not show a correlation between microbial communities and the soil physicochemical parameters (Figure 4c); however, the Pearson correlation did show a significantly positive correlation of TC, TN, and POXC (Figure 3). Several authors report that organic amendments influenced soil microbial communities’ biomass and structure, and these changes were related to the soil C and N content [59].
Activities of microbial-derived soil enzymes mediate many rate-limiting nutrient cycling processes in soils and play essential roles in soil organic matter dynamics [60,61]. Adding biochar has a significant effect on SOM decomposition depending on soil type, biochar origin, and pyrolysis temperature [6,7]. Our results suggest that biochar inhibited EAs involved in carbon mineralization, particularly β-glucosidase. This enzyme strongly reflects C mineralization in soils and is considered a general index for evaluating soil microbial activity [62], and is often used to measure labile C’s incorporation rate. The biochar amended soils had the lowest TN and POXC, and both soil attributes correlated directly with β-glucosidase activities (Figure 3). The decrease in labile C may also imply noticeable consumption by microorganisms. Similar decreases in β-glucosidase activity were reported [31,32,63]. Acid phosphatase catalyzes the hydrolysis of esters and anhydrides of phosphoric acid, playing a critical role in P cycling in soil ecosystems [64]. Our results revealed acid phosphatase activity patterns that were similar to β-glucosidase. Foster et al. [31] described a decrease in acid phosphatase activity due to the high concentrations of P added to the system by pinewood biochar. An alternative explanation for the decrease in glucosidase or acid phosphatase activities is the potential sorption of enzymes or substrate to the biochar surfaces [32]. If the enzyme adsorbs to a surface, causing a change in the protein morphology, the enzyme may no longer be active [64].
Soil enzyme activities involved in C and N (β-Glucosaminidase) and S (Arylsulfatase) cycling increased slightly with the biochar addition (Figure 2). In our study, RDA revealed significant correlations between whole EAs and TN and, to a lesser extent TC and soil moisture (Figure 4a). Similar findings were reported in other studies [57,64]. Correlation analysis indicated that BG, NAG, and PME were positively correlated with TC, TN, and POXC and negatively correlated with C:N ratio (Figure 3). The correlations reflect microbial communities’ response through enzyme production for soil nutrient mineralization and availability [65]. The increase in EA may be due to microbial stimulation resulting from increased C availability in the soils. Instances of abundant C sources may have resulted in N limitations for the microbial community, hence increasing N mineralization enzymes. Because of an increase in C sequestration, soil N potentially experiences microbial immobilization or biochar sorption [13,66]. The strong association between TN and soil enzyme activities (BG, NAG, and PME) suggests a shift toward increased C acquisition as N becomes readily available [67]. Moreover, higher microbial biomass due to biochar addition may also contribute to the release of more enzymes than the other treatments [68].

5. Conclusions

In summary, this study demonstrated that the nutrient cycling status and microbial community composition changed in response to different biochar applications and rates in the sandy soil. The TC content increased with the biochar application rate increase. MWD also significantly increased with the addition of biochar and may increase C sequestration. The chemically recalcitrant portion of biochar served as a substrate for microbial activity and growth, as reflected in 2019. The addition of biochar altered the microbial community composition by shifting the bacteria from a gram-negative dominated bacterial community to a more gram-positive dominated community and decreasing microbial community stress. These changes promoted microbial community growth as reflected in the elevated total FAMEs and gram-positive bacteria biomarkers detected. Biochar application decreased soil C and P cycling enzyme activities, while the N and S cycling enzymes increased. Furthermore, soil TN, and to a lesser extent, soil moisture and TC, correlated with soil enzymatic activities. The observed changes in biological properties, specifically microbial communities and enzymatic activities, highlight biochar’s potential to alter soil biology and, consequently, soil ecosystem functions. Adopting a higher-resolution molecular-based technique such as metagenomic DNA or RNA analyses to study the impact of pinewood biochar on microbial communities is needed for characterizing microbial assemblages at the family, genera, and species levels, which will be useful for understanding microbial community structure and functionality in biochar-amended sandy soils.

Supplementary Materials

The following are available online at https://www.mdpi.com/2076-3417/11/4/1473/s1. Table S1. Physical and chemical parameters with and without biochar addition. Numbers in bracket represent standard error of the means (n = 6). TC: total carbon; TN: total nitrogen; POXC: active carbon; MWD: mean weight diameter. Inc: incorporated; Sur: surface. The letter indicates statistical significance differences based on the LSD Fisher test with a p-value < 0.05. Based on Frene et al. [33].

Author Contributions

Conceptualization, T.G. and J.P.F.; methodology, T.G.; software, J.P.F.; validation, T.G.; formal analysis, T.G. and J.P.F.; investigation, T.G. and J.P.F.; resources, T.G., J.P.F., M.F., S.L., B.C. and M.P.; data curation, T.G. and J.P.F.; writing—original draft preparation, J.P.F.; writing—review and editing, T.G. and J.P.F.; visualization, J.P.F.; supervision, T.G.; project administration, T.G.; funding acquisition, T.G. All authors have read and agreed to the published version of the manuscript.

Funding

This research received no external funding.

Institutional Review Board Statement

Not applicable.

Informed Consent Statement

Not applicable.

Data Availability Statement

The authors confirm that the data supporting the findings of this study are available within the article and its supplementary materials.

Conflicts of Interest

The authors declare that the research was conducted in the absence of any commercial or financial relationships that could be construed as a potential conflict of interest.

References

  1. Lehmann, J.; Joseph, S. Biochar for Environmental Management: Science and Technology; Earthscan Books Ltd.: London, UK, 2009; pp. 1–12. [Google Scholar]
  2. Palansooriya, K.N.; Wong, J.T.; Hashimoto, Y.; Huang, L.; Rinklebe, J.; Chang, S.X.; Bolan, N.; Wang, H.; Ok, Y.S. Response of microbial communities to biochar-amended soils: A critical review. Biochar 2019, 1, 3–22. [Google Scholar] [CrossRef] [Green Version]
  3. Guo, M. The 3R Principles for Applying Biochar to Improve Soil Health. Soil Syst. 2020, 4, 9. [Google Scholar] [CrossRef] [Green Version]
  4. Zhu, X.; Chen, B.; Zhu, L.; Xing, B. Effects and mechanisms of biochar-microbe interactions in soil improvement and pollution remediation: A review. Environ. Pollut. 2017, 227, 98–115. [Google Scholar] [CrossRef] [PubMed]
  5. Verheijen, F.; Jeffery, A.C.; Bastos, A.C.; van der Velde, M.; Diafas, I. Biochar Application to Soil: A Critical Scientific Review of Effects on Soil Properties, Processes and Functions; EUR 24099 EN; Office for the Official Publications of the European Communities: Luxembourg, 2010. [Google Scholar]
  6. Yuan, P.; Wang, J.; Pan, Y.; Shen, B.; Wu, C. Review of biochar for the management of contaminated soil: Preparation, application, and prospect. Sci. Total Environ. 2019, 659, 473–490. [Google Scholar] [CrossRef]
  7. Sun, K.; Ro, K.; Guo, M.X.; Novak, J.; Mashayekhi, H.; Xing, B.S. Sorption of bisphenol A, 17α-ethinyl estradiol and phenanthrene on thermally and hydrothermally produced biochars. Bioresour. Technol. 2011, 102, 5757–5763. [Google Scholar] [CrossRef] [PubMed]
  8. Lehmann, J.; Rillig, M.C.; Thies, J.; Masiello, C.A.; Hockaday, W.C.; Crowley, D. Biochar effects on soil biota—A review. Soil Biol. Biochem. 2011, 43, 1812–1836. [Google Scholar] [CrossRef]
  9. Liang, Q.; Chen, H.Q.; Gong, Y.S.; Yang, H.F.; Fan, M.S.; Kuzyakov, Y. Effects of 15 years of manure and mineral fertilizers on enzyme activities in particle-size fractions in a North China Plain soil. Eur. J. Soil Biol. 2014, 60, 112–119. [Google Scholar] [CrossRef]
  10. Kuzyakov, Y.; Subbotina, I.; Chen, H.; Bogomolova, I.; Xu, X. Black carbon decomposition and incorporation into soil microbial biomass estimated by 14C labeling. Soil Biol. Biochem. 2009, 41, 210–219. [Google Scholar] [CrossRef]
  11. Wang, D.; Fonte, S.; Parikh, S.; Six, J.; Scow, K. Biochar additions can enhance soil structure and the physical stabilization of C in aggregates. Geoderma 2017, 303, 110–117. [Google Scholar] [CrossRef] [Green Version]
  12. Aciego Pietri, J.C.; Brookes, P.C. Relationships between soil pH and microbial properties in a UK arable soil. Soil Biol. Biochem. 2008, 40, 1856–1861. [Google Scholar] [CrossRef]
  13. Laird, D.A. The charcoal vision: A win-win scenario for simultaneously producing bioenergy, permanently sequestering carbon, while improving soil and water quality. Agron. J. 2008, 100, 178–181. [Google Scholar]
  14. Farrell, M.; Kuhn, T.K.; Macdonald, L.M.; Maddern, T.M.; Murphy, D.V.; Hall, P.A.; Singh, B.P.; Baumann, K.; Krull, E.S.; Baldock, J.A. Microbial utilization of biochar-derived carbon. Sci. Total Environ. 2013, 465, 288–297. [Google Scholar] [CrossRef] [PubMed]
  15. Quilliam, R.; Glanville, H.; Wade, S.; Jones, D. Life in the ‘charosphere’—Does biochar in agricultural soil provide a significant habitat for microorganisms? Soil Biol. Biochem. 2013, 65, 287–293. [Google Scholar] [CrossRef]
  16. Li, C.; Cano, A.; Acosta-Martinez, V.; Veum, K.; Moore-Kucera, J. A comparison between fatty acid methyl ester profiling methods (PLFA and EL-FAME) as soil health indicators. Soil Sci. Soc. Am. J. 2020, 84, 1153–1169. [Google Scholar] [CrossRef]
  17. Karlinski, L.; Ravnskov, S.; Rudawska, M. Soil Microbial Biomass and Community Composition Relates to Poplar Genotypes and Environmental Conditions. Forests 2020, 11, 262. [Google Scholar] [CrossRef] [Green Version]
  18. Acosta-Martínez, V.; Dowd, S.E.; Bell, C.W.; Lascano, R.; Booker, J.D.; Zobeck, T.M.; Upchurch, D.R. Microbial Community Composition as Affected by Dryland Cropping Systems and Tillage in a Semiarid Sandy Soil. Diversity 2010, 2, 910–931. [Google Scholar] [CrossRef] [Green Version]
  19. Brinton, W.F. Phospholipid Fatty Acid (PLFA) Analysis: A Robust Indicator for Soil Health? Agri. Res. Technol. Open Access J. 2020, 24, 556281. [Google Scholar]
  20. Gardner, T.; Acosta-Martinez, V.; Senwo, Z.; Dowd, S.E. Soil Rhizosphere Microbial Communities and Enzyme Activities under Organic Farming in Alabama. Diversity 2011, 3, 308–328. [Google Scholar] [CrossRef]
  21. Luo, D.; Chen, R.-M.; Liu, S.; Shi, Z.-M.; Feng, Q.-H. Responses of Soil Microbial Community Composition and Enzyme Activities to Land-Use Change in the Eastern Tibetan Plateau, China. Forests 2020, 11, 483. [Google Scholar] [CrossRef]
  22. Cavigelli, M.A.; Robertson, G.P.; Klug, M.J. Fatty acid methyl ester (FAME) profiles as measures of soil microbial community structure. Plant Soil 1995, 170, 99–113. [Google Scholar] [CrossRef]
  23. Chen, J.; Li, S.; Liang, C.; Xu, Q.; Li, Y.; Qin, H.; Fuhrmann, J. Response of microbial community structure and function to short-term biochar amendment in an intensively managed bamboo (Phyllostachys praecox) plantation soil: Effect of particle size and addition rate. Sci. Total Environ. 2017, 574, 24–33. [Google Scholar] [CrossRef]
  24. Ameloot, N.; De Neve, S.; Jegajeevagan, K.; Yildiz, G.; Buchan, D.; Funkuin, Y.N.; Prins, W.; Bouckaert, L.; Sleutel, S. Short-term CO2 and N2O emissions and microbial properties of biochar amended sandy loam soils. Soil Biol. Biochem. 2013, 57, 401–410. [Google Scholar] [CrossRef]
  25. Mitchell, P.J.; Simpson, A.J.; Soong, R.; Simpson, M.J. Shifts in microbial community and water-extractable organic matter composition with biochar amendment in a temperate forest soil. Soil Biol. Biochem. 2015, 81, 244–254. [Google Scholar] [CrossRef]
  26. Zhang, L.; Jing, Y.; Xiang, Y.; Zhang, R.; Lu, H. Response of soil microbial community structure changes and activities to biochar addition: A meta-analysis. Sci. Total Environ. 2018, 643, 926–935. [Google Scholar] [CrossRef] [PubMed]
  27. Acosta-Martinez, V.; Moore-Kucera, J.; Cotton, J.; Gardner, T.; Wester, D. Soil enzyme activities during the 2011 Texas record drought/heatwave and implications to biogeochemical cycling and organic matter dynamics. Appl. Soil Ecol. 2014, 75, 43–51. [Google Scholar] [CrossRef] [Green Version]
  28. Cotrufo, M.F.; Wallenstein, M.D.; Boot, C.M.; Denef, K.; Paul, E. The Microbial Efficiency-Matrix Stabilization (MEMS) framework integrates plant litter decomposition with soil organic matter stabilization: Do labile plant inputs form stable soil organic matter? Glob. Chang. Biol. 2013, 19, 988–995. [Google Scholar] [CrossRef] [PubMed] [Green Version]
  29. Kallenbach, C.M.; Frey, S.D.; Grandy, A.S. Direct evidence for microbial-derived soil organic matter formation and its ecophysiological controls. Nat. Commun. 2016, 7, 13630. [Google Scholar] [CrossRef]
  30. Dick, R.P. (Ed.) Methods of Soil Enzymology; Soil Science Society of America: Madison, WI, USA, 2011; p. 395. [Google Scholar]
  31. Foster, E.; Hansen, N.; Wallenstein, M.; Cotrufo, M.F. Biochar and manure amendments impacts soil nutrients and microbial enzymatic activities in a semi-arid irrigated maize cropping system. Agric. Ecosyst. Environ. 2016, 233, 404–414. [Google Scholar] [CrossRef] [Green Version]
  32. Bayley, V.L.; Fansler, S.L.; Smith, J.L.; Bolton, H. Reconciling apparent variability in effects of biochar amendment on soil enzyme activities by assay optimization. Soil Biol. Biochem. 2011, 43, 296–301. [Google Scholar] [CrossRef]
  33. Frene, J.P.; Frazier, M.; Liu, S.; Clark, B.; Parker, M.; Gardner, T.G. Early response of organic matter dynamics to pine-biochar in sandy soil under peach trees. Agrosyst. Geosci. Environ. 2020, 3, e200094. [Google Scholar] [CrossRef]
  34. Culman, S.W.; Snapp, S.S.; Freeman, M.A.; Schipanski, M.E.; Beniston, J.; Lal, R. Permanganate oxidizable carbon reflects a processed soil fraction that is sensitive to management. Soil Sci. Soc. Am. J. 2012, 76, 494–504. [Google Scholar] [CrossRef] [Green Version]
  35. Weil, R.R.; Islam, K.R.; Stine, M.A.; Gruver, J.B.; Samson-Liebig, S.E. Estimating active carbon for soil quality assessment: A simplified method for laboratory and field use. Am. J. Altern. Agric. 2003, 18, 3–17. [Google Scholar]
  36. Elliott, E.T. Aggregate structure and carbon, nitrogen, and phosphorus in native and cultivated soils. Soil Sci. Soc. Am. J. 1986, 50, 627–633. [Google Scholar] [CrossRef]
  37. van Bavel, C.H.M. Mean Weight-Diameter of Soil Aggregates as a Statistical Index of Aggregation. Soil Sci. Soc. Am. J. 1950, 14, 20–23. [Google Scholar] [CrossRef] [Green Version]
  38. Schutter, M.E.; Dick, R.P. Comparison of fatty acid methyl ester (FAME) methods for characterizing microbial communities. Soil Sci. Soc. Am. J. 2000, 64, 1659–1668. [Google Scholar] [CrossRef]
  39. Zelles, L. Fatty Acid Patterns of Microbial Phospholipids and Lipopolysaccharides; Schinner, F., Öhlinger, R., Kandeler, E., Margesin, R., Eds.; Methods in Soil Biology; Springer: Berlin, Germany, 1996; pp. 80–93. [Google Scholar]
  40. Zelles, L. Phospholipid fatty acid profiles in selected members of soil microbial communities. Chemosphere 1997, 35, 275–294. [Google Scholar] [CrossRef]
  41. Zelles, L. Fatty acid patterns of microbial phospholipids and lipopolysaccharides in the characterization of microbial communities in soil: A review. Biol. Fertil. Soils 1999, 29, 111–129. [Google Scholar] [CrossRef]
  42. Frostegard, A.; Baath, E. The use of phospholipid fatty acid analysis to estimate bacterial and fungal biomass in soil. Biol. Fertil. Soil 1996, 22, 59–65. [Google Scholar] [CrossRef]
  43. Li, C.; Fultz, L.; Moore-Kucera, J.; Acosta-Martinez, V.; Karkala, M.; Weindorf, D.C. Soil microbial community restoration in Conservation Reserve Program semi-arid grasslands. Soil Biol. Biochem. 2018, 118, 166–177. [Google Scholar] [CrossRef]
  44. Tabatabai, M.A. Soil enzymes. In Methods of Soil Analysis, Part 2. Microbiological and Biochemical Properties; Bottomley, P.S., Angle, J.S., Weaver, R.W., Eds.; SSSA Book Series; Soil Science Society of America: Madison, WI, USA, 1994; pp. 775–833. [Google Scholar]
  45. Parham, J.A.; Deng, S.P. Detection, quantification and characterization of β-glucosaminidase activity in soil. Soil Biol. Biochem. 2000, 32, 1183–1190. [Google Scholar] [CrossRef]
  46. R Core Team. R: A Language and Environment for Statistical Computing; R Foundation for Statistical Computing: Vienna, Austria, 2015; Available online: http://www.R-project.org/ (accessed on 12/9/2019).
  47. Oksanen, J.; Kindt, R.; Legendre, P.; O’Hara, B.; Simpson, G.L.; Stevens, M.H.H. Vegan: Community Ecology Package. Version 1 11 14. 2008. Available online: http://vegan.r-forge.r-project.org (accessed on 12/9/2019).
  48. Kindler, R.; Siemen, J.; Kaiser, K. Dissolved carbon leaching from soil is a crucial component of the net ecosystem carbon balance. Glob. Chang. Biol. 2011, 17, 1167–1185. [Google Scholar] [CrossRef] [Green Version]
  49. Spokas, K.A.; Baker, J.M.; Reicosky, D.C. Ethylene: Potential key for biochar amendment impacts. Plant Soil 2010, 1, 443–452. [Google Scholar] [CrossRef]
  50. Santos, F.; Torn, M.S.; Bird, J.A. Biological degradation of pyrogenic organic matter in temperate forest soils. Soil Biol. Biochem. 2012, 51, 115–124. [Google Scholar] [CrossRef]
  51. Luo, Y.; Dungait, J.A.; Zhao, X.; Brookes, P.; Durenkamp, M.; Li, G.; Lin, Q. Pyrolysis temperature during biochar production alters its subsequent utilization by microorganisms in an acid arable soil. Land Degrad. Dev. 2018, 29, 2183–2188. [Google Scholar] [CrossRef]
  52. Jiang, X.; Denef, K.; Stewart, C.; Cotrufo, M.F. Controls and dynamics of biochar decomposition and soil microbial abundance, composition, and carbon use efficiency during long-term biochar-amended soil incubations. Biol. Fertil. Soils 2016, 52, 1–14. [Google Scholar] [CrossRef]
  53. Costa, O.; Raaijmakers, J.M.; Kuramae, E.E. Microbial Extracellular Polymeric Substances: Ecological Function and Impact on Soil Aggregation. Front. Microbial. 2018, 9, 1636. [Google Scholar] [CrossRef] [Green Version]
  54. Luo, S.; Wang, S.; Tian, L.; Li, S.; Shen, Y.; Tian, C. Long-term biochar application influences soil microbial community and its potential roles in semi-arid farmland. Appl. Soil Ecol. 2017, 117, 10–15. [Google Scholar] [CrossRef]
  55. Schimel, J.; Balser, T.C.; Wallenstein, M. Microbial stress-response physiology and its implications for ecosystem function. Ecology 2007, 88, 1386–1394. [Google Scholar] [CrossRef]
  56. Fanin, N.; Kardol, P.; Farrell, M.; Nilsson, M.C.; Gundale, M.J.; Wardle, D.A. The ratio of Gram-positive to Gram-negative bacterial PLFA markers as an indicator of carbon availability in organic soils. Soil Biol. Biochem. 2019, 128, 111–114. [Google Scholar] [CrossRef]
  57. Marschner, P. Soil Microbial Community Structure and Function Assessed by FAME, PLFA and DGGE—Advantages and Limitations. In Advanced Techniques in Soil Microbiology; Varma, A., Oelmüller, R., Eds.; Springer: Berlin, Germany, 2007; pp. 181–200. ISBN 978-3-540-70864-3. [Google Scholar]
  58. Bossio, D.A.; Scow, K.M.; Gunapala, N.; Graham, K.J. Determinants of soil microbial communities: Effects of agricultural management, season, and soil type on phospholipid fatty acid profiles. Microb. Ecol. 1998, 36, 1–12. [Google Scholar] [CrossRef]
  59. Wang, X.; Song, S.; Liang, G.; Zhang, Q.; Ai, C.; Zhou, W. Maize biochar addition rate influence soil enzyme activity and microbial community composition in fluvo-aqui soil. Appl. Soil Ecol. 2015, 96, 265–272. [Google Scholar] [CrossRef]
  60. Crim, P.M.; Cumming, R.J. Extracellular Soil Enzyme Activities in High-Elevation Mixed Red Spruce Forests in Central Appalachia, USA. Forests 2020, 11, 468. [Google Scholar] [CrossRef] [Green Version]
  61. Nannipieri, P.; Giagnoni, L.; Renella, G.; Puglisi, E.; Ceccanti, B.; Masciandaro, G.; Fornasier, F.; Moscatelli, M.; Marinari, S. Soil enzymology: Classical and molecular approachs. Soil Fertil. Biol. 2012, 48, 743–762. [Google Scholar] [CrossRef]
  62. Brookes, P.C.; Cayuela, M.L.; Contin, M.; Nobili, M.D.; Kemmitt, S.J.; Mondini, C. The mineralization of fresh and humified soil organic matter by the soil microbial biomass. Waste Manag. 2008, 28, 716–722. [Google Scholar] [CrossRef]
  63. Paz-Ferreiro, J.; Gascó, G; Gutiérrez, B.; Méndez, A. Soil biochemical activities and the geometric mean of enzyme activities after application of sewage sludge and sewage sludge biochar to soil. Biol. Fertil. Soils 2012, 48, 511–517. [Google Scholar] [CrossRef]
  64. Sinsabaugh, R.L.; Lauber, C.L.; Weintraub, M.N.; Ahmed, B.; Allison, S.D.; Crenshaw, C.; Contosta, A.R.; Cusack, D.; Frey, S.; Gallo, M.E.; et al. Stoichiometry of soil enzyme activity at global scale. Ecol. Lett. 2008, 11, 1252–1264. [Google Scholar] [CrossRef] [PubMed]
  65. Burns, R.G. Enzyme activity in soil: Locations and a possible role in microbial ecology. Soil Biol. Biochem. 1982, 14, 423–427. [Google Scholar] [CrossRef]
  66. Bowles, T.M.; Acosta-Martinez, V.; Calderon, F.; Jackson, L.E. Soil enzymatic activities, microbial communities, and carbon and nitrogen availability in organic agroecosystem across an intensively managed agricultural landscape. Soil Biol. Biochem. 2014, 68, 252–262. [Google Scholar] [CrossRef]
  67. Brantley, K.Y.; Savin, M.C.; Brye, K.R.; Longer, D.E. Pine woodchip biochar impact on soil nutrient concentrations and corn yield in a silt loam in the mid-southern U.S. Agriculture 2015, 5, 30–47. [Google Scholar] [CrossRef] [Green Version]
  68. Demisie, W.; Lio, Z.; Zhang, M. Effect of biochar on carbon fractions and enzyme activity of red soil. Catena 2014, 121, 214–221. [Google Scholar] [CrossRef]
Figure 1. Principle component analysis (PCA) ordination plots using FAME groups indicating changes to the microbial community structure with and without biochar addition for (a) 0–15 cm and (b) 15–30 cm of depth. (+)-control; (▲)-5%-Inc; (■)-5%-Sur, and (●)-10%-Inc soils. Numbers in parentheses along each axis represents the percent variance explained. Light symbols represent samples from 2018, and dark symbols represent samples from 2019.
Applsci 11 01473 g001
Figure 2. Enzyme activities with and without biochar addition. Error bars represent standard error of the means (n = 6); Inc-incorporated; Sur-surface.
Applsci 11 01473 g002
Figure 3. Correlation analysis based on Pearson index. Blue values are negative correlations, red values are positive correlations and white is no significant values. F/B-fungal to total bacterial ratio FAME; G+/G−-Gram-positive to Gram-negative bacterial FAME; AMF/SF-Arbuscular mycorrhiza fungi to saprophytic fungi FAME; AMF/TB-Arbuscular mycorrhiza fungi to total bacteria FAME; SF/TB-saprophytic fungi to total bacteria FAME; and cy/pre-cyclopropyl to precursor FAME; AMF-Arbuscular mycorrhiza fungi; SaproFung-Saprophytic fungi; Actino-actinomycetes; GramNeg-Gram-negative; GramPos-Gram-positive; C/N-Total organic carbon to total nitrogen; TN-total nitrogen; TC-total carbon; POXC-permanganate oxidable carbon; moisture-gravimetric soil moisture; MWD-mean weight diameter; AS-arylsulfatase; NAG-glucosaminidase; PME; acid phosphatase, and BG-glucosidase.
Applsci 11 01473 g003
Figure 4. Redundancy analyses (RDA) of the correlations between (a)-soil enzyme activities to soil properties, (b)-the correlations between soil enzyme activities and microbial community composition indicated by FAME indicators (mol%), and (c)-the correlations between soil properties and microbial community composition indicated by FAME indicators (mol%). AMF-Arbuscular mycorrhiza fungi; SaproFung-Saprophytic fungi; Actino-actinomycetes; GramNeg-Gram-negative; GramPos-Gram-positive; C/N-Total organic carbon to total nitrogen; TN-total nitrogen, TC-total carbon; POXC-permanganate oxidable carbon; moisture-gravimetric soil moisture; MWD-mean weight diameter; AS-arylsulfatase; NAG-β-glucosaminidase; PME; acid phosphatase, and BG-β-glucosidase.
Applsci 11 01473 g004
Table 1. Abundance of microbial fatty acid methyl ester (FAME) indicators groups with and without biochar addition. Numbers in bracket represent standard error of the means (n = 6). Inc: incorporated; Sur: surface; non-significant (p-value > 0.05). The letter indicates statistical significance differences based on the Fisher’ LSD test with a p-value < 0.05.
YearTreatmentsTotal FAMETotal BacteriaTotal FungiGram PositiveGram NegativeActinomycetesSaprophytic FungiAMF
0–15 cm
2018Control94.04 (13.3)23.25 (3.1)14.88 (3.8)13.44 (1.6)3.63 (0.6)6.17 (0.9)13.18 (3.1)1.92 (0.9)
5%-Sur104.15 (4.7)24.33 (2.1)16.04 (2.6) 14.57 (1.1)3.59 (0.3)6.16 (0.7)13.92 (2.4)2.12 (0.2)
5%-Inc90.38 (11.9)22.45 (2.9)12.15 (2.0)13.25 (1.6)3.25 (0.5)5.94 (0.8)10.44 (1.6)1.71 (0.9)
10%-Inc107.44 (12.2)27.79 (3.5)17.54 (3.0)16.30 (2.0)4.19 (0.5)7.29 (1.0)15.11 (2.7)2.43 (0.4)
2019Control96.14 (20.0)23.59 (3.5)18.73 (3.0)13.48 (2.2)3.60 (0.6)6.50 (0.6)16.45 (3.2)2.27 (0.4)
5%-Sur139.52 (10.4)33.47 (2.9)26.24 (2.2)18.97 (1.9)5.11 (0.4)9.39 (0.6)22.45 (2.4)3.79 (0.6)
5%-Inc109.24 (12.9)27.39 (2.8)20.02 (2.0)15.56 (1.7)3.96 (0.5)7.87 (0.6)16.57 (2.2)3.45 (0.5)
10%-Inc115.69 (12.8)28.39 (3.2)18.98 (1.8)16.10 (1.9)4.43 (0.6)7.85 (0.7)15.76 (1.8)3.22 (0.9)
ANOVATreatn.s.n.s.n.s.0.0338 n.s.n.s.n.s.n.s.
Year0.03330.02220.00248n.s.0.04730.00170.0000130.0073
TxYn.s.n.s.n.s.n.s.n.s.n.s.n.s.n.s.
15–30 cm
2018Control38.08 (22.6)8.26 (2.8)6.56 (3.1)5.01 (3.3)1.48 (1.0)1.76 (0.6)5.73 (3.6)0.83 (0.1)
5%-Sur46.87 (35.1)10.29 (4.5)6.68 (2.5)5.50 (1.1)1.70 (0.5)3.07 (0.8)5.75 (3.1)0.93 (0.3)
5%-Inc52.09 (33.5)9.02 (8.8)6.12 (3.5)5.44 (2.6)1.45 (0.6)2.16 (0.9)5.48 (2.5)0.64 (0.2)
10%-Inc33.39 (35.7)8.23 (4.2)5.12 (4.0)4.68 (2.1)1.41 (0.3)2.13 (2.9)4.60 (2.6)0.51 (0.4)
Control56.88 (25.1)10.73 (4.4)11.99 (2.4)6.07 (2.1)1.80 (1.0)2.85 (1.3)10.58 (3.0)1.40 (0.8)
5%-Sur57.12 (27.3)13.83 (5.1)9.83 (1.3)7.78 (2.7)2.24 (1.1)3.80 (1.6)7.97 (2.4)1.85 (0.2)
20195%-Inc58.18 (24.1)13.60 (4.1)10.62 (1.1)7.63 (1.9)2.16 (1.0)3.80 (1.3)9.03 (3.0)1.58 (0.2)
10%-Inc63.91 (21.9)15.31 (5.9)11.68 (3.3)8.59 (3.0)2.50 (1.2)4.20 (1.8)9.72 (3.9)1.96 (0.7)
ANOVATreat.n.s.n.s.n.s.n.s.n.s.n.s.n.s.n.s.
Year0.01150.00040.00050.00150.00040.00010.00730.0001
TxYn.s.n.s.n.s.n.s.n.s.n.s.n.s.n.s.
Table 2. Ratios between FAME groups with and without biochar addition. Numbers in bracket represent standard error of the means (n = 6). Inc-incorporated; Sur-surface. F:B-fungal to total bacterial FAME; G+/G--Gram-positive to Gram-negative bacterial FAME; AMF/SF-Arbuscular mycorrhiza fungi to saprophytic fungi FAME; AMF/TB-Arbuscular mycorrhiza fungi to total bacteria FAME; SF/TB-saprophytic fungi to total bacteria FAME; and cy/pre-cyclopropyl to precursor FAME; n.s.-non-significant (p-value > 0.05). The letter indicates statistical significance differences based on the LSD Fisher test with a p-value < 0.05.
YearTreatmentF:B RatioG+/G− RatioAMF/SF RatioAMF/TB RatioSF/TB Ratiocy/pre RatioShannon Index
0–15 cm
2018Control0.64 (0.07)3.73 (0.11)0.15 (0.03)0.08 (0.01)0.57 (0.07)0.58 (0.01)a131.54 (35.45)
5%-Sur0.66 (0.1)4.21 (0.27)0.17 (0.03)0.09 (0.01)0.58 (0.1)0.49 (0.04)b150.99 (27.06)
5%-Inc0.54 (0.04)4.07 (0.02)0.17 (0.01)0.08 (0.01)0.46 (0.03)0.47 (0.01)b110.41 (85.86)
10%-Inc0.64 (0.04)3.9 (0.09)0.17 (0.02)0.09 (0.01)0.55 (0.05)0.47 (0.01)b154.20 (31.00)
2019Control0.76 (0.1)3.84 (0.17)0.15 (0.01)0.09 (0.01)0.66 (0.1)0.48 (0.02)b134.01 (68.39)
5%-Sur0.78 (0.03)3.77 (0.21)0.18 (0.02)0.11 (0.01)0.66 (0.04)0.41 (0.02)c229.88 (43.62)
5%-Inc0.74 (0.05)4.07 (0.29)0.21 (0.02)0.13 (0.01)0.61 (0.05)0.41 (0.01)c154.95 (55.31)
10%-Inc0.67 (0.07)3.69 (0.12)0.21 (0.04)0.11 (0.02)0.56 (0.06)0.41 (0.01)c175.93 (81.82)
ANOVATreatn.s.n.s.n.s.n.s.n.s.0.0001n.s.
Year0.0232n.s.n.s.0.0002n.s.0.00010.001
TxYn.s.n.s.n.s.n.s.n.s.n.s.n.s.
15–30 cm
2018Control0.77 (0.05) b3.35 (0.09)0.15 (0.02)0.1 (0.01)0.67 (0.05) b0.52 (0.03)24.40 (6.48)
5%-Sur0.72 (0.04) b3.5 (0.22)0.23 (0.05)0.13 (0.02)0.59 (0.04) b0.44 (0.01)92.48 (55.66)
5%-Inc0.66 (0.05) b3.68 (0.37)0.13 (0.02)0.07 (0.01)0.58 (0.05) b0.42 (0.08)47.73 (26.18)
10%-Inc0.62 (0.03) b3.33 (0.1)0.11 (0.01)0.06 (0.01)0.56 (0.03) b0.51 (0.03)8.08 (4.04)
Control1.09 (0.23) a3.36 (0.14)0.19 (0.06)0.14 (0.02)0.96 (0.24) a0.38 (0.03)40.82 (16.64)
5%-Sur0.65 (0.06) b3.33 (0.37)0.16 (0.02)0.09 (0.01)0.56 (0.05) b0.46 (0.04)47.75 (34.40)
20195%-Inc0.77 (0.05) b3.5 (0.12)0.18 (0.01)0.12 (0.01)0.66 (0.04) b0.4 (0.02)42.08 (18.68)
10%-Inc0.72 (0.05) b3.33 (0.09)0.19 (0.01)0.12 (0.01)0.6 (0.04) b0.42 (0.02)64.00 (24.74)
ANOVATreat.0.0282n.s.n.s.n.s.0.0429n.s.n.s.
Year0.0298n.s.0.00660.0002n.s.0.0182n.s.
TxYn.s.n.s.n.s.n.s.n.s.n.s.n.s.
Publisher’s Note: MDPI stays neutral with regard to jurisdictional claims in published maps and institutional affiliations.

