Article

Effects of Cropland Expansion on the Regional Land Surface Radiative Energy Balance and Heat Fluxes in Northern China

Key Laboratory of Land Surface Pattern and Simulation, Institute of Geographic Sciences and Natural Resources Research, Chinese Academy of Sciences, Beijing 100101, China
Appl. Sci. 2021, 11(4), 1556; https://doi.org/10.3390/app11041556
Submission received: 31 December 2020 / Revised: 4 February 2021 / Accepted: 5 February 2021 / Published: 9 February 2021
(This article belongs to the Special Issue Applications of Remote Image Capture Systems in Agriculture Ⅱ)

Abstract

:
Land use change can impact the land surface radiation budget and energy balance by changing surface biophysical processes. Based on satellite remote sensing data and land use data from 2000 to 2015, we quantitatively estimated radiative forcing induced by cropland expansion during the early 21st century in northern China. The results showed that heat flux from the land surface to the atmosphere due to cropland expansion was quite variable in different climate zones. The heat flux increased in humid North China, whereas it decreased in arid Northwest China, semiarid Inner Mongolia, and humid Northeast China. Cropland expansion from woodland areas led to a general decline in the land surface heat flux to the atmosphere, which led to a cooling effect on the climate. The surface heat flux to the atmosphere due to cropland expansion in grassland areas displayed significant variations in different climate zones. The surface heat flux decreased only in humid Northeast China and arid Northwest China. The net surface radiation and latent heat flux both increased when grasslands were changed into cropland, but to different extents, which produced the differences in the surface heat flux to the atmosphere between different zones.

1. Introduction

It is increasingly being recognized that land use and land cover change (LULCC) caused by human activity is very important to the global climate change process. Anthropogenic land use has been and will continue to be a major driver of the climate system [1,2,3]. Land use changes affect the regional climate by changing both surface biogeochemical and biophysical processes [4]. However, policies aimed at climate protection through land management have mainly focused on biogeochemical mechanisms, and only a few studies have focused on surface biophysical processes [5,6,7]. Land use and land cover change not only changes carbon storage patterns but also alters energy balance at local scales, which has the potential to generate feedback on local and regional climates [8,9,10]. By ignoring biophysical processes, which sometimes offset biogeochemical effects, land use policies risk promoting suboptimal solutions [11,12]. Thus, it is necessary to carefully consider biophysical processes to promote LULCC proposals that will have the greatest potential climatic benefits. According to the fifth report of the Intergovernmental Panel on Climate Change (IPCC), since the industrial revolution, human activities such as farmland cropland expansion, deforestation, and other types of land use alternations have caused the amount of radiative forcing to decrease by 0.15 W/m2 on the global scale, which means that these activities have had a cooling effect on the climate [13]. However, this change in radiative forcing is still associated with great uncertainties because the biogeochemical mechanisms of the albedo and emissivity changes due to land use change on the regional scale have not been well described and studied [14]. For example, cropland expansion in tropical areas can lead to regional warming, whereas deforestation in boreal regions can result in regional cooling [10]. Deforestation in mid to high latitudes is hypothesized to have the potential to cool the Earth’s surface by altering biophysical processes [10]. In climate models of continental-scale land clearing, the cooling is triggered by increases in surface albedo and is reinforced by a land albedo–sea ice feedback mechanism [15]. This feedback is crucial in the model’s predictions; without it, other biophysical processes may overwhelm the albedo effect to generate warming instead of cooling [15]. In-situ observations, land cover change, and land management change had similar impacts that averaged 2 K at the vegetation surface and were estimated at 1.7 K in the planetary boundary layer [16]. The differences in the type and the extent of the land use change determine the changes of albedo and emissivity, which then results in variations in the radiative forcing.
To meet the demand of the world’s population for food, the area of farmland has been increasing continuously. The effects of farmland expansion on regional and global climates through changing land surface parameters have been mainly described and quantitatively analyzed by observations, modeling data, or remote sensing methods. The conversion of forests and natural grasslands to croplands increases the albedo while causing decreases in the leaf area index (LAI) and surface roughness. Statistically significant annual warming over southeast Australia was detected by the use of a simple land surface model [17]. In Northeastern China, farmland expansion decreased the temperature by 0.06 °C, according to data from the SiB2 model [18]. Across Northeastern China over the last 300 years, surface albedo has been changed by cropland expansion, and this has resulted in climate warming effects during the non-rainy seasons through surface radiation processes, but climatic effects during the summer were not readily detected with the Weather Research and Forecasting (WRF) model [19]. In Eastern China, cropland expansion has produced warming and rainy effects during the last three centuries based on four 12-year simulations with the WRF-SSiB model [20]. The temperature in both summer and winter decreased when the conversion of forest to farmland occurred in Northeastern China, according to the WRF model data [21].
Because of data scarcity, limited spatial scales, and other disadvantages, field observations are unable to effectively describe the variations in key surface parameters and climatic changes on regional/local scales. Climate model simulations driven by land use change also have significant limitations because of the uncertainties in the models and the coarse resolution of the land use data [22]. Satellite remote sensing technology offers a good way to obtain high-resolution spatial and temporal continual surface parameter information and data that reflect the true history of land cover change; hence, such data have become the main source for climate change research on regional and global scales [23,24].
Since the 20th century, with new socioeconomic developments, complex land use changes like urbanization, cropland expansion, and afforestation have occurred in China, and these changes have had a significant impact on the regional and global climate. In the early 21st century, large-scale cropland expansion occurred in northern China. Though there are many local-scale studies in China about the effects of cropland expansion on the climate, there are few studies on the larger region of northern China. In this paper, by using remote sensing data, land use change data, and reanalysis radiation data, we quantitatively assessed the change in radiative forcing due to land cropland expansion as mediated by changes to the surface albedo and emissivity in different climate zones in northern China from 2000 to 2015. We also assessed changes in the heat flux from the surface to the atmosphere caused by different cropland expansion trends in different climate zones and estimated the net effect of the cropland expansion on the surface radiation energy balance. Overall, this research aimed to reveal the effects of land cropland expansion on biophysical processes that can affect regional climate change.

2. Materials and Methods
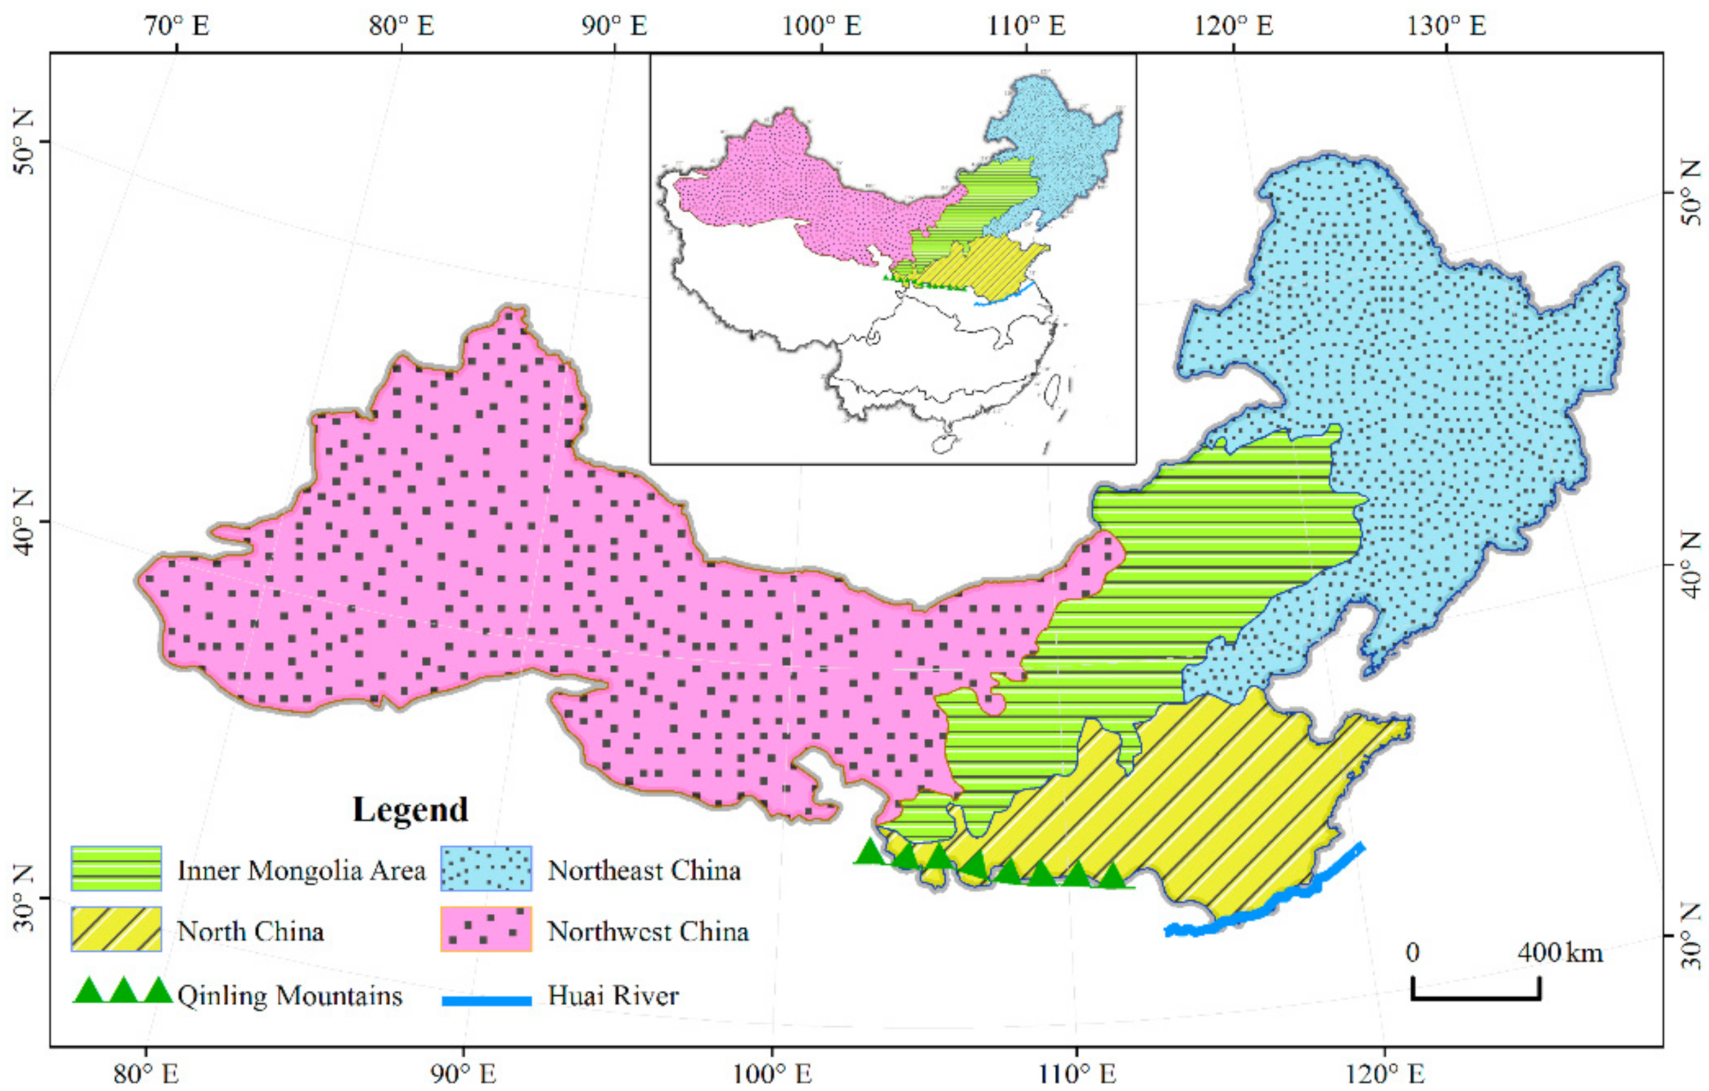
2.1. Study Area

According to China’s climate zoning [25], there are diverse areas in this region, including the semiarid temperate zone, the arid temperate zone, the humid temperate zone, and the humid tropical zone. Based on consistent data within each zone and the climate and topographic differences between the zones (Table 1), northern China was divided into the following 4 major zones: Humid Northeast China (NEC), semiarid Inner Mongolia (IM), arid Northwest China (NWC), and humid North China (NC) (Figure 1). The Qinling Mountains–Huai River served as the boundary line. The elevation in this region, in general, has a significant gradient in the north and increases from the east to west. Landforms mainly consist of mountains, plateaus, plains, hills, and sand dunes. The change of seasons is obvious in this region, and the demarcation of climate zones is significant. Because the studied differences in radiation change have a strong relationship with climate conditions, we chose to use the borders of the climate zones in this study instead of borders that demarcated other types of zones. The climate zones used here have also been widely used elsewhere; hence, our conclusions for these popular zones may be relevant to the other studies on the same zones.

2.2. Data Sources

2.2.1. Land Use Data

A land use database consisting of 1 km resolution data for China in 2000 and 2015 has been developed from Landsat Thematic Mapper/Enhanced Thematic Mapper (TM/ETM) satellite data by interactive interpretation; the database has a comprehensive accuracy of more than 90% [26,27].
The land use types were classified into the following 6 classes: Cropland, woodland, grassland, water bodies, built-up land, and unused land. The unused land refers to land that humans have not used. Most of the unused land exists because it is hard to utilize, i.e., it consists of sand, desert, saline land, marshes, barren land, and so on. We assumed that land use changes only occurred between the 6 classes and not in the sub-classes. For example, we took the change from woodland into cropland as one type of land use change. However, we recorded the change from paddy fields into dry land as unchanged land use because the paddy fields and dry land were subclasses of cropland. “Cropland expansion” was defined as the conversion of the other 5 land use classes into cropland. Because of the small area of cropland expansion from water bodies and built-up land, and also the uncertainty and complexity of the radiation change due to cropland expansion from unused land, we only focused on cropland expansion from woodland and grassland in the remaining analyses of this study.

2.2.2. Remote Sensing Products

Albedo data were derived from the MODIS (Moderate Resolution Imaging Spectroradiometer) MCD43B3 and MCD43B2 products. The spatial resolution was 1 km, and the temporal resolution was 8 d. These products have been widely validated worldwide, and the accuracy of the products meets the needs for quality spatial–temporal analyses of surface characteristics and climate change [28,29] (Table 2).
Emissivity data and land surface temperature (LST) data were derived from the MODIS product MOD11A2. The spatial resolution was 1 km, and the temporal resolution was also 8 d. According to previous studies, the accuracy of the single-band emissivity data were between 0.001 and 0.005, and this met the demands of our study. The accuracy of the LST product was less than 1 °C in the range of −10 to 50 °C [30].
Latent heat flux data were from the MODIS MOD16A2 product. The spatial resolution was 1 km, and the temporal resolution was monthly. The mean absolute error was about 0.31 to 0.33 mm.d−1 [31], and the products for forest and farmland were of higher precision than those for the other ecosystems [32].
Snow cover data from MODIS product MOD10A2 were provided by the U.S. National Snow and Ice Data Center. The spatial resolution was 500 m, and the time resolution was 8 d. This product has been extensively validated, and snow detection accuracy was over 93% [33,34].

2.2.3. Radiation Data

The downward shortwave radiation data and upward longwave radiation data were the most recent reanalysis data (ERA-Interim) offered by the European Center for Medium-Range Weather Forecasts (ECMWF); these data were subject to strict quality control [35]. The spatial resolution was 0.75°, and the temporal resolution was monthly.

2.3. Methodology

2.3.1. Data Preprocessing

To obtain accurate albedo, emissivity, land surface temperature, and latent heat flux data, we used the quality control data of MODIS to extract the data first. In other words, we extracted the pixel data of the value that represented good quality as a quality control mask and filtered the origin data to obtain surface parameter data with good quality.
The wide-band emissivity was needed for the calculation of the surface longwave radiation. However, the MODIS products only provided some narrow-band emissivity information. Hence, we used a nonlinear fitting algorithm of high precision to fit the wide-band emissivity from the 2 narrow-band datasets offered by the MODIS products [36]. The fitting algorithm was as follows:
ε b = 0.273 + 1.778 ε 31 1.807 ε 31 ε 32 1.037 ε 32 + 1.774 ε 32 2
where ε b is the wide-band emissivity and ε 31 and ε 31 are the narrow-band emissivity of band 31 and band 32 of MOD11A2, respectively.
The MODIS products only provide “white sky” and “black sky” albedo data, but we needed to use the actual surface albedo in this study. Therefore, according to sky scattering factors, we calculated the actual surface albedo based on the “white sky” and “black sky” albedo data [37]. The actual albedo can be calculated as follows:
α b l u e = S α w h i t e s k y + 1 S α b l a c k s k y .
where α b l u e is the actual albedo (i.e., the blue sky albedo), α w h i t e s k y is the white sky albedo
,   α b l a c k s k y is the black sky albedo, and S is the sky scattering factor. S can be calculated as follows:
S = a c o s ( S Z A ) b
where a and b are the regression coefficients, which are usually equal to 0.1 and −0.8, respectively, in the mid-latitude region; SZA is the solar zenith angle, which can be extracted with the MODIS albedo product.
Finally, because of the significant impact of snow on the surface parameters, we improved the surface parameter data with the snow data. To ensure consistent spatial resolution, we used the nearest neighbor sampling method to resample the maximum extent of snow cover data to a 1 km spatial resolution. Then, we extracted the pixel data of value 25, which means the land without snow cover as a mask, and filtered the surface parameter data to obtain snow-free surface parameter data.

2.3.2. Calculation of Radiative Forcing and the Heat Flux to the Atmosphere Due to Cropland Expansion

Surface radiative forcing is commonly used to describe the net radiation energy at the Earth’s surface after climate factor changes over a certain time scale (e.g., inter-annual scale); it is expressed in units of W/m2. Because the technique avoids the complex feedback processes of the Earth’s gas system, surface radiative forcing can be used to make relatively simple comparisons of the contributions of several climatic factors to climate change.
Surface radiation and energy is used to heat the air, evaporate water, and heat the soil. The radiative energy balance can be expressed as follows:
Rn = H + LE + G.
Rn is the net radiation with the unit of W/m2, H is the sensible heat flux (which can change the temperature of the air) with the unit of W/m2, LE is the latent heat flux (which can evaporate water) with the unit of W/m2, and G is the ground heat flux (which can heat the soil) with the unit of W/m2. In our study, we focus on the heat flux to the atmosphere, which can be calculated as follows:
Q = RnLE = H + G.
We can see from this formula that the heat flux to the atmosphere is the sum of the sensible heat flux and ground heat flux.
To obtain the net radiation forcing and heat flux to the atmosphere from 2000 to 2015 in northern China, we calculated the monthly albedo, emissivity, land surface temperature, and latent heat flux data from the 8 d origin data at first.
To obtain accurate estimates of the surface energy radiation balance due to cropland expansion, we must ensure that the value of the surface parameter data for each pixel represents the real value of one land use class. Therefore, we extracted the unchanged land use class pixels from 2000 to 2015, where the land use property in the pixel was more than 80% [38]. Those pixels represented the pure pixels of some land use class, and the stable pixels were an unchanged land use class. We compared the albedo, emissivity, and other biogeophysical parameters of the typical land-use types found nearby the cropland expansion. The forest, grassland and cropland adjacent to each other were chosen for pairwise comparison analyses. Then, we used the stable pixels to extract the monthly albedo, emissivity, latent heat flux, and land surface temperature. We statistically analyzed those parameters for different climate zones, and formed the best-parameters datasets. The best-parameter datasets included the monthly parameters of each climate zone for each land use class, such as Albi,z,m, Emisi,z m, LSTi,z,m, LEi,z,m, where the abbreviations referred to the albedo, emissivity, land surface temperature, and latent heat flux in the zone z of i land use class in the m month.
Next, we calculated the net shortwave radiation, net longwave radiation, net radiation, and heat flux to the atmosphere on a monthly basis.
Net shortwave radiation (Rns) was calculated based on the radiation data and the albedo data; the formula [39] is:
Rnsi,z,m = (1 − Albi,z,m) ∗ Ssrdz,m
Here, Rnsi,z,m is the monthly net shortwave radiation in the zone z of i land use class in the m month with the unit of W/m2; Albi,z,m is the monthly albedo in the zone z of i land use class in the m month; and Ssrdz,m is the monthly downward shortwave radiation data in the zone z in the m month.
Net longwave radiation (Rnl) was calculated based on the emissivity data, LST data, and radiation data; the formula is:
Rnl i , z , m = Emis i , z , m Strd z , m ( 5.67 10 8 ) Emis i , z , m LST i , z , m 4
Here, Rnli,z,m is the monthly net longwave radiation in the zone z of i land use class in the m month with the unit of W/m2; Emisi,z,m and LSTi,z,m are the monthly emissivity and land surface temperature in the zone z of i land use class in the m month, respectively; Strdz,m is the monthly downward longwave radiation in the zone z in the m month; σ is the Boltzmann Constant (5.67 × 10⁻⁸W·m−2·K−4.).
Net radiation (Rn) was calculated by Rns and Rnl; the formula is:
Rni,z,m = Rnli,z,m + Rnsi,z,m
Here, Rni,z,m is the monthly net radiation in the zone z of i land use class in the m month with the unit of W/m2.
Heat flux to the atmosphere was calculated by the latent heat flux data and net radiation data, and the formula is:
Qi,z,m = Rni,z,mLEi,z,m
Here, Qi,z,m is the monthly heat flux to the atmosphere in the zone z of i land use class in the m month with the unit of W/m2; LEi,z,m is the monthly latent heat flux in the zone z of i land use class in the m month.
Then, we averaged the values to obtain the annual averages from 2000 to 2015 and the 15-year average.
Finally, based on the calculation datasets, we calculated the changes of the land surface parameters due to cropland expansion, and the net radiation and heat flux to the atmosphere from 2000 to 2015 were estimated. The formula is:
Δ P z = P c ,   z P i ,   z
Here, Δ P z represents the change of land surface parameters as well as the heat flux to the atmosphere in the zone z due to cropland expansion; P c ,   z is the land surface parameters as well as the heat flux to the atmosphere in the zone z of cropland; P i ,   z is the land surface parameters as well as the heat flux to the atmosphere in the zone z of the other i land use classes.

3. Results

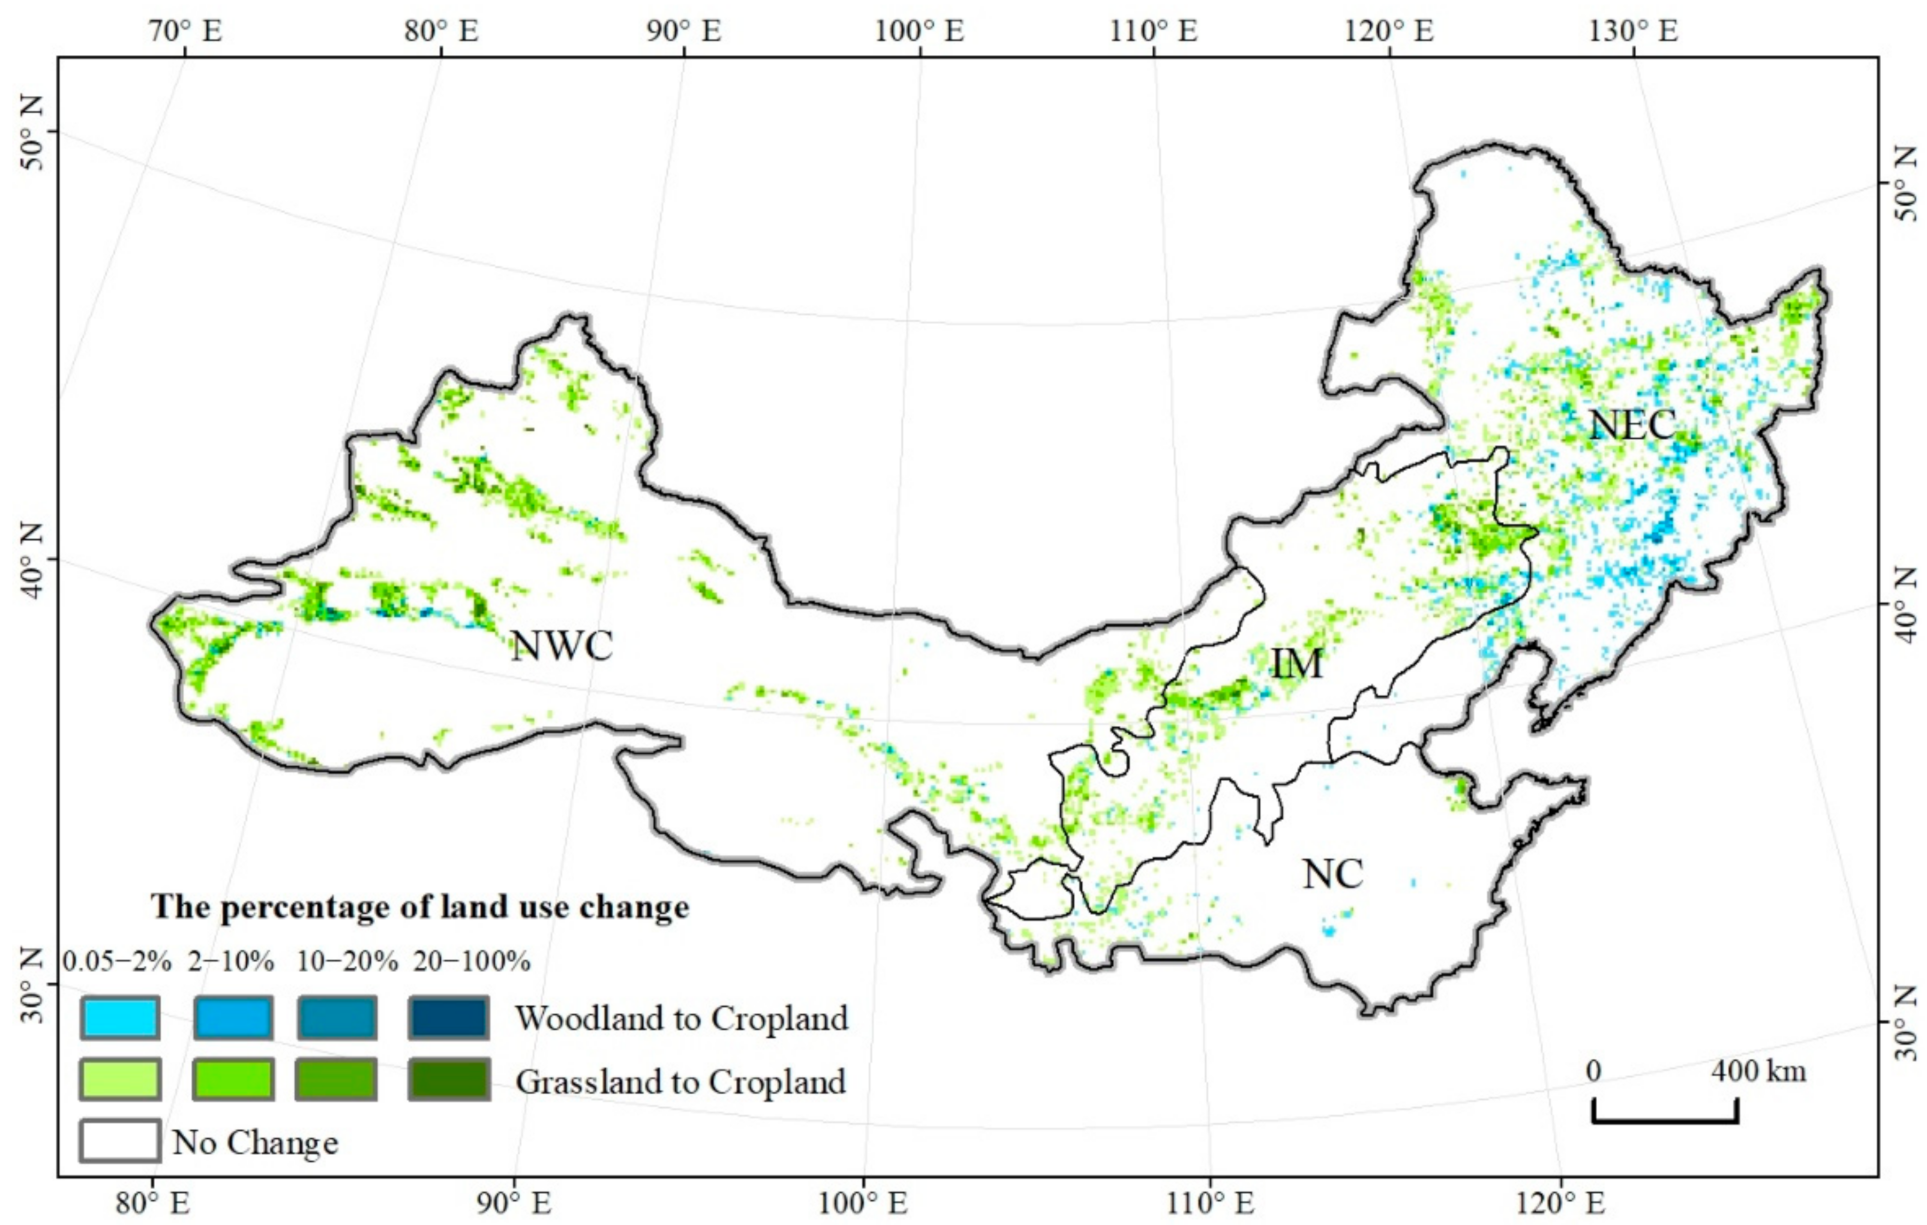
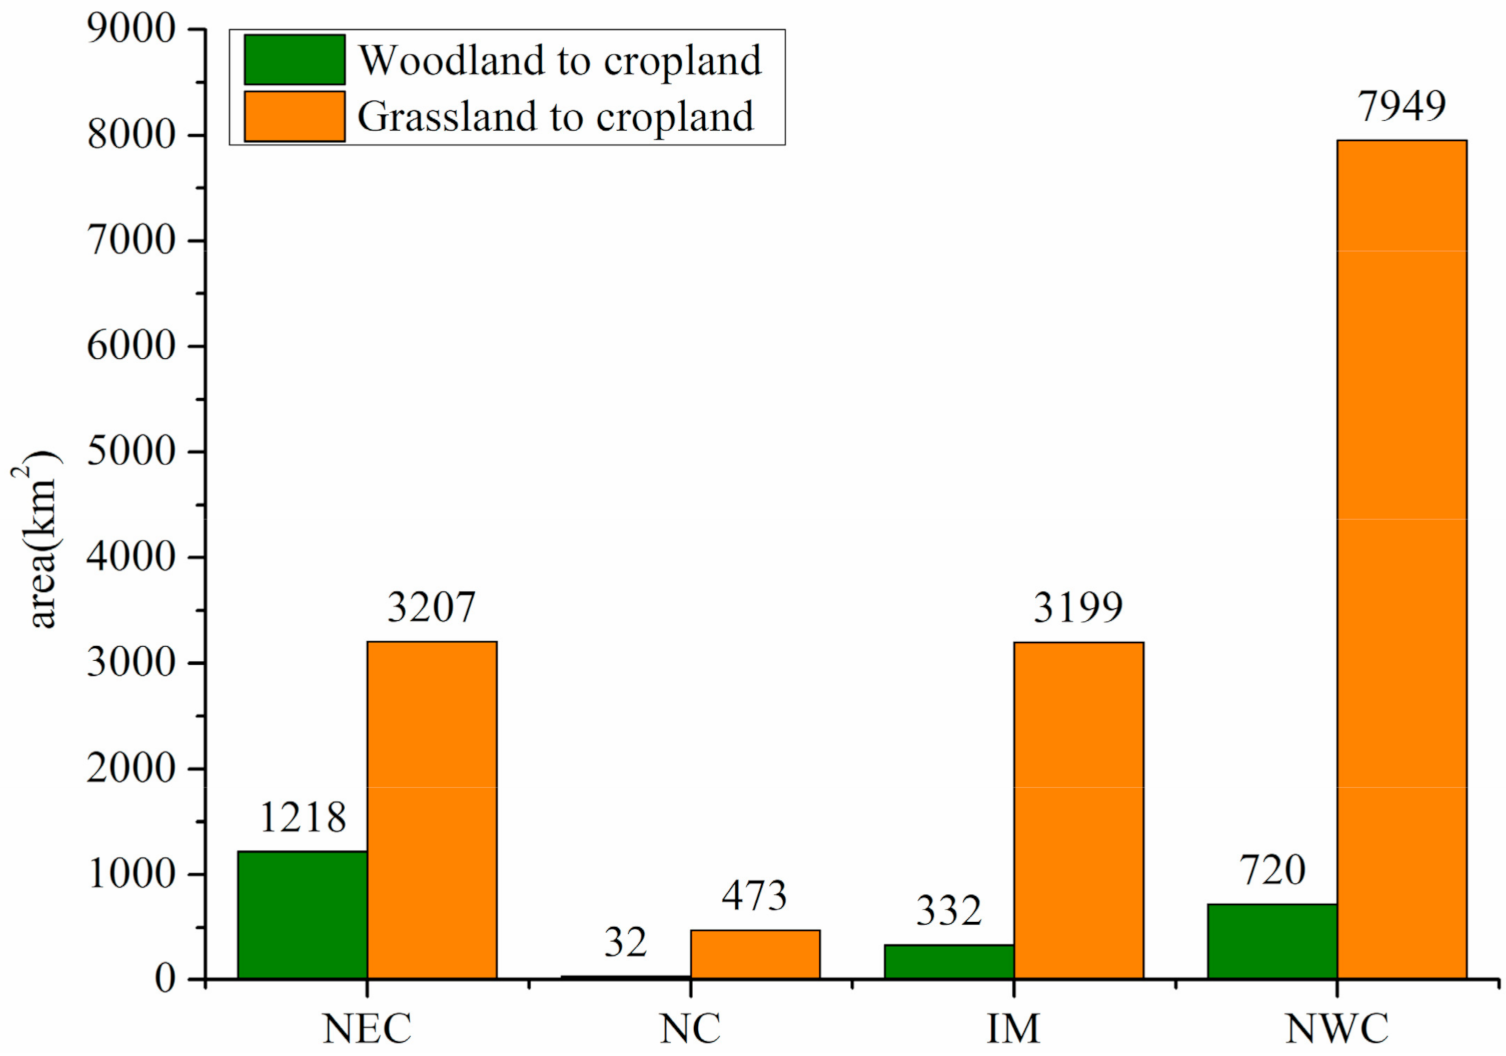
3.1. Spatial Pattern of Cropland Expansion

The total area of cropland expansion from grassland and woodland in northern China was 17,128 km2. The area of cropland expansion from grassland was 14,827 km2, which was more than half of the total cropland expansion area. The area of cropland expansion by deforestation was only 2301 km2. There were great differences in the area and type of cropland expansion in different zones (Figure 2 and Figure 3). Cropland expansion from woodland was mainly concentrated in humid NEC. Cropland expansion from grassland was mainly concentrated in arid NWC because of the development of oasis agriculture, and the area was 7949 km2, i.e., much more than the total area of cropland expansion from grassland in the other zones. The area of cropland expansion from grassland was almost the same between humid NEC and semiarid IM.

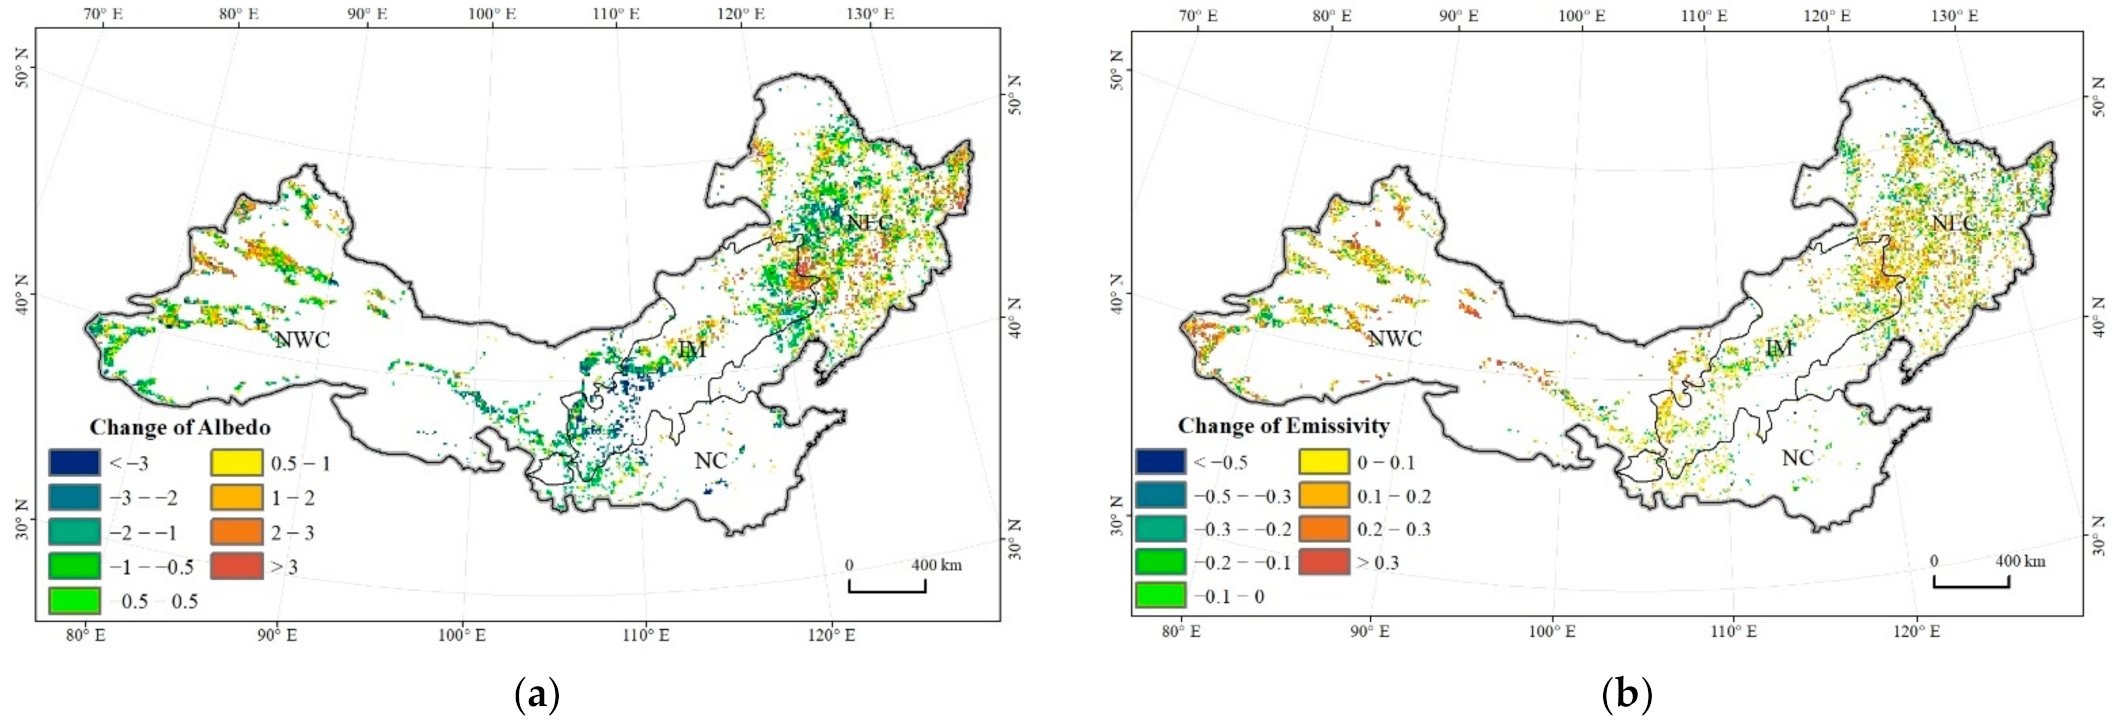
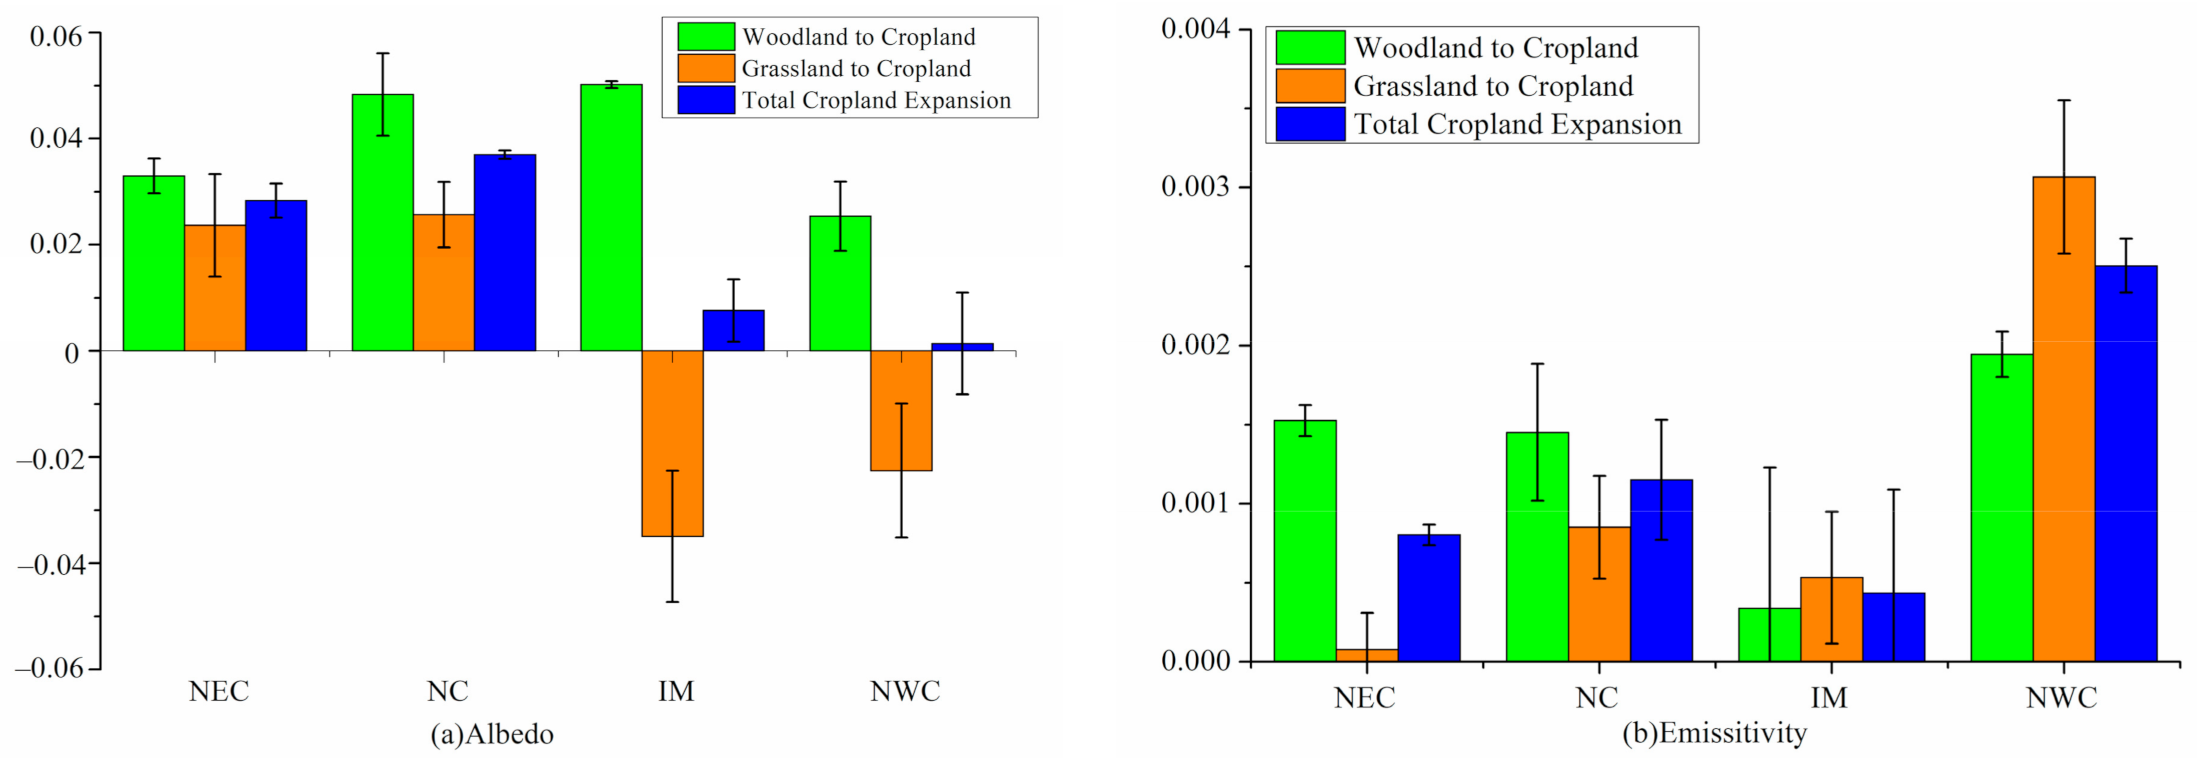
3.2. Effects of Cropland Expansion on Surface Parameters

Annual changes of albedo and emissivity in the cropland expansion regions from 2000 to 2015 are shown in Figure 4, respectively. The average albedo and emissivity of cropland, woodland, and grassland in different zones from 2000 to 2015 are shown in Figure 5. Land use change resulted in variable and significant changes of albedo, emissivity, and latent heat flux, as shown by the strong spatial heterogeneity characteristics. The changes of albedo and emissivity in the cropland expansion regions were not only due to the land use change but also other factors, which can have either direct or indirect effects, such as humidity and temperature.
The albedo of the three targeted land use classes in northern China was between 0.10 and 0.25. The highest albedo of cropland was in arid NWC, and it amounted to approximately 0.196, whereas the lowest was in humid NC, where it only amounted to approximately 0.159, respectively. The largest albedo of forest was 0.170 in arid NWC, whereas the smallest was only 0.111 in humid NC. The albedo of grassland was between 0.229 in semiarid IM and 0.134 in humid NC. The emissivity of the three targeted land use classes in northern China was between 0.967 and 0.973. The comparative values of emissivity of cropland and grassland were in the order of NEC > NC > IM > NWC. The emissivity values of cropland and grassland in arid NEC and humid NWC were the largest, and the values were approximately 0.9722 and 0.9721, respectively, whereas those of humid NWC were the smallest and the values were only approximately 0.970 and 0.967, respectively. The largest emissivity of woodland was detected in semiarid IM, and the value was approximately 0.971; the smallest emissivity of woodland was in arid NWC, and the value was only approximately 0.967. In other words, compared with the other zones, the albedo of the three land use classes in humid NC was always the smallest, and the smallest emissivity of the three land use classes was always in arid NWC. Because of the higher vegetation cover, the albedo in the humid regions was usually lower than the amid regions.
Albedo changes due to cropland expansion are shown in Figure 6a. In northern China, cropland expansion resulted in a general increase of albedo. Spatially, the increase of albedo was mainly distributed in the middle and east of NEC and the west of NWC. The increase varied between 0 and 0.04 in different zones. The largest increase was in humid NC, and the increase was approximately 0.037. Cropland expansion from different land use classes resulted in variable amounts of albedo increase. Cropland expansion from woodland increased the albedo in all of the zones; the albedo increase was between 0.02 and 0.04, with not much difference between the zones. However, the change of albedo due to cropland expansion from grassland was significantly different between the zones. Except for humid NC and humid NEC, albedo decreased in the other two zones. This was because cropland albedo was undoubtedly larger than woodland albedo, but the gap between cropland albedo and grassland albedo was small. In the humid regions, cropland albedo was larger than grassland albedo, and the opposite was true in the arid regions.
Emissivity changes due to cropland expansion are also shown in Figure 6b. In northern China, cropland expansion caused the emissivity to increase in general. Spatially, the increase of emissivity was mainly distributed in NEC and NWC. While the increase varied in different zones, it was between 0 and 0.003. Cropland expansion resulted in the largest increase in arid NWC, and the increase was approximately 0.0025. Cropland expansion from different land use classes also caused significant differences in the increase of emissivity. The increase in emissivity due to deforestation was between 0 and 0.0002. The largest increase in emissivity was in arid NWC, and the smallest was in the semiarid IM. Cropland expansion from grassland resulted in an increase of emissivity; the range of increase was between 0 and 0.0035. The arid NWC showed the largest increase in the emissivity, whereas the humid NEC had the smallest increase. This was because among the land use classes, the emissivity of cropland was generally much larger than that of forest and grassland.

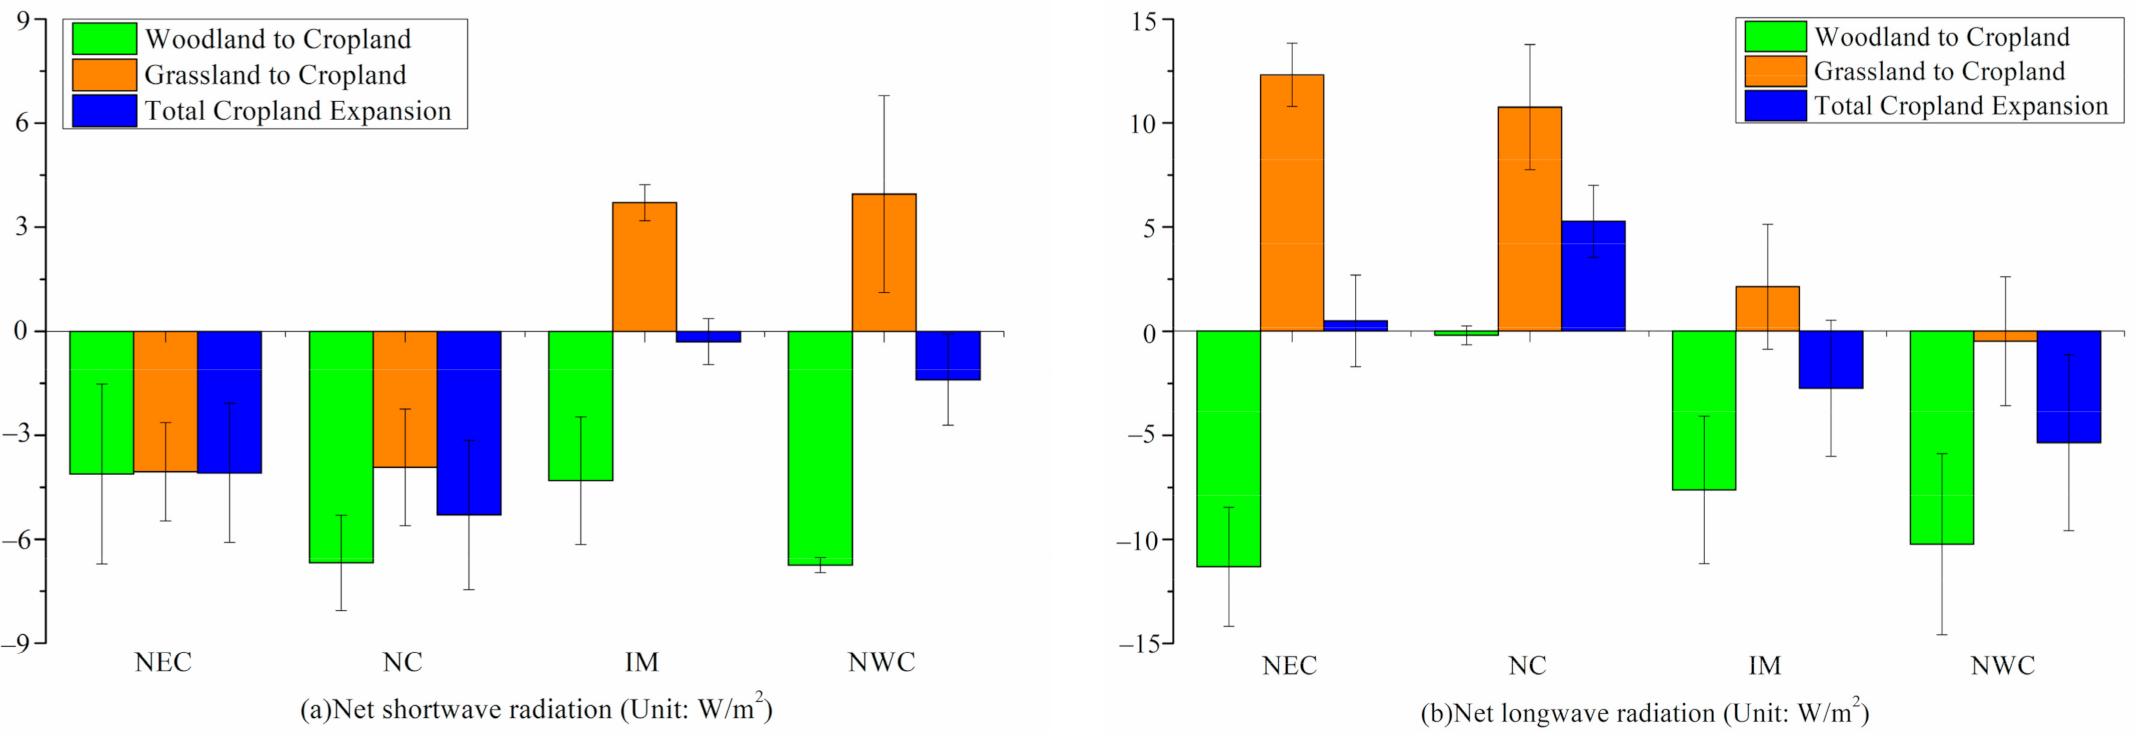
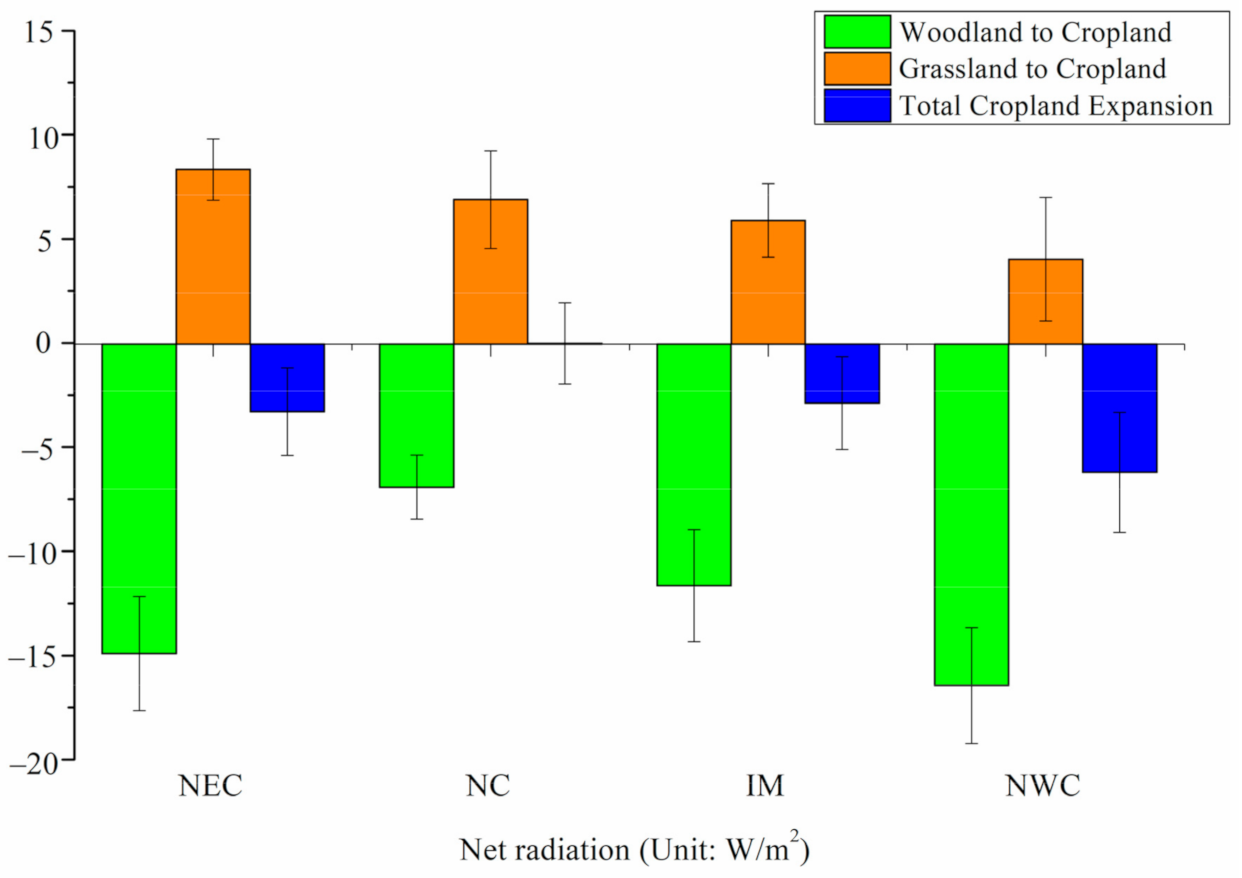
3.3. Impact of Cropland Expansion on Surface Radiative Forcing

Net shortwave radiation and longwave radiation changes caused by cropland expansion are shown in Figure 7. Net shortwave radiation due to cropland expansion declined, and the decrease was no more than 6 W/m2. The smallest decrease was in semiarid Inner Mongolia, whereas the largest was in humid NC. There were large differences in the change of net shortwave radiation among the different types of cropland expansion. Deforestation caused a net shortwave decrease in all of the zones. It was mainly because of the increase of albedo. However, cropland expansion from grassland caused different changes of net shortwave radiation among the zones. In the humid regions, the net shortwave radiation due to land use change from grassland to cropland decreased, whereas, in arid and semiarid regions, it increased. The net longwave radiation changes due to cropland expansion showed great differences among the zones. In humid regions, it increased, whereas, in the arid and semiarid regions, it decreased. The longwave radiation was affected by both the emissivity and land surface temperature. Cropland expansion from deforestation caused the net longwave radiation to decrease in all zones. The net longwave radiation change of cropland expansion from grassland was different among the zones. Except for the arid NWC, net longwave radiation increased in the other three zones.
The change of net radiation caused by cropland expansion is shown in Figure 8. Cropland expansion caused the net radiation to decrease in general over northern of China, and the decrease was no more than 7 W/m2. Cropland expansion due to deforestation resulted in a net radiation decrease, and the decrease was from 6 to 17 W/m2. This was mainly because deforestation caused both the net shortwave radiation and net longwave radiation to decrease. Unlike deforestation, cropland expansion from grassland caused a net radiation increase, and the range was from 4 to 9 W/m2. In humid regions, the increase of the net longwave radiation was much more than the decline of the net shortwave radiation. In the arid and semiarid regions, the decrease of the longwave radiation was much less than the increase of the net shortwave radiation. Therefore, both in the humid regions and arid and semiarid regions, the net radiation due to cropland expansion from grassland all increased. The decrease of net radiation due to deforestation was larger than the increase of net radiation due to cropland expansion from grassland; therefore, the net radiation due to cropland expansion decreased.

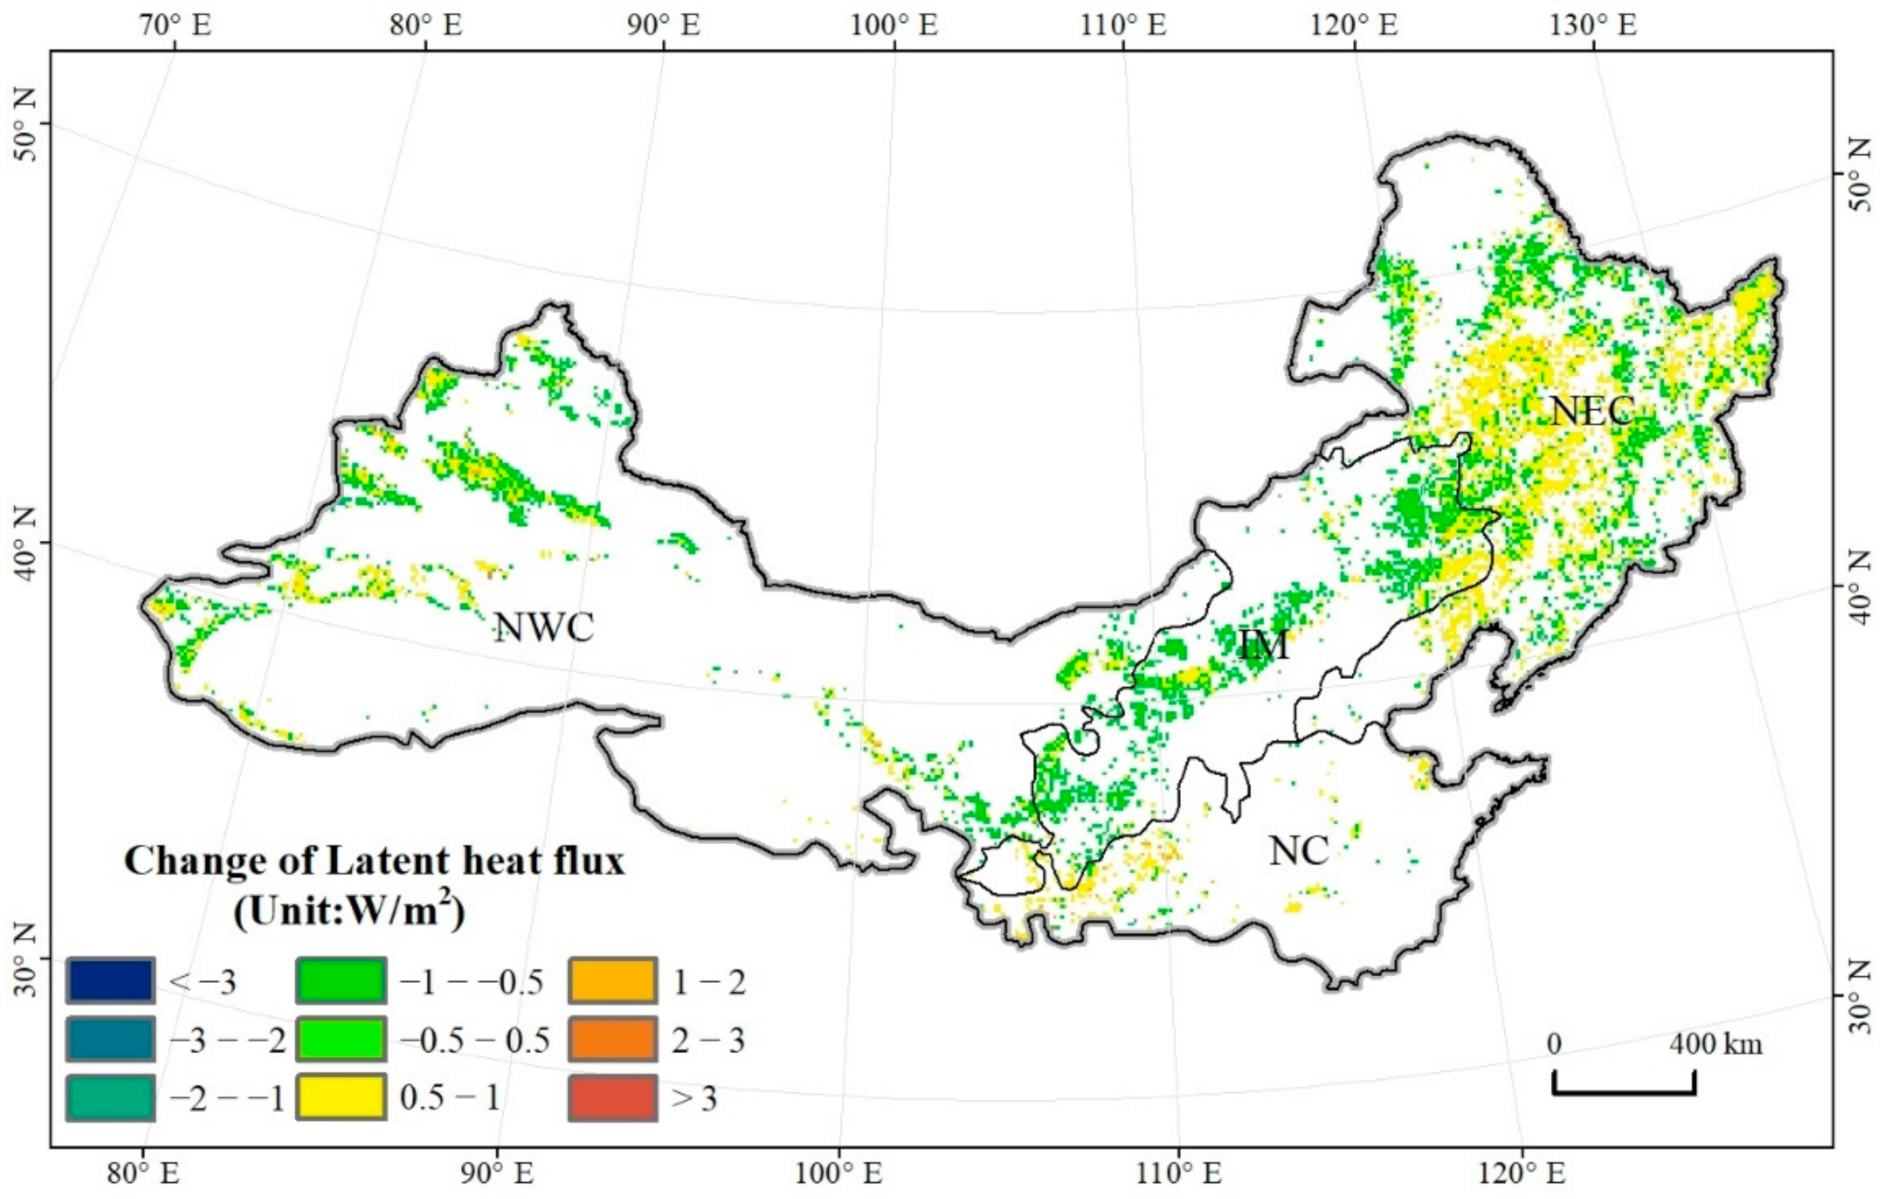
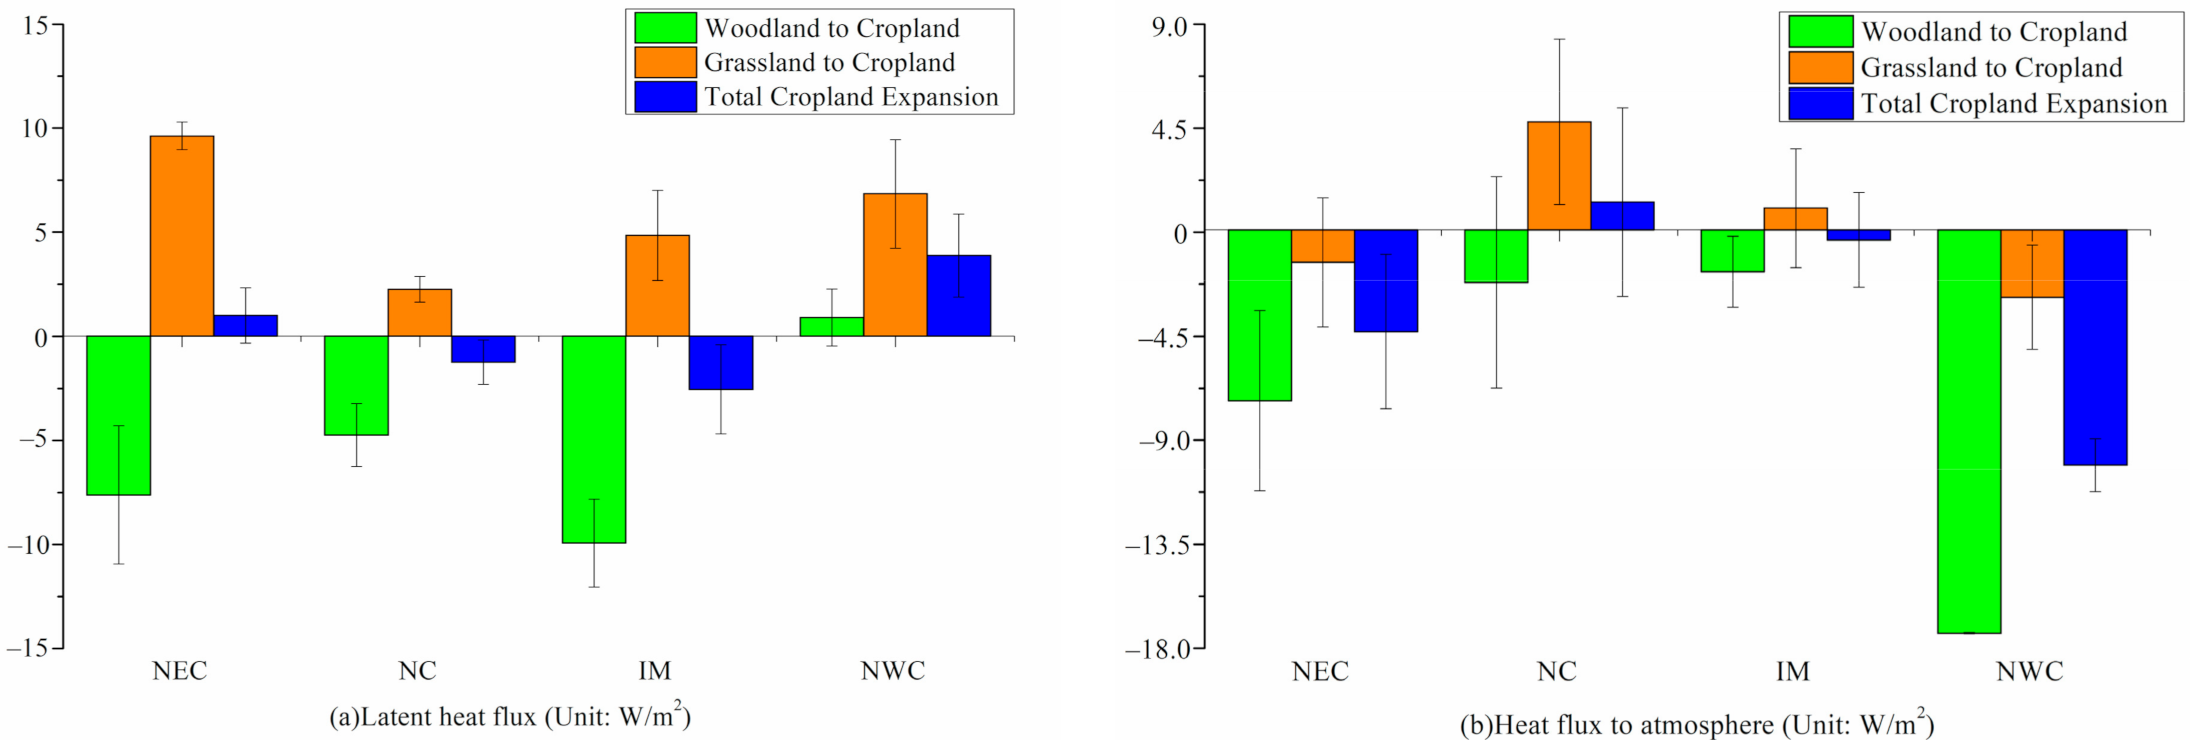
3.4. Effects of Cropland Expansion on Heat Flux from the Land Surface to the Atmosphere

Annual changes of latent heat flux in the cropland expansion regions from 2000 to 2015 are shown in Figure 9 and change of latent heat flux due to cropland expansion is shown in Figure 10. In arid Northwest China and humid Northeast China, the latent heat flux appeared to increase when cropland expansion happened, whereas, in humid North China and semiarid Inner Mongolia, it showed the opposite trend. Cropland expansion due to deforestation led to a decrease in latent heat flux in general in all zones, whereas cropland expansion from grassland resulted in an increase in latent heat flux. The range of increase due to cropland expansion from grassland was between 0 and 10 W/m2, and the decrease due to deforestation was no more than 10 W/m2. The gap between the latent heat flux changes of the different land use classes was the main reason for the variations of latent heat flux change due to cropland expansion.
Significant differences in the changes of heat flux to the atmosphere among the zones are shown in Figure 10. In humid Northeast China, semiarid Inner Mongolia, and arid Northwest China, the heat flux to the atmosphere decreased due to cropland expansion, and the range was between 0 and 10 W/m2. In contrast, in humid North China, the heat flux to the atmosphere increased. The largest decrease of heat flux to the atmosphere was in arid Northwest China, and it was more than 10 W/m2. Cropland expansion from deforestation resulted in a decrease in all of the zones, with the largest decrease in arid Northwest China, which was 17.35 W/m2. There were huge differences in the heat flux to the atmosphere due to cropland expansion from grassland. Heat flux to the atmosphere due to cropland expansion from grassland decreased in arid Northwest China and humid Northeast China, whereas in humid North China and semiarid Inner Mongolia, it showed an increase.

4. Discussion

4.1. Effect of Other Factors on Surface Radiative Energy Balance

Snow cover not only affects the seasonal radiative forcing variation but can also amplify the radiative forcing due to land cover changes, especially in mid- and high-latitude regions. However, we only considered snow-free conditions in this study. Snow has a significantly higher albedo value than other land cover classes [29]. Woodland has a significantly lower albedo value than cropland and grassland because of the difference in canopy structure. Deforestation typically increases albedo and reduces the radiation absorbed by the surface. However, when it snows in winter, tree branches and shadowing may hide the surface snow, but crops and grass may be entirely covered by snow. This phenomenon can increase the difference of albedo and produce a cooling effect [7,40,41]. Thus, we may have underestimated the radiative forcing due to land cover changes in northern China. Compared with the grassland and woodland, cropland absorbs less incoming shortwave radiation with higher albedo. It usually leads to cooling effects [38]. However, the cooling is offset by lower latent heat losses, which results in warming effects.
Farm management measures like irrigation, no-tillage systems, and crop rotation would produce different effects on the surface energy balance, thus resulting in different climatic effects. Additionally, crop phenology needs to be adequately represented within climate models to avoid underestimating the radiative forcing of cropland expansion [29]. Previous studies have focused on two different aspects, namely, simulating the effect of different cropland expansion methods on the land surface energy balance on a large scale with models and assessing the impact of different crop management measures on the local energy balance on a small regional scale. On a global scale, the simulation results of a global climate model have shown that the impact of irrigation on the global annual average temperature can be ignored, but the cooling effect is obvious in the regional climate [42]. There are many regional scale studies that also lead to the conclusion that irrigation has a cooling effect [43], and it reduces diurnal variations [44]. The cooling effect has significant seasonal variability, where the cooling is large during the dry season, but in the rainy season, it is not obvious [45,46].

4.2. Limitations and Prospects

The surface radiative energy balance changed where the land use changes accrued. The changes of surface radiative energy balance in the area with the land transition cannot be attributed to the driving of land use change, it is also impacted by other factors such as climate change and variability. The effects of land use change can not be distinguished by only estimating the change of surface radiation energy balance in the area of land use change. Thus, in our paper, we chose a space-for-time approach to estimate the effects of cropland expansion [2,47,48]. The impacts of cropland expansion on the biogeophysical parameters and surface radiative energy balance are the difference between the biogeophysical parameters and surface radiative energy for the “actual landscapes” and “potentially converted” landuse types, but not the change of those in the area where cropland expansion occurred. Although there are still some uncertainties in this method [2,47,48], the influence of other factors, such as climate change and variability, can be excluded to the greatest extent.
This paper was based on remote sensing data and it aimed to better describe the spatial difference in biophysical properties due to land cropland expansion at the regional scale instead of the larger global scale or the smaller local-scale. The results were also more realistic than the model simulations. However, the result still needs to be verified further by the field observation data. They can provide guidance on farm management measures related to climate change issues in large crop areas such as the North China Plain and the Northeast China Plain. For example, cropland expansion from grassland in North China causes the heat to the atmosphere to increase, which has a warming effect. From the aspect of climate change, it would not be a wise policy to promote cropland expansion from grassland in North China. However, only natural factors and parameters were considered in this study. Without consideration of the impacts of different tillage methods, the results of this study will remain relatively coarse. Therefore, future studies should attempt to provide deeper analyses by taking into account the farm management measures.
Changes in heat flux from the surface to the atmosphere due to cropland expansion had a significant spatial distribution pattern, but the values were not significantly correlated with the area of cropland expansion. Cropland expansion alters biophysical characteristics, including not only albedo, emissivity, and latent heat fluxes but also canopy conductance, soil moisture, surface roughness, leaf area, and rooting depth. All of those factors may have played a role in changing the heat flux to the atmosphere, and they deserve more consideration in future studies.
Due to the difference of spatial and temporal resolution of data sources, we analysised the surface radiative energy balance based on statistical results in coarse resolution, and there are some uncertainties. In addition, the background state may change due to the change of large-scale radiation forcing and climate feedback [46]. Limited by the availability of observation data, it can not be well verified at present. The change of radiative energy and heat fluxes on the unchanged land use types was influenced by both the natural and human factors. It is difficult to distinguish the factors between climate change and human factors. The crops in the new cropland and old permanent cropland are usually similar. Under human management, crop growth was slightly different due to the influence of soil fertility. The surface heat flux to the atmosphere at local scales may be with little difference between the new cropland and old permanent cropland. However, it may be significantly different at site scales. All the limitations deserve more consideration in future studies.

5. Conclusions

Heat flux to the atmosphere due to cropland expansion was quite different in different climatic zones of northern China. Except for humid North China, heat flux to the atmosphere due to cropland expansion decreased in humid Northeast China, semiarid Inner Mongolia area, and arid Northwest China. The decrease mainly occurred because the decrease of net radiation was larger than the increase of latent heat flux. However, in humid North China, net radiation decreased by such a small amount that it could be ignored, whereas the latent heat flux decreased by a much more significant amount. This led to an increase in the heat flux to the atmosphere. Cropland expansion from woodland led to a decline in heat flux to the atmosphere throughout northern China. The largest decline was in arid Northwest China, followed by humid Northeast China because the decrease of net radiation was always larger than the increase of latent heat flux when deforestation changed woodland to cropland. However, cropland expansion from grassland caused quite different changes of heat flux to the atmosphere in northern China. Heat flux to the atmosphere decreased in humid Northeast China and arid Northwest China, but it increased in humid North China and semiarid Inner Mongolia. Land use change from grassland to cropland led to the increase of both net radiation and latent heat flux, but to different extents. This led to differences in the heat flux to the atmosphere.

Funding

This research was funded by Projects of National Natural Science Foundation of China, grant number 41601475, the ‘Beautiful China’ Ecological Civilization Construction Science and Technology Project, grant number XDA23100203 and the National Key R&D Program of China, grant number 2017YFC0506501.

Institutional Review Board Statement

Not applicable.

Informed Consent Statement

Not applicable.

Data Availability Statement

The data presented in this study are available on request from the corresponding author.

Acknowledgments

For data calculation, we received guidance from Lin Huang and Jiyuan Liu, researcher at the Institute of Geographic Science and Natural Resources Research, CAS, Jun Zhai, researcher at the Environmental Satellite Center, Ministry of Environmental Protection, and Guosong Zhao, researcher at China University of Geosciences (Wuhan). We would like to express our heartfelt thanks to them.

Conflicts of Interest

The authors declare no conflict of interest.

References

  1. Song, X.-P.; Hansen, M.C.; Stehman, S.V.; Potapov, P.V.; Alexandra, T.; Vermote, E.F.; Townshend, J.R. Global land change from 1982 to 2016. Nature 2018, 560, 639–643. [Google Scholar] [CrossRef]
  2. Rigden, A.J.; Li, D. Attribution of surface temperature anomalies induced by land use and land cover changes. Geophys. Res. Lett. 2017, 44. [Google Scholar] [CrossRef]
  3. Pan, Y.D.; Birdsey, R.A.; Fang, J.Y.; Houghton, R.; Kauppi, P.E.; Kurz, W.A.; Phillips, O.L.; Shvidenko, A.; Lewis, S.L.; Canadell, J.G.; et al. A large and persistent carbon sink in the world’s forests. Science 2011, 333, 988–993. [Google Scholar] [CrossRef] [Green Version]
  4. Popkin, G. How much can forests fight climate change? Nature 2019, 565, 280–282. [Google Scholar] [CrossRef] [Green Version]
  5. Huang, L.; Zhai, J.; Ning, J. Impacts of returning farmland to forest on regional air temperature in different climatic zones. J. Nat. Resour. 2017, 32, 1832–1843. [Google Scholar]
  6. Rotenberg, E.; Yakir, D. Contribution of semi–arid forests to the climate system. Science 2010, 327, 451–454. [Google Scholar] [CrossRef] [PubMed]
  7. Lee, X.; Goulden, M.L.; Hollinger, D.Y.; Barr, A.; Black, T.A.; Bohrer, G.; Bracho, R.; Drake, B.; Goldstein, A.; Gu, L.H.; et al. Observed increase in local cooling effect of deforestation at higher latitudes. Nature 2011, 479, 384–387. [Google Scholar] [CrossRef] [PubMed]
  8. Huang, L.; Zhai, J.; Liu, J.; Sun, C. The moderating or amplifying biophysical effects of afforestation on CO2-induced cooling depend on the local background climate regimes in China. Agric. Meteorol. 2018, 260, 193–203. [Google Scholar] [CrossRef]
  9. Arora, V.K.; Montenegro, A. Small temperature benefits provided by realistic afforestation efforts. Nat. Geosci. 2011, 4, 514–518. [Google Scholar] [CrossRef]
  10. Bastin, J.F.; Finegold, Y.; Garcia, C.; Mollicone, D.; Rezende, M.; Routh, D.; Zohner, C.M.; Crowther, T.W. The global tree restoration potential. Science 2019, 365, 76–79. [Google Scholar] [CrossRef]
  11. Shindell, D.T.; Faluvegi, G.; Rotstayn, L.; Milly, G. Spatial patterns of radiative forcing and surface temperature response. J. Geophys. Res. Atmos. 2015, 120, 5385–5403. [Google Scholar] [CrossRef]
  12. Anderson–Teixeira, K.J.; Snyder, P.K.; DeLucia, E.H. Do biofuels life cycle analyses accurately quantify the climate impacts of biofuels–Related land use change? Univ. Ill. Law Rev. 2011, 10, 589–622. [Google Scholar]
  13. Solomon, S.D.; Qin, D.; Manning, M.; Chen, Z.; Miller, H.L. Climate Change 2007: The Physical Science Basis: Working Group I Contribution to the Fourth Assessment Report of the IPCC; Cambridge University Press: Cambridge, UK, 2007. [Google Scholar]
  14. Liu, C.; Allan, R.P.; Mayer, M.; Hyder, P.; Loeb, N.G.; Roberts, C.D.; Valdivieso, M.; Edwards, J.M.; Vidale, P.L. Evaluation of satellite and reanalysisbased global net surface energy fluxand uncertainty estimates. J. Geophys. Res. Atmos. 2017, 122, 6250–6272. [Google Scholar] [CrossRef] [PubMed]
  15. Davin, E.L.; de Noblet-Ducoudre, N. Climatic impact of global–Scale deforestation: Radiative versus non radiative processes. J. Clim. 2010, 23, 97–112. [Google Scholar] [CrossRef]
  16. Luyssaert, S.; Jammet, M.; Stoy, P.C.; Estel, S.; Pongratz, J.; Ceschia, E.; Churkina, G.; Don, A.; Erb, K.; Ferlicoq, M.; et al. Land management and land–cover change have impacts of similar magnitude on surface temperature. Nat. Clim. Chang. 2014, 4, 389–393. [Google Scholar] [CrossRef] [Green Version]
  17. McAlpine, C.A.; Syktus, J.; Deo, R.C.; Lawrence, P.J.; McGowan, H.A.; Watterson, I.G.; Phinn, S.R. Modeling the impact of historical land cover change on Australia’s regional climate. Geophys. Res. Lett. 2007, 34, 393–418. [Google Scholar] [CrossRef]
  18. Liu, F.S.; Tao, F.L.; Xiao, D.P.; Zhang, S.; Wang, M.; Zhang, H. Influence of land use change on surface energy balance and climate: Results from SiB2 model simulation. Prog. Geogr. 2014, 33, 815–824. [Google Scholar]
  19. Zhang, X.Z.; Wang, W.C.; Fang, X.Q.; Ye, Y.; Zheng, J.Y. Agriculture development-induced surface albedo changes and climate implications across northeastern China. Chin. Geogr. Sci. 2012, 22, 264–277. [Google Scholar] [CrossRef]
  20. Ge, Q.S.; Zheng, J.Y.; Zhang, X.Z.; He, F.N. Simulated effects of cropland expansion on summer climate in eastern China in the last three centuries. Adv. Meteorol. 2013, 63, 93–100. [Google Scholar] [CrossRef]
  21. Yu, L.X.; Zhang, S.W.; Tang, J.M.; Liu, T.X.; Bu, K.; Yan, F.Q.; Yang, C.B.; Yang, J.C. The effect of deforestation on the regional temperature in northeastern China. Appl. Clim. 2015, 120, 761–771. [Google Scholar] [CrossRef]
  22. Liang, S. Recent developments in estimating land surface biogeophysical variables from optical remote sensing. Prog. Phys. Geog. 2007, 31, 501–516. [Google Scholar] [CrossRef] [Green Version]
  23. White, J.C.; Wulder, M.A.; Hermosilla, T.; Coops, N.C. Satellite time series can guide forest restoration. Nature 2019, 569, 630. [Google Scholar] [CrossRef] [Green Version]
  24. Zhao, M.; Running, S.W. Drought-induced reduction in global terrestrial net primary production from 2000 through 2009. Science 2010, 329, 940–943. [Google Scholar] [CrossRef] [PubMed] [Green Version]
  25. Ren, M.E.; Bao, H.S. Physical geographical regionalization of China. In China Natural Geographic Atlas; Sino Maps Press: Beijing, China, 1998. [Google Scholar]
  26. Liu, J.Y.; Kuang, W.H.; Zhang, Z.X.; Xu, X.L.; Qin, Y.W.; Ning, J.; Zhou, W.C.; Zhang, S.W.; Li, R.D.; Yan, C.Z.; et al. Spatiotemporal characteristics, patterns, and causes of land–use changes in China since the late 1980s. J. Geogr. Sci. 2014, 24, 195–210. [Google Scholar] [CrossRef]
  27. Ning, J.; Liu, J.Y.; Kuang, W.H.; Xu, X.L.; Zhang, S.W.; Yan, C.Z.; Li, R.D.; Wu, S.X.; Hu, Y.F.; Du, G.M.; et al. Spatiotemporal patterns and characteristics of land-use change in China during 2010–2015. J. Geogr. Sci. 2018, 28, 547–562. [Google Scholar] [CrossRef] [Green Version]
  28. Sumner, D.M.; Wu, Q.L.; Pathak, C.S. Variability of albedo and utility of the MODIS albedo product in forested wetlands. Wetlands 2011, 31, 229–237. [Google Scholar] [CrossRef]
  29. Planque, C.; Carrer, D.; Roujean, J.L. Analysis of MODIS albedo changes over steady woody covers in France during the period of 2001–2013. Remote Sens. Environ. 2017, 191, 13–29. [Google Scholar] [CrossRef]
  30. Wan, Z.; Zhang, Y.; Zhang, Q. Quality assessment and validation of the MODIS global land surface temperature. Int. J. Remote Sens. 2004, 25, 261–274. [Google Scholar] [CrossRef]
  31. Mu, Q.Z.; Zhao, M.S.; Running, S.W. Improvements to a MODIS global terrestrial evapotranspiration algorithm. Remote Sens. Environ. 2011, 115, 1781–1800. [Google Scholar] [CrossRef]
  32. He, T.; Shao, Q.Q. Spatial-temporal variation of terrestrial evapotranspiration in China from 2001 to 2010 using MOD16 products. J. Geo–Inf. Sci. 2014, 16, 979–988. [Google Scholar]
  33. Hall, D.K.; Riggs, G.A. Accuracy assessment of the MODIS snow products. Hydrol. Process. 2007, 21, 1534–1547. [Google Scholar] [CrossRef]
  34. Pu, Z.X.; Xu, L.; Salomonson, V.V. MODIS/Terra observed seasonal variations of snow cover over the Tibetan Plateau. Geophys. Res. Lett. 2007, 34, 137–161. [Google Scholar] [CrossRef] [Green Version]
  35. Dee, D.P.; Uppala, S.M.; Simmons, A.J.; Berrisford, P.; Poli, P.; Kobayashi, S.; Andrae, U.; Balmaseda, M.A.; Balsamo, G.; Bauer, P.; et al. The ERA-Interim reanalysis: Configuration and performance of the data assimilation system. Q. J. R. Meteor. Soc. 2011, 137, 553–597. [Google Scholar] [CrossRef]
  36. Liang, S.L.; Shuey, C.J.; Russ, A.L. Narrowband to broadband conversions of land surface albedo: II. Validation. Remote Sens. Environ. 2003, 84, 25–41. [Google Scholar] [CrossRef]
  37. Román, M.O.; Schaaf, C.B.; Lewis, P. Assessing the coupling between surface albedo derived from MODIS and the fraction of diffuse skylight over spatially-characterized landscapes. Remote Sens. Environ. 2010, 114, 738–760. [Google Scholar] [CrossRef]
  38. Huang, L.; Zhai, J.; Sun, C.Y.; Liu, J.Y.; Ning, J.; Zhao, G.S. Biogeophysical forcing of land use changes on local temperatures across different climate regimes in china. J. Clim. 2018, 31, 7053–7068. [Google Scholar] [CrossRef]
  39. Thandlam, V.; Rahaman, H. Evaluation of surface shortwave and longwave downwelling radiations over the global tropical oceans. SN Appl. Sci. 2019, 1, 1171. [Google Scholar] [CrossRef] [Green Version]
  40. Flanner, M.G.; Shell, K.M.; Barlage, M.; Perovich, D.K.; Tschudi, M.A. Radiative forcing and albedo feedback from the Northern Hemisphere cryosphere between 1979 and 2008. Nat. Geosci. 2011, 4, 151–155. [Google Scholar] [CrossRef]
  41. Meister, W.N.; Gao, H.L. Assessing the impacts of vegetation heterogeneity on energy fluxes and snowmelt in boreal forests. J. Plant Ecol. 2011, 4, 37–47. [Google Scholar] [CrossRef]
  42. Diffenbaugh, N.S. Influence of modern land cover on the climate of the United States. Clim. Dynam. 2009, 33, 945–958. [Google Scholar] [CrossRef] [Green Version]
  43. Shi, W.J.; Tao, F.L.; Liu, J.Y. Regional temperature change over the Huang-Huai-Hai Plain: The roles of irrigation versus urbanization. Int. J. Climatol. 2014, 34, 1181–1195. [Google Scholar] [CrossRef]
  44. Doelman, J.C.; Stehfest, E.; Vuuren, D.P.V.; Tabeau, A.; Hof, A.F.; Braakhekke, M.C.; Gernaat, D.E.H.J.; Berg, M.; Zeist, W.J.; Daioglou, V.; et al. Afforestation for climate change mitigation: Potentials, risks and trade-offs. Glob. Chang. Biol. 2020, 26, 1576–1591. [Google Scholar] [CrossRef]
  45. Douglas, E.M.; Beltran-Przekurat, A.; Niyogi, D.; Pielke, R.A.; Vorosmarty, C.J. The impact of agricultural intensification and irrigation on land-atmosphere interactions and Indian monsoon precipitation—A mesoscale modeling perspective. Glob. Planet. Chang. 2009, 67, 117–128. [Google Scholar] [CrossRef]
  46. Mao, D.L.; Cai, F.Y.; Zhao, F.; Lei, J.Q.; Lai, F.B.; Xue, J. Spatial difference of microclimate in shelterbelts in newly reclaimed land in Jiya Township in Hotan, Xinjiang. Arid Zone Res. 2018, 35, 821–829. [Google Scholar]
  47. Lee, X. Forests and climate: A warming paradox. Science 2010, 328, 1479. [Google Scholar] [CrossRef] [PubMed]
  48. Swann, A.L.; Fung, I.Y.; Levis, S.; Bonan, G.B.; Doney, S.C. Changes in arctic vegetation amplify high-latitude warming through the greenhouse effect. Proc. Natl. Acad. Sci. USA 2010, 107, 1295–1300. [Google Scholar] [CrossRef] [PubMed] [Green Version]
Figure 1. Location of the study area in China.
Applsci 11 01556 g001
Figure 2. Distribution of cropland expansion areas in northern China from 2000 to 2015.
Applsci 11 01556 g002
Figure 3. Area of cropland expansion in different climate zones of northern China.
Applsci 11 01556 g003
Figure 4. Annual changes of albedo (a) and emissivity (b) in the cropland expansion regions during 2000–2015.
Applsci 11 01556 g004
Figure 5. Average albedo (a) and emissivity (b) of each land use class in different zones.
Applsci 11 01556 g005
Figure 6. Change of albedo (a) and emissivity (b) due to cropland expansion in different zones.
Applsci 11 01556 g006
Figure 7. Changes of net shortwave radiation (a) and net longwave radiation (b) in different climate zones.
Applsci 11 01556 g007
Figure 8. Change of net radiation due to cropland expansion in different zones.
Applsci 11 01556 g008
Figure 9. Annuals changes of latent heat flux in the cropland expansion regions during 2000–2015.
Applsci 11 01556 g009
Figure 10. Changes of latent heat flux (a) and heat flux to the atmosphere (b) due to cropland expansion in different zones.
Applsci 11 01556 g010
Table 1. Main climatic indicators of the major zones in northern China.
Zone Name≥10 °C Accumulated Temperature (°C)Drought IndexFrost-Free Season (Day)
NEC1400–32000.5–1.2<145
IM2000–30001.2–4.0<180
NWC3200–4500>4.0<200
NC3200–45000.5–1.5150–200 1
1 Data from [25].
Table 2. Accuracy range and resolution of the main dataset.
DataData SourceMAE 1Spatial ResolutionTemporal Resolution
Land useLand-use database from CAS≥90% 21 km-
AlbedoMCD43B3−0.0081 km8 d
EmissivityMOD11A20.001–0.0051 km8 d
LSTMOD11A2≤1 °C1 km8 d
Latent heat fluxMOD16A20.31 to 0.33 mm.d−11 km8 d
SnowMOD10A2≥93% 3500 m8 d
Radiation dataERA-Interim-0.75°Monthly
1 MAE here means ‘mean absolute error’. 2 Data here means the accuracy of land use data. 3 Data here means the accuracy of snow cover data.
Publisher’s Note: MDPI stays neutral with regard to jurisdictional claims in published maps and institutional affiliations.

