Article

Proposal of a Monitoring System for Collaborative Robots to Predict Outages and to Assess Reliability Factors Exploiting Machine Learning

by
Khurshid Aliev
and
Dario Antonelli
*,†
Department of Management and Production Engineering, Polytechnic University of Turin, Corso Duca degli Abruzzi 24, 10138 Torino, Italy
*
Author to whom correspondence should be addressed.
These authors contributed equally to this work.
Appl. Sci. 2021, 11(4), 1621; https://doi.org/10.3390/app11041621
Submission received: 11 January 2021 / Revised: 29 January 2021 / Accepted: 4 February 2021 / Published: 10 February 2021
(This article belongs to the Special Issue Systems Engineering: Availability and Reliability)

Abstract

:
Industry standards pertaining to Human-Robot Collaboration (HRC) impose strict safety requirements to protect human operators from danger. When a robot is equipped with dangerous tools, moves at a high speed or carries heavy loads, the current safety legislation requires the continuous on-line monitoring of the robot’s speed and a suitable separation distance from human workers. The present paper proposes to make a virtue out of necessity by extending the scope of on-line monitoring to predicting failures and safe stops. This has been done by implementing a platform, based on open access tools and technologies, to monitor the parameters of a robot during the execution of collaborative tasks. An automatic machine learning (ML) tool on the edge of the network can help to perform the on-line predictions of possible outages of collaborative robots, especially as a consequence of human-robot interactions. By exploiting the on-line monitoring system, it is possible to increase the reliability of collaborative work, by eliminating any unplanned downtimes during execution of the tasks, by maximising trust in safe interactions and by increasing the robot’s lifetime. The proposed framework demonstrates a data management technique in industrial robots considered as a physical cyber-system. Using an assembly case study, the parameters of a robot have been collected and fed to an automatic ML model in order to identify the most significant reliability factors and to predict the necessity of safe stops of the robot. Moreover, the data acquired from the case study have been used to monitor the manipulator’ joints; to predict cobot autonomy and to provide predictive maintenance notifications and alerts to the end-users and vendors.

1. Introduction

Revolution of Industry 4.0 (I4.0) introduces new tools and technologies that can be integrated with the ones that are already exploited by factories. Several of them have already been deployed in different manufacturing sectors to improve productivity and to satisfy the expectations of consumers expectations for customisation. One such I4.0 enabling technology is the collaborative robot (cobot) which is widely deployed in industry [1,2]. A cobot allows the skills of a robot, such as precision and strength, to be combined with human dexterity and problem solving abilities [3] on a human-robot collaborative (HRC) workstation. Cobots are designed to interact with humans directly and physically within a shared workspace [4]. HRC applications that are designed on the basis of reliability and safety standards increase human trust in collaboration and improve the quality and working conditions of employees. In HRC, humans and robots share the same workspace. Cobots are specifically made to halt before any involuntary contact may harm the human coworker can cause harm. However, frequent halts induce accelerated wear and tear of the robot and increase the probability of mechanical failures. Furthermore, cobots should be light weight in order to minimise their inertia and allow them to stop suddenly. Therefore, joints have lower strength compared to standard industrial robots. Accordingly, scheduled maintenance is no longer an appropriate strategy as it cannot account for the number and severity of the forced halts of a robot. Continuous monitoring of the state of health of such robots would be preferable. During monitoring, the system generates useful knowledge and information, such as data about the robot’s sensors and event logs, which are stored in historic logging databases and can be recalled to perform analytics. The smart data analytics of collected data, using machine learning techniques, offers an opportunity to monitor the health condition of industrial robots, to predict the mobile autonomy and to perform predictive maintenance, if necessary. The Internet of Things (IoT) is another emerging tool that is used for I4.0: connected devices with embedded systems that are able to interact and communicate with each other or with centralised devices. The integration of the IoT in a decision making system could improve the performance of the human-robot interaction. This is the reason why the industrial internet of things (IIoT) extension refers to its industrial application, that is to interconnect industrial machines and devices, robots, sensors and instruments that are centralised to collect, exchange and analyze data. The IIoT offers the possibility of achieving the complete design of physical cyber-systems through the integration of data processing technologies, intelligent software and sensors. On-line monitoring systems, and predictive maintenance models can be built on the basis of a large set of historical data. Several steps are involved in such a process: preprocessing of the collected data; extracting features from sensor data or feeding sensor data directly to machine learning models; training the predictive models; generating decision support models that will be able to evaluate a new data sent to the system; deploying developed models and integrating them with the system. The on-line visualisation of the health status of a robot and alerts about predicted failures will improve the human robot interaction. However, the applications of such models can go far beyond HRC. The concepts of machine learning (ML) tools used for predictive maintenance applications utilizing data available data on the internet have been discussed in recent studies, such as in [5], and a condition-based monitoring system, using ML tools, has been successfully deployed for a smart railway applications [6].
Hence, this paper has focused on developing a framework using I4.0 enabling technologies to improve reliability and safety in HRC applications. The proposed framework allows a cobot’s condition to be monitored continuously during HRC. The monitoring deploys IoT connectivity, a data acquisition system, physical cyber-systems and ML tools to perform analytics. The paper is divided as follows: the relevant equipment parametersare first identified, and a description of the data acquisition framework is then given, an application to an assembly case study in which all the necessary data are collected is presented, and finally the analysis results of the considered case study are presented and discussed.

2. Research Hypothesis

In order to determine the relevant parameters that have to be monitored, it is worth analysing the most common industrial cobot applications at present in use. TTraditional robotic applications in fact exclude the access of humans to the work area and therefore limit the range of applications to production processes [7]. On the other hand, as cobots are designed to work with humans in the same shared workspace, several new applications are emerging [8].
The general requirements for collaborative robot system applications, based on ISO 10218-1:2011 [9] and ISO 10218-2:2011 [10] are described in ISO 15066:2016 Robots and robotic devices—Collaborative robots [11].
According to the ISO technical specifications, reliable safety, control and monitoring is whenever HRC processes involve heavy loads, high speeds, forces or temperatures, in a hazardous environment.
The different papers published over the last decade related to human-robot applications in the assembly, handling and welding domains as taken from the Scopus database, are listed in Figure 1. Following keywords are utilized: human robot together with collaboration assembly, welding and/or handling on the search engine of the Scopus database [12].
Despite not claiming to be exhaustive, the chart clearly shows that most HRC applications are deployed in assembly fields [13]. Handling and process production is the second most important field that deploys collaborative robots, followed at a distance by welding. Welding applications are more complex, as they require more physical parameters in order to be precise, accurate and monitored. Table 1 offers an overview of the more studied industrial applications of cobots.
The table also shows issues that could occur in HRC applications and identifies important measuring parameters to build more reliable collaborative applications.

2.1. HRC Assembly

Human robot collaborative assembly is the action of joining two or more components together. Numerous HRC applications are already present in industry, and new solutions are continuously being proposed. Some HRC applications, with parameters being measured during collaboration in different fields, are reported in Table 1. The table also highlights the corresponding parameters necessary to monitor certain tasks. In HRC assembly, a cobot and a human can help each other during the execution of tasks. The monitoring of the physical, state, and process parameters of a cobot plays an important role in obtaining safer and more reliable collaboration. The authors of research papers [14,15] discussed the implementation of HRC assembly in manufacturing, and proposed industriallike solutions. The importance of such parameters and variables as the load, end-effector force/torque, payload, robot and temperature of the robot and joints and robot speed were identified and classified in these researches according to the tasks of the cobots in the HRC assembly. The measurment of the performance, monitoring and prediction of the above mentioned parameters are employed in the computation of the key performance indicators (KPI)s of cobots [16,17,18].

2.2. HRC Handling

Handling is another widely used process in industry, for example in food manufacturing and logistics material handling. Handling involves different processes, such as grasping, packaging, glueing, palletising, surface polishing, and so forth. Cobots are used in collaborative handling applications are used for such processes as picking and placing, product testing, assembly, loading/unloading, injection and moulding as supportive devices to increase the safety of human operators and to reduce repetitive strain and accidental injuries. For example, the integration of cobots in a plastic polymer production line that produces noxious gases protects the employees in the production line from toxic gases and sharp profiles. In such processes, the physical parameters of the cobots such as the accuracy of the end-effector and the temperature ranges of the robot are monitored to provide safer collaboration [19,20].

2.3. HRC Welding

Welding is another widely used process in industry. In this direction, walk through programming has been proposed [21] for welding robots. Vision system interaction [22] in welding and augmented reality-based approaches have also been proposed [23]. Most of the proposed approaches implement cobots as assistant devices. As a result of the complexity and uncertainty of the welding process, effective practical applications, using collaborative robots, are still limited. Welding robots are currently programmed by means of lead-through or offline. Intelligent technologies, such as vision sensing, automatic programming, guiding and tracking, and real-time monitoring of the welding process, were adopted in [24] to cope with geometrical uncertainties in the weld trajectory. Thus, as shown in Table 1 such parameters as end-effector force, payload, robot temperature, joint speed, joint orientation and position are significant for the success of the welding operation and are likely to be monitored.

3. Methods

The proposed on-line monitoring system tracks the physical conditions of the cobot while performing HRC processes. The framework of the online monitoring system is outlined in Figure 2. Basically, the system is composed of several integrated parts: collaborative robot, that communicates with gateway using real time data exchange (RTDE) and MODBUS protocols; data acquisition, which is the gateway to cloud communication; database server, which stores the data necessary for prediction purposes and to feed the on-line monitoring dashboard; data preprocessing which extracts meaningful features from the dataset and transfers them to the ML models; machine learning models, which are exploited to predict the future behaviour of any parts subject to failure; application layer, which is deployed to allow the interactions with human operators under safe conditions. Overall, the monitoring system alerts a human operator whenever a cobot displays improper or erratic behaviour. The operator can access the dashboard remotely. For example, if the temperature of one of the joints is higher than expected, the operator can access the dashboard of the cobot to find out which working situation has led to the anomaly. Moreover, a cobot system can be integrated with additional sensors to detect gas or ambient pollution and then inform the human operator about the hazard. The present paper focuses on the integration of data acquisition and machine learning in a cobot monitoring system; networking communication and the application layer with management indicators have already been discussed in [18,31,32].

3.1. Data Acquisition

The development of a data acquisition system for robots is an important part of a monitoring system. Data collection and data storage offer the possibility of executing deeper analyses about the connected devices and of assessing the status of the connected devices. The data collected from robots can be either physical data or event data. The former parameters that are measured by installed sensors, such as temperature, speed, vibrations, force, voltage, and current. Event data refer to the working status of a robot, and to hardware or software failures, breakdowns and so forth.
The architecture of the here presented system is composed of a collaborative robotic manipulator (Universal Robots UR3), provided with a wireless TCP/IP connection to a gateway, in order to access an Internet network over a range of around 100 m. The communication with a robotic manipulator and gateway is established using RTDE that uses TCP/IP communication on the port 30004 and robot generates output messages on 125 Hz and Modbus TCP protocols in port 502. In the system, The RTDE protocol acquires UR3 status data such as POWER OFF/ON, Emergency Stop, Protective Stop, status of programme, that is, running, paused or stopped, and other parameters necessary for monitoring [33]. In Modbus communication, the robot controller acts as a server (Slave), gateway is client (Master) that can establish connections to the robot and send standard Modbus requests to it. The server is available at the IP address of the robot controller [34]. The robot Modbus communication interface can be used to communicate to other robots, programmable logic controller (PLC)’s, Human-Machine Interface (HMI)’s or inputs and outputs (IO) devices (when the IO device is functioning as a Modbus server). In our system, the client sends a request to read specific registers that are available in the internal memory of the robot, and the robot responds by providing the requested value. The general purpose 16-bit registers present in the robot controller can contain certain discrete variables such as the tool state, tool centre point (TCP) state, joint angle, joint velocity, current, voltage, joint temperature. The system supports the Message Queuing Telemetry Transport (MQTT) protocol. MQTT is Publish/Subscribe Model which consists of three main components: publishers, subscribers, and a broker. Publishers are the lightweight sensors and devices that connect to the broker to send their data and go back to sleep whenever possible. Subscribers are applications or devices that are interested in a certain topic, or sensory data, so they connect to brokers to be informed whenever new data is received. The brokers classify sensory data in topics and send them to subscribers interested in those topics only. A device can behave as a publisher and a subscriber at the same time by publishing to specific topics and subscribing to others, the term MQTT client is used to distinguish publishers/subscribers from brokers. Node-Red is a flow based open source programming tool built upon Node.js that is used to connect hardware devices, API’s and other online services belonging to the realm of Internet of Things (IoT). Node-Red provides a browser-based flow editor which can be used to create JavaScript functions in the form of interconnected blocks that together construct a flow. One of the biggest advantages of Node-Red is its ability to run at the edge of the network in the cloud and locally on a standard personal computer (PC). In the proposed framework Node-Red is ran on the standard PC and the editor is accessible via any web browser on the local network. The Node-Red dashboard is an add on module of Node-Red that is used to create and present on-line data graphical user interface(UI) on a web browser. The dashboard package allows the addition of many UI components such as buttons, sliders, leds and gauges. After representing all communication tools and protocols, data acquisition and transmission occur as follows: the robotic arm is connected to the PC(gateway) with RTDE and MODBUS protocols over Wi-Fi. On the PC, there are Node-Red nodes that read and transmit all necessary data to the server using MQTT broker. On the same PC, the Node-Red Dashboard Nodes offers the data in a graphical user interface accessible through a web browser in a real-time manner. Node-red dashboard allows the data to be presented in various forms such as charts, text fields and gauges, commands are also triggered from the GUI using sliders, switches, text fields and buttons. Additional details about communication protocols and KPI computations of the cobot on the dashboard are given in the aforementioned papers [18,31].

3.2. Data Preprocessing

The preprocessing of data helps enhanc the quality of the data and to extract meaningful insights. The data acquired from machines are normally fuzzy, biased and noisy. The preprocessing of raw data can improve the efficiency and accuracy of the ML workflows. This is why data cleaning, data integration, and feature transformation and selection are required before data can be used.
Data cleaning involves such operations as improving bad data, reducing the unnecessary elements of data, and filtering out some incorrect data that do not belong to the data set. The authors of [35] proposed different techniques such as the classic maximum likelihood procedures, like Expectation-Maximization or Multiple-Imputation for the treatment of missing and noisy data. Other authors proposed advanced ensemble missing data techniques (MDTs) [36] to improve prediction model and authors of [37] evaluate four MDTs techniques: listwise deletion (LD), mean imputation (MI), similar response pattern imputation (SRPI) and full information maximum likelihood (FMIL). The majority of authors agree to suggest using FMIL if there is enough data to afford; MI and SRPI when there is a scarcity of data. Not to use LD if data is suspect missing completely at random (MCAR).
Feature scaling which is also known as data standardisation, is another pre-processing step. It refers to the standardisation of the range of features in a data set, which means adjusting the values of numerical columns measured on different scales to a formal common scale, without changing the ranges of the values or losing information. Data normalisation means re-scaling the dimensions of data and avoiding over-weighting values. It helps to improve the overall quality of a data set [38]. Scaling intervals of [0, 1] and [−1, 1] are normally used, as shown in Equations (1) and (2)
[ 0 , 1 ] i n t e r v a l = a c t u a l V a l u e m i n ( a l l V a l u e s ) m a x ( a l l V a l u e s ) m i n ( a l l v a l u e s ) ) )
[ 1 , 1 ] i n t e r v a l = a c t u a l V a l u e ( m a x ( a l l V a l u e s ) + m i n ( a l l V a l u e s ) ) / 2 ( m a x ( a l l V a l u e s ) m i n ( a l l v a l u e s ) ) / 2 .
Feature selection considers data composed of irrelevant and/or redundant features that could influence the performance of the trading activity to a great extent. Different feature selection such as multicollinearity, correlation coefficients and Variance Inflation Factors (VIF) are proposed by authors [39,40] to improve performance of the ML model outputs. According to the authors [39] the most commonly used techniques for numerical input and output models are correlation coefficients, such as Pearson’s for a linear correlation, or rank-based methods for a nonlinear correlation. For data with numerical input and categorical output, the most common used techniques are correlation based multicollinearity coefficients and ANOVA correlation coefficients. The techniques adopted in the present framework are correlation coefficients if data coming from robot and predicting variables is numerical.To predict categorical variables of the robot multicollinearity feature selection technique is used. Data variables-collected from a cobot during human-robot collaborative applications have been evaluated using a correlation matrix and the simplest way to detect collinearity is to look at the correlation matrix of the predictors. An element of this matrix that is large in absolute value indicates a pair of highly correlated variables, and therefore a collinearity problem in the data.
Data transformation is the process where format is conveniently converted from numerical to categorical and redundant data are removed [41]. The above mentioned data pre-processing techniques have been implemented in this study to extract significant features from a cobot dataset. The collected features and variables have then been passed onto the next steps of the framework.
Correlation analyses of cobot variables during HRC.
In order to evaluate the significance relation between predictors Xp and response Y, correlation analysis was performed. Correlation analyses provide an idea of the linearity between paired variables. The correlation coefficients between two random variables, are calculated for all the model variables as a parameter of the linear dependence [42]. The sample estimate of the correlation coefficient r x y is computed for two variables, X and Y, dataset as:
r X Y = c o v ( X Y ) σ X σ Y .
In Equation (3), σ X and σ Y represent the standard deviations of X and Y.
The correlation coefficients in the correlation matrix are then presented with values in the [−1, 1] interval that have the following meanings:
r = 0 ,   means   that   there   is   no   linear   relationship   ( X   and   Y   are   linearly   uncorrelated ) ; 1 ,   indicates   a   perfect   positive   linear   relationship   with   X   and   Y   varying   in   the   same   direction ; 1 ,   indicates   a   perfect   negative   linear   relationship , with X   and   Y   varying   in   the   opposite   direction ;
The correlation coefficients can be symmetrically arranged into a correlation matrix, where each element of each column and each row variable correspond to the correlation coefficients.

3.3. Machine Learning Models

This section describes the utilisation of ML tools to monitor the condition of a cobot. A correlation analysis was first used to identify which variables are significant. The most closely correlated variables of the collaborative robot were then fed to an ML tool to perform predictive analyses.

3.3.1. Regression Model Used to Predict the Quantitative Parameters

A Multiple Linear Regression(MLR) model was used to predict quantitative parameters. An MLR model predicts the linear relationship between a dependent variable and other variables. A multiple linear regression model with p predictor variables x1, x2, …, xp and response Y, can be formulated as
Y = β 0 + β 1 x 1 + β 2 x 2 +   β p x p + ϵ ,
where β 0 , β 1 , , β p are known as model coefficients or parameters and ϵ is a noise term which is a random error. Training data can be used to estimate β ^ 0 , β ^ 1 , , β ^ p , and the coefficients being known, predictions can be made using the following equation:
y ^ = β ^ 0 + β ^ 1 x 1 + β ^ 2 x 2 + + β ^ p x p ,
where y ^ represents a prediction of Y on the basis of X = x . In the previous equation, the hat ^ symbol refers to the estimated coefficients or predicted response. Values of β must be estimated. The least square approach is used in this model to minimise the following equation:
R S S = i = 1 n ( Y i y ^ i ) 2 = i = 1 n ( Y i β ^ 0 β ^ 1 x i 1 β ^ 2 x i 2 . . . β ^ p x i p ) 2 .
The following metrics have been selected from Table 2 to evaluate regression model:

3.3.2. Automatic Classification Model to Predict Qualitative Parameters

The Automatic machine learning(AutoML) system was adopted to find the best ML model for our framework. H2O AutoML is an open source, user-friendly machine learning software that was designed not only for advanced machine learning users, but also for non experts. Recent studies show that H2O AutoML [43] performs better than other competitor tools. The authors of [44,45] assessed the robustness and efficiency of AutoML, with respect to other automatic models such as TPOT [46] and AutoKeras [47]. These authors used dirty, clean and noisy data sets to evaluate the robustness of the tool. Other studies, [48,49] have shown the effectiveness of the AutoML system, with respect to other tools, like auto-sklearn [50] and Auto-WEKA [51] using open source datasets. AutoML relies on the efficient training of H2O machine learning algorithms to produce a large number of models in a short time. H2O AutoML supports the supervised training of regression, binary classification and multi-class classification models on tabular datasets. H2O AutoML is available in Python, R, Java and Scala as well as through a web GUI.
The base models of H2O are Generalized Linear Models (GLM), Distributed Random Forests (DRF), XGBoost, Gradient Boosting Machines (GBM), and Deep Learning (NN). The used hyperparameters are chosen from a predefined search space using a grid search. H2O chooses one of the three different options. It may use just one of the base models or their hyperparameter-optimised versions. It can also choose a Best Of Family Stacked Ensemble model, which includes one model from each category and the last available option is the All Models Stacked Ensemble pipeline. After training one of the above mentioned models, AutoML uses a test dataset to evaluate the accuracy and quality of the new model, and provides a number of evaluation metrics that indicate how good the model performs on the test dataset. The following metrics were selected to evaluate the regression model:
The evaluation metrics used for the classification model are shown in the Table 3.

3.4. Description of the Case Study: Monitoring Cobot Arm Joints

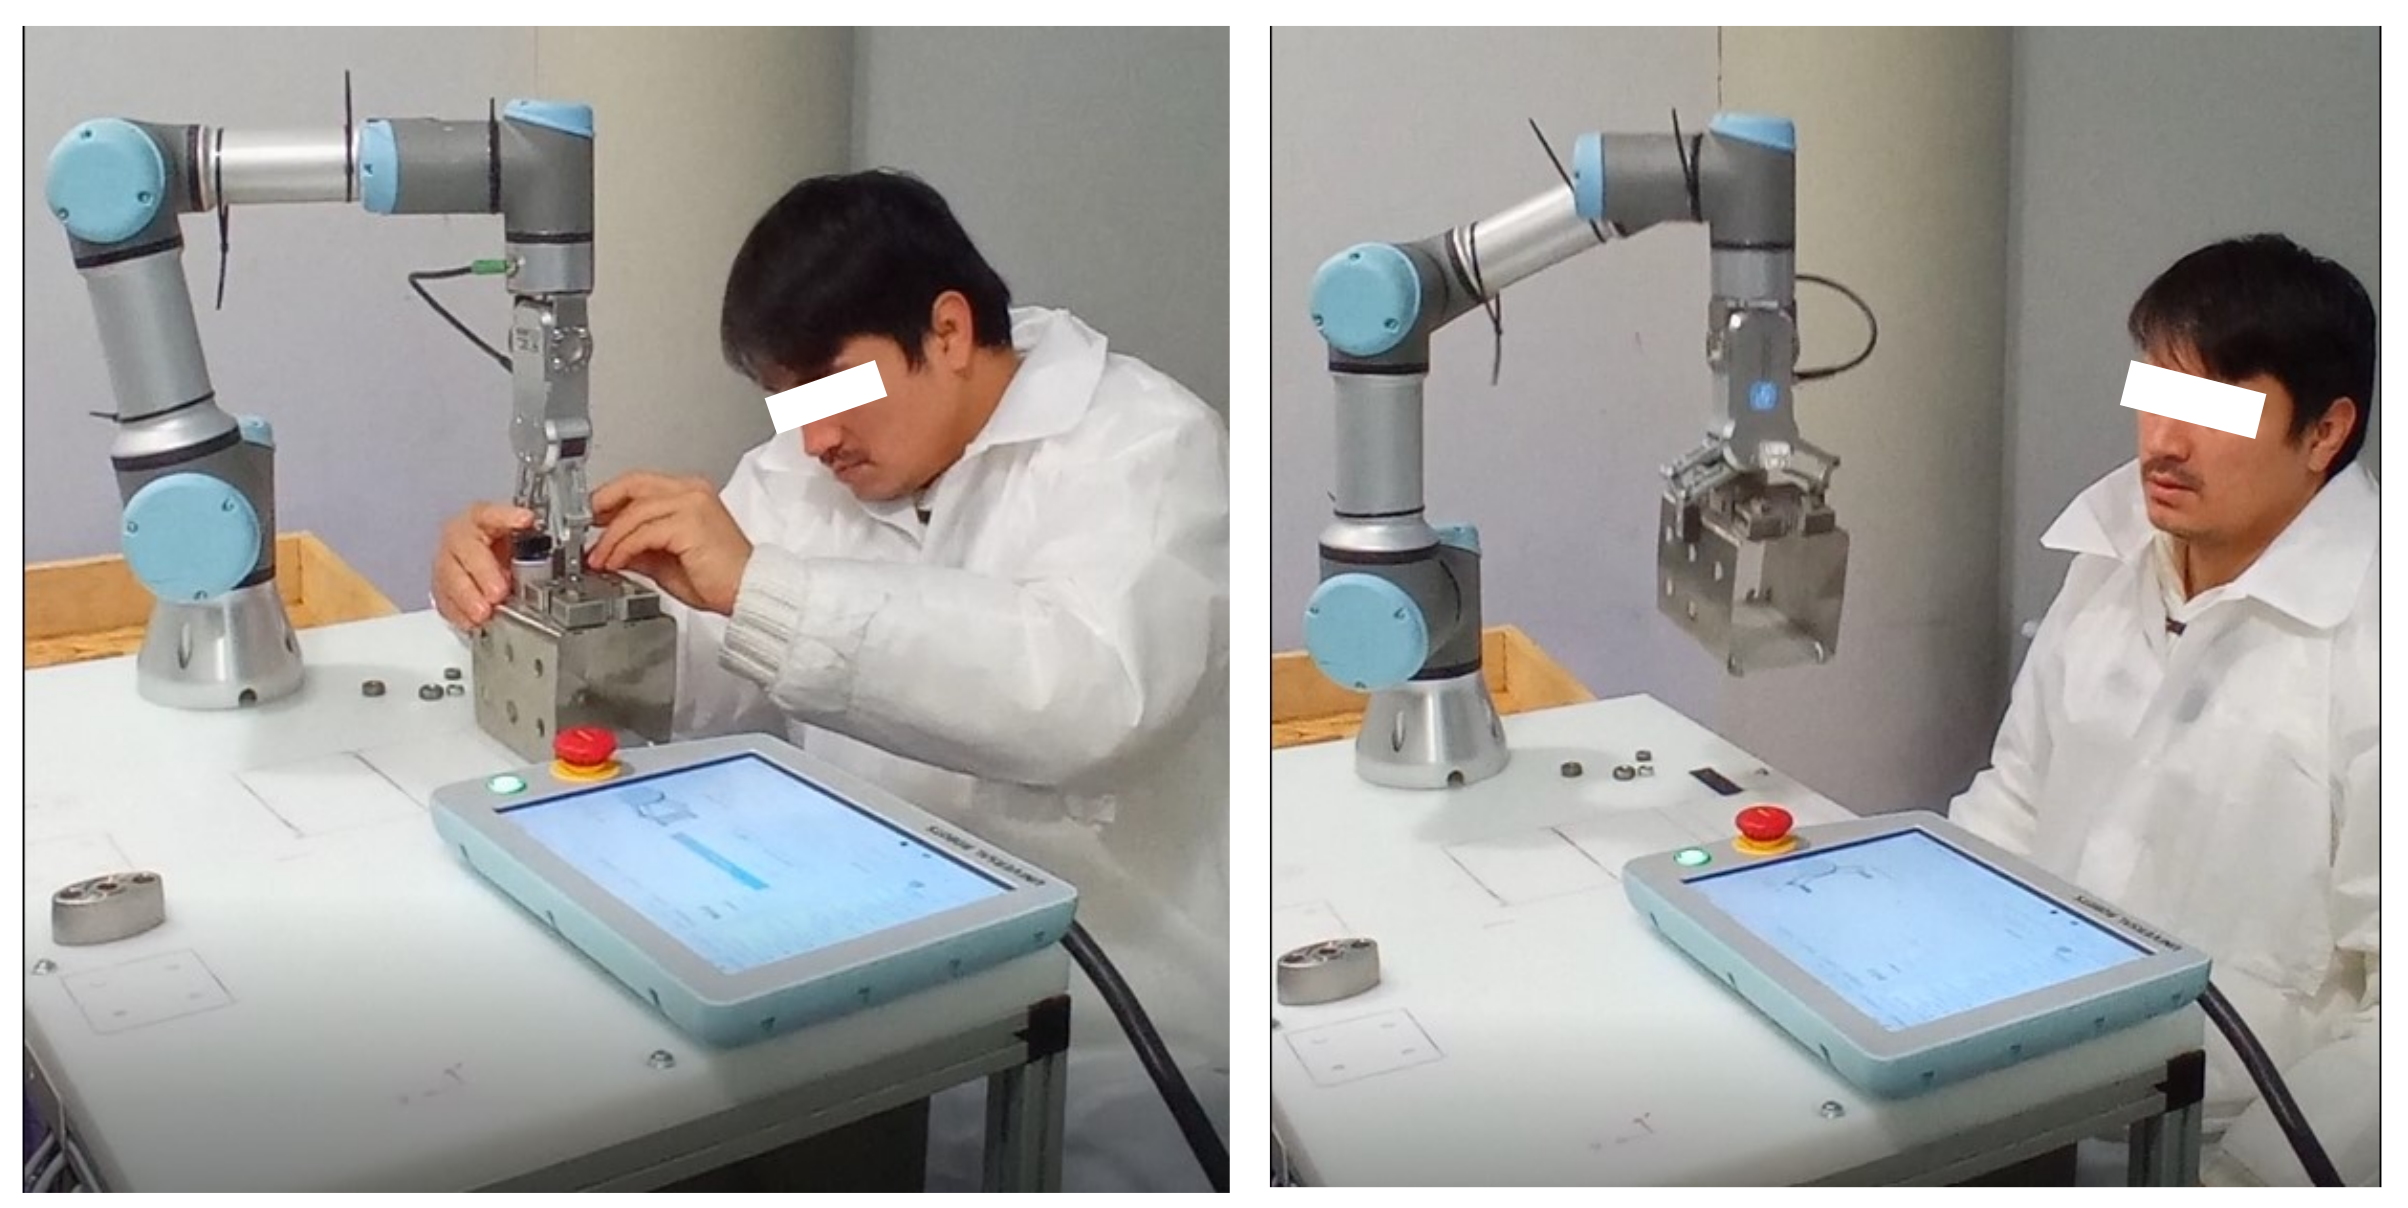
This section describes a case study where a cobot (UR3) performs pick and place tasks with a human operator, considering different loads—maximum, medium and minimum. The components of the experiment consist of a human operator, a UR3 robot and a shared workspace as shown in Figure 3. Both the robot and the human worker can access all the components necessary for the assembly in the workspace, such as the base, flanges, bolts and nuts. The HRC assembly application and integrated assembly method is described in [25]. During the case study, Physical and hardware data, such as temperature, load, speed, power, and programmed stops, protective stops and so forth, were acquired from the developed data acquisition framework during the case study. The robot was used without any workpiece to indicate the minimum load. A medium load corresponds to a 1.5 kg workpiece and a maximum load to a 3.0 kg workpiece. The monitoring system monitored all the physical parameters and predicted the parameters of influence of the cobots using different ML models.

3.5. Correlation Analyses

The acquired variables from the case study were correlated to identify any important variables of the cobot during the task execution with a human. The correlation coefficient is an important measure of the association of continuous data.
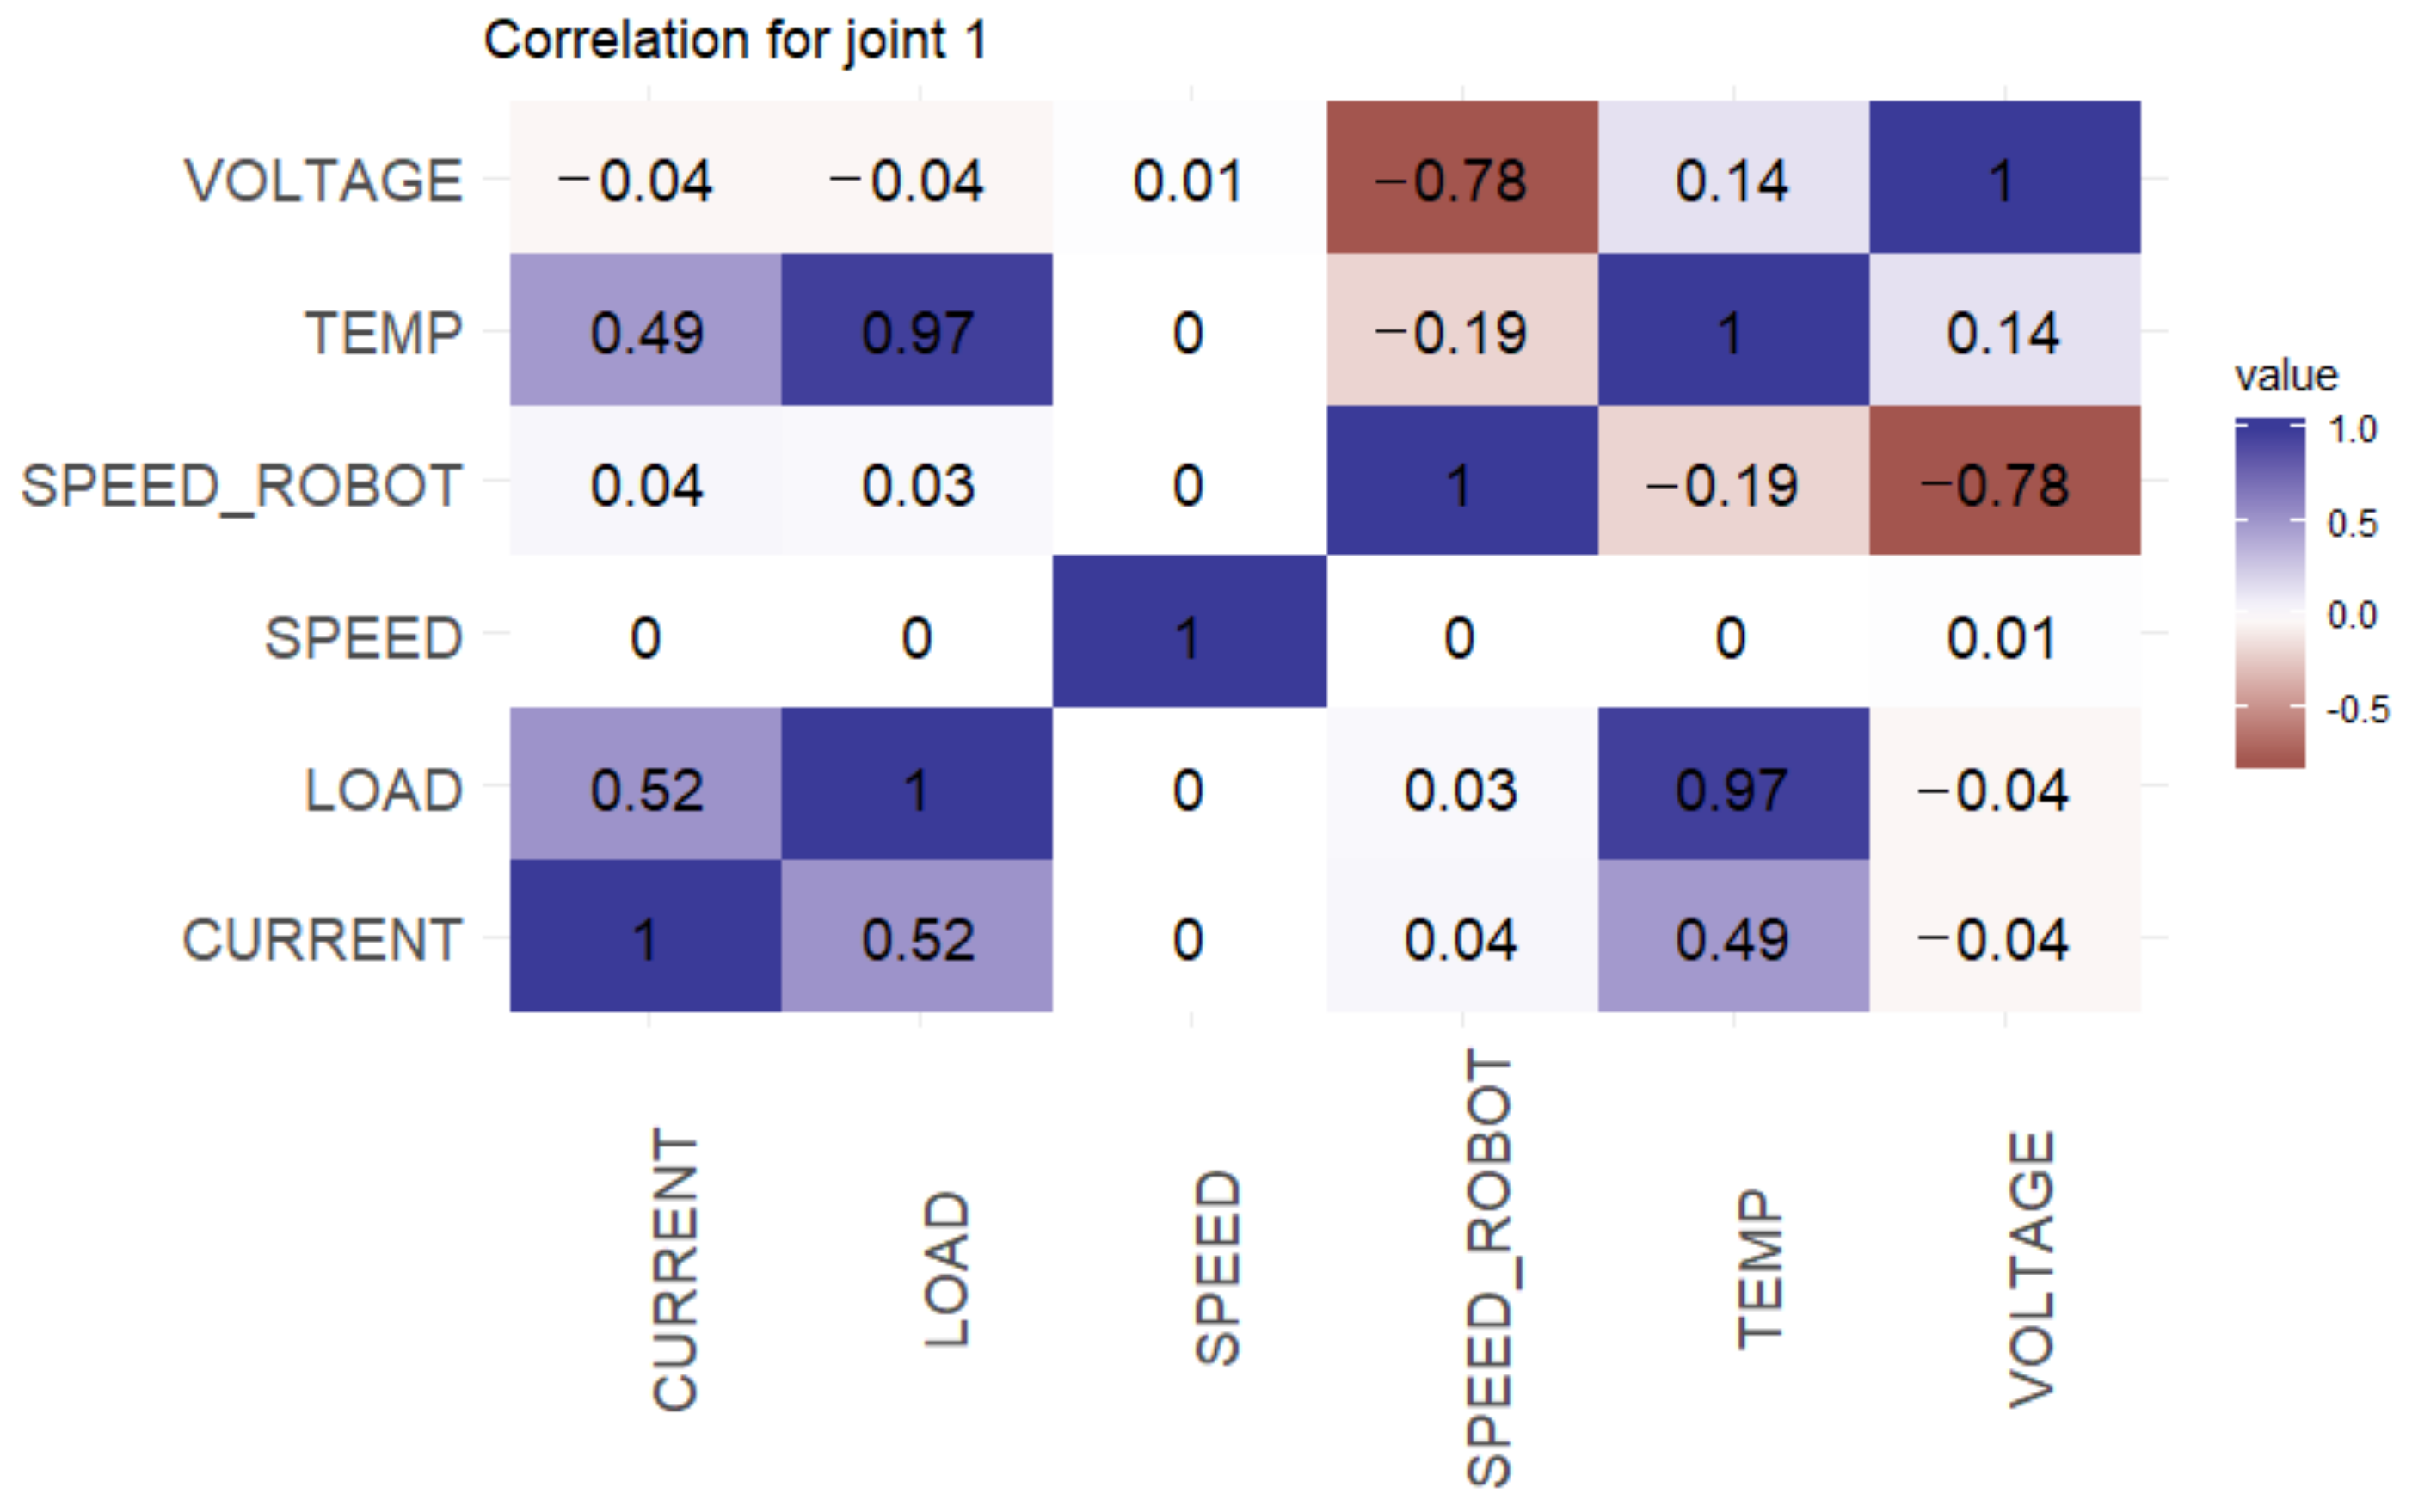
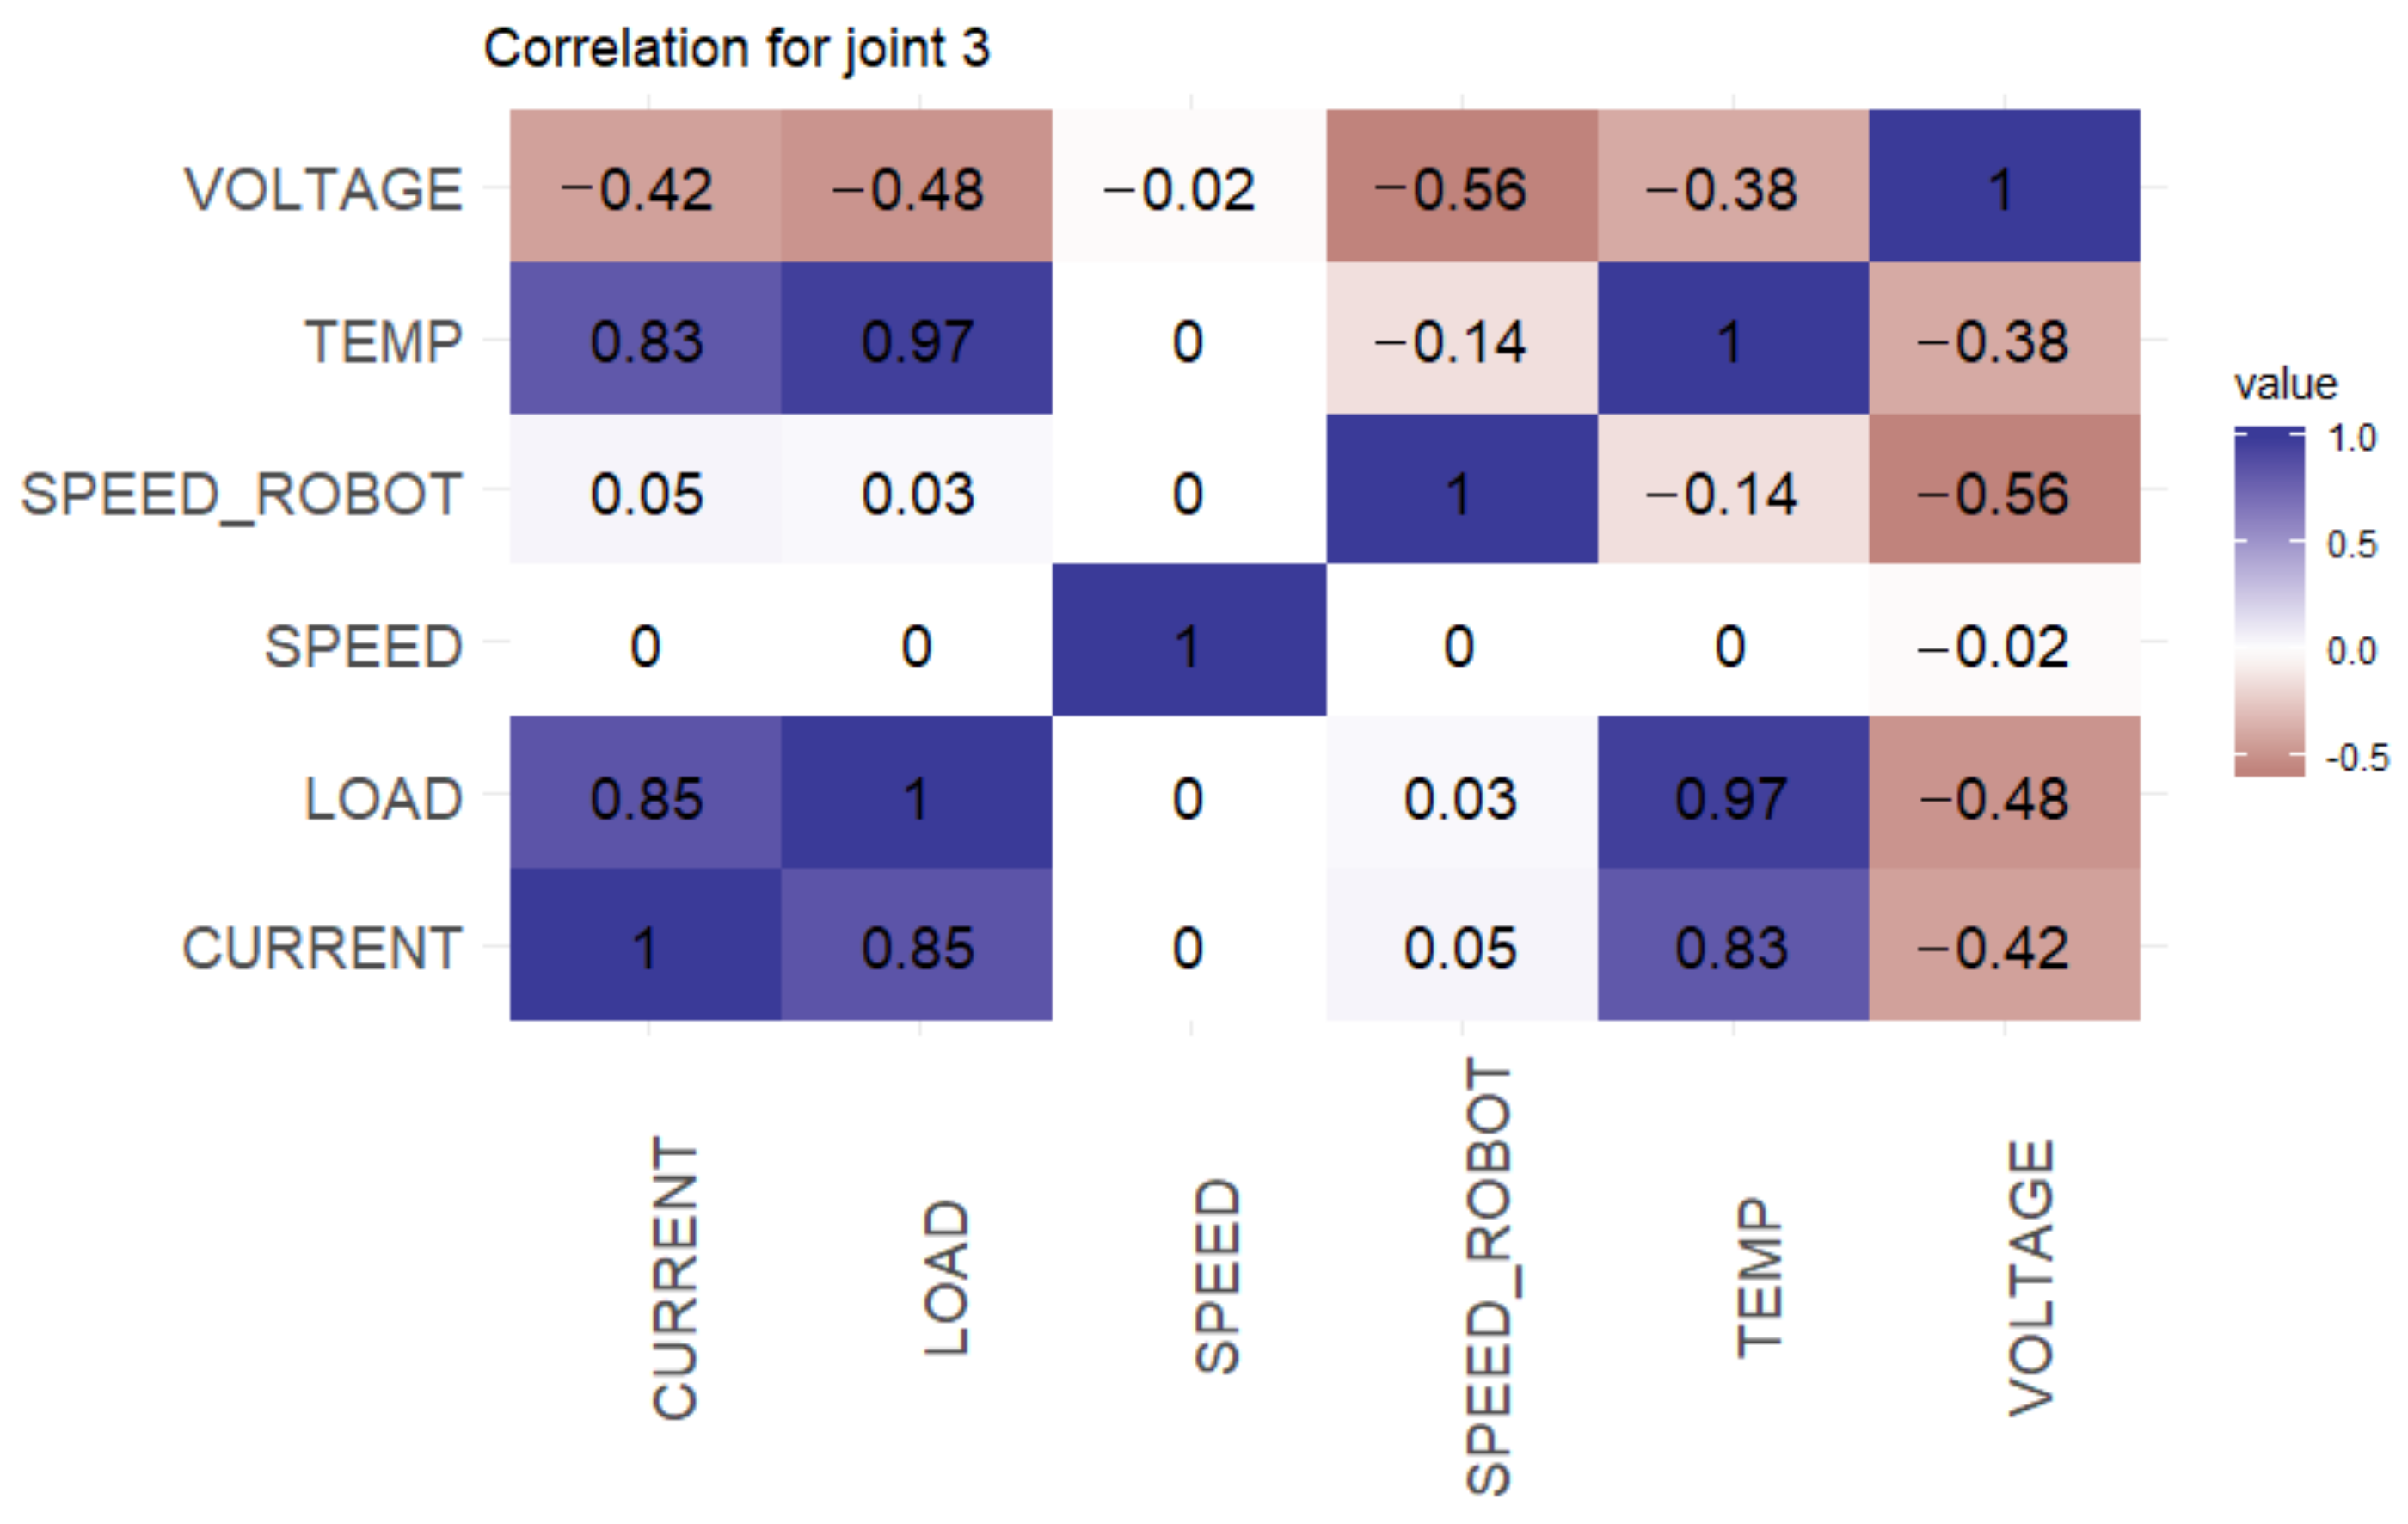
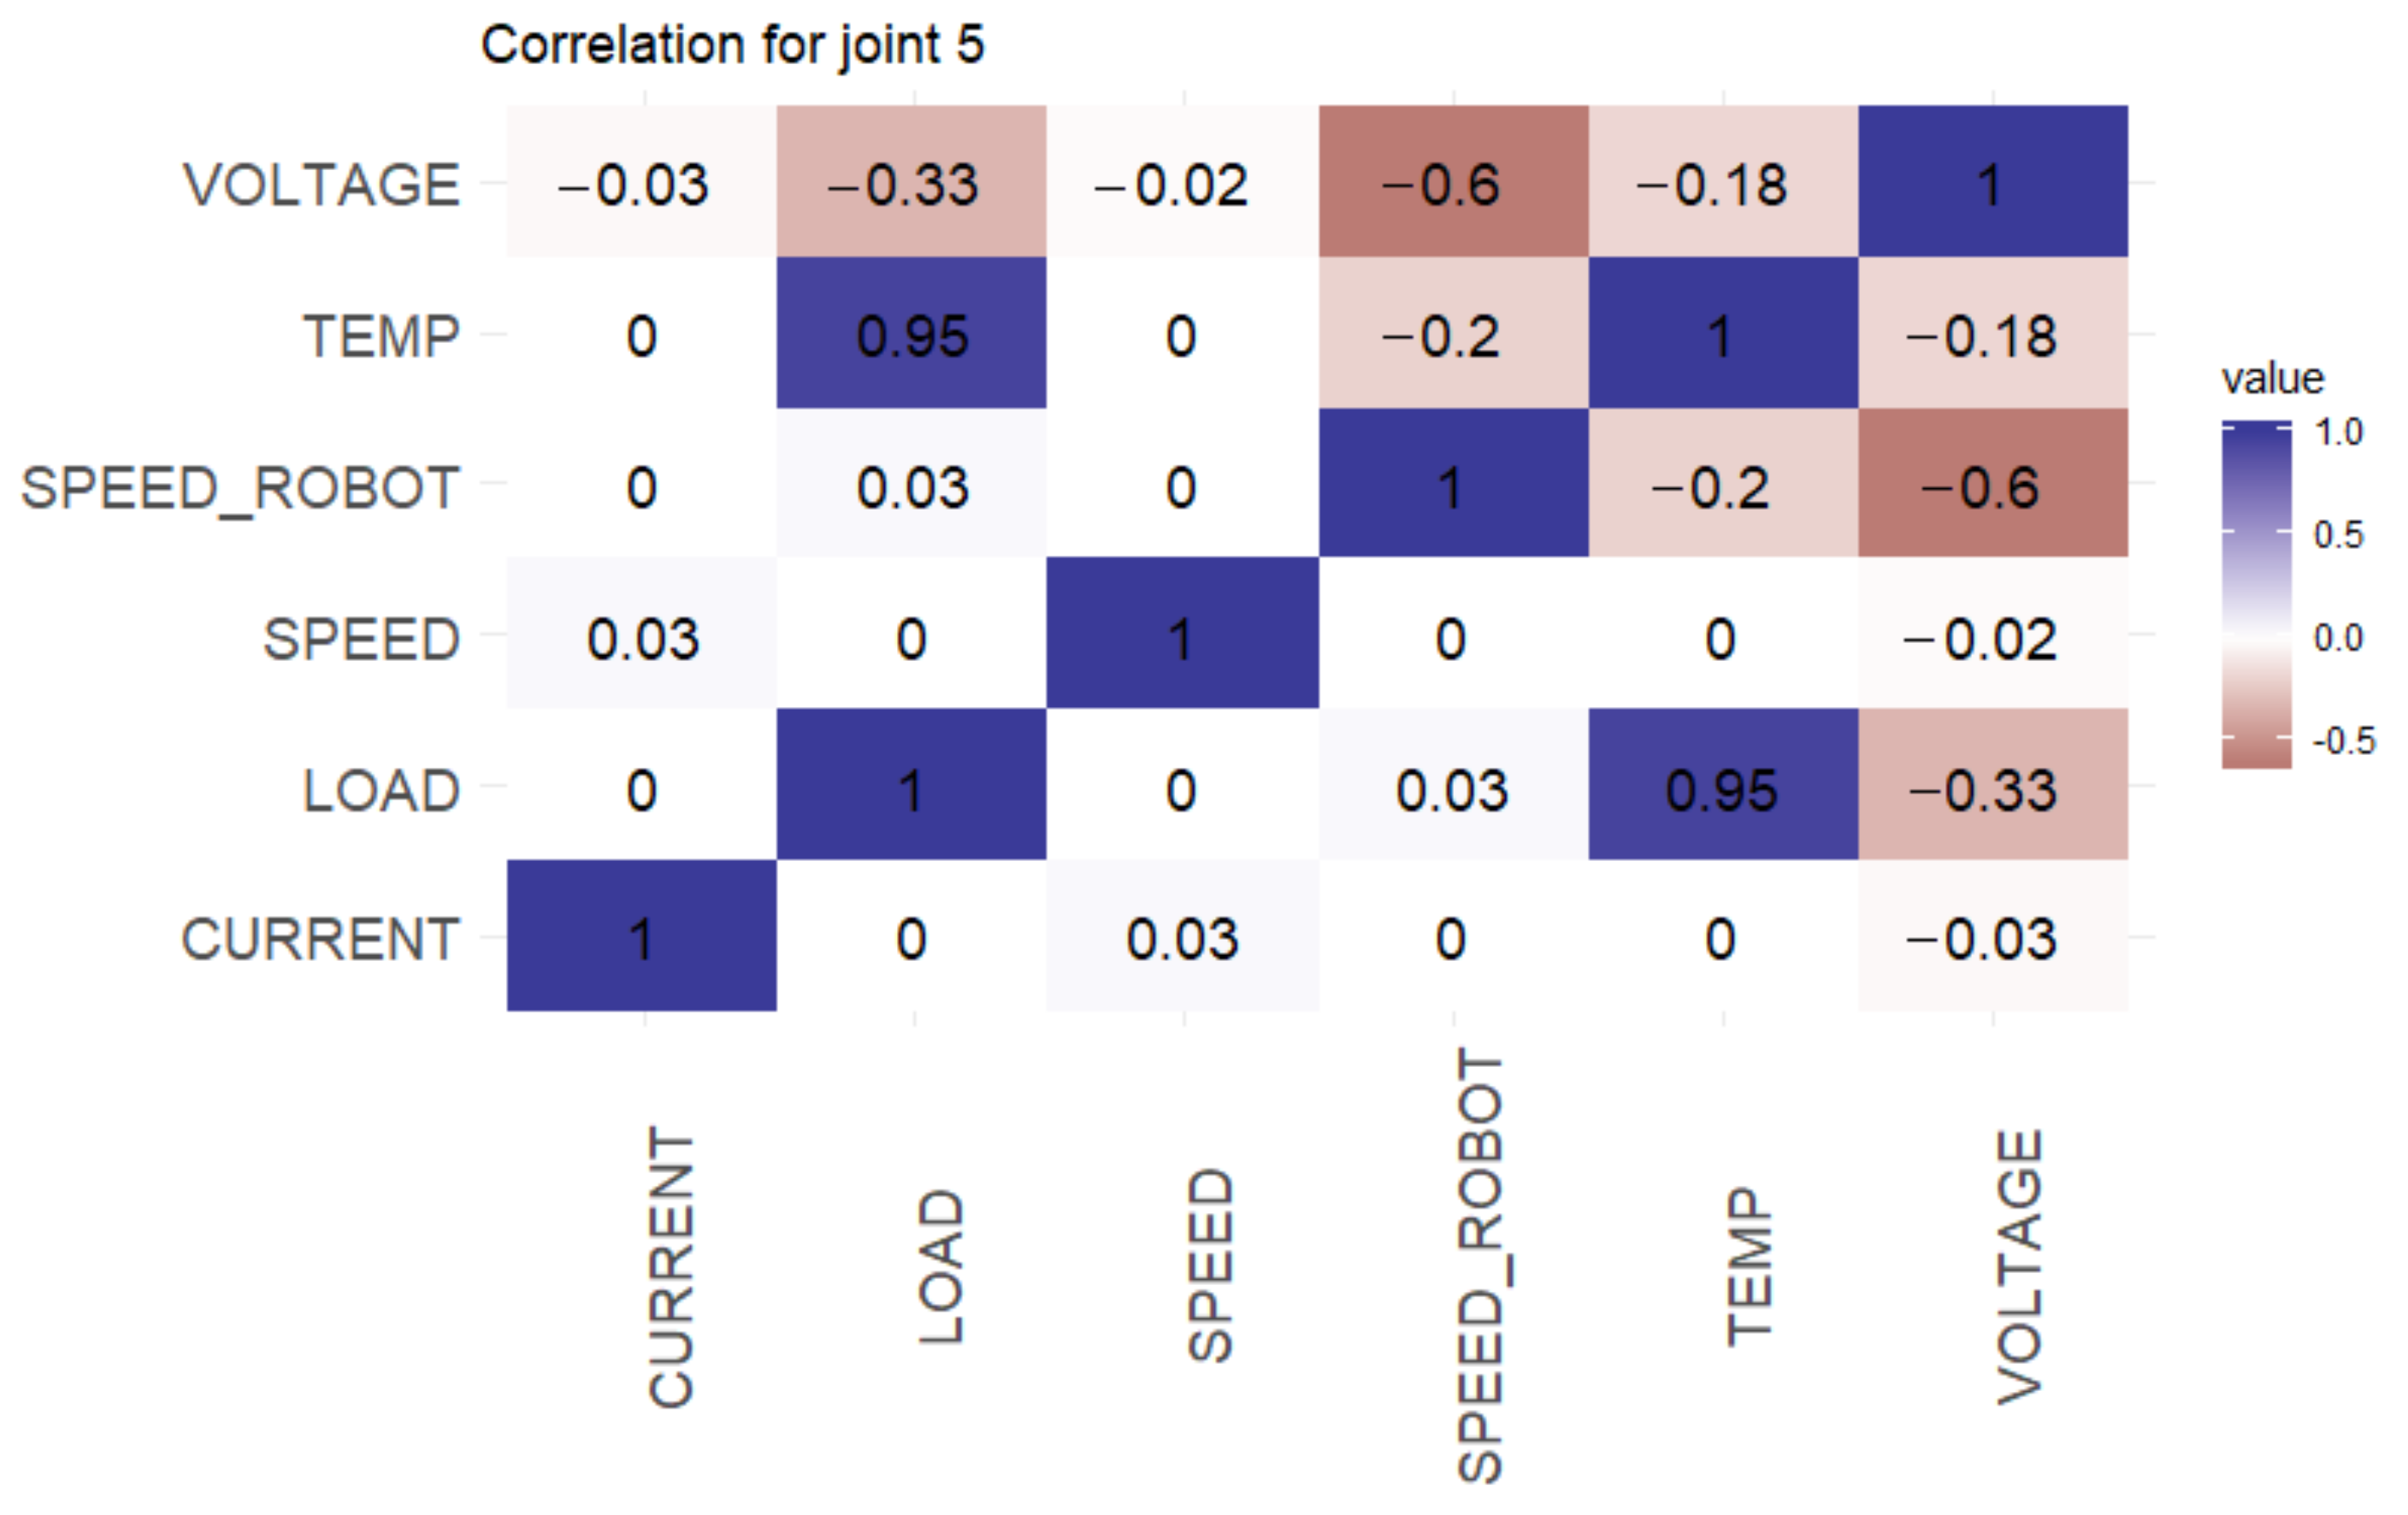
Figure 4, Figure 5, Figure 6, Figure 7, Figure 8 and Figure 9 show the correlation matrix of six joints to identify the most correlated variables of the specific joints. The correlation matrix clearly shows that the temperature and load variables are very closely correlated for each joint. Current in joint 1, joint 2 and joint 3 is the next most closely correlated variable with load and temperature. Voltage and speed variables are weakly correlated with other variables. Voltage is slightly correlated only with a robot speed between Joint 0–5 with a maximum −0.78 value in Joint 1. The joint speed variables are not correlated with other variables and they are almost 0 in every joint, only with voltage 0.01 in joint 1.
The most closely correlated variables in the correlation matrix were chosen for theregression and classification models to make predictions.
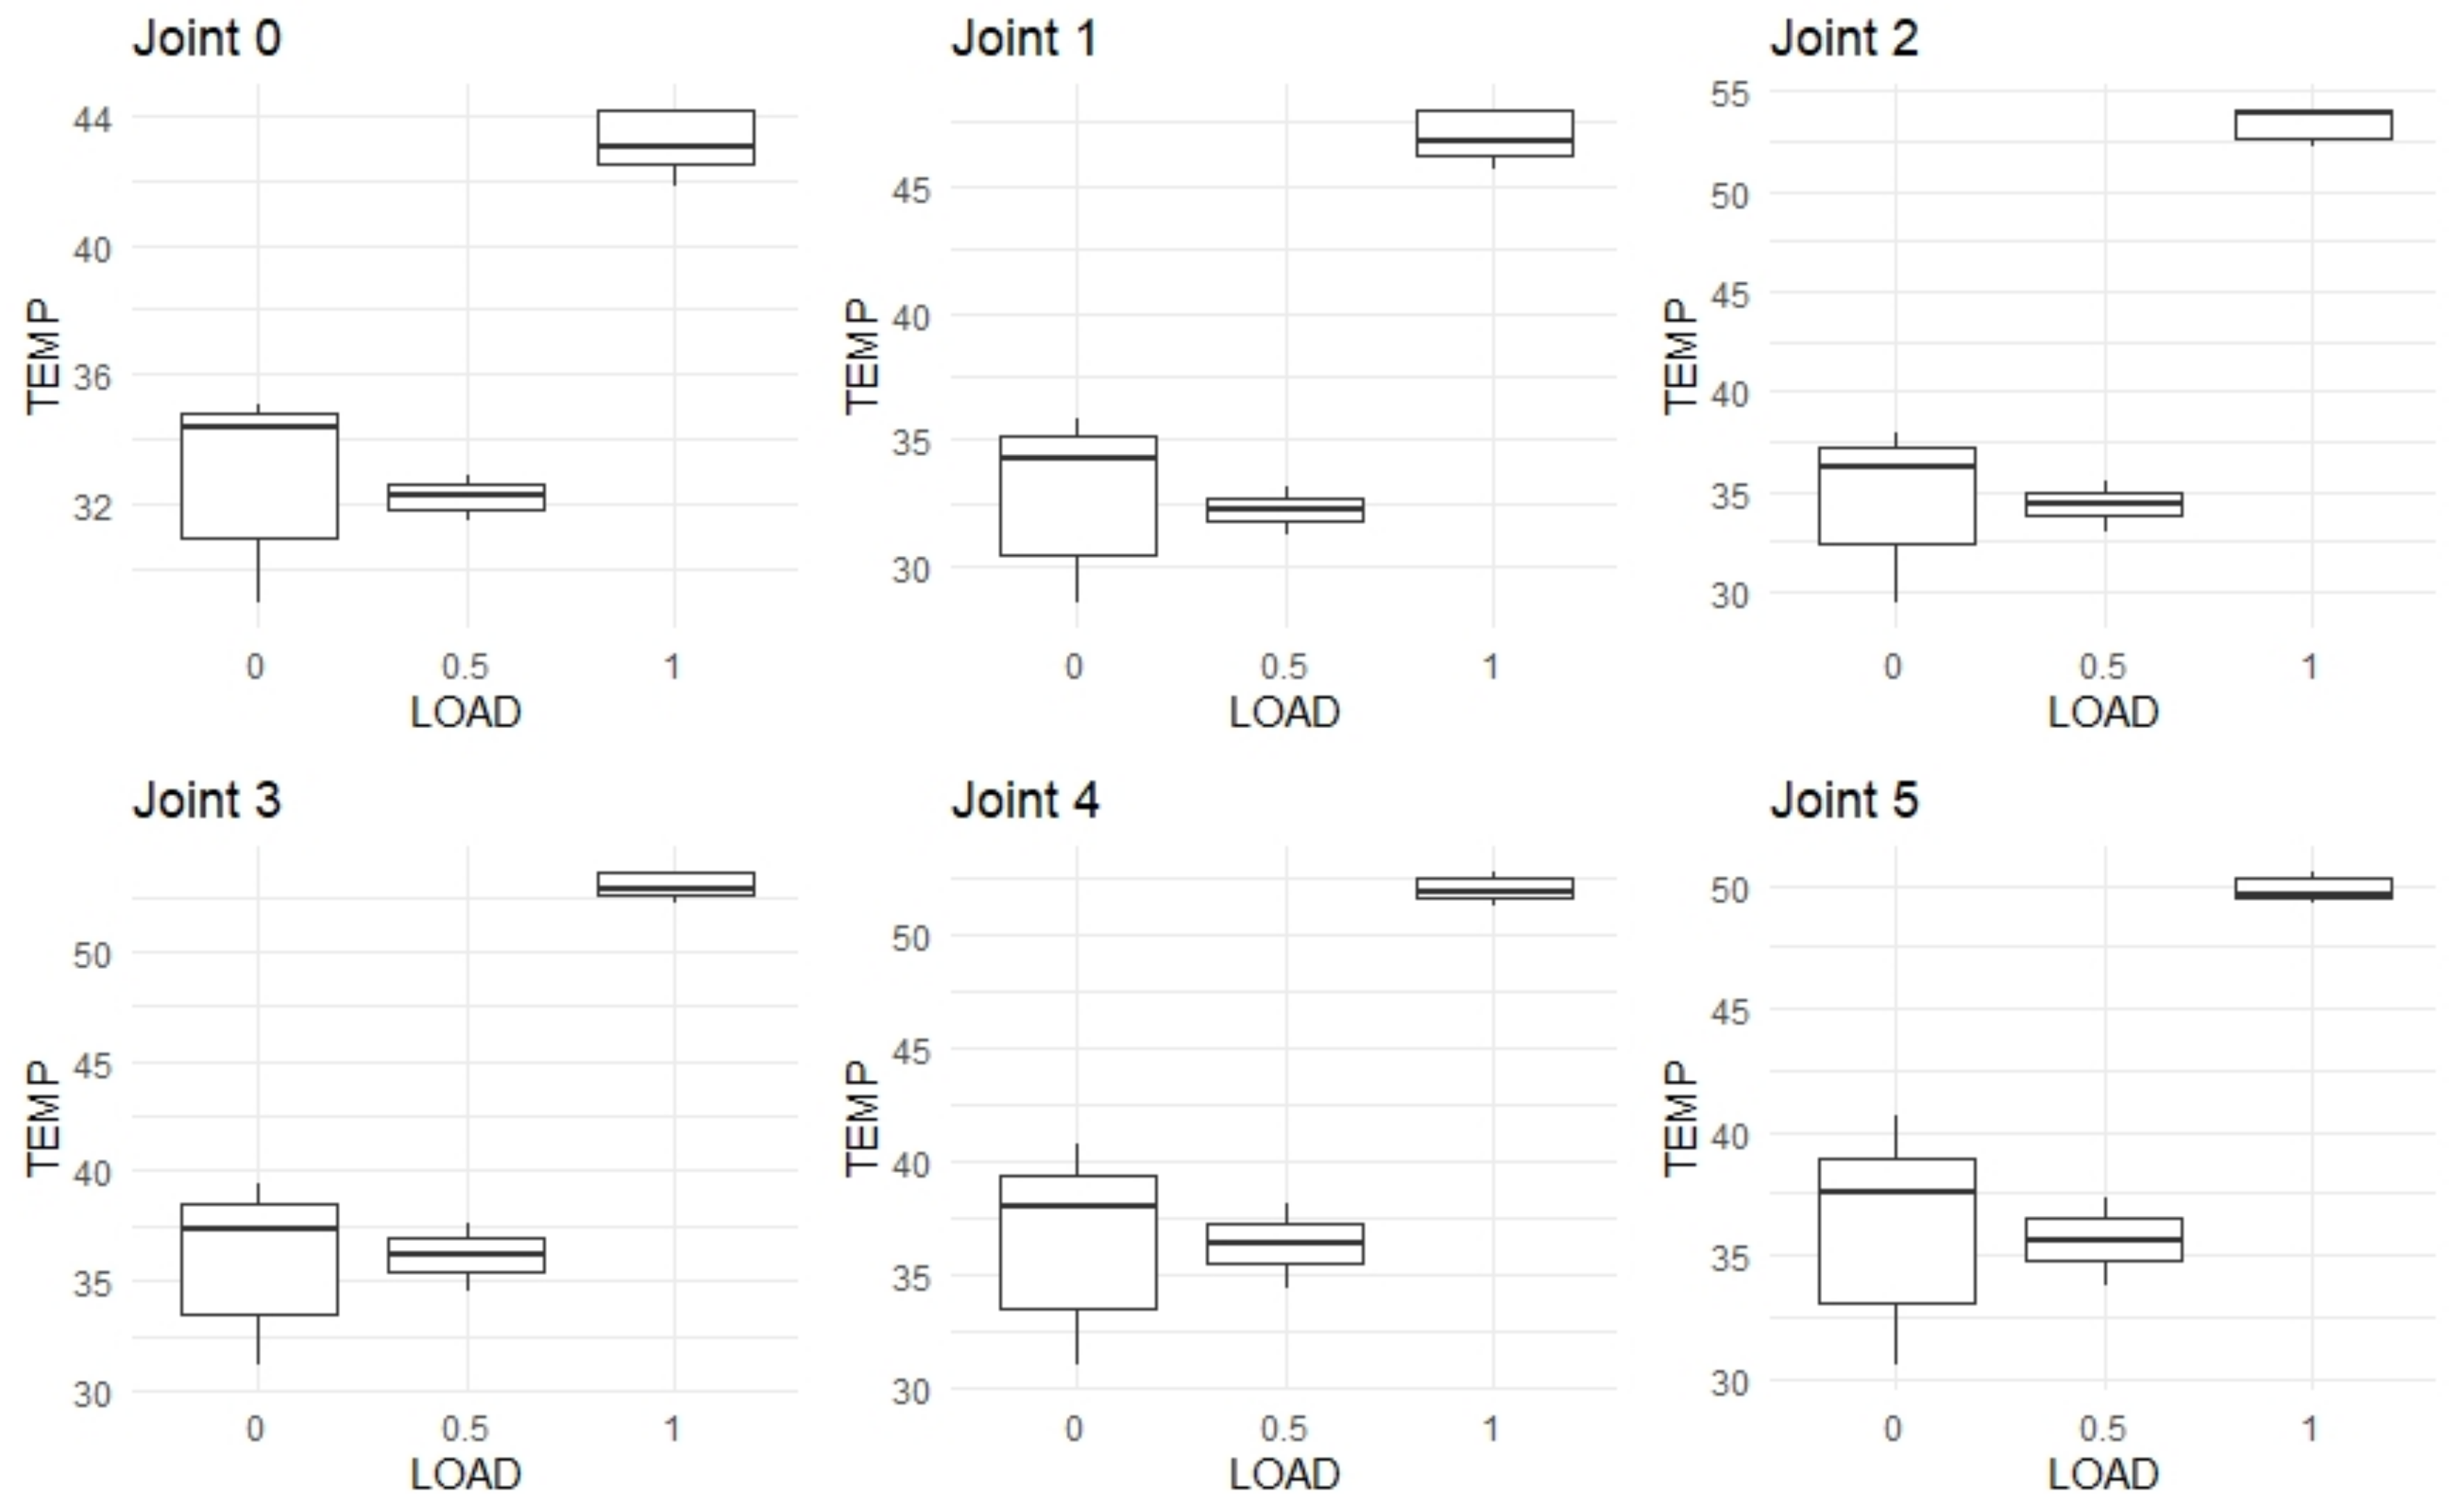
Figure 10 shows a box plot of the temperature of each joint when working with different loads. Figure 11 shows a box-plot of the power (product of current and voltage) vs different loads. The box plots indicate that when there is a maximum load, or the endeffector of the robot is working under a full load condition, there is a risk of the temperature in some joints, especially Joints 2, 3, 4 and 5, of rising above 50 degrees. According to the datasheet of the robot, the maximum temperature should not exceed 50 degrees, and this value limits the working range of the robot.
Figure 12 displays a box-plot of the speed vs different loads, and the plot shows that varying the loads has no effect on the speed of the robot.
Correlated variables such as loads, temperature and power are passed to the ML tools to monitor the conditions of the cobot. The monitoring system is a hybrid system, as both quantitative data regression models (data driven) and qualitative parameters classification models are used. All the results appear on the analytical dashboard of the robot.

4. Results and Discussions

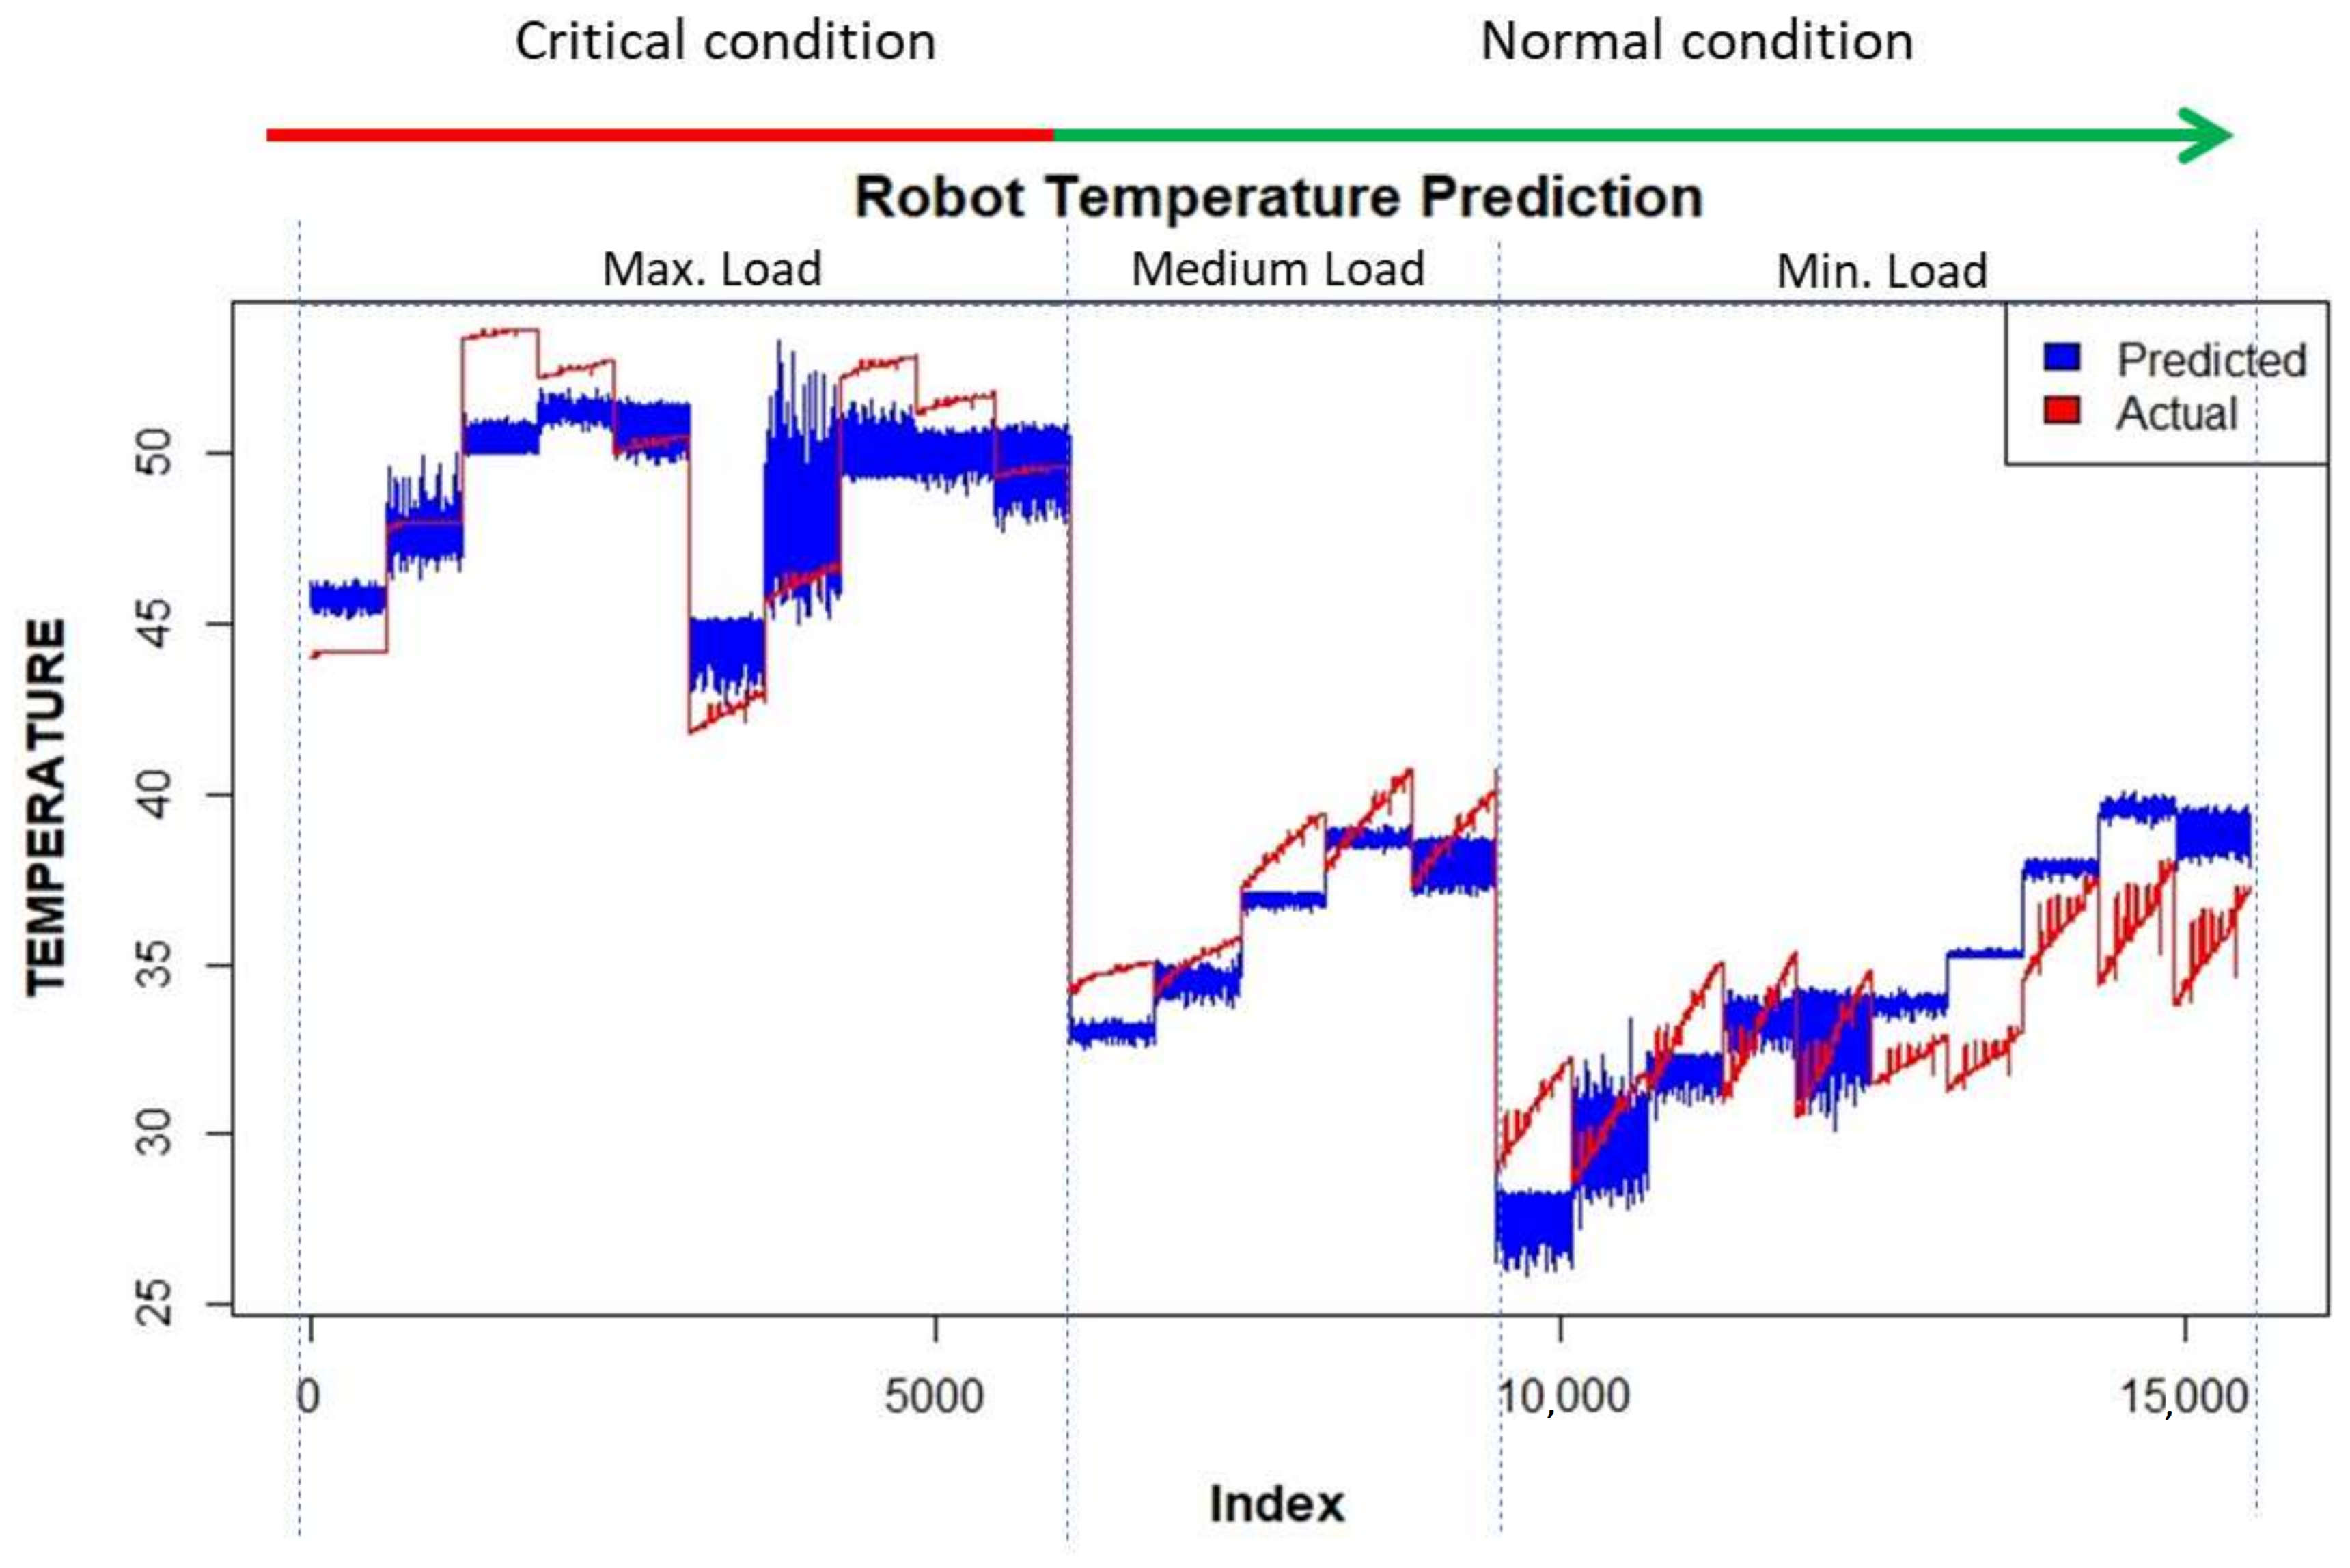
The results of the linear regression model, when used to predict the temperature of the robot and when AutoML is used to forecast safety stops during collaborative work are presented in this section. The correlation matrix and studies have shown that the temperature of the each joint and protective stops during collaborative tasks are important factors of the robot manipulator that can influence the reliability of collaborative work. Figure 13 shows the results of a linear regression model used to predict the temperature of a robot while performing human robot collaboration tasks with different loads. The blue data on the graph are the original data and the red data are the predicted variables. Moreover, the graph shows the critical temperature condition when the robot works with maximum loads and normal condition when the robot performs tasks with lighter loads.
The Table 4 shows the performance results of the linear regression model. The main evaluation parameters of the model were the Adjusted R squared, multiple R-squared, F-statistics and p-values. The linear model with all the data resulted in a higher error than for the other experimental setups. The performance of the LM with all the data including the max. medium and min data, resulted in an Adjusted R-squared equal to 0.9346 and a multiple R-squared of 0.9529, which are sufficient to be integrated into the monitoring system as temperature prediction models.
Table 5 demonstrates the coefficients of the Linear regression model for UR3 with all the data and important variables. It is clear, from the table, that the most influencing variable with the greatest influence on the temperature predictive model is load.
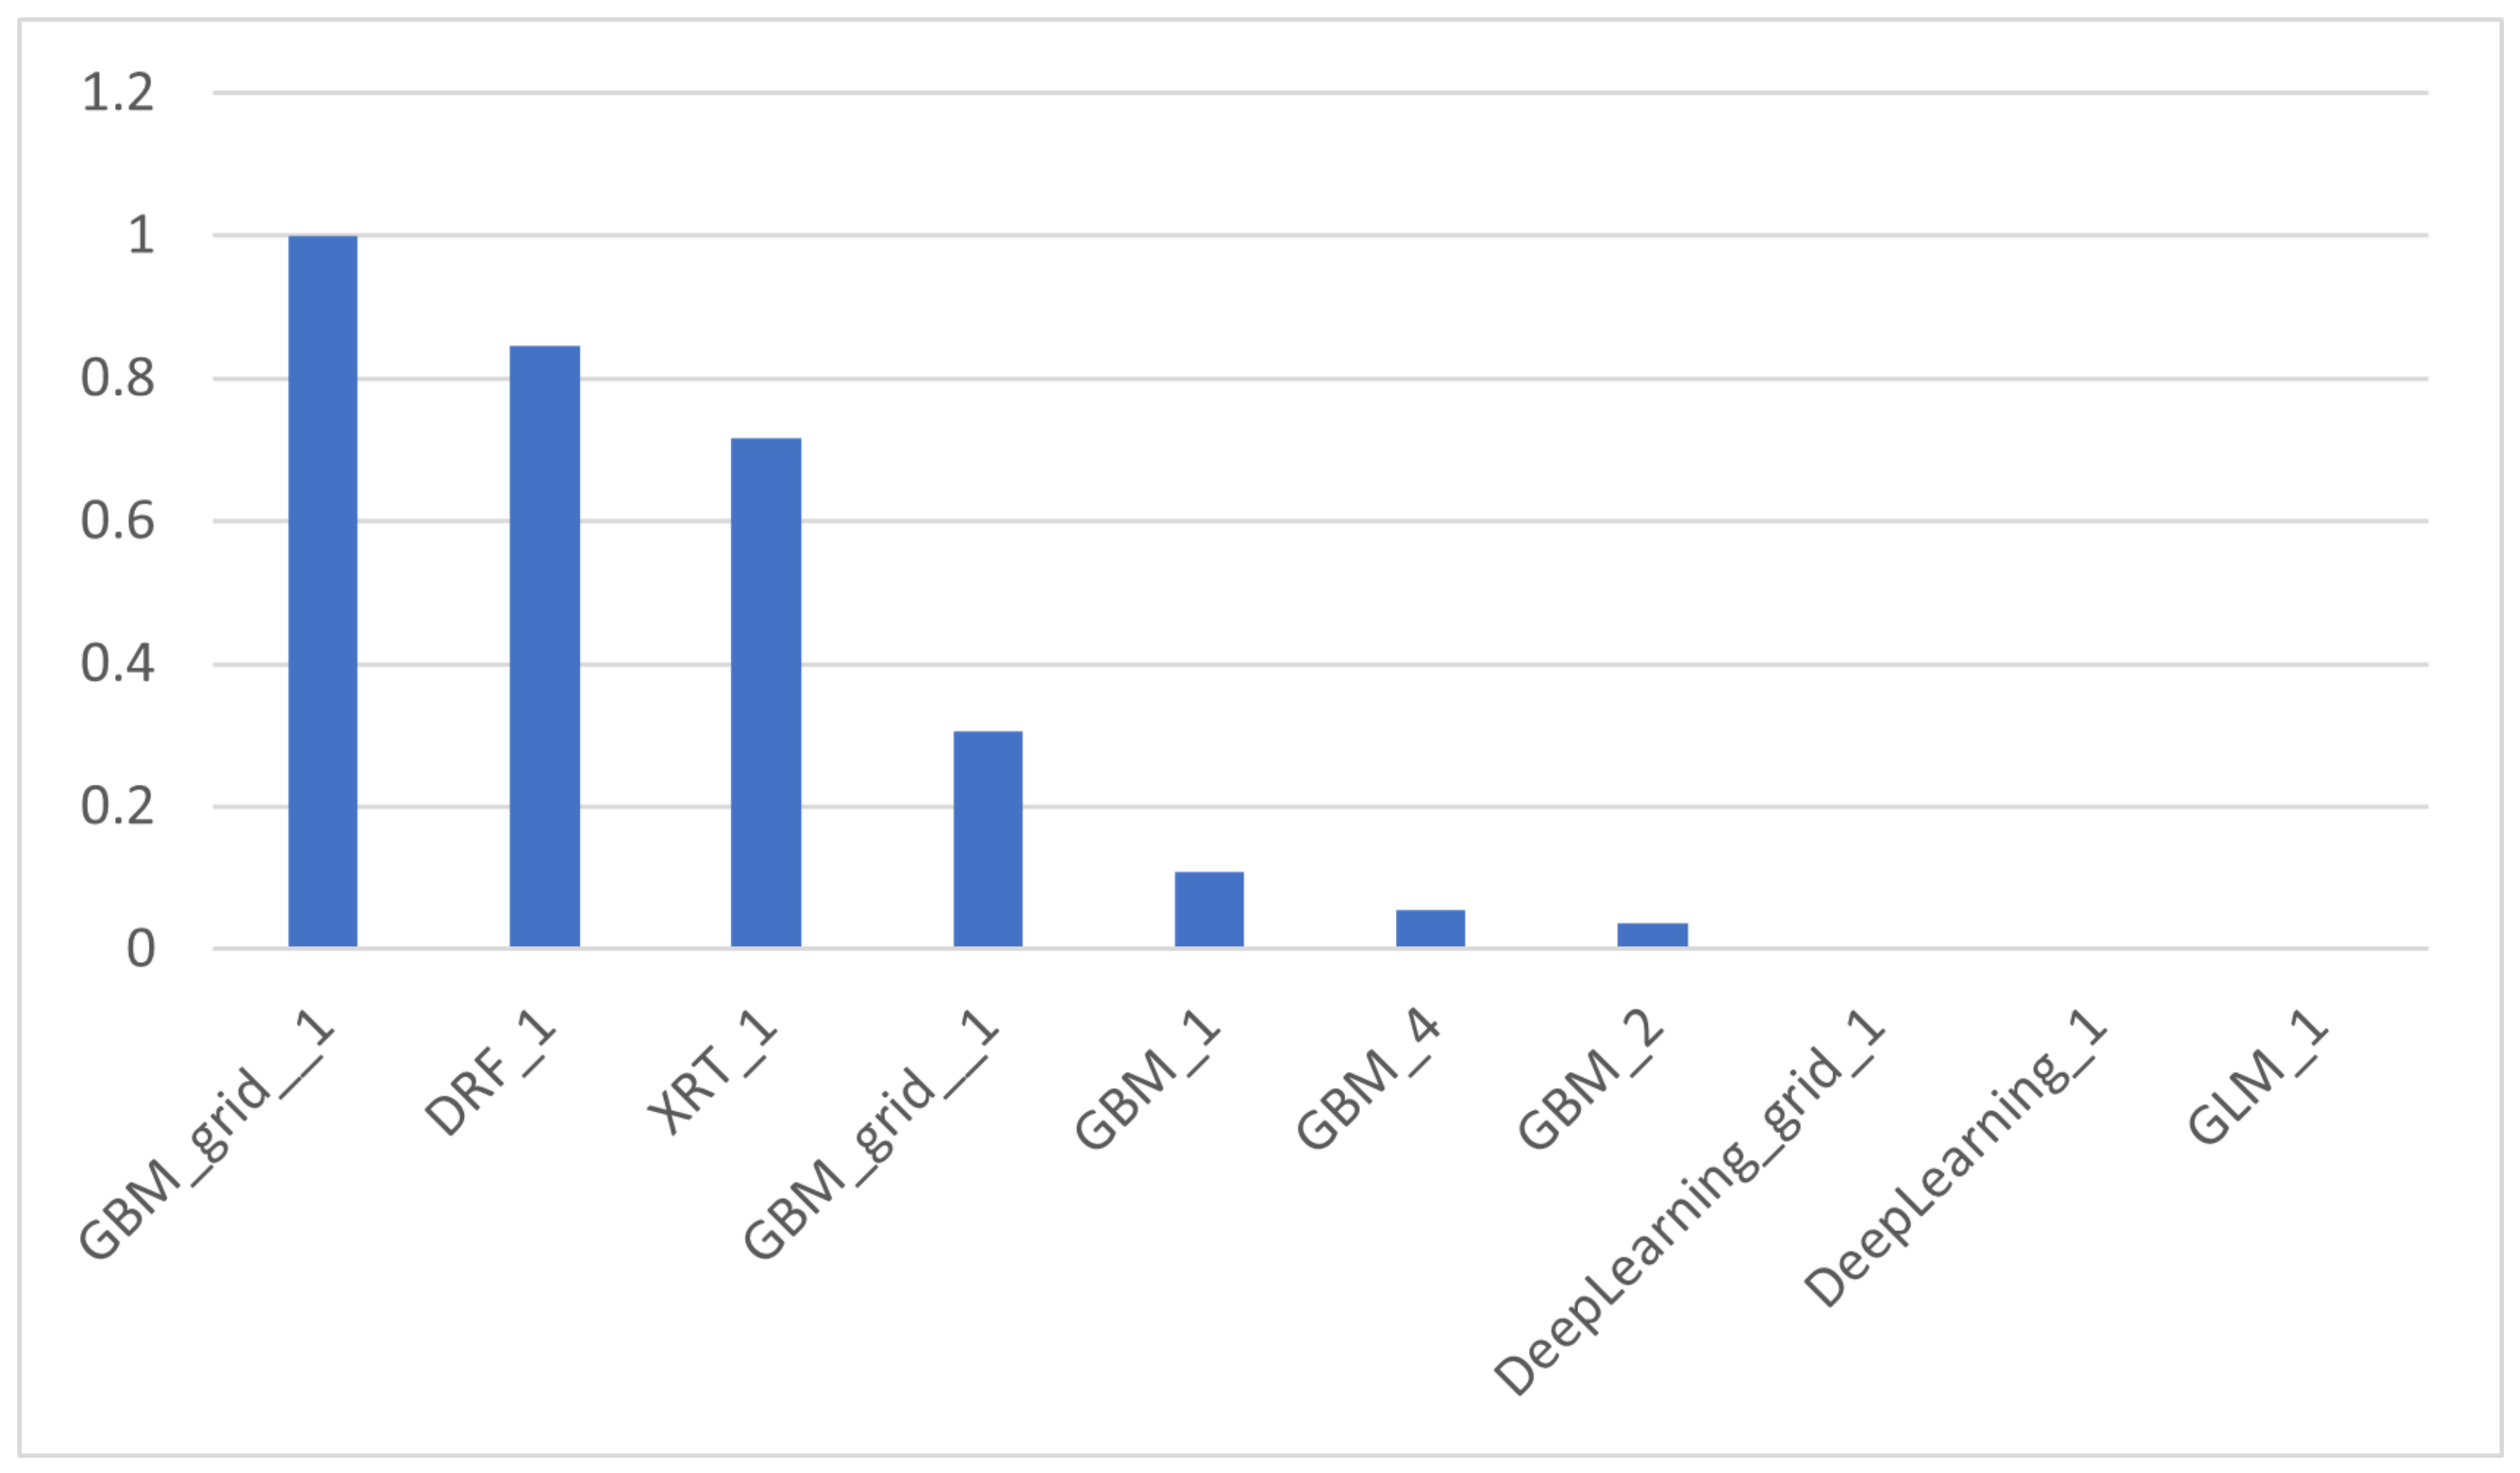
H2O AutoML is used to predict safety stops during collaborative tasks. Our dataset is trained in an H2O cluster using R, version 3.6.3. The AutoML function in H2O automates the process of building a large number of models and finds the most suitable model for a given dataset. AutoML includes a “leaderboard” of models that are trained in the process. It includes a 5-fold validated model performance, and no hyperparameters were used for our dataset. Figure 14 shows the performance of AutoML and the importance of the ten models.
Users can receive scores of the dataset using the leaderboard frame. Our dataset was trained in a binary classification model, and AUC metrics was used as the main model parameter.
The predictive model results of AutoML are shown in Table 6.
According to the table, the best performing algorithm is Gradient Boosting Machine (GBM). The importance of the variables for the GBM model is shown in Figure 15. According to the plot, the variables with the most influence on the GBM model are the SPEED of the robot, and CURRENT.

5. Conclusions

A platform used to monitor the health status of collaborative robots during collaborative tasks is presented in this paper. The case study was performed on benchmark tasks for collaborative assembly processes. An automatic machine learning(ML) tool was used to perform on-line monitoring and predict outages of the industrial cobots during a human-robot collaboration process. Such an on-line monitoring system allows more reliable human robot collaboration applications to be created, unplanned downtime during task execution to be eliminated, and the trust of humans during interaction with a robot and the lifetime of the robot to be maximised. The proposed framework demonstrates data management techniques on an industrial robot that is considered as a physical cyber-system. Using an assembly case study, the parameters of a robot were collected and fed to an automatic ML model in order to identify the most significant reliability factors and to predict the necessity of safety stops of the robot. According to the results, a linear regression model was selected for certain quantitative variables such as temperature. The classification model was used to predict the qualitative variables. The linear regression model was found to be sufficiently good to be integrated in the monitoring system to predict temperature. H2O, with the AutoML function, was used to predict safety stops during collaborative tasks and the results show that GBM appears to be the best model for the considered dataset. Further improvement will involve the integration of other relevant sensors in the monitoring platform to further increase the usability of the system under variable working conditions.

Author Contributions

Conceptualization, K.A.; methodology, K.A. and D.A.; software, K.A.; validation, D.A.; formal analysis, D.A.; investigation, K.A. and D.A.; resources, K.A. and D.A.; data curation, K.A.; writing—original draft preparation, K.A. and D.A.; writing—review and editing, K.A. and D.A.; visualization, K.A.; supervision, D.A.; project administration, D.A.; funding acquisition, D.A. All authors have read and agreed to the published version of the manuscript.

Funding

This paper did not receive any external funding.

Institutional Review Board Statement

Not applicable.

Informed Consent Statement

Not applicable.

Data Availability Statement

Not applicable.

Acknowledgments

The authors would like to thank Emiliano Traini for his support with the RStudio software.

Conflicts of Interest

The authors declare no conflict of interest.

References

  1. Aliev, K.; Antonelli, D. Analysis of Cooperative Industrial Task Execution by Mobile and Manipulator Robots. In Advances in Manufacturing II; Trojanowska, J., Ciszak, O., Machado, J.M., Pavlenko, I., Eds.; Springer International Publishing: Cham, Switzerland, 2019; pp. 248–260. [Google Scholar]
  2. Grigore, L.S.; Priescu, I.; Joita, D.; Oncioiu, I. The Integration of Collaborative Robot Systems and Their Environmental Impacts. Processes 2020, 8, 494. [Google Scholar] [CrossRef] [Green Version]
  3. Bortolini, M.; Ferrari, E.; Gamberi, M.; Pilati, F.; Faccio, M. Assembly system design in the Industry 4.0 era: A general framework. IFAC-PapersOnLine 2017, 50, 5700–5705. [Google Scholar] [CrossRef]
  4. Michalos, G.; Spiliotopoulos, J.; Makris, S.; Chryssolouris, G. A method for planning human robot shared tasks. CIRP J. Manuf. Sci. Technol. 2018, 22, 76–90. [Google Scholar] [CrossRef]
  5. Yang, C.; Sun, Y.; Ladubec, C.; Liu, Y. Developing Machine Learning-Based Models for Railway Inspection. Appl. Sci. 2020, 11, 13. [Google Scholar] [CrossRef]
  6. Cardoso, D.; Ferreira, L. Application of Predictive Maintenance Concepts Using Artificial Intelligence Tools. Appl. Sci. 2020, 11, 18. [Google Scholar] [CrossRef]
  7. Villani, V.; Pini, F.; Leali, F.; Secchi, C. Survey on human–robot collaboration in industrial settings: Safety, intuitive interfaces and applications. Mechatronics 2018, 55, 248–266. [Google Scholar] [CrossRef]
  8. Magrini, E.; Ferraguti, F.; Ronga, A.J.; Pini, F.; De Luca, A.; Leali, F. Human-robot coexistence and interaction in open industrial cells. Robot. Comput.-Integr. Manuf. 2020, 61, 101846. [Google Scholar] [CrossRef]
  9. ISO. Robots and Robotic Devices–Safety Requirements for Industrial Robots—Part 1: Robots; ISO: Geneva, Switzerland, 2011. [Google Scholar]
  10. ISO. ISO 10218-2: 2011. Robots and Robotic Devices—Safety Requirements for Industrial Robots–Part 2: Robot Systems and Integration (ISO 10218-2: 2011) Machinery; ISO: Geneva, Switzerland, 2011. [Google Scholar]
  11. ISO. TS 15066: 2016: Robots and Robotic Devices–Collaborative Robots; International Organization for Standardization: Geneva, Switzerland, 2016. [Google Scholar]
  12. Scopus Database Scopus. Available online: www.scopus.com (accessed on 20 January 2021).
  13. Matheson, E.; Minto, R.; Zampieri, E.G.; Faccio, M.; Rosati, G. Human–Robot Collaboration in Manufacturing Applications: A Review. Robotics 2019, 8, 100. [Google Scholar] [CrossRef] [Green Version]
  14. Grahn, S.; Langbeck, B.; Johansen, K.; Backman, B. Potential Advantages Using Large Anthropomorphic Robots in Human-robot Collaborative, Hand Guided Assembly. Procedia CIRP 2016, 44, 281–286. [Google Scholar] [CrossRef] [Green Version]
  15. Michalos, G.; Makris, S.; Papakostas, N.; Mourtzis, D.; Chryssolouris, G. Automotive assembly technologies review: Challenges and outlook for a flexible and adaptive approach. CIRP J. Manuf. Sci. Technol. 2010, 2, 81–91. [Google Scholar] [CrossRef]
  16. Nguyen, M.T.; La, H.M.; Teague, K.A. Collaborative and compressed mobile sensing for data collection in distributed robotic networks. IEEE Trans. Control Netw. Syst. 2017, 5, 1729–1740. [Google Scholar] [CrossRef]
  17. Kirschner, D.; Schlotzhauer, A.; Brandstötter, M.; Hofbaur, M. Validation of relevant parameters of sensitive manipulators for human-robot collaboration. In International Conference on Robotics in Alpe-Adria Danube Region; Springer: Berlin, Germany, 2017; pp. 242–252. [Google Scholar]
  18. Aliev, K.; Antonelli, D.; Awouda, A.; Chiabert, P. Key Performance Indicators Integrating Collaborative and Mobile Robots in the Factory Networks. In Collaborative Networks and Digital Transformation; Camarinha-Matos, L.M., Afsarmanesh, H., Antonelli, D., Eds.; Springer International Publishing: Cham, Switzerland, 2019; pp. 635–642. [Google Scholar]
  19. Dagalakis, N.G.; Yoo, J.M.; Oeste, T. Human-robot collaboration dynamic impact testing and calibration instrument for disposable robot safety artifacts. Ind. Robot. Int. J. 2016, 43, 328–337. [Google Scholar] [CrossRef] [Green Version]
  20. Polygerinos, P.; Correll, N.; Morin, S.A.; Mosadegh, B.; Onal, C.D.; Petersen, K.; Cianchetti, M.; Tolley, M.T.; Shepherd, R.F. Soft robotics: Review of fluid-driven intrinsically soft devices; manufacturing, sensing, control, and applications in human-robot interaction. Adv. Eng. Mater. 2017, 19, 1700016. [Google Scholar] [CrossRef]
  21. Wang, Q.; Cheng, Y.; Jiao, W.; Johnson, M.T.; Zhang, Y. Virtual reality human-robot collaborative welding: A case study of weaving gas tungsten arc welding. J. Manuf. Process. 2019, 48, 210–217. [Google Scholar] [CrossRef]
  22. Antonelli, D.; Astanin, S. Qualification of a Collaborative Human-robot Welding Cell. Procedia CIRP 2016, 41, 352–357. [Google Scholar] [CrossRef] [Green Version]
  23. Antonelli, D.; Astanin, S. Enhancing the quality of manual spot welding through augmented reality assisted guidance. Procedia CIRP 2015, 33, 556–561. [Google Scholar] [CrossRef] [Green Version]
  24. Chen, S.; Qiu, T.; Lin, T.; Wu, L.; Tian, J.; Lv, W.; Zhang, Y. Intelligent Technologies for Robotic Welding. In Robotic Welding, Intelligence and Automation; Tarn, T.J., Zhou, C., Chen, S.B., Eds.; Springer Berlin Heidelberg: Berlin/Heidelberg, Germany, 2004; pp. 123–143. [Google Scholar]
  25. Aliev, K.; Antonelli, D.; Bruno, G. Task-based Programming and Sequence Planning for Human-Robot Collaborative Assembly. IFAC-PapersOnLine 2019, 52, 1638–1643. [Google Scholar] [CrossRef]
  26. Ende, T.; Haddadin, S.; Parusel, S.; Wüsthoff, T.; Hassenzahl, M.; Albu-Schäffer, A. A human-centered approach to robot gesture based communication within collaborative working processes. In Proceedings of the 2011 IEEE/RSJ International Conference on Intelligent Robots and Systems, San Francisco, CA, USA, 25–30 September 2011; pp. 3367–3374. [Google Scholar] [CrossRef] [Green Version]
  27. Rosi, G.; Vignali, G.; Bottani, E. A Conceptual Framework for the Selection of an “Industry 4.0” Application to Enhance the Operators’ Safety: The Case of an Aseptic Bottling Line. In Proceedings of the 2018 IEEE International Conference on Engineering, Technology and Innovation (ICE/ITMC), Stuttgart, Germany, 17–20 June 2018; pp. 1–9. [Google Scholar] [CrossRef]
  28. Pini, F.; Leali, F. Human-robot collaborative reconfigurable platform for surface finishing processes. Procedia Manuf. 2019, 38, 76–83. [Google Scholar] [CrossRef]
  29. Hu, J.; Kabir, A.M.; Hartford, S.M.; Gupta, S.K.; Pagilla, P.R. Robotic deburring and chamfering of complex geometries in high-mix/low-volume production applications. In Proceedings of the2020 IEEE 16th International Conference on Automation Science and Engineering (CASE), Hong Kong, China, 20–21 August 2020; pp. 1155–1160. [Google Scholar] [CrossRef]
  30. Byner, C.; Matthias, B.; Ding, H. Dynamic speed and separation monitoring for collaborative robot applications–Concepts and performance. Robot. Comput.-Integr. Manuf. 2019, 58, 239–252. [Google Scholar] [CrossRef]
  31. Awouda, A.; Aliev, K.; Chiabert, P.; Antonelli, D. Practical Implementation of Industry 4.0 Based on Open Access Tools and Technologies. In Product Lifecycle Management in the Digital Twin Era; Fortin, C., Rivest, L., Bernard, A., Bouras, A., Eds.; Springer International Publishing: Cham, Switzerland, 2019; pp. 94–103. [Google Scholar]
  32. Khalid, A.; Kirisci, P.; Ghrairi, Z.; Thoben, K.D.; Pannek, J. A methodology to develop collaborative robotic cyber physical systems for production environments. Logist. Res. 2016, 9, 23. [Google Scholar] [CrossRef]
  33. RTDE Protocol Universal Robots. Available online: https://www.universal-robots.com/articles/ur/real-time-data-exchange-rtde-guide/ (accessed on 20 January 2021).
  34. MODBUS SERVER Universal Robots. Available online: https://www.universal-robots.com/articles/ur/modbus-server/ (accessed on 20 January 2021).
  35. García, S.; Luengo, J.; Herrera, F. Data Preprocessing in Data Mining; Springer: Berlin, Germany, 2015. [Google Scholar]
  36. Twala, B.; Cartwright, M. Ensemble missing data techniques for software effort prediction. Intell. Data Anal. 2010, 14, 299–331. [Google Scholar] [CrossRef]
  37. Myrtveit, I.; Stensrud, E.; Olsson, U.H. Analyzing data sets with missing data: An empirical evaluation of imputation methods and likelihood-based methods. IEEE Trans. Softw. Eng. 2001, 27, 999–1013. [Google Scholar] [CrossRef] [Green Version]
  38. Al Shalabi, L.; Shaaban, Z.; Kasasbeh, B. Data mining: A preprocessing engine. J. Comput. Sci. 2006, 2, 735–739. [Google Scholar] [CrossRef] [Green Version]
  39. Kuhn, M.; Johnson, K. Applied Predictive Modeling; Springer: Berlin, Germany, 2013; Volume 26. [Google Scholar]
  40. Daoud, J.I. Multicollinearity and regression analysis. In Journal of Physics: Conference Series; IOP Publishing: Bristol, UK, 2017; Volume 949, p. 012009. [Google Scholar]
  41. Liu, H.; Motoda, H. Feature transformation and subset selection. IEEE Intell. Syst. Their Appl. 1998, 13, 26–28. [Google Scholar]
  42. Gareth, J.; Daniela, W.; Trevor, H.; Robert, T. An Introduction to Statistical Learning: With Applications in R; Spinger: Berlin, Germany, 2013. [Google Scholar]
  43. H2O 3 H2O.ai. Available online: https://docs.h2o.ai/h2o/latest-stable/h2o-docs/welcome.html# (accessed on 8 February 2021).
  44. Halvari, T.; Nurminen, J.K.; Mikkonen, T. Testing the Robustness of AutoML Systems. arXiv 2020, arXiv:2005.02649. [Google Scholar]
  45. Feurer, M.; Klein, A.; Eggensperger, K.; Springenberg, J.; Blum, M.; Hutter, F. Efficient and robust automated machine learning. In Advances in Neural Information Processing Systems; MIT Press: Cambridge, MA, USA, 2015; pp. 2962–2970. [Google Scholar]
  46. Olson, R.S.; Moore, J.H. TPOT: A tree-based pipeline optimization tool for automating machine learning. In Proceedings of the Workshop on Automatic Machine Learning, PMLR, New York, NY, USA, 24 June 2016; pp. 66–74. [Google Scholar]
  47. Jin, H.; Song, Q.; Hu, X. Auto-keras: An efficient neural architecture search system. In Proceedings of the 25th ACM SIGKDD International Conference on Knowledge Discovery & Data Mining, Anchorage, AK, USA, 4–8 August 2019; pp. 1946–1956. [Google Scholar]
  48. LeDell, E.; Poirier, S. H2o automl: Scalable automatic machine learning. In Proceedings of the AutoML Workshop at ICML, Nashville, TN, USA, 8–12 July 2020; Volume 2020. [Google Scholar]
  49. Milutinovic, M.; Schoenfeld, B.; Martinez-Garcia, D.; Ray, S.; Shah, S.; Yan, D. On evaluation of automl systems. In Proceedings of the ICML Workshop on Automatic Machine Learning, Tahoe City, CA, USA, 17–18 July 2020. [Google Scholar]
  50. Feurer, M.; Klein, A.; Eggensperger, K.; Springenberg, J.T.; Blum, M.; Hutter, F. Auto-sklearn: Efficient and robust automated machine learning. In Automated Machine Learning; Springer: Cham, Switzerland, 2019; pp. 113–134. [Google Scholar]
  51. Kotthoff, L.; Thornton, C.; Hoos, H.H.; Hutter, F.; Leyton-Brown, K. Auto-WEKA 2.0: Automatic model selection and hyperparameter optimization in WEKA. J. Mach. Learn. Res. 2017, 18, 826–830. [Google Scholar]
Figure 1. Recent publications of human-robot collaborative (HRC) applications in the three aforementioned domains.
Applsci 11 01621 g001
Figure 2. On-line monitoring framework.
Applsci 11 01621 g002
Figure 3. HRC application processes: the figure on the left demonstrates the HRC assembly process; The figure on the right demonstrates the cobot transporting assembled components to the target position.
Applsci 11 01621 g003
Figure 4. Correlation matrix of joint 0.
Applsci 11 01621 g004
Figure 5. Correlation of joint 1.
Applsci 11 01621 g005
Figure 6. Correlation of joint 2.
Applsci 11 01621 g006
Figure 7. Correlation of joint 3.
Applsci 11 01621 g007
Figure 8. Correlation of joint 4.
Applsci 11 01621 g008
Figure 9. Correlation of joint 5.
Applsci 11 01621 g009
Figure 10. Box-plot of the Load with the Temperature.
Applsci 11 01621 g010
Figure 11. Box-plot of the Load and the Power.
Applsci 11 01621 g011
Figure 12. Box-plot of the Load with the Speed.
Applsci 11 01621 g012
Figure 13. Temperature prediction results under different conditions.
Applsci 11 01621 g013
Figure 14. Performance of the AutoML algorithms.
Applsci 11 01621 g014
Figure 15. Importance of the variables on the different models.
Applsci 11 01621 g015
Table 1. Human-robot interaction (HRC) applications.
HRC ApplicationsDeployed TasksImportant Parameters for HRC
AssemblyHRC assembly in a shared workspace [25]End-effector force;
Manual guidance collaborative assembly [14]Payload monitoring;
HRC integrated automotive assembly [15]Robot Temperature; Joint Speed;
HandlingHazardous material handling [26]End-effector force;
Aseptic bottling using AR [27]Joint position and orientation;
Collaborative surface polishing, sanding [28,29]Robot Force; Joint Speed;
Collaborative robot injection and moulding [30]Speed and separation monitoring
WeldingVirtual reality HRC welding [21]Torque/force sensors; Temperatures;
HRC Welding Cell [22]Position and orientation accuracy;
Spot welding manual guidance using AR [23]Robot Temperature; Joint Speed;
Table 2. Evaluation metrics of the linear regression model.
MetricsDescriptionFormulation
Residual Standard Error (RSE)The Residual Standard Error is a measure of the quality of a linear regression fit. R S E = 1 n 2 R S S
R 2 R squared is the square of the Pearson correlation coefficient between the labels and the predicted values. This metric ranges from zero to one. A higher value indicates a higher quality model. R 2 = 1 ( y i y ^ i ) 2 y i y ^ ) 2 = S S r e g S S t o t
Adjusted R 2 This measures the proportion of variation explained by only those independent variables that really help to explain the dependent variable. In the equation, where R 2 -sample R-square; p-Number of predictors; N-total sample size R ¯ 2 = 1 ( 1 R 2 ) ( N 1 ) ) N p 1
F-scoreThis makes it possible to compute the variance of the dependant variable, the simpler model is not able to explain as much as the complex model. In the equation k 1 and k 2 are parameters of two models F - s t a t i s t i c s = ( R S S 1 R S S 2 k 2 k 1 ) ( R S S 2 n k 2 )
p-valueThis is a statistical test that determines the probability of extreme results of the statistical hypothesis test, and which takes the Null Hypothesis to be correct.
Table 3. Evaluation metrics of the classification model.
MetricsDescription of the Metrics
AUC PRThe area under the precision-recall (PR) curve. This value ranges from zero to one, and a higher value indicates a higher-quality model.
AUC ROCThe area under the receiver operating characteristic (ROC) curve. This ranges from zero to one, and a higher value indicates a higherquality model.
AccuracyThe fraction of classification predictions produced by the model that were correct.
Log lossThe cross-entropy between the model predictions and the target values. This ranges from zero to infinity, and a lower value indicates a higher-quality model.
RMSEThe root-mean-square error metric is a frequently used measure of the differences between the values predicted by a model, or an estimator, and the observed values. This metric ranges from zero to infinity; a lower value indicates a higher quality model.
MSEThis is an estimator that measures the average of the squares of the errors, that is, the average squared difference between the estimated values and the actual values
Feature importanceAutoML generates tables that indicate how much each feature impacts a specific model. The values are provided as a percentage of each feature: the higher the percentage is, the more that feature impacts model training.
Table 4. Performances of the general linear model when predicting the cobot temperature.
Experimental SetupsRes. Std. Err.Multiple R-SquaredAdjusted R-SquaredF-Statisticp-Value
UR3 with all the data1.8650.95290.934652.02<1.163 × 10 10
UR3 with the Max.Load0.14220.91520.91513.347 × 10 4 <2.2 × 10 16
UR3 with the Medium Load0.3640.15710.1569578.3<2.2 × 10 16
UR3 with the Min. Load0.38320.39520.3952027<2.2 × 10 16
Table 5. Performances of the linear regression model when predicting the robot temperature.
Input VariablesEstimateStd. Errort ValuePr(>|t|)
Intercept1.195 × 10 + 3 1.375 × 10 + 3 0.869<0.396248
LOAD1.208 × 10 + 1 1.041 × 10 + 0 11.6118.56 × 10 10
JOINT_01.534 × 10 + 0 2.694 × 10 1 5.6932.13 × 10 5
SPEED_ROBOT−6.107 × 10 2 1.411 × 10 2 −4.3270.000406
TIME−7.458 × 10 7 8.761 × 10 7 −0.8510.405837
CURRENT5.800 × 10 + 1 2.902 × 10 + 1 1.9990.060971
VOLTAGE1.048 × 10 10 2.652 × 10 10 0.3950.697487
POWER−4.051 × 10 10 2.063 × 10 10 −1.9640.065163
Table 6. Results of different models used to predict safety stops using the automatic machine learning.
Model_idAUCloglossaucprrmsemse
GBM_1_AutoML_20201030_1604480.9820.0520.9210.1090.012
GBM_grid__1_AutoML_20201030_160448_model_30.9790.0550.9130.1120.012
XRT_1_AutoML_20201030_1604480.9790.0550.9270.1060.011
DRF_1_AutoML_20201030_1604480.9790.0590.9270.1050.011
DeepLearning_grid__2_AutoML_20201030_160448_model_10.9130.1070.7660.1500.022
DeepLearning_grid__1_AutoML_20201030_160448_model_10.9070.1410.7490.1520.023
DeepLearning_grid__3_AutoML_20201030_160448_model_10.9040.1200.7540.1510.023
DeepLearning_1_AutoML_20201030_1604480.8830.1160.7440.1530.023
GLM_1_AutoML_20201030_1604480.8350.1140.6870.1530.023
Publisher’s Note: MDPI stays neutral with regard to jurisdictional claims in published maps and institutional affiliations.