Article

Relationship between the Difference in Oxygenated Hemoglobin Concentration Changes in the Left and Right Prefrontal Cortex and Cognitive Function during Moderate-Intensity Aerobic Exercise

Institute for Human Movement and Medical Science, Niigata University of Health and Welfare, Niigata-shi 950-3198, Japan
*
Author to whom correspondence should be addressed.
Appl. Sci. 2021, 11(4), 1643; https://doi.org/10.3390/app11041643
Submission received: 16 December 2020 / Revised: 3 February 2021 / Accepted: 6 February 2021 / Published: 11 February 2021
(This article belongs to the Special Issue Optical Measuring Methods for Application in Biology and Medicine)

Abstract

:
Previous studies have indicated that changes in oxygenated hemoglobin concentration (O2Hb) in the prefrontal cortex (PFC) are associated with changes in cognitive function. Therefore, the present study aimed to explore the effect of differences in O2Hb levels in the left and right PFC (L-PFC and R-PFC, respectively) on cognitive function after exercise. This study included 12 healthy male college students. The exercise regimen consisted of 4 min of warm-up and rest each, followed by 20 min of moderate-intensity exercise and 20 min of post-exercise rest. Participants underwent the 2-back cognitive test thrice (pre-exercise, post-exercise, and after the 20 min post-exercise rest period), and their reaction times were recorded. O2Hb levels in the PFC were monitored using functional near-infrared spectroscopy. We analyzed the correlations between changes in post-exercise reaction times and differences in peak O2Hb levels (L-PFC minus R-PFC), area under the curve for O2Hb changes, and increases in the O2Hb slope during exercise. Peak O2Hb, area under the curve (AUC) for O2Hb change, and increase in the slope of O2Hb were significantly correlated with changes in reaction time. These findings provide insight into the mechanism by which O2Hb differences between the L-PFC and R-PFC affect cognitive function.

1. Introduction

Numerous studies have shown that physical activity can enhance cognitive function [1,2,3,4]. According to epidemiological studies, 115 million individuals worldwide will exhibit cognitive dysfunction by 2050 [5]. However, this estimate could plummet by approximately 9.2 million patients by the year 2050, if interventions could delay disease onset or progression by as little as 1 year [6]. Therefore, improving cognitive function through physical activity is essential to delay the onset of cognitive disorders.
Previous studies have demonstrated that changes in cognitive function are associated with changes in vascular flow to the prefrontal cortex (PFC) [7,8], as activation of the PFC is reflective of cognitive function [9,10]. Areas of high neural activity are characterized by increased oxygen consumption and enhanced blood supply, which ensure the requisite supply of oxygenated hemoglobin (O2Hb) [11,12]. The human brain, despite representing only 2–3% of the total body mass, requires approximately 15% of the total cardiac output and utilizes approximately 20% of the total oxygen consumption at rest [13,14,15]. Precise control of the nutrient supply and byproducts is essential for the maintenance of cerebral blood flow, given the brain’s high energy consumption and lack of substantial intracellular energy stores. During exercise, the cardiovascular system is challenged by the need to increase the blood supply to the muscles due to a surge in their activity while maintaining adequate blood supply to vital organs such as the heart, lungs and, most importantly, the brain. Therefore, it is necessary to understand changes in cerebral blood flow during exercise to ensure normal brain function and sustain life.
Functional near-infrared spectroscopy (fNIRS) facilitates continuous and noninvasive monitoring of changes in blood flow in various areas of the brain via near-infrared reflection [16]. When the nerve is excited, the capillaries expand to increase cerebral hemoglobin content, in order to meet the energy consumption requirements during excitation [17]. Therefore, changes in neural excitability can be understood by observing changes in cerebral hemoglobin content in the relevant brain areas [18]. In addition, fNIRS is more convenient and efficient than traditional functional magnetic resonance imaging with respect to imaging time and patient position, as the latter requires the patient to remain in the supine position for an extended period of time [19]. Numerous sports medicine and brain science studies have utilized fNIRS because it allows for continuous monitoring in multiple positions [20,21,22].
The research in 2010 showed that the cognitive function in acute moderate-intensity exercise (50% peak VO2) significantly improved after 15 min of exercise compared with that before exercise [23]. However, this study did not confirm when the improvement of cognitive function began after exercise. Therefore, we set up cognitive tasks before exercise, immediately after exercise, and after exercise rest. Moreover, most studies focus on the changes in cognitive function before and after exercise, and the changes in cerebral blood flow during exercise [24,25,26]. However, little attention has been paid to the changes in cognitive function after exercise, which is very important for the treatment of the cognitive disorder. Therefore, we use the difference in cognitive tasks performance immediately after exercise and after exercise rest to express the changes in cognitive function during the rest period after exercise. To explore the relationship between cerebral blood flow changes during exercise and cognitive function changes after exercise rest.
Several studies have used PFC activation to represent cognitive function [27]. However, other studies have demonstrated differences in the functions of the left and right PFC (L-PFC and R-PFC, respectively). Activation of the L-PFC is related to cognitive function, while activation of the R-PFC is related to inhibition [28,29,30,31,32]. Previous studies have focused considerable attention on the functional differences between the L-PFC and R-PFC caused by their respective neural activation [33,34]. However, the differences between the neural activation of the L-PFC and R-PFC remain unclear. It is known that when one side of the cerebral cortex is activated, the other side is inhibited, in order to improve the efficiency of information processing, which is called brain asymmetry [35,36,37]. When this asymmetry is reflected in specific cognitive tasks, it is not clear whether the greater the difference between L-PFC and R-PFC, the greater the improvement of cognitive function. Therefore, the difference between L-PFC and R-PFC especially left-dominant PFC activation has become our focus. Therefore, in the present study, we explored the effect of cognitive function after exercise, via the difference between O2Hb levels in the L-PFC and R-PFC during exercise.

2. Materials and Methods

2.1. Participants

Twelve healthy right-handed adult men (average age ± standard deviation: 22.2 ± 1.5 years) were enrolled in this study. None of the participants had a habit of exercising for at least 6 months. Participants were prohibited from eating and consuming caffeine 3 h before the commencement of the experiment. On the night before the experiment, all participants slept for more than 7 h. Before the experiment, we noted the participants’ bedtime and wake-up time to ensure enough sleep time. Participants with respiratory, circulatory, and neurological diseases were excluded from this study. Participants were informed regarding the purpose and safety of the experiment and provided informed consent prior to enrollment. This study was approved by the ethics committee of Niigata University of Health and Welfare (approval number: 17911-171110) and was conducted in accordance with the tenets of the Declaration of Helsinki.

2.2. Procedures

There is an inverted U-shaped relationship between exercise intensity and improvement of cognitive function. The peak of the cognitive function corresponds to moderate-intensity exercise [38,39]. Moderate-intensity aerobic exercise is defined as that requiring 50% of the peak oxygen consumption (VO2), based on the classification of the American College of Sports Medicine exercise levels [40]. Research has shown that moderate-intensity aerobic exercise has a significant effect on cognitive function [41,42]. A comparison of different durations of exercise revealed that exercise of medium duration (20 min) was more effective in improving cognitive function than short (10 min) and long durations (40 min) [43]. Therefore, we utilized a 20 min moderate-intensity exercise protocol to examine improvements in cognitive function.
Peak VO2 was determined via a cardiopulmonary exercise test (CPET), which was conducted before the main experiment. Our protocol consisted of a 4 min rest, 4 min warm-up, cardiopulmonary exercise, and 2 min cool-down. A ramp program with an incremental increase in the workload of 20 W/min was employed using stationary bicycles (Aerobike 75XLIII; Konami, Tokyo, Japan) and an exhaled gas analyzer (AE-310S; Minato Medical Science, Osaka, Japan). All subjects were instructed to maintain a cadence of 50 rotations per minute (rpm) during the cardiopulmonary exercise test [44]. Exhaustion was defined as follows [45] (1): a plateau in oxygen consumption (VO2); (2) respiratory exchange ratio >1.1; (3) HR values near the age-predicted maximal heart rate, calculated as 220 − (0.65 × age); (4) a decrease in the cycling cadence to <50 rpm, despite strong verbal encouragement. The highest value obtained for VO2 was considered the VO2 peak. An interval of more than 1 week was maintained between the CPET and main experiment.
Participants sat on a bicycle ergometer in a natural sitting position, and then performed the pedaling exercise; the composition of respiratory gas was monitored simultaneously. After 4 min each of rest, the exercise intensity of the warm-up was set at 20 W and lasted 4 min. The 20 min exercise session was initiated at a workload corresponding to 50% peak VO2, followed by 20 min of rest post-exercise. Participants performed a 2-back test three times during the pre-exercise period (pre), immediately after the exercise period (post1), and after the 20 min post-exercise rest period (post2). Their reaction times were recorded. fNIRS was used to monitor the differences in the fluctuation of oxygen concentration in the PFC during the entire experiment.

2.3. Cognitive Function Test

This study used the n-back test, which has been used to examine cognitive function in numerous studies of cognition [46,47,48]. The n-back test exhibits a good ability to detect updating of attention in working memory (i.e., the function of recalling and responding quickly after memory formation) [49]. However, one study found that the reaction speed and accuracy of the training significantly improved after 5 weeks of n-back test training, when compared with those observed in the O2Hb control group [50]. Therefore, we organized cognitive function practice sessions to eliminate the effect of unfamiliarity on the final results.
Relevant research has shown that the 2-back test can accurately reflect changes in cognitive performance before and after exercise [51]. Therefore, we utilized the 2-back test to measure cognitive function in the present study. The 2-back test, which was introduced by Deschuytenee et al. [52], uses reaction times as measures of the working memory updating function (Figure 1). The 2-back test was created using test creation software (SuperLab 4, Cedrus) and displayed on a laptop screen. In this test, participants were required to perform 12 questions comprising addition of numbers from 0 to 9. After each calculation, participants were required to remember the last digit of the result and select the appropriate digit prior to the next two questions. Therefore, no answer was required for the first and second trials. Subsequently, participants used the last digit of the result of the first calculation for the third calculation. There was no calculation for numbers 11 and 12 in the sequence, as participants were only required to report the results of numbers 9 and 10 in the sequence [52].
Participants were provided with a complete explanation of the test, followed by instructions to relax with their eyes open and place their hands on the keyboard. The system advanced to the next calculation once a choice was made, irrespective of whether the participant chose the correct answer. The test results whose accuracy rates differed significantly from those of other participants were excluded from the analysis. In many experiments using 2-back, reaction time was recorded and compared as a measure of working memory [53,54,55]. Therefore, this study also recorded the reaction time and the accuracy of the 2-back test as a measure of working memory.

2.4. fNIRS

fNIRS can be used to measure neuronal activity-dependent changes in hemoglobin by measuring variations in the light transmitted through the cerebral cortex [56]. We used fNIRS to monitor the changes in O2Hb, deoxyhemoglobin (HHb), and total hemoglobin (THb) in PFC, and these signals recorded through the experiment from pre-exercise rest to post-exercise rest.
This study used 24 channels of fNIRS (OMM-3000; Shimadzu Corporation, Kyoto. Japan), and the distance between the emission probe and detector probe was set to 3.0 cm. Fpz (On the line from the root of nose to protuberance occipitalis externa, starting from the root of nose, a point at 10% of the total length is defined as Fpz) was positioned on channel 2 in accordance with the International 10–20 system (Figure 2). Although the fNIRS data included three measures of cerebral hemoglobin concentration (i.e., O2Hb, HHb, and THb), we used changes in the concentration of O2Hb for the main statistical analysis because it is considered to be the most reliable indicator of the changes in regional cerebral blood flow [57,58]. O2Hb data were averaged at each channel, and a 0.1 Hz low pass filter was used to decrease noise from the heartbeat [59,60]. The device used in this study and in previous studies [61,62] can measure the cerebral hemoglobin concentration using three differential continuous waves (780 nm, 804 nm, and 830 nm), and is based on the modified Beer–Lambert law [63]. That is because, for each wavelength, absorbance at the start of measurement was defined as the initial absorbance. As it was not possible to measure the differential path-length factor using the continuous-wave NIRS system, it was assumed that it was constant, and hemoglobin signal changes were denoted in arbitrary units of millimolar-centimeter (mM · cm) [64,65].

2.5. Mean Arterial Pressure (MAP), Heart Rate (HR), and Skin Blood Flow (SBF)

The light source of NIRS is outside the brain, and the light needs to pass through the superficial skin of the head; changes in blood flow in the superficial skin may therefore affect the NIRS data [66,67]. The blood flow in the scalp is also affected by HR and MAP [68]. The change in PFC blood flow is reflected in the change in THb. However, to distinguish cerebral blood flow from superficial skin blood flow, we used other instruments to measure superficial skin that could better target these differences.
We continuously and simultaneously measured finger arterial blood pressure using the photoplethysmographic volume-clamp method (Finometer, Finepress Medical Systems) with subsequent brachial arterial pressure reconstruction to the participants’ systolic (SBP) and diastolic blood pressure (DBP). The mean arterial pressure (MAP) was calculated as (SBP-DBP)/3+DBP [69,70]. Heart rate (HR) was measured via impedance cardiography using the Physioflow Q-Link (PF07 Q-Link, Manatec Biomedical. Folschviller. France). Skin blood flow (SBF) was measured using a laser tissue blood flow meter (OMEGAFLOW FLO-CI, Omega Wave, Inc. Tokyo. Japan) with the contact disk probe DS in contact with the forehead.

2.6. Statistical Analysis

First, we calculated VO2, HR, and load in moderate-intensity exercise and CPET, respectively, to determine whether the moderate-intensity exercise is carried out according to the standard of 50% of the peak VO2. The related parameters of moderate-intensity exercise are the average values of 20 min moderate-intensity exercise, and the parameters of CPET are the highest values of CPET. VO2 was calculated by dividing the VO2 of each subject by body weight (mL/kg/min).
Subsequently, the accuracy rate and reaction time for the 2-back test (pre, post1, and post2) were analyzed using a one-way analysis of variance (ANOVA). The presence/absence of significant changes in cognitive function were analyzed by comparing cognitive function at post1 and post2 with that at pre. The average pre-exercise rest levels of O2Hb were calculated for the L-PFC, while O2Hb, MAP, HR, and SBF were calculated for the R-PFC. We also calculated changes per minute for each variable during and after exercise. The pre-exercise and post-exercise values were compared using one-way ANOVA to determine the presence of significant changes in the above-mentioned data during the whole experimental process.
Finally, we examined the correlation between differences in O2Hb during exercise (L-PFC minus R-PFC) and changes in reaction time after exercise rest (post2–post1) from three perspectives: (1) peak O2Hb, (2) area under the O2Hb curve (AUC O2Hb), and (3) increase in the slope of O2Hb [71,72,73]. These three calculation methods, respectively, represented the following: (1) whether the improvement in cognitive function depended on the increase in O2Hb levels, (2) whether the improvement in cognitive function depended on the significant increase in and maintenance of O2Hb for a sufficient period of time, and (3) whether the improvement in cognitive function depended on the speed of the elevation in O2Hb levels. To explore the relationship between blood flow changes and cognitive function changes after exercise, post1 represents the cognitive function immediately after exercise, and post2 represents the cognitive function after 20 min of rest after exercise. Therefore, we use post2–post1 to represent the changes in cognitive function during the rest period after exercise. Post hoc comparisons were performed using the Tukey–Kramer method. Statistical significance was set at p < 0.05.

3. Results

3.1. Related Parameters of Exercise Intensity

Table 1 shows the parameters associated with exercise intensity. VO2 of average value during 20 min moderate-intensity exercise was 58% of that of peak value during CPET. The HR of average value during 20 min moderate-intensity exercise was 78% of that of peak value during CPET. A load of average value during 20 min moderate-intensity exercise is 48% of that of peak value during CPET.

3.2. 2-Back Test

Table 2 shows the differences in reaction times on the 2-back test before and after exercise. The reaction times for post1 and post2 were significantly shorter than those for pre (p < 0.05).

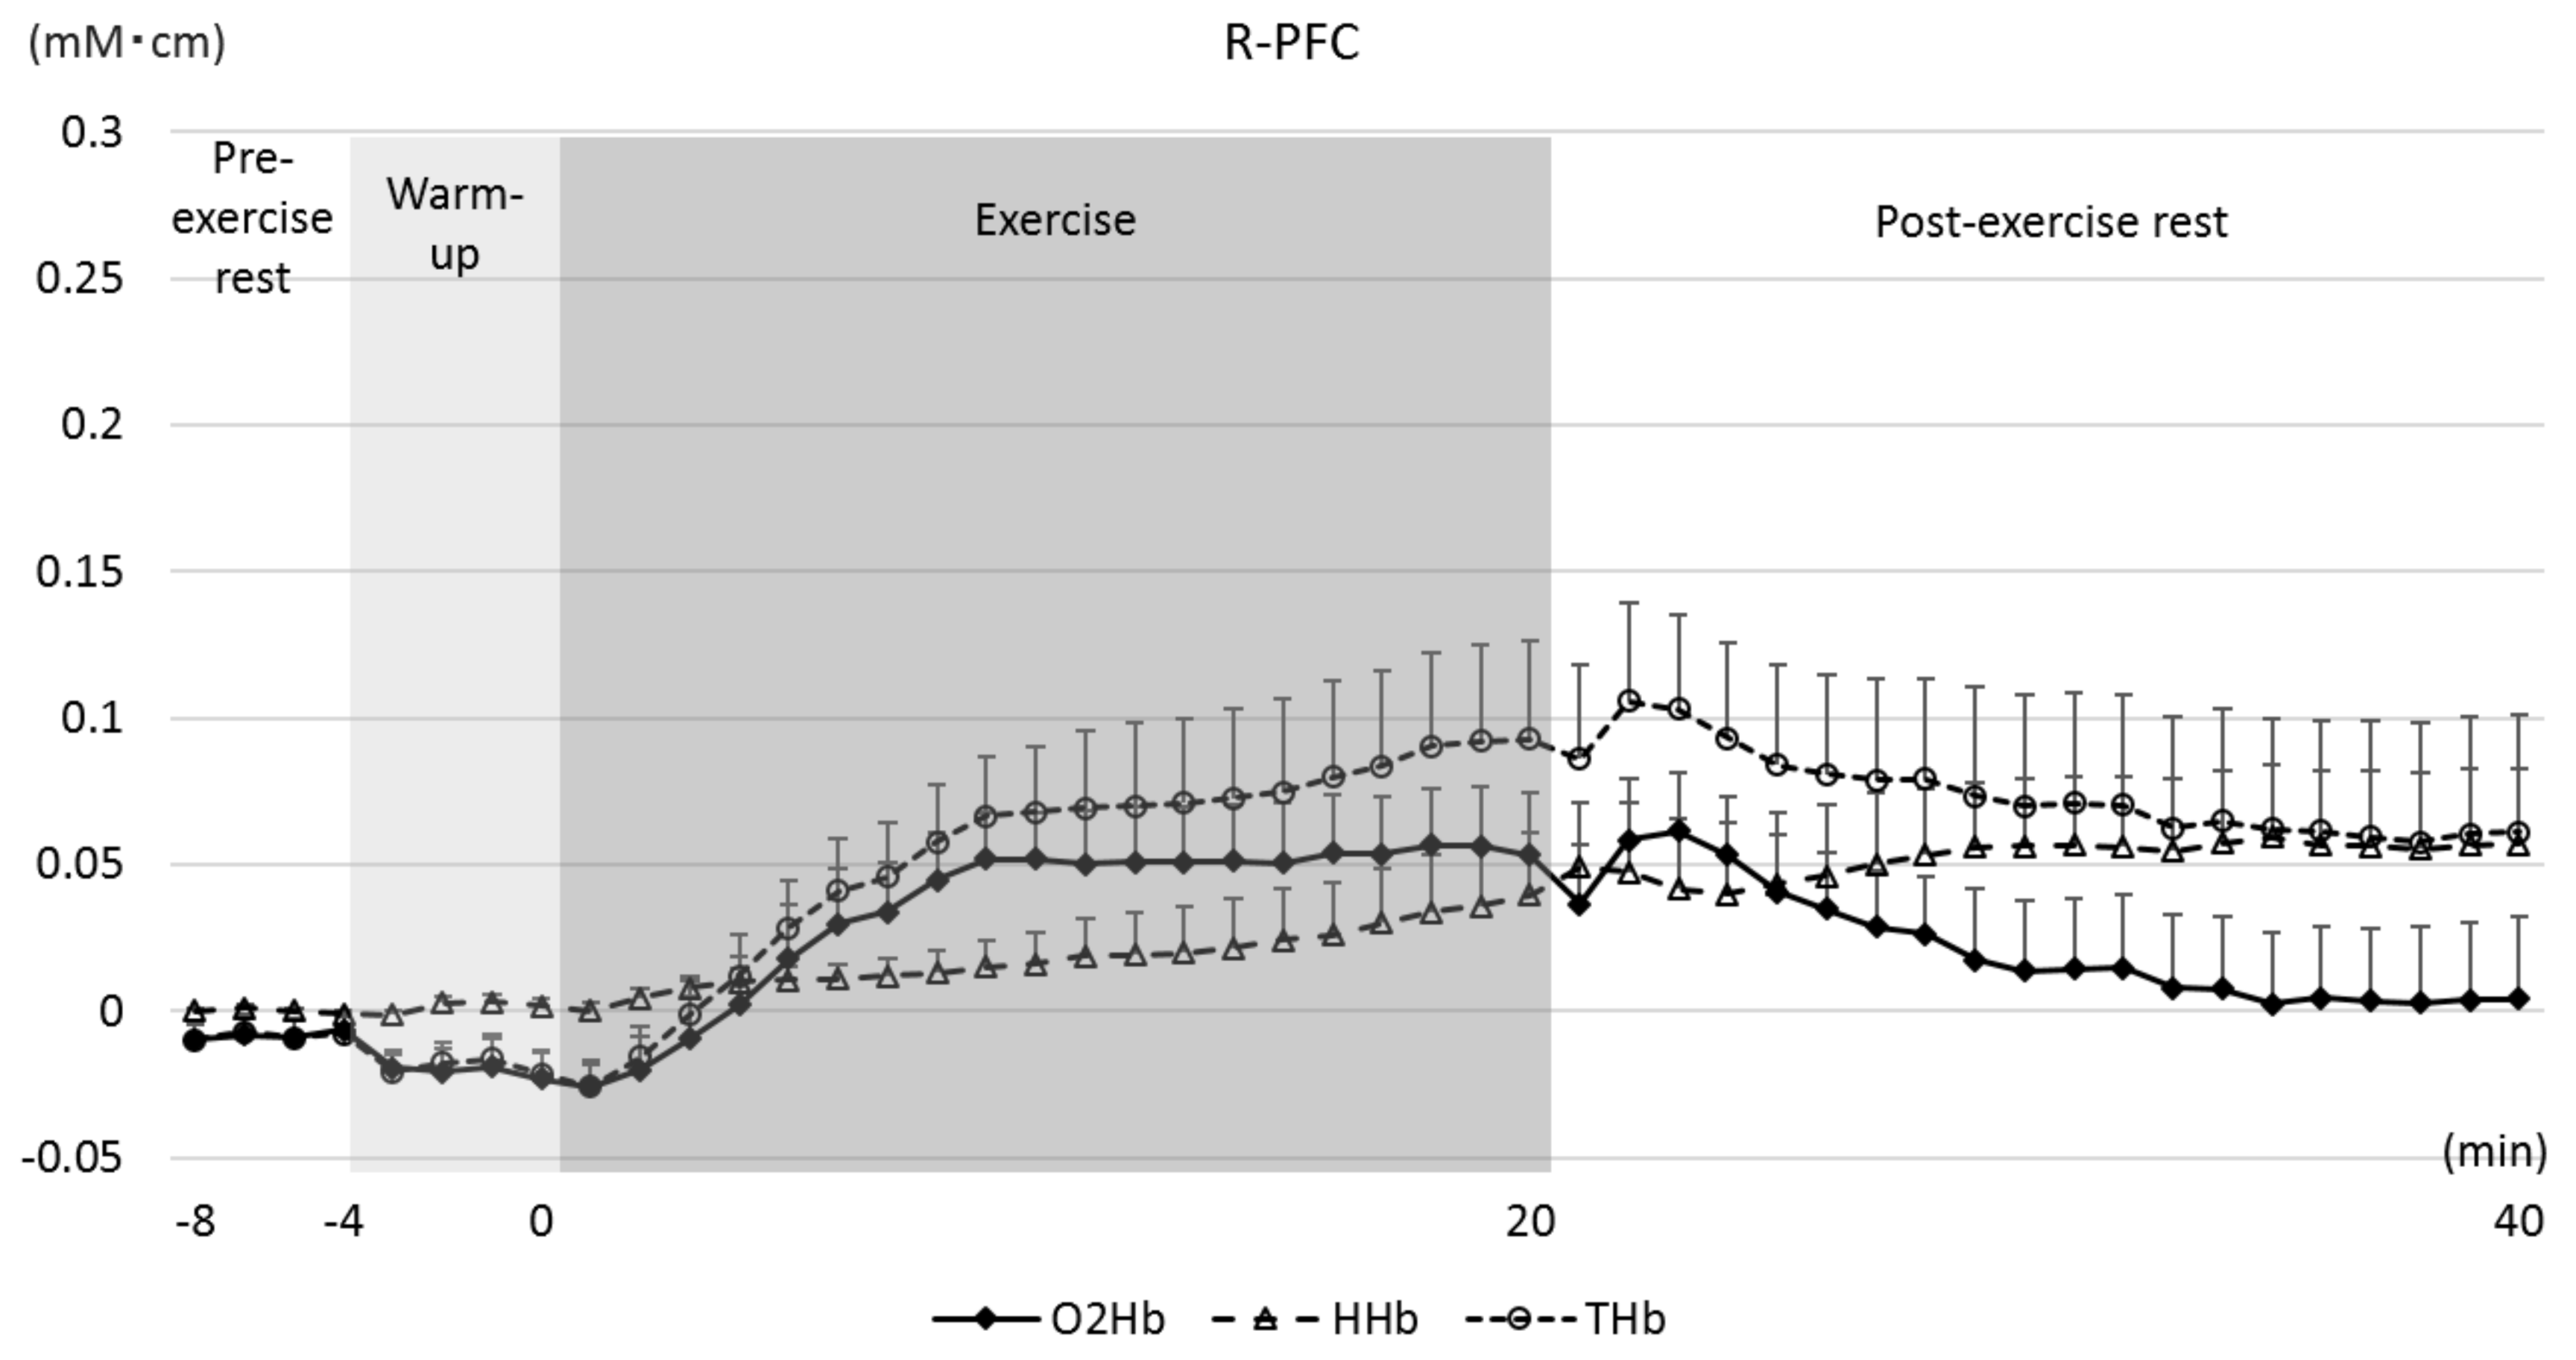
3.3. O2Hb in the L-PFC and R-PFC

Figure 3 and Figure 4 depict the changes in O2Hb levels in the L-PFC and R-PFC. The O2Hb concentrations increased significantly in the L-PFC during 15 to 20 min of exercise and 2 to 4 min of rest after exercise when compared to those at rest (F (44, 495) = 3.862, p < 0.01). No significant changes were observed in the R-PFC (F (44, 495) = 1.188, p = 0.200).

3.4. MAP, HR, and SBF

Although the one-way ANOVA revealed significant changes in MAP, (F (44, 495) = 2.270, p < 0.01), no significant changes were observed in the post hoc analysis.
HR increased significantly from 1 min of exercise to 16 min of rest after exercise (F (44, 495) = 23.022, p < 0.01).
Significant improvement in SBF was observed from 12 min of exercise to 4 min of rest after exercise (F (44, 495) = 6.454, p < 0.01).

3.5. Correlation Coefficients

Correlation analysis revealed that changes in reaction time were negatively correlated with the difference in peak O2Hb levels in the L-PFC and R-PFC (r = −0.61; p < 0.05) (Figure 5), AUC O2Hb (r = −0.62; p < 0.05) (Figure 6) and increases in the slope of O2Hb (r = −0.73; p < 0.01) (Figure 7).

4. Discussion

The purpose of this study was to explore the improvement in cognitive function induced by acute moderate-intensity aerobic exercise and the effect of the difference between the oxyhemoglobin concentrations in the left and right PFC on cognitive function. The findings of this study were as follows. First, the reaction time during post1 and post2 decreased significantly compared to that during pre. Second, the respective differences in the peak O2Hb concentration, AUC O2Hb, and increase in the slope of O2Hb were correlated with changes in reaction time before and after rest. To establish the relationship between O2Hb changes and the results of the cognitive task, left–right asymmetry in O2Hb and its slope, peak, and AUC were used as indicators of neural activation. Our study provides a new method for O2Hb analyses based on cerebral localization.

4.1. Related Parameters of Exercise Intensity

In moderate-intensity exercise, the VO2 reaches 58% of the peak value of CPET. We believe that this is due to the relative delay in the increase in VO2 compared to that of the exercise load [74,75]. Therefore, the VO2 value of moderate-intensity exercise is slightly higher than of half of the peak value of CPET. The range of VO2 in moderate-intensity exercise has been reported to be 40–60% [76]; the exercise intensity in this study was always maintained at a moderate intensity. The HR in moderate-intensity exercise reached 78% of the peak value of CPET. In other studies, 70–85% peak HR was usually observed with moderate-intensity exercise [77,78,79]. Finally, the average load of moderate-intensity exercise reached 48% of the peak value of CPET. Comprehensive judgment therefore suggests the exercise intensity in our study to be moderate.

4.2. Reaction Time

The improvement in cognitive function as evidenced by the reduction in the response time of the 2-back test before and after exercise was consistent with that observed in other studies [80,81]. Moreover, this study also found that such improvements could last for 20 min after exercise. This improvement was also observed in studies among older adults. Ludyga et al. provided evidence that acute aerobic exercise can improve performance on tests requiring high executive control, and that the effect was not affected by age, aerobic adaptability, and executive function components [82]. Interestingly, some components of cognitive function improved in experiments using a single exercise condition, although total cognitive function remained unchanged [83]. Even when the single exercise condition is changed to acute combined exercise to increase the load on cognitive function, some studies have shown that cognitive performance is enhanced on the naming and performing tests [84], while others have reported no significant difference between the execution test and control groups [85]. The mechanism by which acute exercise selectively improves cognitive function remains unclear. We believe that this improvement may be related to the test type and difficulty experienced by the participant [86]. These aspects require further research and demonstration.

4.3. PFC oxygen Dynamics

Our comparison of the O2Hb signal during the exercise and rest states revealed that PFC oxygenation increased after moderate-intensity exercise, which is consistent with findings reported in previous studies [87]. We observed significant increases in O2Hb concentration in the PFC (i.e., higher PFC oxygenation) through 20 min of moderate-intensity aerobic exercise, which reflected the improvement in cognitive function and reduction in the response time on the 2-back test [88]. However, there was no significant difference between the change in reaction time in post1 and post2, demonstrating that the improvement in cognitive function can last for 20 min after moderate-intensity exercise.
The O2Hb concentration in the R-PFC did not change significantly during the experiment. This is because the L-PFC is the principal area associated with the 2-back test [89]. However, other studies have found evidence of bilateral activity in the PFC with specific cognitive tests [90]. We believe that the discrepancies in these findings may be attributed to the effect of differences in the test types and level of difficulty [91]. Second, bilateral activity is commonly understood to be a compensatory response to cognitive function, which is more common in older adults, as each area in the PFC in young individuals is clearly defined and has its own role [92].
On the other hand, it is well known that proper physical exercise can increase the brain’s glucose intake [93]. The strength of neurogenic components is directly related to glucose uptake [94]. We propose that higher neurogenic activity during exercise may be associated with increased glucose uptake in the PFC, which in turn promotes memory consolidation [95].

4.4. Peak O2Hb Levels, AUC O2Hb, and Increase in the Slope of O2Hb

We observed a significant correlation between the respective differences in the peak O2Hb concentration, AUC O2Hb, and increase in the slope of O2Hb and changes in reaction time before and after exercise rest (p < 0.05). These results are similar to those of previous studies. The difference in the peak O2Hb levels signifies the effects of the dissimilarities in the maximum O2Hb values in the L-PFC and R-PFC on cognitive function [50]. The difference in the AUC O2Hb represents the effect of the increase in O2Hb levels and its duration in the L-PFC and R-PFC [71]. The difference in the increase in the slope of O2Hb demonstrates the effect of the rate of increase in O2Hb levels in the L-PFC and R-PFC [72].
Moreover, the difference between the activation of the L-PFC and R-PFC was correlated with changes in reaction times. However, according to a previous study, activation of the L-PFC reflects domain-specific working memory capacity [84]. In contrast, R-PFC was associated with inhibition function [31]. The respective differences in the peak O2Hb levels, AUC O2Hb, and increase in the slope of O2Hb (L-PFC minus R-PFC) were negatively correlated with shortened reaction times. This indicates that left-dominant oxygenation may induce improvements in cognitive function. We believe that this finding may be attributable to the asymmetry between the left and right hemispheres [85,86].

4.5. MAP, HR, and SBF

We used the difference in O2Hb between the L-PFC and R-PFC as a marker of neural activation in this study. This methodology may minimize the effect of MAP, HR, and SBF on O2Hb signal changes. If MAP, HR, and SBF have a great influence on O2Hb, the difference in O2Hb between L-PFC and R-PFC may be small because O2Hb may change bilaterally with a similar amplitude. However, our results indicated laterality characterized by L-PFC dominance during the experiment. Therefore, the difference in O2Hb between the L-PFC and R-PFC may indicate left-dominant PFC activation with small effects of these physiological signals. We measured SBF in 0.5 –1 mm depth using other instruments, and it can discriminate PFC blood flow recording by fNIRS and SBF which indicate the changes in hemoglobin in capillaries of the skin during exercise [96].

4.6. Limitations

First, the study population was restricted to young men. Thus, our results cannot fully explain the influence of O2Hb on cognitive function in older adults. Second, while our experimental sample size is not large, it is necessary to balance a sample size with ethical considerations. However, based on previous research, we think that an even smaller sample size can produce reliable results [97,98].
Finally, besides O2Hb, cognitive function is also affected by glucose, brain-derived neurotrophic factor, and other variables that were not measured in this study.

5. Conclusions

Our results demonstrated that reaction times on the 2-back test immediately after exercise and the 20 min post-exercise rest were significantly shorter than those before exercise. In addition, changes in reaction time immediately after exercise and the 20 min post-exercise rest period were negatively correlated with the difference in O2Hb levels in the L-PFC and R-PFC.
We plan to conduct research to gather evidence on the effect of moderate-intensity exercise on sustained effects of cognitive improvement among the older population or patients with mild cognitive impairment in the future. However, the present study can apply the changes in reaction time between post-exercise rest and immediately after the exercise to estimate the O2Hb increase during moderate-intensity exercise.

Author Contributions

Conceptualization, W.Q., S.K., Y.Y., S.M., K.H., T.I. and A.T.; methodology, W.Q., S.K., Y.Y., S.M., K.H., T.I. and A.T.; software, W.Q., Y.Y., S.K. and A.T.; validation, W.Q., Y.Y. and S.K.; formal analysis, W.Q., Y.Y., S.K. and A.T.; investigation, W.Q.; resources, W.Q.; data curation, W.Q.; writing—original draft preparation, W.Q.; writing—review and editing, W.Q.; visualization, W.Q.; supervision, A.T.; project administration, A.T.; funding acquisition, A.T. All authors have read and agreed to the published version of the manuscript.

Funding

This research was funded by a Grant-in-Aid for Scientific Research (B) from the JSPS (A. Tsubaki) and Grant-in-Aid for Scientific Research (A) from Niigata University of Health and Welfare, 2020 (20H04042, A. Tsubaki).

Institutional Review Board Statement

This study was approved by the ethics committee of Niigata University of Health and Welfare (approval number: 17911-171110) and was conducted in accordance with the tenets of the Declaration of Helsinki (November. 2017).

Informed Consent Statement

The experimental process has been explained in detail to all participants and informed consent has been obtained.

Data Availability Statement

Not applicable.

Conflicts of Interest

The authors declare no conflict of interest.

References

  1. Lebowitz, A.; Nemoto, K.; Ma, N.Y.; Usuniwa, H.; Tamura, M.; Ishikawa, K.; Arai, T. Exercise habit could modulate cognitive benefits from physical and cognitive intervention. Psychiatry Clin. Neurosci. 2018, 72, 189–190. [Google Scholar] [CrossRef] [PubMed] [Green Version]
  2. Herting, M.M.; Chu, X. Exercise, cognition, and the adolescent brain. Birth Defects Res. 2017, 109, 1672–1679. [Google Scholar] [CrossRef] [PubMed]
  3. Torbeyns, T.; De Geus, B.; Bailey, S.; Decroix, L.; Van Cutsem, J.; De Pauw, K.; Meeusen, R. Bike desks in the classroom: Energy expenditure, physical health, cognitive performance, brain functioning, and academic performance. J. Phys. Act. Health 2017, 14, 429–439. [Google Scholar] [CrossRef]
  4. Sacker, A.; Cable, N. Do adolescent leisure-time physical activities foster health and well-being in adulthood? Evidence from two British birth cohorts. Eur. J. Public Health 2005, 16, 331–335. [Google Scholar] [CrossRef] [PubMed] [Green Version]
  5. Wortmann, M. Dementia: A global health priority-highlights from an ADI and World Health Organization report. Alzheimer’s Res. Ther. 2012, 4, 40. [Google Scholar] [CrossRef] [Green Version]
  6. Brookmeyer, R.; Johnson, E.; Ziegler-Graham, K.; Arrighi, H.M. Forecasting the global burden of Alzheimer’s disease. Alzheimer’s Dement. 2007, 3, 186–191. [Google Scholar] [CrossRef] [Green Version]
  7. Murayama, Y.; Sato, Y.; Hu, L.; Brugnera, A.; Compare, A.; Sakatani, K. Relation between cognitive function and baseline concentrations of Hemoglobin in prefrontal cortex of elderly people measured by time-resolved near-infrared spectroscopy. In Oxygen Transport to Tissue XXXIX; Springer: Cham, Switzerland, 2017; pp. 269–276. [Google Scholar]
  8. Takeda, T.; Kawakami, Y.; Konno, M.; Matsuda, Y.; Nishino, M.; Suzuki, Y.; Kawano, Y.; Nakajima, K.; Ozawa, T.; Kondo, Y.; et al. PFC blood oxygenation changes in four different cognitive tasks. In Oxygen Transport to Tissue XXXIX; Springer: Cham, Switzerland, 2017; pp. 199–204. [Google Scholar]
  9. Doody, R.S.; Gavrilova, S.I.; Sano, M.; Thomas, R.G.; Aisen, P.S.; Bachurin, S.O.; Seely, L.; Hung, D. Effect of dimebon on cognition, activities of daily living, behaviour, and global function in patients with mild-to-moderate Alzheimer’s disease: A randomised, double-blind, placebo-controlled study. Lancet 2008, 372, 207–215. [Google Scholar] [CrossRef]
  10. Herrmann, M.J.; Walter, A.; Ehlis, A.C.; Fallgatter, A.J. Cerebral oxygenation changes in the prefrontal cortex: Effects of age and gender. Neurobiol. Aging 2006, 27, 888–894. [Google Scholar] [CrossRef]
  11. Tomasi, D.; Ernst, T.; Caparelli, E.C.; Chang, L. Common deactivation patterns during working memory and visual attention tasks: An intra-subject fMRI study at 4 Tesla. Hum. Brain Mapp. 2006, 27, 694–705. [Google Scholar] [CrossRef] [Green Version]
  12. Banaji, M.; Mallet, A.; Elwell, C.E.; Nicholls, P.; Cooper, C.E. A model of brain circulation and metabolism: NIRS signal changes during physiological challenges. PLoS Comput. Biol. 2008, 4, e1000212. [Google Scholar] [CrossRef] [Green Version]
  13. Ainslie, P.N.; Barach, A.; Murrell, C.; Hamlin, M.; Hellemans, J.; Ogoh, S. Alterations in cerebral autoregulation and cerebral blood flow velocity during acute hypoxia: Rest and exercise. Am. J. Physiol. Heart Circ. Physiol. 2007, 292, H976–H983. [Google Scholar] [CrossRef]
  14. Raichle, M.E.; Grubb, R.L.; Gado, M.H.; Eichling, J.O.; Ter-Pogossian, M.M. Correlation between regional cerebral blood flow and oxidative metabolism: In vivo studies in man. Arch. Neurol. 1976, 33, 523–526. [Google Scholar] [CrossRef] [PubMed]
  15. Ogoh, S. Relationship between cognitive function and regulation of cerebral blood flow. J. Physiol. Sci. 2017, 67, 345–351. [Google Scholar] [CrossRef] [PubMed]
  16. Kameyama, M.; Fukuda, M.; Yamagishi, Y.; Sato, T.; Uehara, T.; Ito, M.; Suto, T.; Mikuni, M. Frontal lobe function in bipolar disorder: A multichannel near-infrared spectroscopy study. NeuroImage 2006, 29, 172–184. [Google Scholar] [CrossRef]
  17. Phillips, A.; Chan, F.H.N.; Zheng, M.Z.; Krassioukov, A.V.; Ainslie, P.N. Neurovascular coupling in humans: Physiology, methodological advances and clinical implications. J. Cereb. Blood Flow Metab. 2016, 36, 647–664. [Google Scholar] [CrossRef] [PubMed] [Green Version]
  18. Jang, S.H.; Seo, J.P.; Lee, S.H.; Jin, S.H.; Yeo, S.S. The cortical activation pattern during bilateral arm raising movements. Neural Regen. Res. 2017, 12, 317–320. [Google Scholar] [PubMed]
  19. Cui, X.; Bray, S.; Bryant, D.M.; Glover, G.H.; Reiss, A.L. A quantitative comparison of NIRS and fMRI across multiple cognitive tasks. Neuroimage 2011, 54, 2808–2821. [Google Scholar] [CrossRef] [Green Version]
  20. Kato, K.; Iwamoto, K.; Kawano, N.; Noda, Y.; Ozaki, N.; Noda, A. Differential effects of physical activity and sleep duration on cognitive function in young adults. J. Sport Health Sci. 2018, 7, 227–236. [Google Scholar] [CrossRef]
  21. Perrey, S. NIRS for Measuring Cerebral Hemodynamic Responses during Exercise; Springer: Berlin/Heidelberg, Germany, 2012; pp. 335–349. [Google Scholar]
  22. Stute, K.; Hudl, N.; Stojan, R.; Voelcker-Rehage, C. Shedding Light on the Effects of Moderate Acute Exercise on Working Memory Performance in Healthy Older Adults: An fNIRS Study. Brain Sci. 2020, 10, 813. [Google Scholar] [CrossRef]
  23. Yanagisawa, H.; Dan, I.; Tsuzuki, D.; Kato, M.; Okamoto, M.; Kyutoku, Y.; Soya, H. Acute moderate exercise elicits increased dorsolateral prefrontal activation and improves cognitive performance with Stroop test. Neuroimage 2010, 50, 1702–1710. [Google Scholar] [CrossRef]
  24. Chang, H.; Kim, K.; Jung, Y.-J.; Kato, M. Effects of acute high-intensity resistance exercise on cognitive function and oxygenation in prefrontal cortex. J. Exerc. Nutr. Biochem. 2017, 21, 1–8. [Google Scholar] [CrossRef]
  25. Mekari, S.; Fraser, S.; Bosquet, L.; Bonnéry, C.; Labelle, V.; Pouliot, P.; Lesage, F.; Bherer, L. The relationship between exercise intensity, cerebral oxygenation and cognitive performance in young adults. Eur. J. Appl. Physiol. 2015, 115, 2189–2197. [Google Scholar] [CrossRef] [PubMed]
  26. Akila, V.; Christaline, J.A. A review of cognitive brain activation using near-infrared spectroscopy (NIRS). AIP Conf. Proc. 2020. [Google Scholar]
  27. Lefferts, W.K.; Babcock, M.C.; Tiss, M.J.; Ives, S.J.; White, C.N.; Brutsaert, T.D.; Heffernan, K.S. Effect of hypoxia on cerebrovascular and cognitive function during moderate intensity exercise. Physiol. Behav. 2016, 165, 108–118. [Google Scholar] [CrossRef] [PubMed]
  28. Tsubaki, A.; Morishita, S.; Tokunaga, Y.; Sato, D.; Qin, W.; Kojima, S.; Onishi, H. Laterality of cortical oxygenation in the prefrontal cortex during 20 min of moderate-intensity cycling exercise: A near-infrared spectroscopy study. Ann. Phys. Rehabil. Med. 2018, 61, e460. [Google Scholar] [CrossRef]
  29. Fregni, F.; Boggio, P.S.; Nitsche, M.; Bermpohl, F.; Antal, A.; Feredoes, E.; Marcolin, M.A.; Rigonatti, S.P.; Silva, M.T.; Paulus, W.; et al. Anodal transcranial direct current stimulation of prefrontal cortex enhances working memory. Exp. Brain Res. 2005, 166, 23–30. [Google Scholar] [CrossRef] [PubMed]
  30. Curtis, C.E.; D’Esposito, M. Persistent activity in the prefrontal cortex during working memory. Trends Cogn. Sci. 2003, 7, 415–423. [Google Scholar] [CrossRef] [Green Version]
  31. Aron, A.R.; Fletcher, P.C.; Bullmore, E.T.; Sahakian, B.J.; Robbins, T.W. Stop-signal inhibition disrupted by damage to right inferior frontal gyrus in humans. Nat. Neurosci. 2003, 6, 115–116. [Google Scholar] [CrossRef]
  32. Aron, A.R.; Robbins, T.W.; Poldrack, R.A. Inhibition and the right inferior frontal cortex. Trends Cogn. Sci. 2004, 8, 170–177. [Google Scholar] [CrossRef]
  33. Morinaga, K.; Akiyoshi, J.; Matsushita, H.; Ichioka, S.; Tanaka, Y.; Tsuru, J.; Hanada, H. Anticipatory anxiety-induced changes in human lateral prefrontal cortex activity. Biol. Psychol. 2007, 74, 34–38. [Google Scholar] [CrossRef]
  34. Quaresima, V.; Ferrari, M.; Torricelli, A.; Spinelli, L.; Pifferi, A.; Cubeddu, R. Bilateral prefrontal cortex oxygenation responses to a verbal fluency task: A multichannel time-resolved near-infrared topography study. J. Biomed. Opt. 2005, 10, 011012. [Google Scholar] [CrossRef] [PubMed] [Green Version]
  35. Kahlaoui, K.; Di Sante, G.; Barbeau, J.; Maheux, M.; Lesage, F.; Ska, B.; Joanette, Y. Contribution of NIRS to the study of prefrontal cortex for verbal fluency in aging. Brain Lang. 2012, 121, 164–173. [Google Scholar] [CrossRef]
  36. Pizzagalli, D.A.; Sherwood, R.J.; Henriques, J.B.; Davidson, R.J. Frontal brain asymmetry and reward responsiveness: A source-localization study. Psychol. Sci. 2005, 16, 805–813. [Google Scholar] [CrossRef] [PubMed]
  37. Ziemann, U.; Hallett, M. Hemispheric asymmetry of ipsilateral motor cortex activation during unimanual motor tasks: Further evidence for motor dominance. Clin. Neurophysiol. 2001, 112, 107–113. [Google Scholar] [CrossRef]
  38. Tomporowski, P.D. Effects of acute bouts of exercise on cognition. Acta Psychol. 2003, 112, 297–324. [Google Scholar] [CrossRef]
  39. Kamijo, K.; Hayashi, Y.; Sakai, T.; Yahiro, T.; Tanaka, K.; Nishihira, Y. Acute effects of aerobic exercise on cognitive function in older adults. J. Gerontol. Ser. B 2009, 64, 356–363. [Google Scholar] [CrossRef] [Green Version]
  40. Thompson, P.D.; Arena, R.; Riebe, D.; Pescatello, L.S. ACSM’s new preparticipation health screening recommendations from ACSM’s guidelines for exercise testing and prescription. Curr. Sports Med. Rep. 2013, 12, 215–217. [Google Scholar] [CrossRef]
  41. Wang, C.-C.; Chu, C.-H.; Chu, I.-H. Executive function during acute exercise: The role of exercise intensity. J. Sport Exerc. Psychol. 2013, 358–367. [Google Scholar] [CrossRef]
  42. Brisswalter, J.; Collardeau, M.; René, A. Effects of acute physical exercise characteristics on cognitive performance. Sports Med. 2002, 32, 555–566. [Google Scholar] [CrossRef]
  43. Chen, F.T.; Etnier, J.L.; Wu, C.H.; Cho, Y.M.; Hung, T.M.; Chang, Y.K. Dose-response relationship between exercise duration and executive function in older adults. J. Clin. Med. 2018, 7, 279. [Google Scholar] [CrossRef] [Green Version]
  44. Morishita, S.; Tsubaki, A.; Nashimoto, S.; Fu, J.B.; Onishi, H. Face scale rating of perceived exertion during cardiopulmonary exercise test. BMJ Open Sport Exerc. Med. 2018, 4, e00047. [Google Scholar] [CrossRef] [Green Version]
  45. Thomas, R.; Stephane, P. Prefrontal cortex oxygenation and neuromuscular responses to exhaustive exercise. Eur. J. Appl. Physiol. 2008, 102, 153–163. [Google Scholar] [CrossRef]
  46. Fellman, D.; Jylkkä, J.; Warris, O.; Soveri, A.; Ritakallio, L.; Haga, S.; Salmi, J.; Nyman, T.J.; Laine, M. The role of strategy use in working memory training outcomes. Journal Mem. Lang. 2020, 104064. [Google Scholar] [CrossRef]
  47. Hazamy, A.; Altmann, L.J.P.; Stegemöller, E.; Bowers, D.; Lee, H.K.; Wilson, J.; Okun, M.S.; Hass, C.J. Improved cognition while cycling in Parkinson’s disease patients and healthy adults. Brain Cogn. 2017, 113, 23–31. [Google Scholar] [CrossRef] [PubMed] [Green Version]
  48. White, N.; Forsyth, B.; Lee, A.; Machado, L. Repeated computerized cognitive testing: Performance shifts and test–retest reliability in healthy young adults. Psychol. Assess. 2018, 30, 539. [Google Scholar] [CrossRef]
  49. Yaple, Z.; Arsalidou, M. N-back working memory task: Meta-analysis of normative fMRI studies with children. Child Dev. 2018, 89, 2010–2022. [Google Scholar] [CrossRef]
  50. Miró-Padilla, A.; Bueichekú, E.; Ventura-Campos, N.; Flores-Compañ, M.-J.; Parcet, M.A.; Ávila, C. Long-term brain effects of N-back training: An fMRI study. Brain Imaging Behav. 2019, 13, 1115–1127. [Google Scholar] [CrossRef]
  51. Lefferts, W.K.; DeBlois, J.P.; Receno, C.N.; Barreira, T.V.; Brutsaert, T.D.; Carhart, R.L.; Heffernan, K.S. Effects of acute aerobic exercise on arterial stiffness and cerebrovascular pulsatility in adults with and without hypertension. J. Hypertens. 2018, 36, 1743–1752. [Google Scholar] [CrossRef] [PubMed]
  52. Deschuyteneer, M.; Vandierendonck, A.; Muyllaert, I. Does solution of mental arithmetic problems such as 2 + 6 and 3 × 8 rely on the process of “memory updating”? Exp. Psychol. 2006, 53, 198–208. [Google Scholar] [CrossRef] [PubMed]
  53. Schmiedek, F.; Lövdén, M.; Lindenberger, U. On the relation of mean reaction time and intraindividual reaction time variability. Psychol. Aging 2009, 24, 841. [Google Scholar] [CrossRef] [Green Version]
  54. Miller, K.M.; Price, C.; Okun, M.; Montijo, H.; Bowers, D. Is the n-back task a valid neuropsychological measure for assessing working memory? Arch. Clin. Neuropsychol. 2009, 24, 711–717. [Google Scholar] [CrossRef] [Green Version]
  55. Schoofs, D.; Preuß, D.; Wolf, O.T. Psychosocial stress induces working memory impairments in an n-back paradigm. Psychoneuroendocrinology 2008, 33, 643–653. [Google Scholar] [CrossRef]
  56. Byun, K.; Hyodo, K.; Suwabe, K.; Ochi, G.; Sakairi, Y.; Kato, M.; Dan, I.; Soya, H. Positive effect of acute mild exercise on executive function via arousal-related prefrontal activations: An fNIRS study. Neuroimage 2014, 98, 336–345. [Google Scholar] [CrossRef] [PubMed]
  57. Hoshi, Y. Functional near-infrared optical imaging: Utility and limitations in human brain mapping. Psychophysiology 2003, 40, 511–520. [Google Scholar] [CrossRef]
  58. Kono, T.; Matsuo, K.; Tsunashima, K.; Kasai, K.; Takizawa, R.; Rogers, M.A.; Yamasue, H.; Yano, T.; Taketani, Y.; Kato, N. Multiple-time replicability of near-infrared spectroscopy recording during prefrontal activation task in healthy men. Neurosci. Res. 2007, 57, 504–512. [Google Scholar] [CrossRef] [PubMed]
  59. Sasai, S.; Homae, F.; Watanabe, H.; Taga, G. Frequency-specific functional connectivity in the brain during resting state revealed by NIRS. Neuroimage 2011, 56, 252–257. [Google Scholar] [CrossRef] [PubMed]
  60. Tong, Y.; Frederick, B.D. Time lag dependent multimodal processing of concurrent fMRI and near-infrared spectroscopy (NIRS) data suggests a global circulatory origin for low-frequency oscillation signals in human brain. Neuroimage 2010, 53, 553–564. [Google Scholar] [CrossRef] [Green Version]
  61. Hatakenaka, M.; Miyai, I.; Mihara, M.; Sakoda, S.; Kubota, K. Frontal regions involved in learning of motor skill—A functional NIRS study. Neuroimage 2007, 34, 109–116. [Google Scholar] [CrossRef] [PubMed]
  62. Hada, Y.; Abo, M.; Kaminaga, T.; Mikami, M. Detection of cerebral blood flow changes during repetitive transcranial magnetic stimulation by recording hemoglobin in the brain cortex, just beneath the stimulation coil, with near-infrared spectroscopy. Neuroimage 2006, 32, 1226–1230. [Google Scholar] [CrossRef]
  63. Bae, S.; Lee, Y.; Chang, P.-H. There is No test–retest reliability of brain activation induced by robotic passive hand movement: A functional NIRS study. Brain Behav. 2020, 10, e01788. [Google Scholar] [CrossRef]
  64. Maki, A.; Yamashita, Y.; Ito, Y.; Watanabe, E.; Mayanagi, Y.; Koizumi, H. Spatial and temporal analysis of human motor activity using noninvasive NIR topography. Med. Phys. 1995, 22, 1997–2005. [Google Scholar] [CrossRef] [PubMed]
  65. Mihara, M.; Miyai, I.; Hattori, N.; Hatakenaka, M.; Yagura, H.; Kawano, T.; Okibayashi, M.; Danjo, N.; Ishikawa, A.; Inoue, Y.; et al. Neurofeedback using real-time near-infrared spectroscopy enhances motor imagery related cortical activation. PLoS ONE 2012, 7, e32234. [Google Scholar] [CrossRef] [PubMed]
  66. Sørensen, H.; Secher, N.H.; Siebenmann, C.; Nielsen, H.B.; Kohl-Bareis, M.; Lundby, C.; Rasmussen, P. Cutaneous vasoconstriction affects near-infrared spectroscopy determined cerebral oxygen saturation during administration of norepinephrine. Anesthesiol. J. Am. Soc. Anesthesiol. 2012, 117, 263–270. [Google Scholar] [CrossRef] [PubMed] [Green Version]
  67. Yano, T.; Lian, C.-S.; Afroundeh, R.; Shirakawa, K.; Yunoki, T. Comparison of oscillations of skin blood flow and deoxygenation in vastus lateralis in light exercise. Biol. Sport 2014, 31, 15. [Google Scholar] [CrossRef] [Green Version]
  68. Willie, C.K.; Tzeng, Y.-C.; Fisher, J.A.; Ainslie, P.N. Integrative regulation of human brain blood flow. J. Physiol. 2014, 592, 841–859. [Google Scholar] [CrossRef] [PubMed]
  69. Lv, Y.-B.; Zhu, P.-F.; Yin, Z.-X.; Kraus, V.B.; Threapleton, D.; Chei, C.-L.; Brasher, M.S.; Zhang, J.; Qian, H.-Z.; Mao, C.; et al. A U-shaped association between blood pressure and cognitive impairment in Chinese elderly. J. Am. Med. Dir. Assoc. 2017, 18, 193.e7–193.e13. [Google Scholar] [CrossRef] [Green Version]
  70. Sesso, H.D.; Stampfer, M.J.; Rosner, B.; Hennekens, C.H.; Gaziano, J.M.; Manson, J.E.; Glynn, R.J. Systolic and diastolic blood pressure, pulse pressure, and mean arterial pressure as predictors of cardiovascular disease risk in men. Hypertension 2000, 36, 801–807. [Google Scholar] [CrossRef]
  71. Martini, M.; Röhrig, A.; Wenghoefer, M.; Schindler, E.; Messing-Jünger, M. Cerebral oxygenation and hemodynamic measurements during craniosynostosis surgery with near-infrared spectroscopy. Child’s Nerv. Syst. 2014, 30, 1367–1374. [Google Scholar] [CrossRef]
  72. Miyata, S.; Noda, A.; Ozaki, N.; Hara, Y.; Minoshima, M.; Iwamoto, K.; Takahashi, M.; Iidaka, T.; Koike, Y. Insufficient sleep impairs driving performance and cognitive function. Neurosci. Lett. 2010, 469, 229–233. [Google Scholar] [CrossRef]
  73. Agbangla, N.F.; Audiffren, M.; Albinet, C.T. Assessing muscular oxygenation during incremental exercise using near-infrared spectroscopy: Comparison of three different methods. Physiol. Res. 2017, 66, 979–985. [Google Scholar] [CrossRef]
  74. Bailey, C.S.; Wooster, L.T.; Buswell, M.; Patel, S.; Pappagianopoulos, P.P.; Bakken, K.; White, C.; Tanguay, M.; Blodgett, J.B.; Baggish, A.L.; et al. Post-exercise oxygen uptake recovery delay: A novel index of impaired cardiac reserve capacity in heart failure. Heart Fail. 2018, 6, 329–339. [Google Scholar]
  75. Cunningham, D.A.; St Croix, C.M.; Paterson, D.H.; Özyener, F.; Whipp, B.J. The Off-Transient Pulmonary Oxygen Uptake (VO2) Kinetics Following Attainment of a Particular VO2 During Heavy-Intensity Exercise in Humans. Exp. Physiol. 2000, 85, 339–347. [Google Scholar] [CrossRef] [PubMed]
  76. De Feo, P. Is high-intensity exercise better than moderate-intensity exercise for weight loss? Metab. Cardiovasc. Dis. 2013, 23, 1037–1042. [Google Scholar] [CrossRef] [PubMed]
  77. Devin, J.L.; Sax, A.T.; Hughes, G.I.; Jenkins, D.G.; Aitken, J.F.; Chambers, S.K.; Dunn, J.C.; Bolam, K.A.; Skinner, T.L. The influence of high-intensity compared with moderate-intensity exercise training on cardiorespiratory fitness and body composition in colorectal cancer survivors: A randomised controlled trial. J. Cancer Surviv. 2016, 10, 467–479. [Google Scholar] [CrossRef] [PubMed]
  78. Little, J.P.; Jung, M.E.; Wright, A.E.; Wright, W.; Manders, R.J. Effects of high-intensity interval exercise versus continuous moderate-intensity exercise on postprandial glycemic control assessed by continuous glucose monitoring in obese adults. Appl. Physiol. Nutr. Metab. 2014, 39, 835–841. [Google Scholar] [CrossRef]
  79. Barbero-Alvarez, J.C.; Soto, V.M.; Barbero-Alvarez, V.; Granda-Vera, J. Match analysis and heart rate of futsal players during competition. J. Sports Sci. 2008, 26, 63–73. [Google Scholar] [CrossRef] [PubMed]
  80. Bediz, C.S.; Oniz, A.; Guducu, C.; Demirci1, E.U.; Ogut, H.; Gunay, E.; Cetinkaya, C.; Ozgoren, M. Acute supramaximal exercise increases the brain oxygenation in relation to cognitive workload. Front. Hum. Neurosci. 2016, 10, 174. [Google Scholar] [CrossRef] [PubMed] [Green Version]
  81. Lefferts, W.K.; DeBlois, J.P.; White, C.N.; Heffernan, K.S. Effects of acute aerobic exercise on cognition and constructs of decision-making in adults with and without hypertension. Front. Aging Neurosci. 2019, 11, 41. [Google Scholar] [CrossRef] [PubMed] [Green Version]
  82. Ludyga, S.; Gerber, M.; Brand, S.; Holsboer-Trachsler, E.; Pühse, U. Acute effects of moderate aerobic exercise on specific aspects of executive function in different age and fitness groups: A meta-analysis. Psychophysiology 2016, 53, 1611–1626. [Google Scholar] [CrossRef]
  83. Hsieh, S.; Chang, Y.K.; Hung, T.M.; Fang, C.L. The effects of acute resistance exercise on young and older males’ working memory. Psychol. Sport Exerc. 2016, 22, 286–293. [Google Scholar] [CrossRef]
  84. Ji, Z.; Feng, T.; Mei, L.; Li, A.; Zhang, C. Influence of acute combined physical and cognitive exercise on cognitive function: An NIRS study. PeerJ 2019, 7, e7418. [Google Scholar] [CrossRef]
  85. Chang, Y.K.; Tsai, C.L.; Hung, T.M.; So, E.C.; Chen, F.T.; Etnier, J.L. Effects of acute exercise on executive function: A study with a Tower of London Task. J. Sport Exerc. Psychol. 2011, 33, 847–865. [Google Scholar] [CrossRef] [Green Version]
  86. Torrens-Burton, A.; Basoudan, N.; Bayer, A.J.; Tales, A. Perception and reality of cognitive function: Information processing speed, perceived memory function, and perceived task difficulty in older adults. J. Alzheimer’s Dis. 2017, 60, 1601–1609. [Google Scholar] [CrossRef] [Green Version]
  87. Giles, G.E.; Brunyé, T.; Eddy, M.D.; Mahoney, C.R.; Gagnon, S.A.; Taylor, H.A.; Kanarek, R.B. Acute exercise increases oxygenated and deoxygenated hemoglobin in the prefrontal cortex. Neuroreport 2014, 25, 1320–1325. [Google Scholar] [CrossRef] [PubMed]
  88. Herting, M.; Nagel, B.J. Differences in brain activity during a verbal associative memory encoding task in high-and low-fit adolescents. J. Cogn. Neurosci. 2013, 25, 595–612. [Google Scholar] [CrossRef] [PubMed] [Green Version]
  89. Wang, J.; Tian, J.; Hao, R.; Tian, L.; Liu, Q. Transcranial direct current stimulation over the right DLPFC selectively modulates subprocesses in working memory. PeerJ 2018, 6, e4906. [Google Scholar] [CrossRef] [Green Version]
  90. Bosch, B.M.; Bringard, A.; Ferretti, G.; Schwartz, S.; Iglói, K. Effect of cerebral vasomotion during physical exercise on associative memory, a near-infrared spectroscopy study. Neurophotonics 2017, 4, 041404. [Google Scholar] [CrossRef]
  91. Helton, W.S.; Warm, J.S.; Tripp, L.D.; Matthews, G.; Parasuraman, R.; Hancock, P.A. Cerebral lateralization of vigilance: A function of task difficulty. Neuropsychologia 2010, 1683–1688. [Google Scholar] [CrossRef]
  92. Cabeza, R. Hemispheric asymmetry reduction in older adults: The HAROLD model. Psychol. Aging 2002, 17, 85. [Google Scholar] [CrossRef]
  93. Dalsgaard, M.K. Fuelling cerebral activity in exercising man. J. Cereb. Blood Flow Metab. 2006, 26, 731–750. [Google Scholar] [CrossRef] [PubMed]
  94. De Boer, M.P.; Meijer, R.I.; Newman, J.; Stehouwer, C.D.; Eringa, E.C.; Smulders, Y.M.; Serné, E.H. Insulin-induced changes in microvascular vasomotion and capillary recruitment are associated in humans. Microcirculation 2014, 21, 380–387. [Google Scholar] [CrossRef] [PubMed]
  95. Hoyer, S. Memory function and brain glucose metabolism. Pharmacopsychiatry 2003, 36 (Suppl. S1), 62–67. [Google Scholar]
  96. Kime, R.; Fujioka, M.; Osawa, T.; Takagi, S.; Niwayama, M.; Kaneko, Y.; Murase, N.; Katsumura, T.; Osada, T. Which is the best indicator of muscle oxygen extraction during exercise using NIRS? Evidence that HHb is not the candidate. In Advances in Experimental Medicine and Biology; Springer: New York, NY, USA, 2013; pp. 163–169. [Google Scholar]
  97. Glowacki, S.P.; Martin, S.E.; Maurer, A.; Baek, W.; Green, J.S.; Crouse, S.F. Effects of resistance, endurance, and concurrent exercise on training outcomes in men. Med. Sci. Sports Exerc. 2004, 36, 2119–2127. [Google Scholar] [CrossRef] [PubMed] [Green Version]
  98. Passos, G.S.; Poyares, D.; Santana, M.G.; Garbuio, S.A.; Tufik, S.; Mello, M.T. Effect of acute physical exercise on patients with chronic primary insomnia. J. Clin. Sleep Med. 2010, 270–275. [Google Scholar] [CrossRef] [Green Version]
Figure 1. Methodology of the 2-back test, in which a sequence of 12 questions was presented. Participants were required to remember the last number of the previous result for each trial. Subsequently, the last number of the result from the two previous trials in the sequence was reported, and the reaction time and accuracy were recorded.
Applsci 11 01643 g001
Figure 2. The red dot represents the source fibers, the blue dot shows the detectors, and the yellow dot shows 24 channels. Fpz corresponds to channel 2; L-PFC corresponds to channels 8, 11, 12, and 15; and R-PFC corresponds to channels 10, 13, 14, and 17. L-PFC: left prefrontal cortex, R-PFC: right prefrontal cortex.
Applsci 11 01643 g002
Figure 3. Oxyhemoglobin (O2Hb), deoxyhemoglobin (HHb), and total hemoglobin (THb) in the left prefrontal cortex (L-PFC). The circular dotted line represents total hemoglobin (THb) in the L-PFC per minute. Values are presented as the mean ± standard error of the mean (SEM). O2Hb levels during 15 to 20 min of exercise and 2 to 4 min of rest after exercise were significantly higher than those at rest.
Applsci 11 01643 g003
Figure 4. Oxyhemoglobin (O2Hb), deoxyhemoglobin (HHb), and total hemoglobin (THb) in the right prefrontal cortex (R-PFC). The circular dotted line represents total hemoglobin (THb) in the R-PFC per minute. Values are presented as the mean ± standard error of the mean (SEM). There was no significant change in O2Hb throughout the whole experiment.
Applsci 11 01643 g004
Figure 5. Correlation between differences in the peak levels of O2Hb in the L-PFC and R-PFC and the variation in reaction time. The horizontal axis represents the reaction time, and the vertical axis represents the difference between the peak O2Hb levels in the L-PFC and R-PFC. O2Hb: oxygenated hemoglobin.
Applsci 11 01643 g005
Figure 6. Correlation between the area under the curve (AUC) O2Hb and the variation in reaction time. The horizontal axis represents the reaction time, and the vertical axis represents the AUC O2Hb. O2Hb: oxygenated hemoglobin.
Applsci 11 01643 g006
Figure 7. Correlation between the increase in the slope of O2Hb and the variation in reaction time. The horizontal axis represents the reaction time, and the vertical axis represents the difference in the increase in the slope of O2Hb. O2Hb: oxygenated hemoglobin.
Applsci 11 01643 g007
Table 1. Related parameters of exercise intensity (mean ± standard deviation).
Peak Value during CPETAveraged Value during 20 min Exercise at Moderate Intensity
VO2 (mL/kg/min)36.6 ± 6.521.5 ± 2.9
HR (bpm)171.0 ± 26.6133.3 ± 13.6
Load (Watt)191.8 ± 32.792.8 ± 17.3
CPET: Cardiopulmonary exercise test; VO2: oxygen consumption; HR: heart rate; Load: intensity of exercise.
Table 2. Reaction times on the 2-back test (mean ± standard deviation).
TimepointReaction Time (Average Time Spent on Each Question)
pre2.3 ± 0.3 s
post11.9 ± 0.3 * s
post21.8 ± 0.3 * s
* Significant difference when compared with pre (p < 0.05).
Publisher’s Note: MDPI stays neutral with regard to jurisdictional claims in published maps and institutional affiliations.

