1. Introduction
The provision of efficient energy infrastructure is an indispensable prerequisite for achieving climate and energy goals but also crucial for maintaining the security of supply as well as economic competitiveness. Both the Austrian Climate and Energy Strategy
#mission2030 [
1] and the current Austrian
Government Program (2020–2024) [
2] raise questions such as the following:
How can the Austrian industrial sector be supplied with renewable energies in a sustainable, energy-efficient, and cost-efficient manner?
Which infrastructure adaptions and grid expansion projects are required by such a transition?
To what extent can Austria be self-sufficient in (renewable) energy? How much energy has to be imported in the future?
With 87 TWh, about 27% of Austria’s final energy consumption (FEC), which amounted to 316 TWh in 2019, the industrial sector is a major energy consumer along with the sectors
transport (115 TWh, 36% of FEC) and
households (78 TWh, 25% of FEC). In particular, the energy-intensive industry, which accounts for 66% of the industrial FEC in Austria, has a considerable impact both on the total FEC [
3] and the greenhouse gas emissions. In 2019, Austrian greenhouse gas emissions amounted to 80.4 Mt CO
2eq (million tons of carbon dioxide equivalents) in total [
4]. Of that amount, industry accounts for 33%. Recent developments show that there has been an increase in generation from renewable energies and a decrease of the fossil fuels coal and oil in the industrial energy supply. Nevertheless, the fossil energy carrier natural gas is still the most used industrial energy carrier with 31 TWh (=36%), followed by electrical energy with 28 TWh (=32%), currently generated from 75% renewable sources [
5].
1.1. Motivation
The substitution of energy carriers in industrial settings—often discussed with a strong focus on electrical energy—also places new challenges on the existing energy infrastructure, such as generation and grid expansion. Furthermore, it requires new, enlarged storage systems for appropriate flexibility provision. With a focus on industry-relevance, the Austrian Climate and Energy Strategy
#mission2030 addresses the following partly interdependent objectives. These are considered as crucial factors for a successful decarbonization and a transition towards more sustainability [
1]:
Improved energy efficiency and accelerated reduction of greenhouse gas emissions are necessary.
The supply of electricity and heat shall be based on renewable energy sources.
The competitiveness of the industrial sector needs to be ensured with the core measures sector coupling and the continuation of already existing efficient facilities.
Industry needs to be reinforced in its double role as energy consumer and producer.
The pathway towards decarbonization of the energy supply includes a change of energy sources, technological transformation and introduction of (new) breakthrough technologies.
Finally, creating and providing appropriate infrastructure (grids, storages, etc.) is another crucial parameter for a successful transition towards sustainability in Austria. Suitable infrastructure increases the capability of including more intermittent, fluctuating renewable energy sources in the grids while maintaining power quality and reducing the risk of voltage drops or even shutdowns and blackouts.
Several projects and studies have been recently conducted in Austria. One common drawback of those studies addresses only specific, single issues of the energy transition. For the assessment of the available potential of renewable energy generation several reports have been presented (details see in
Section 2.1.1. Renewable energy potentials in Austria). The adaptability of the Austrian industrial sector towards fluctuating renewable electricity generation was analyzed in the projects
Flex-Tarif [
6] and
Renewables for Industry [
7]. The main focus was laid on identifying processes with the potential for load shifting and the comparison of renewable electricity generation and industrial electricity demand. Especially when estimating the future renewable energy potential and covering future energy demand sustainably, process electrification was often the exclusive assumption of the pathway for decarbonization. In addition, ongoing research in the framework of the international
IEA IETS Annex XIX (Electrification in Industry) [
8] concentrates on the electrification aspect as the main contribution to successful decarbonization.
Recent work by Sejkora et al. revealed the importance of not only focusing on the energy but also on the exergy demand of processes when developing decarbonization pathways [
9]. Their work showed a far higher exergy consumption in Austria (all sectors) than available exergy potential by renewable sources (370 vs. 266 TWh/a). This study identified the currently low exergy efficiency of only 34% as one of the most important factor of this large supply/demand gap. For industrial applications, this finding leads to the following need: Decarbonization pathways must include considerations regarding temperature levels of processes, possible heat transfer media, heat integration, and sector coupling.
However, scenarios beyond the pathway of a comprehensive electrification for decarbonization of the Austrian industry have not yet been developed. The scenarios presented in this paper combine and extend the findings of the before mentioned studies. Furthermore, they are a crucial foundation for fact-based policy-making and future development of the energy infrastructure.
The novelty of this work is that limitations for both energy and power balances have been assessed in detail for the first time. The future industrial energy demand was modeled for different energy carriers, considering useful energy categories with process and temperature requirements. Based on modeling with hourly resolution, infrastructure requirements are addressed for a full supply of the Austrian industry with renewable energy carriers.
1.2. Approach, Scope and Goal
Within the agenda of the
IndustRiES study in 2019 [
10], the authors of this contribution aimed to address the relevant aspects mentioned in the
#mission2030 [
1] in a comprehensive approach. In particular, the impact of the transition towards renewable energy supply in the industrial sector has been investigated in terms of the requirements for the future infrastructure (e.g., generation and grid capacity). Besides the focus on infrastructure, this work differentiates from the former mentioned projects and reports by combining energy carrier potentials and requirements without the assumption of comprehensive electrification. Rather, the focus is laid on evaluating the regional demand for required energy carriers and the respective quantities in various scenarios, considering the availability of renewable energy sources, the required process temperatures, and the currently used heat transfer media (steam, direct heating, etc.).
This study describes perspectives on how renewable energies can cover the total demand of the Austrian industry. Furthermore, it is investigated how the industrial sector can eliminate energy-related emissions. In this context, the following questions are of central importance:
Which energy carriers are presently used?
How can currently-used fossil energy carriers be substituted?
Which energy carriers are needed for this substitution, and in what quantities, for a successful transition?
What are the future infrastructure requirements considering spatial and temporal conditions?
1.3. Limitations of This Study
However, it is not the scope and aim of this study to examine how process-related emissions of the industrial sector can be mitigated. Consequently, the process-related emissions from cement kilns have not been part of this research. Moreover, the replacement of feedstock usage of fossil fuels such as oil or gas in the (petro-) chemical sector has not been in the scope of this paper. The latter, analysis for the decarbonization potential of the Austrian chemical sector in case of fossil feedstock replacement, was carried out by Windsperger et al. in 2018 [
11].
An exception has been made with the assessment of process-related emissions for the iron and steel sector. The reason for this exception is the strong interdependence of feedstock and energy use in the currently used production route “Blast Furnace-Basic Oxygen Furnace” (BF-BOF), which can be found at two sites in Austria. Gases from the coking facility or the blast furnace, which are byproducts of coking and steel-making, are used for efficient on-site electricity generation. Thus, a replacement of this gaseous fossil energy carrier would not reduce the demand for the primary fossil source for the coking process and in the blast furnace, coal to be more precise. Thus, the authors decided to include one scenario, where also coal and coke feedstock use is substituted by hydrogen in a new production route to decarbonize the energy supply.
Furthermore, it must be noted that the total FEC for the remaining sectors transport, private households, public and private services, and agriculture is not considered in this analysis.
The next section provides information about applied methods, the developed database, and defined scenarios. Details regarding the differences in the scenarios are provided in
Section 2.2. Scenario development.
Afterward, the results are presented and discussed. First, the before-described study is summarized, including the approach and the most important findings. Then, a more detailed analysis of the spatial and temporal implications of the different scenarios for the power grid is given. In addition, all scenarios are updated and calculated with the latest energy data from 2019, published at the end of 2020. The results are concluded, and recommendations and an outlook are presented.
2. Materials and Methods
Within the
IndustRiES study, a database was created in an interlinked top-down and bottom-up approach (see
Figure 1). Examples for top-down determined data sets used for this study are, e.g., the FEC per energy carrier for every industrial sector and each useful energy category from available, national statistics databases as well as the Austrian potentials for renewable energy carriers. The statistical data (available from 1993 to 2019) on energy balances were used, as they reveal detailed information about the Austrian industrial FEC and the distribution of it according to the six useful energy categories:
Thus, further analyses and results are performed for the FEC and the structure used in the statistics. Data for the primary energy consumption does not provide the same level of detail as the FEC statistics. Hence, the FEC is the basic data source in this work. The geographic system boundary for all scenarios is Austria. The calculated demands per energy carrier are always related to domestic potentials per energy carrier. If the demand cannot be covered by domestic supply potential, demand must be met by energy carriers from foreign energy markets. This circumstance would lead to energy imports in the future.
Examples for information determined in a bottom-up approach are the knowledge of alternative production routes and technology options, the potentials of alternative energy sources, the production process temperatures, the efficiency gains possible in different sectors, the partly purchased energy and self-supply (e.g., combined heat and power plants, CHPs) on site level. For this purpose, production companies were interviewed, and data were gathered from company reports. In addition, production process descriptions, parameters of reference plants and alternative production routes were retrieved from research reports. Information from personal interviews, publications, research and company reports was used for scenario development and parameter selection. Besides, the initial results were presented to relevant industrial companies and sector representatives as part of a participatory stakeholder process. This feedback loop allowed strengthening the assumptions and thus led to more robust results and derived decarbonization strategies. In the following subsections, more insight is provided into these topics (data and scenarios).
2.1. Data Acquisition
As part of the scenario development and modeling, more than one hundred thousand energy-related data sets were included and processed. Since comprehensive data acquisition is fundamental, the most important data sources are discussed below.
2.1.1. Renewable Energy Potentials in Austria
In order to develop meaningful scenarios that cover the industrial energy demand with renewables, it is imperative to know the availability of renewable energy sources. Therefore, seven studies were analyzed, which assess the technical potential of renewable energies in Austria. Depending on the study, estimates for Austria range from 219 to 359 TWh of renewable energy in total (cf. [
7,
12,
13,
14,
15,
16,
17]). For comparison, the Austrian FEC in 2019 was 316 TWh in total and 87 TWh for industry [
5]. For this work, the total technical potential of renewables was assumed to be 231.5 TWh. To determine this value the authors assessed the latest available potential studies [
7,
16,
17]. The considered total technical potential for electrical energy is 118.9 TWh/a, consisting of 51.1 TWh/a hydropower, 32.7 TWh/a photovoltaics, 22.5 TWh/a wind power and 11.7 TWh/a biogenic sources. Furthermore, the current level of waste and geothermal energy of 0.9 TWh/a is also considered. The technical potential for thermal energy is 112.6 TWh/a, consisting of 59.9 TWh/a biogenic fuels and 46.0 TWh/a ambient heat. In addition, it is assumed that the current energy carriers of combustible waste with 3.4 TWh/a and district heating with 3.2 TWh/a will be still available for the industry in the future. Hence, the availability of these two energy carriers is kept constant in terms of absolute values in all scenarios. However, the expansion of renewable energy supply faces limitations such as regional availability and acceptance. Especially, hydropower facilities can have large environmental impacts resulting in a competition between sustainable energy generation vs. ecology and environmental compatibility (see, inter alia, [
18,
19,
20,
21]).
2.1.2. Analysis of the Industrial Sectors and Their Energy Supply
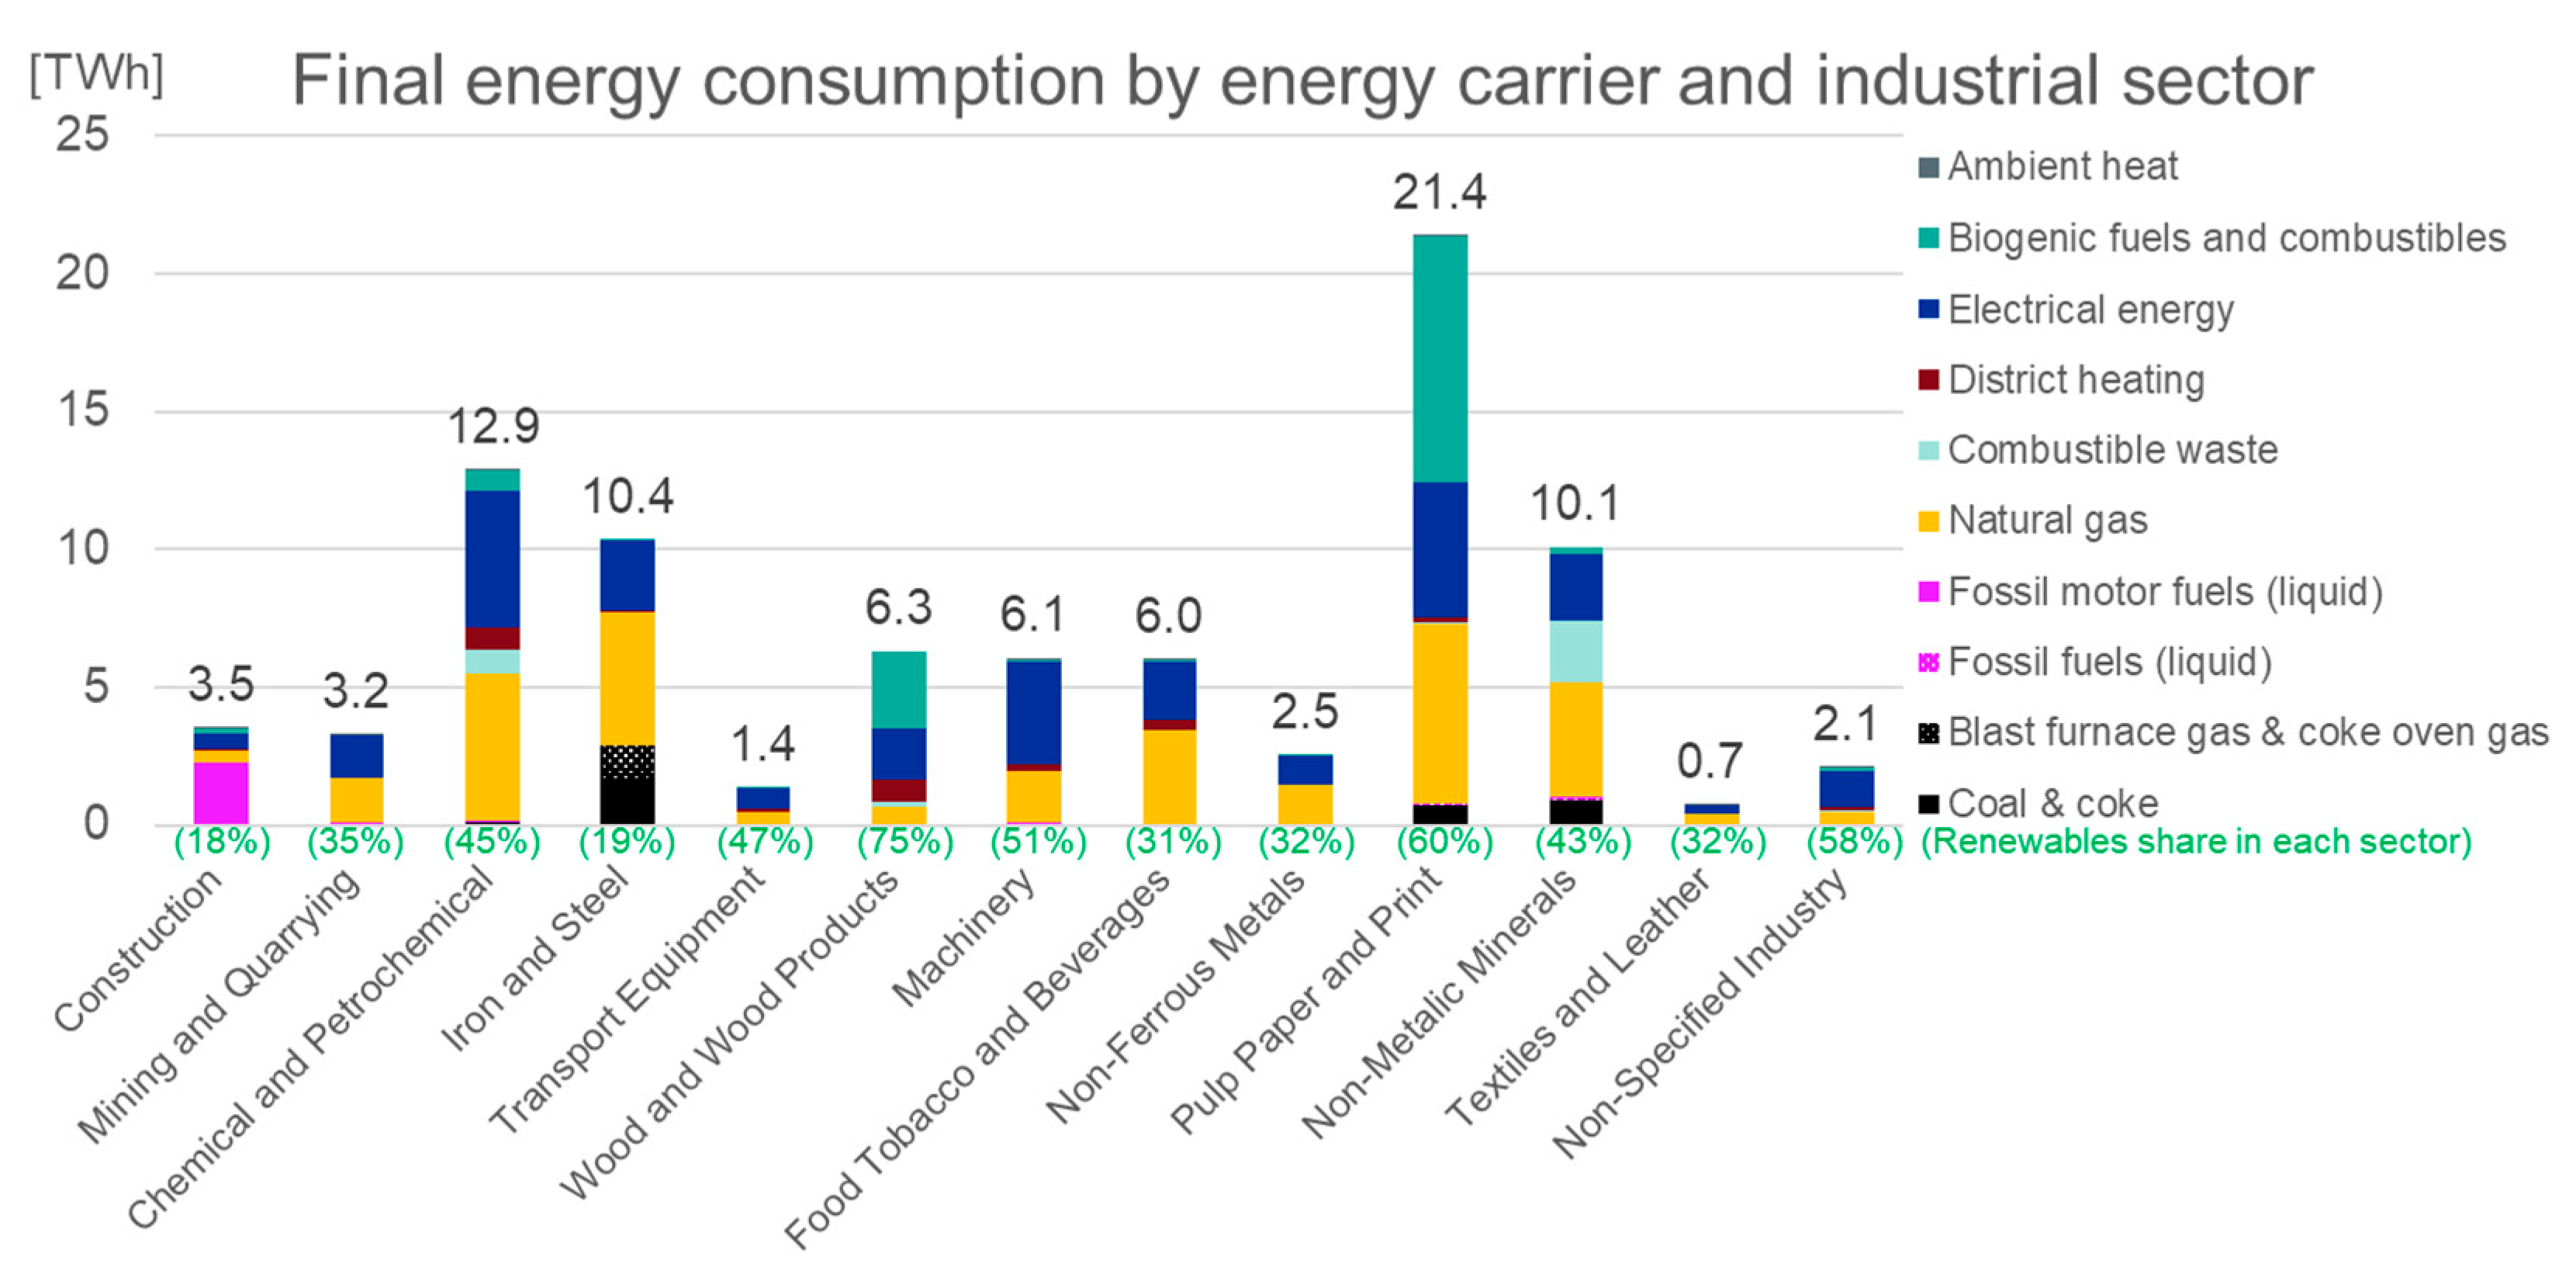
For each of the 13 industrial sectors, the energy carriers and technologies currently used were analyzed. As far as possible and relevant, also their process characteristics were included. For each sector, an energy flow chart was drawn that provides information on the quantity of the respective energy carriers and for which useful energy category they are used (see
Figure 2 exemplary for the Austrian
iron and steel sector; more information is available online at
https://industries.ait.ac.at/ (accessed on 27 January 2021).) [
22] (
Supplementary Materials). In terms of the FEC, the share of renewables in the entire Austrian industrial sector is currently 45%. The highest value occurs in the
wood processing sector with 75% of renewable energy. In contrast, the smallest value is found for the
construction sector with only 18% (see
Figure 3) [
5].
2.1.3. Demand and Generation Profiles
The total annual energy demands are calculated in the different scenarios. There, industrial load profiles with hourly resolution are considered to model the power requirements of individual energy carriers. The profiles, their origin, and their usage are briefly outlined in this section.
The electricity demand was calculated based on measured load profiles [
23], representing various industries of the industrial sector. The profile of the electricity demand is used as the basis for the estimation of the required power generation profiles in subsequent tasks.
Industrial gas demand profiles were made available by AGGM Austrian Gas Grid Management AG in a standardized and anonymous format [
24].
The generation profile of electrical energy is based on the data of the APG generation statistics [
25]. The data set covers generation from the following energy carriers: wind power, PV, biogenic, geothermal, waste and hydropower. Hydropower is subdivided into the categories “run-of-river” and “(pumped) storage power plants”. The latter also includes negative values if, for example, the power plants are in pumping operation when low or negative electricity prices occur. Thus, partially negative values for the total generation of electrical energy can occur if pumping operation outweighs the capacities of other producers. This implicitly depicts the actions in the energy markets caused by (renewable) electricity generation. Geothermal and waste incineration are assumed to be constant in power generation at 0.88 TWh according to 2017 generation levels. All other energy carriers are scaled up using the potentials shown in
Figure 4 with the corresponding generation profiles.
2.2. Scenario Development
Based on the developed database and findings from the data collection phase, the three scenarios
base,
efficiency and
transition were defined in which the energy supply of the Austrian industry can be fully supplied with renewable energy (see summarized scenarios’ storylines in
Table 1). In particular, the respective process requirements, useful energy categories, possible technology options and reasonable areas of application of renewable energy sources were considered. The scenario development was accompanied by a participatory stakeholder process, with the strong involvement of experts and bilateral discussions with representatives from companies and industrial sectors. The three scenarios represent differently ambitious target achievements, whereby the
transition scenario also includes the change of the main production process in the
iron and steel sector to direct reduction with hydrogen (see, inter alia, [
26,
27,
28,
29]). For each scenario, the final industrial energy demand and the respective energy carriers were determined and calculated.
2.2.1. Assumptions on Decarbonized Energy Supply
In the following, the assumptions made are summarized.
The already (status quo) used amount of electricity is not fully supplied by renewable energies in the current Austrian electricity mix. Nevertheless, within the goals of the #mission2030 the aim of 100% renewable energy in the Austrian electricity mix is stated. Thus, in this calculation electricity is assumed to be supplied 100% by renewable energy carriers. Regarding the amount of status quo used electricity it was to stay unaltered in the base scenario. In the further scenarios, it will be reduced by the assumed specific efficiency gains per sector and useful energy category. Due to a higher share of electrification in the processes, this effect cannot be seen directly as the total electricity consumption will rise.
In addition, district heating is assumed to be generated entirely from renewable energy sources, which includes waste incineration in the future according to the framework principle of “circular economy”. This goes hand in hand with the existing climate and energy strategies. Furthermore, the amount supplied by district heating remains unaltered for all scenarios in absolute values.
Combustible waste is considered as a renewable energy carrier in the scenarios. In Austria already today a high share (>80%) of fossil fuels is substituted by combustible waste streams in the cement production [
30,
31], which is related to the sector
nonmetallic minerals. Thus, it is assumed that this energy carrier will be available at the same scale to the cement industry. Furthermore, the concept of “circular economy” seems to become more established within the society and the economic system. Thus, waste savings will compensate for both economic and population growth. Hence, we assume that the energy supply of combustible waste will also remain constant. Waste combustion will include the combustion of waste produced sustainably according to principles of “circular economy”. Thus, waste is assumed as a renewable energy carrier for the calculated scenarios.
2.2.2. Parameter Selection
The implementation of the scenarios is based on the individual selection of the parameters efficiency increase and energy carrier penetration rate. The number of individually selected parameters is (8) in the base scenario and increases to (53) in the efficiency and transition scenario. The parameters were selected individually by sector, useful energy category and in some cases also depending on the federal state. The individually selected parameters are described in the following.
Efficiency increase: The reduction of energy consumption is caused by process optimization (e.g., energy cascades, sector coupling, digitalization, flexibilization) and technology-specific energy efficiency improvements (determined by technologies itself, e.g., higher fuel utilization rates) which is considered as efficiency increase in this work. The efficiency increase is inserted in the calculations as a percentage. For instance, 10% means that the FEC in the scenario decreases by 10% compared to the
status quo. Depending on the sector and useful energy category, individual values are chosen based on literature references (e.g., [
32,
33,
34,
35,
36,
37,
38]) and expert inputs through the participatory stakeholder process. In general, they are chosen in the range of 2–10% for thermal appliances. For example, only a small energy efficiency improvement of 2% is assumed for the
iron and steel industry, as steelmaking processes like the current BF-BOF route are already well optimized and efficiency potentials are largely tapped. However, in the nonenergy-intensive sectors, energy costs usually play a subordinate role. Therefore, the focus on energy reduction is usually lower, and thus higher efficiency potentials of around 10% are expected. Details for single values can be seen in the
IndustRiES study.
Fossil fuel switch to biogenic and electrical energy: The parameter “penetration rate” is used when fossil fuels are substituted by renewable energy sources. It shall determine the type and share of the new renewable energy carriers. Hence, it indicates which share of the replaced amount is to be obtained from biogenic and which share from electrical energy.
COP (coefficient of performance): Wherever possible, low-temperature applications (up to 160 °C) [
39] are assumed to be covered by HPs. For all sectors and the respective useful energy category, the specific temperature requirements, determined in the literature research, are considered. This results in individual COPs ranging from 1.9 to 3.8. A COP of 1 is equivalent to pure electrification (100% electrical energy and no ambient heat used). The COPs are used to calculate the respective proportion of ambient heat required by the HP as the heat source. The achievable COP
Real is calculated from the Carnot efficiency and the 2nd law efficiency of the HP. Investigations indicate the range of achievable 2nd law efficiencies between 0.4 and 0.6 [
40]. For the COP calculation, an efficiency of 0.5 is used, as measurement data from various HPs on the test bench of a certifying organization confirm this value [
41].
3. Results
The scenarios show FEC ranging from 78 TWh (
efficiency) to 105 TWh (
transition) (see
Figure 4) for the Austrian industry. There is an increasing shift towards electrical energy, especially in the
transition scenario. In the
base and
efficiency scenarios, biogenic fuels also play an important role; their absolute share is about twice as high as in the
status quo. Due to the increasing use of HPs, the energy carrier ambient heat also gains importance.
3.1. Final Energy Consumption of Austrian Industry and Coverage of Energy Demand
Total potential of 231 TWh of renewable energies (see
Section 2.1.1. Renewable energy potentials in Austria) is available to cover the energy demand. Of this, 119 TWh are electrical and 112 TWh are thermal energy. The results show that the industrial FEC can be fully covered with the renewable energy potentials available in Austria in all three scenarios. Depending on the scenario, the overall energy surpluses are between 126 and 153 TWh or 2.2 to 3.0 times higher than the demand. In detail, the electricity surpluses range from 54 to 90 TWh (1.8 to 4.1 times higher than the demand) and the thermal surpluses from 63 to 72 TWh (2.3 to 2.8 times higher than the demand). The electrical surpluses are lowest in the
transition scenario, where the greatest demand for electrical energy exists. However, the thermal surpluses are highest in this scenario, as the
transition scenario has the lowest fuel demand compared to the other two scenarios.
As mentioned in the introduction, the FEC of the remaining sectors
transport,
private households,
public and private services and
agriculture is not considered in the analysis. However, the total FEC in Austria in 2019 accounted for 316 TWh [
5]. This means that the renewable potential is not large enough to cover the total current demand of these four sectors, which account for an additional 230 TWh. Consequently, a coverage gap of 77 to 104 TWh occurs, depending on the scenario. Considering efficiency gains in the further sectors, e.g., through increased electrification in
transport and heating of
private households with heat pumps, this gap might decrease. Nevertheless, the remaining, though smaller, gap must be covered by more ambitious efficiency gains and/or energy imports.
3.1.1. Base Scenario
In the base scenario, all fossil energy carriers for industrial applications are replaced by renewable energies. An exception is made for the iron and steel sector in the federal states Upper Austria and Styria. In the coking facilities and the blast furnaces, they still use coal, coke, and coke oven gas for the BF-BOF route. The share of renewables in this scenario is therefore only 96.6%, as the before mentioned fossil fuels account for 2.9 TWh. Efficiency measures, such as electricity-driven stationary engines replacing fossil-fuel-fired stationary engines, cause a drop by 3 TWh of the FEC compared to the status quo. Biogenic fuels show the strongest growth, as they are, according to the scenario storyline, mainly used as a substitute for the combustion of natural gas and liquid fossil fuels. With this replacement similar production routes, set-ups and heat transfer media can be used. The partial electrification of production processes and the exchange of fossil-fired stationary engines with electricity-driven units, as well as the use of HPs for low-temperature applications, mainly for space heating and air conditioning, also increase the electricity demand. Ambient heat (including geothermal energy, air, water or industrial waste heat) as an energy source contributes a higher share of 4 TWh due to an increased number of HP applications.
3.1.2. Efficiency Scenario
With 78 TWh, the efficiency scenario has the lowest industrial FEC of the three determined scenarios. This is mainly due to increased efficiency measures in the individual processes as well as thermal refurbishments (thermal insulation etc.) and heat recovery measures compared to the base scenario. As a result, the energy demand is decreasing for all energy sources except ambient heat. The use of high-temperature heat pumps (HTHP) in the useful energy categories steam generation and industrial furnaces, especially for drying applications with an operating temperature range of up to 160 °C, increases the demand for heat sources for the HPs. This is the reason for the increase of ambient heat in this scenario (from 4 TWh in the base scenario to 10 TWh). Biogenic fuels and electrical energy, both account for approx. 30 TWh, cover almost 80% of the FEC. In the iron and steel sector still the fossil resources coal and coke are required for the chemical reduction of iron-ore. Due to efficiency gains, these are slightly lower in absolute terms. As the sector can be considered as energy-efficient, the impact of the efficiency gain is less than in other sectors and useful energy categories. This results in a negligible reduction of the relative renewable share to 96.3% compared to the base scenario.
3.1.3. Transition Scenario
Considering the importance of exergetic efficiency as the main driver for this scenario and pathway, the implementation share of HTHPs is increased. This leads to a higher demand for ambient heat of in total 18 TWh. Furthermore, HTHPs are displacing biogenic fuels for process heat applications up to 160 °C following the principle of exergy-efficient energy supply. Thus, a reduction of the total demand for biogenic fuels to 18 TWh occurs. As a result, biogenic high caloric energy carriers in solid, liquid, and gaseous form are available solely for combustion processes with temperature requirements of several hundred degrees Celsius, e.g., from the sectors nonmetallic minerals and ferrous minerals (part of the iron and steel sector in this analysis). Processes that cannot be supplied by HTHP are increasingly electrified if no heat transfer by direct flames is needed. If furnaces and heat transfer by direct firing are required, biogenic fuels are used. In the transition scenario, a complete supply of renewable energies is assumed, as the blast furnace process is replaced by direct reduction with hydrogen. As a result of this process change in the iron and steel sector, the electricity demand rises to a total of 65 TWh. The FEC is highest in this scenario with 105 TWh. This increase results from the fact that the feedstock content of the coke input, which does not appear in the FEC statistics (and therefore neither in the previous scenarios so far), is replaced with electricity which is now included in the FEC. This means a radical change for the sector, as the high degree of self-sufficiency with process side products such as coke oven and blast furnace gas are abandoned, and all energy may have to be procured externally.
3.2. Electrical Energy Infrastructure Requirements
The following analysis for detailed temporal and spatial aspects is made for the energy carrier electricity as further energy carriers such as biogenic fuels or combustible waste can be stored far easier than electricity.
The total potential of electrical energy can cover an energy demand of up to 118.9 TWh. This is shown in
Figure 5 on the left side. Next to it, the FEC is presented first for the
status quo followed by the three developed scenarios. The respective energy demand and the resulting residual potential (grey) are shown. In addition, the surplus or deficit is shown to the right of each scenario. In this context, “surplus” corresponds to the summarized electric power of all timesteps t in the energy demand and supply profiles (timesteps duration equals one hour, thus summarized electric power equals electric energy) when more electric power is provided by the generation than required by the consumers for one year (=8760 h) and vice versa for “deficit”. The resulting residual potential would be available for other sectors, for example. In all scenarios, the requirements can be covered on an annual balance and there is a residual potential between 54.2 and 90.0 TWh that can be used elsewhere. Nevertheless, the hourly evaluation shows that direct coverage is not always possible. There is a deficit of between 1.7 (
efficiency) and 6.3 TWh (
transition). Hence, this demand cannot be directly covered by the existing potentials of renewable energies with existing temporal generation profiles. Storages or imports would be necessary to overcome this temporal mismatch. Although the electricity demand in the
transition scenario is only 2.2 times higher than in the
efficiency scenario, the deficit increases more substantially by a factor of 3.7.
The industrial power load profile results in a simulated minimum load of 1.2 GW and a peak load of 6.0 GW in the
status quo. The
efficiency scenario shows similar magnitudes, as the electrical energy demand is similar. In the
base scenario, the peak load rises to 7.8 GW. In the
transition scenario, however, both the minimum and the peak load are more than twice as high as in the
status quo. Here, the simulated peak load is 13.8 GW (see
Figure 6). By comparison, the peak load in the Austrian public grid in 2019 was 10.7 GW in December and the minimum load was 4.1 GW in August [
42]. Both values are for all sectors and not only industry. Hence, the simulated peak load for the industrial sector in the
transition scenario is 29% higher than the current peak load in the entire public grid (see
Figure 7).
Realizing the transition scenario and its shifts in energy carriers, especially towards electricity, would require the expansion and optimization of the existing energy infrastructure. Especially for the iron and steel production sites, an upgrade of the power grid infrastructure would be necessary. Therefore, one main finding is that it is essential to develop integrated energy infrastructures in coordination with the European network development plans to ensure the security of supply for future decarbonization pathways.
On a spatial level, the biggest changes occur in the federal states Upper Austria and Styria, as the BF-BOF route in the iron and steel sector is assumed to transform to hydrogen-based direct reduction. This change is particularly noticeable in Upper Austria, especially in the Linz area, where the biggest Austrian steel production capacities exist. The electrical energy demand rises significantly from 8.6 TWh (status quo) to 35.0 TWh (transition). The peak load is also four times higher and increases from 1.8 to 7.5 GW. The peak load of electrical energy in Upper Austria results in being slightly more than half of the calculated total industrial peak load in the transition scenario. Changes in the peak load in Styria (Leoben/Mürztal area) are less extreme. In this area, an increase in electricity demand from 5.5 TWh (status quo) to 14.0 TWh (transition) is calculated. The peak load increases by a factor of 2.5 from 1.2 to 3.0 GW. Nevertheless, there are no corresponding consumer statistics (e.g., temporal capacity demand). Thus, no well-founded statements can be made as to whether the individual (regional) industrial loads add up and thus cause even more additional burdens on the public power grid. For robust analyses, high-resolution data from the consumer side would be required.
Further analysis on the regional level is summarized in
Figure 8. It shows how much renewable energy potential would be required to cover the annual final industrial electricity demand at the federal state level. The figures refer in percentages to the potential of renewable electrical energy available per federal state. In the
transition scenario, 54% of the electrical energy potential is needed to cover the demand throughout Austria. At the level of the federal states, the picture is different. In seven federal states, less electrical energy is required by industry than available. In contrast, there is a deficit in Styria and Upper Austria. In the latter, 72% more electrical energy is needed than available on the federal state level, whereas in Styria available potential and required electricity only slightly differ. In the
efficiency scenario, which requires the lowest electrical energy demand from all scenarios, just 24% of the total electrical energy potential is needed. Hence, much more of the remaining electrical energy potential could be used for other sectors (
transport,
private households,
public and private services and
agriculture).
4. Discussion and Conclusions
The main findings and conclusions of this paper are as follows.
While neglecting possible efficiency gains in other sectors, a fully decarbonized energy supply for the industrial sector can be realized with a coverage gap of up to 104 TWh in the total final energy demand for Austria. This result can be obtained if all available renewable energy potentials are exploited. Considering efficiency gains in other sectors, this gap can decrease drastically. However, a remaining gap must be covered otherwise. Here, future research and developments are indispensable. Successful decarbonization of the industry requires immediate, simultaneous expansion of appropriate infrastructure to balance supply and demand. Nevertheless, to be able to exploit the renewable energy potentials, it is essential to act soon and in a coordinated manner on a large scale, in harmony with integrated European energy infrastructures.
In the following, the main results and recommendations, which have been identified as crucial for successful decarbonization for the Austrian industrial sector and beyond, are reflected. In addition, an outlook is provided about ongoing and further research needs.
4.1. Overview of the Main Results
Based on the three developed scenarios base, efficiency and transition, possible ways of supplying industry with renewable energy sources are shown. The scenarios show a range of final energy consumption from 78 TWh (efficiency) to 105 TWh (transition) (status quo 2019:87 TWh). With the currently available renewable energy potentials in Austria, the industrial final energy consumption could be covered on an annual balance in all scenarios. Nevertheless, the potential of 231 TWh might not be enough to cover the entire final energy demand of all sectors (including transport, etc.). As efficiency gains in other sectors are not yet fully exploited, the resulting gap of 77 TWh to 104 TWh might decrease. A remaining deficit must be covered either by imports or by untapping currently unknown potentials.
Both energy demand and generation were evaluated and compared on an hourly basis. This granularity allows statements to be made about the minimum and maximum power requirements, as well as on temporal deficits and surpluses and subsequently about possible storage or import requirements. For electrical energy, depending on the scenario, a deficit between 1.7 TWh (efficiency) and 6.3 TWh (transition) is expected for Austria. The temporal comparison revealed that this demand cannot be met directly with the existing potentials. Furthermore, the simulated peak load of the industrial sector in the transition scenario of 13.8 GW is more than twice as high as in the status quo (6.0 GW). In comparison, the peak load in the entire public power grid in Austria (all sectors) in December 2019 was 10.7 GW and thus smaller than the calculated industrial peak load for the transition scenario. As a result, the calculated peak load for the industrial sector in the transition scenario is 29% higher than the current peak load in the public power grid.
On a spatial level, the strongest changes in electricity demand occur in the federal states Upper Austria and Styria, due to the conversion of the BF-BOF route to direct reduction with hydrogen in the iron and steel production. This change is particularly noticeable in Upper Austria. In this federal state, the electricity demand of industry increases significantly from 8.6 TWh (status quo) to 35.0 TWh (transition). The calculated peak load also increases by factor four from 1.8 GW to 7.5 GW. The peak load of electrical energy in Upper Austria, especially in the Linz area, is thus slightly more than half of the calculated total industrial peak load in the transition scenario.
Overall, supplying the Austrian industry with 100% renewable energies results in a switch of energy carriers towards more biogenic and electrical energy as well as ambient heat. This requires an expansion and optimization of the existing energy infrastructure due to changing requirements. Especially for the iron and steel production sites, upgrading the electricity infrastructure will be necessary. Here, it is essential to develop integrated energy infrastructures in coordination with the European network development plans to ensure the security of supply.
4.2. Recommendations for Action in Energy Infrastructure Policy
Within this work, the authors identified crucial aspects of the assessment of renewable potentials in Austria regarding lacking data quality, level of detail and availability. Thus, in this first step required actions regarding these issues are formulated. Further meaningful policy measures can hardly be made without further scientific progress.
The scenario results show that the strongest changes in electricity demand will occur in the federal states Upper Austria (Linz area) and Styria (Leoben/Mürztal area). On the other hand, many renewable energy potentials (especially wind power in Eastern Austria and hydropower in Alpine regions) are not necessarily located near the energy-intensive industry. This leads to new challenges for the infrastructure, especially for the power grid. However, for considering the overall energy infrastructure and future adaptions, it is indispensable to resolve generation and consumption (especially the “hotspots”) geographically and temporally to the highest possible extent to extend the grid in a feasible and economically efficient way. For this purpose and planning, however, the (statistical) data basis must also be available in high resolution. One limitation is that industrial load profiles are scarcely available publicly. If many industrial load profiles from all sectors would be available, more in-depth individual analyses could be carried out.
The studies conducted so far showed limitations related to the available data. Publicly accessible data of the potentials in Austria, and preferably for the whole of Europe, with different levels of detail, is a crucial prerequisite. On the one hand, the higher level of detail must relate to the energy carriers and the potential category itself (theoretical, technical, economical). On the other hand, it must relate to the spatial (e.g., federal state, or district level) and temporal resolution (hourly profiles).
Further implementation and research efforts are also required to make optimum use of industrial waste heat potentials. The recommendation is to compile a detailed waste heat map for Austria, including considerations of different sectors and temperature levels as well as time profiles and to keep it up to date.
In a future energy system, industrial companies must be involved as prosumers. They should react flexibly to changes, thus contributing to maintaining the security of supply. To this end, new concepts and coupling points between the energy sectors must be identified. Hence, more (cost and energy) efficient applications of flexibility and storage requirements can be enabled, which are necessary to compensate for fluctuating generation and gain the overall energy and exergy efficiency.
It is crucial to model potential development paths for the other sectors (transport, households, etc.) to decarbonize the energy system. Based on such paths, necessary measures for energy infrastructure development can be assessed. The studies required to achieve this would include the clarification, which energy carriers should be used for which applications (conflict of use for different sectors) and in what form the energy gap can be filled.
4.3. Outlook
The focus of the
IndustRiES study and this paper was a decarbonized energy supply for the industry. Process-related CO
2 emissions were only considered in the
transition scenario for the
iron and steel sector. Nevertheless, such deep decarbonization is crucial to meet climate goals. The current government’s goal for Austria is to be climate neutral by 2040 [
2], which is ten years earlier than the current EU target. In this context, “climate neutral” means that greenhouse gas emissions from industry are completely or almost completely avoided and the residual emissions are offset by negative emissions. The technical solutions to reduce greenhouse gas emissions in the industry by 2030, currently under discussion in the EU fall short of the long-term goal of climate neutrality. According to the European Commission’s Impact Assessment, emission reductions at European industrial sites over the next ten years are envisaged almost exclusively through efficiency-enhancing measures at conventional plants. Since industrial plants (e.g., kilns) often have long lifetimes (several decades), the industry should already invest in climate-neutral key technologies in the next upcoming investment cycles to achieve climate neutrality. This will require both leapfrog innovations and break-through technologies.
Future research and assessment of industrial deep decarbonization is a key issue in the energy model region NEFI—New Energy for Industry [
43], funded by the Austrian Climate and Energy Fund. NEFI has the defined goal of significantly reducing CO
2 emissions from industry, using up to 100% renewable energies and at the same time increasing competitiveness. The work, which has been presented here, builds a robust basis for the NEFI_Lab [
44], where even more detailed paths for different decarbonization levels are developed. These paths will indicate which sector must implement what kind of technology in which timeframe to reach a certain level of decarbonization. Results are estimated to be published in the second half of 2021.
As presented, the industrial sector holds a share of 27% of Austria’s final energy consumption. Equally far-reaching efforts are needed to decarbonize the other sectors transport, private households, public and private services and agriculture. The transport sector, which is currently almost exclusively supplied by fossil energy sources, will pose a complex and demanding challenge. To reach these ambitious goals of decarbonization, the demand for electrical and biogenic energy sources will continue to increase as it was shown in the analysis of the industrial sector in this paper. This may lead to a “competition” for individual energy sources between the sectors. To solve this issue, it is important to consider exergy aspects, meaning high-grade energy sources should only be used for high exergy applications. Thus, not only future research for the industrial sector but also for other sectors and the overall system is of high importance and urgency.


