Abstract
This study’s purpose was to establish a predictive model of the intention to accept Taekwondo electronic protector devices through the application of the technology acceptance model. Two hundred and twenty collegiate Taekwondo practitioners affiliated with the Korea Taekwondo Association participated in a survey that included 28 questions (4 relating to demographic characteristics, 12 to precursor variables, and 12 to the technology acceptance model). Correlation and structural equation modeling analyses were applied and a significance level of 0.05 was used. The results were as follows. Perceived quality had a significant influence on perceived ease of use (β = 0.380, t = 3.481, p < 0.001) and perceived usefulness (β = 0.544, t = 5.098, p < 0.001). Visual attractiveness had no significant influence on either perceived ease of use (β = 0.159, t = 1.798, p = 0.072) or perceived usefulness (β = −0.010, t = −0.131, p = 0.896). Wearability had a significant influence on perceived ease of use (β = 0.234, t = 2.867, p < 0.01), but a significantly negative influence on perceived usefulness (β = −0.218, t = −2.932, p < 0.01). Functionality had no significant influence on either perceived ease of use (β = 0.116, t = 1.031, p = 0.302) or perceived usefulness (β = 0.107, t = 1.093, p = 0.274). Perceived ease of use had a significant influence on perceived usefulness (β = 0.418, t = 4.361, p < 0.001) and acceptance intention (β = 0.361, t = 4.031, p < 0.001). Perceived usefulness had a significant influence on acceptance intention (β = 0.525, t = 5.758, p < 0.001). These results suggest that improving the perceived quality and wearability of the devices will enhance their acceptance. We believe that this study provides an appropriate verification model for the intention to accept Taekwondo electronic protection devices.
1. Introduction
Taekwondo is a traditional Korean martial art and has been an official Olympic combat sport since the 2000 Sydney Olympic Games [1]. More than 200 countries are affiliated with the World Taekwondo Federation (WT) and a growing number of individuals are participating in Taekwondo competitions globally [2]. However, a critical issue related to the scoring system used during competitions arose, interrupting the further development of Taekwondo competitions [3]. To ensure the fairness and smooth operation of Taekwondo competitions, an electronic body protector and scoring system were introduced in the 2012 London Olympic Games and have been used in all subsequent Olympic Games [4,5]. These systems not only protect Taekwondo players against injury but also result in more reliable and accurate scoring [6]. In other words, Taekwondo electronic protection devices (TEPDs) (such as headgear, body protectors and hand–foot protectors) have a technical feature that automatically recognizes the effective attack power by means of a sensor equipped with an advanced electronic chip attached to the protector, which automatically transmits it to the score monitor through a wireless transmission device. Thus, the WT endorses TEPDs as official equipment at the World Taekwondo Championships, Olympic Games, and other Taekwondo megaevents.
The use of wearable protective devices for the head, body, hands, and feet that measure striking power through sensors and electronic chips has changed the paradigm of Taekwondo from a game to an objective, qualitative, and scientific sport [7]. Despite these scientific advancements, no study has been published that provides details about the safety performance of the current equipment, except for head and body protectors [8,9,10,11]. During the match, sometimes the score is overestimated or underestimated because sensors and devices do not operate accurately while recognizing the TEPDs’ score [12]. Additionally, Moon and Jung [13] have observed that the electronic scoring system was undesirably activated, suggesting the need for future improvements.
Thus, at this point, it is relevant to study the precursor variables that affect the intention to accept TEPDs by applying the technology acceptance model (TAM). In fact, research has been conducted on the acceptance of other devices for other purposes using surveys [14,15,16]. Therefore, this study examines the factors that influence TEPD acceptance and then suggests a predictive model for the intention to accept TEPDs. We believe that this study provides important academic data about TEPDs for developing Taekwondo competitions.
2. Literature Review
Davis [17] developed the theory of TAM to predict and explain the behavior of information technology (IT) users. In other words, TAM is a significant information systems theory that is relevant to the acceptance and use of IT [18,19,20]. TAM is based on the theory of reasoned action (TRA) [21] and the theory of planned behavior (TPB) [22]. These theories are representative behavioral intention models that predict behavior through attitude. TAM is an adaptation of the TRA by Fishbein and Ajzen [21]. It was designed for modeling user acceptance of IT [23]. Furthermore, TPB expands TRA by adding subjective norms and perceived behavior control variables; however, these were excluded from TAM [24]. Assessing changing attitudes and behavioral intentions is common among TAM, TRA, and TPB. Nevertheless, TAM differs from the other two theories as it examines perceived usefulness and perceived ease as factors that explain the difference in the degree of acceptance of technology and innovation. It is believed that these factors influence attitudes.
TAM can predict users’ behavioral intention and actual behavior by examining the relationship between perceived ease of use (PEU), perceived usefulness (PU), attitude toward using, and behavioral intention to use (BI) [17]. This model hypothesizes that system use is directly determined by BI, which in turn is influenced by users’ AT, the system, and the system’s PU [25]. It is important to emphasize that while TPB is a general theory, designed to explain almost any human behavior [26], TAM exclusively focuses on the use of technological innovations and is appropriate for analyzing this type of behavior [17,27]. This theory states that PEU and PU significantly influence the acceptance to use a technology [28]. Davis et al. [23] have stated that various external variables, other than the abovementioned, can also influence the acceptance of a technology. Consequently, this study extends the TAM by including perceived quality, visual attractiveness, wearability, and functionality as factors that influence the use of a technology.
In an attempt to expand TAM, a recent study applied structural equation modeling (SEM) to improve the understanding of the use of wearable technology [29]. Therefore, the hypotheses and research model (Figure 1) established in this study are as follows.

Figure 1.
Research model.
Hypothesis 1.
The perceived quality of Taekwondo electronic protector devices significantly influences perceived ease of use and perceived usefulness.
Hypothesis 2.
The visual attractiveness of Taekwondo electronic protector devices significantly influences perceived ease of use and perceived usefulness.
Hypothesis 3.
The wearability of Taekwondo electronic protector devices significantly influences perceived ease of use and perceived usefulness.
Hypothesis 4.
The functionality of Taekwondo electronic protector devices significantly influences perceived ease of use and perceived usefulness.
Hypothesis 5.
The perceived ease of use of Taekwondo electronic protector devices significantly influences perceived usefulness and acceptance intention.
Hypothesis 6.
The perceived usefulness of Taekwondo electronic protector devices significantly influences acceptance intention.
3. Materials and Methods
3.1. Data Collection
In January 2019, we conducted a survey of college Taekwondo athletes who were registered with the Korea Taekwondo Association (KTA). The KTA is an official member of the Korean Olympic Committee and is the representative organization that manages the Korean Taekwondo system. We ruled out four responses because of lack of sincerity, analyzed the remaining 220 responses, and compiled the general characteristics of the study participants, as shown in Table 1.

Table 1.
Demographics of the participants (N = 220).
3.2. Survey Instrument
A survey questionnaire, comprising 28 questions (out of which four were related to demographic factors: gender, school grade, period of using TEPD, and preference for a TEPD brand) was used to collect data. Kim and Choi’s [30] questionnaire was modified to obtain the items for perceived quality, and Lee’s [31] questionnaire was modified to obtain the items for visual attractiveness, wearability, and functionality. The modified questionnaire used in Park [32], which was based on Davis’s [17] TAM, was applied to obtain the items for PU, PEU, and BI. With the exception of the demographic questions, the answers to the questions related to the TAM were based on a 5-point Likert scale ranging from 1 (strongly disagree) to 5 (strongly agree).
3.3. Statistical Analysis
This study utilized IBM PASW 23.0 and AMOS 23.0 (IBM Corp., Armonk, NY, USA) for data analysis. Frequency analysis was conducted to check the demographic characteristics of the research participants, while confirmatory factor and reliability analyses were used to check the validity and reliability of the research tools. Technical statistics analysis was employed to verify the normality of the data. Correlation analysis and structural equation modeling were performed to investigate the relationship between the predetermined variables. The statistical significance was set at 0.05.
4. Results
4.1. Validity and Reliability of Research Tools
This study conducted confirmatory factor analysis to verify the convergent and discriminant validity of the survey. The validity of the measurement model is shown in Table 2.
Table 2.
Validity and reliability of research tools.
Table 2 shows that the results—comparative fit index (CFI) > 0.90, incremental fit index (IFI) > 0.90, Tucker–Lewis index (TLI) > 0.90, root mean square error of approximation (RMSEA) < 0.10—meet the validity standard suggested by Kline [33], which indicates that they can be generally accepted. To analyze the convergent validity of each variable used during the study, construct reliability (CR) and the average variance extracted (AVE) were calculated. The results ensured convergent probability based on the criteria presented by Hair et al. [34], as the CR for all observed variables was between 0.837 and 0.908, while the AVE was between 0.622 and 0.729. In addition, if the squared value of the correlation coefficient between the construct conceptions is higher than the AVE of the related concept in the verification of the validity of each concept, the AVE of all factors is greater, and is thereby judged to have secured valid judgment among the concepts [35]. Finally, the reliability of the research tools was tested by referring to the Cronbach’s α values: perceived quality (0.848), visual attractiveness (0.854), wearability (0.863), functionality (0.775), PEU (0.842), PU (0.888), and acceptance intention (0.879), thereby ensuring overall confidence [36].
4.2. Verification of Technical Statistical Analysis, Correlation, and Normality
The normality of the data was verified based on the technical statistics of the variables. According to West et al.’s [37] criteria for obtaining normality when verifying univariate normal distribution, the data are normalized when displaying values within the range of ±2 for skewness and ±7 for kurtosis. Additionally, the results of the correlation analysis presented in Table 3 show that there are no multicollinearity problems as the correlation between variables was less than 0.85 in all cases [33].
Table 3.
Correlation analysis and normality of data.
4.3. Structural Equation Modeling
Maximum likelihood (ML) was used as an SEM parameter estimation method; as Table 4 shows, the goodness-of-fit indices indicate that the structural model is an acceptable fit to the data (χ2 = 445.814, DF = 235, CFI = 0.936, IFI = 0.937, TLI = 0.925, RMSEA = 0.064).
Table 4.
Result for structural equation modeling.
A closer look at the results of the structural model analysis confirms the following (Figure 2). First, perceived quality positively (+) affects PEU (β = 0.380, t = 3.481) and PU (β = 0.544, t = 5.089). Second, visual attractiveness does not significantly affect either PEU (β = 0.159, t = 1.798) or PU (β = −0.100, t = −0.131). Third, wearability had a positive (+) effect on PEU (β = 0.234, t = 2.867), but a negative (−) effect on PU (β = −0.218 and t = −2.932). Fourth, functionality did not significantly affect either PEU (β = 0.116, t = 1.031) or PU (β = 0.107, t = 1.093). Fifth, PEU had a positive (+) effect on PU (β = 0.418, t = 4.361) and acceptance intention (β = 0.361, t = 4.031). Sixth, PU had a positive (+) effect on acceptance intention (β = 0.525, t = 5.758).
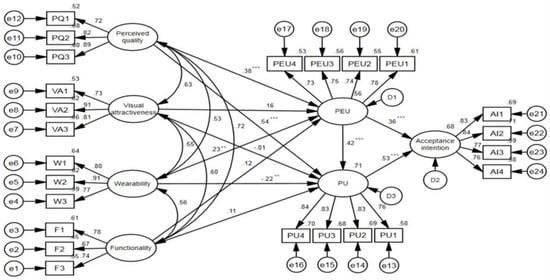
Figure 2.
Acceptance intention prediction model for Taekwondo electronic protection devices. Note: *** p < 0.001, ** p < 0.01, PQ = perceived quality, VA = visual attractiveness, W = wearability, F = functionality, PEU = perceived ease of use, PU = perceived usefulness, AI = acceptance intention.
5. Discussion
First, perceived quality has a significant influence on PEU and PU. In particular, in this study, perceived quality was found to be the most significant factor affecting PEU and PU—the quality of the TEPD has a direct effect on the competition. Considering that TEPDs are used to ensure fairness in the Taekwondo competition, efforts to enhance their perceived quality are critical. In the past, for example, Taekwondo athletes observed that a purportedly strong kick did not register a point, while weak force did [38]. These problems were raised as technical issues with TEPDs, among not only Taekwondo athletes but also spectators, as they expressed doubts about PEU and PU. Therefore, efforts should be made to maintain a consistent standard of TEPD quality and to enhance athletes and spectators’ perception of the device’s quality through continuous technical development.
Second, visual attractiveness does not have a significant influence on the PEU and PU. Falcó et al.’s study [39] supports these results, as their research shows that there is no significant relationship between the appearance and performance of TEPDs. The appearance of various TEPD brands is similar; moreover, their design is similar to that of a typical product without the electronic components. Therefore, this study confirms that the visual attractiveness that Taekwondo athletes perceive does not have a significant effect on their PEU and PU.
Third, wearability has a significant positive influence on PEU, while it has a significantly negative (−) effect on PU. Taekwondo competition scoring happens quickly over a short period. Taekwondo athletes are very sensitive to this movement and therefore, the higher the TEPD wearing sensibility, the greater the PEU. Conversely, wearability has been shown to have a negative effect on PU. This indicates that Taekwondo athletes tend to recognize highly wearable TEPDs as good products and believe that the latest updated TEPDs will easily record the score of opponent strikes on themselves. Therefore, it seems that the higher the wearing sensation, the less useful it will be. More importantly, Sevinc and Colak [40] indicate that TEPD wearability is a leading factor that significantly affects Taekwondo performance. Therefore, manufacturing companies must maintain the product condition and continue to make efforts to improve its material and technical ability to improve product durability.
Fourth, functionality does not have a significant influence on the PEU and PU. Considering that the function of TEPDs is to ensure fairness in competitions [41], this study confirms that PEU and PU are not recognized for functions other than this purpose. Given that some individuals did not trust the functioning of the earlier versions of the TEPD because of their technical issues [42], TEPD manufacturers need to focus more on the development of products that enhance fairness in their functionality.
Fifth, PEU has a significant influence on PU and acceptance intention. There were many technical problems with the initial model of the device, including errors with the sensor recognition process during use. However, recent improvements in material development and technical skills have improved athletes’ competency and provided them with motivation and objective feedback. Electronic systems help analyze the performance, strength, and functional capacity of athletes, and assist in improving their skills and monitoring these improvements. Additionally, these systems help develop strategies, motivate athletes, and provide objective feedback [43]. PEU of TEPDs, athletes’ PU, and acceptance intention are also judged to have increased.
Sixth, PU has a significant influence on acceptance intention. As TEPDs have been used in all recent international competitions, one can expect that the higher the PU of the TEPD, the more the acceptance intention increases. Notably, the rules have been gradually amended to increase athletes’ acceptance of the TEPD since its introduction [44]. However, as Taekwondo is a spectator sport, it is necessary to address technical problems so that spectators can also recognize the use of TEPDs and their usefulness.
6. Conclusions
The TAM provides a critical theoretical model for predicting the acceptance of TEPDs. The importance of PEU and PU as leading variables in predicting TEPD acceptability means that continuous improvement in perceived quality and wearability are required to develop athletes’ TEPD skills and improve the performance and fairness of Taekwondo competitions. As such, this study presents factors that enhance the effectiveness of the TAM and provides a predictive model appropriate for measuring athletes’ intention to accept TEPDs.
Author Contributions
Study design, S.-U.P. and D.-K.K.; study conduct, S.-U.P., D.-K.K., and H.A.; data collection, D.-K.K.; data analysis, S.-U.P. and D.-K.K.; data interpretation, S.-U.P. and D.-K.K.; drafting manuscript, S.-U.P., D.-K.K. and H.A.; revising the manuscript content, S.-U.P., D.-K.K. and H.A. All authors have read and agreed to the published version of the manuscript.
Funding
This research received no external funding.
Acknowledgments
This study supplemented the contents announced at the 2019 International Conference on Biotechnology and Sports Engineering.
Conflicts of Interest
The authors declare no conflict of interest.
References
- International Olympic Committee. Taekwondo. Available online: https://www.olympic.org/taekwondo/ (accessed on 28 January 2021).
- World Taekwondo Federation. ABOUT WT. Available online: http://www.worldtaekwondo.org/about-wt/about.html (accessed on 28 January 2021).
- Korea Institute of Sport Science. Taekwondo Olympic Games Status Maintenance Plan. Available online: https://www.sports.re.kr/pyxis-api/1/digital-files/bea28d12-5830-45d2-ae24-65c7bd4776b6/ (accessed on 28 January 2021).
- Kim, J. Electronic Hogu, ‘OK’ for London Olympic Games. Available online: http://www.mookas.us/media_view.asp?news_no=1655/ (accessed on 5 April 2011).
- Ko, Y.J.; Cattani, K.; Chang, Y.; Hur, Y. Do spectators and competitors accept the use of scoring technology in Taekwondo competitions? Int. J. Sport Manag. Mark. 2011, 9, 238–253. [Google Scholar] [CrossRef]
- Del Vecchio, F.B.; Franchini, E.; Del Vecchio, A.H.M.; Pieter, W. Energy absorbed by electronic body protectors from kicks in a taekwondo competition. Biol. Sport 2011, 28, 75–78. [Google Scholar] [CrossRef]
- Song, Y.; Jeon, Y.; Park, G.; An, H.; Hwang, T.; Lee, H.; Lee, S. Development of taekwondo trainer system for training on electronic protector with hitting target indicator. Int. J. Comput. Sci. Netw. Secur. 2010, 10, 51–56. [Google Scholar]
- Bae, Y.S. Relationship between the impact value of electronic body protector and the impact force of force platform in the Taekwondo. Korean J. Sport Biomech. 2013, 23, 125–130. [Google Scholar] [CrossRef][Green Version]
- Jeong, H.S.; O’sullivan, D.M.; Lee, S.C.; Lee, S.Y. Safety evaluation of protective equipment for the forearm, shin, hand and foot in taekwondo. J. Sports Sci. Med. 2019, 18, 376–383. [Google Scholar]
- O’Sullivan, D.M.; Fife, G.P. Impact attenuation of protective boxing and taekwondo headgear. Eur. J. Sports Sci. 2016, 16, 1219–1225. [Google Scholar] [CrossRef]
- O’Sullivan, D.M.; Fife, G.P.; Pieter, W.; Shin, I. Safety performance evaluation of taekwondo headgear. Br. J. Sports Med. 2013, 47, 447–451. [Google Scholar] [CrossRef]
- Cho, E.H. Regional Perception in Searching for the ‘Recognized Electronic Protectors Problems’. Korean J. Meas. Eval. Phys. Educ. Sport Sci 2015, 17, 47–56. [Google Scholar]
- Moon, W.J.; Jung, K.C. The Technical Analysis Based in the Types of Olympic Taekwondo Game. Sports Sci. 2014, 31, 85–92. [Google Scholar]
- David, M.L.; Zoe Co, L.P.; Newmark, A.R.; Groisser, A.; Jay, H.; Jennifer, S.H.; David, W.B. Design and testing of a mobile health application rating tool. NPJ Digit. Med. 2020, 3, 1–7. [Google Scholar]
- Peter, B.; Relish, C.; Yaoqi, Z. Large expert-curated database for benchmarking document similarity detection in biomedical literature search. Database 2019, 1–66. [Google Scholar]
- Shih-Cheng, H.; Tanay, K.; Imon, B.; Chris, C.; Robyn, L.B.; Norah, B.; Andrew, H.; Bhavik, N.P.; Pranav, R.; Jeremy, I.; et al. PENet—a scalable deep-learning model for automated diagnosis of pulmonary embolism using volumetric CT imaging. NPJ Digit. Med. 2020, 3, 1–9. [Google Scholar]
- Davis, F.D. Perceived usefulness, perceived ease of use, and user acceptance of information technology. Mis Q. 1989, 13, 319–340. [Google Scholar] [CrossRef]
- Lee, Y.; Kozar, K.A.; Larsen, K.R. The technology acceptance model: Past, present, and future. Commun. Assoc. Inf. Syst. 2003, 12, 50. [Google Scholar] [CrossRef]
- Lucas, H.C.; Spitler, V.K. Implementation in a world of workstations and networks. Inf. Manag. 2000, 38, 119–128. [Google Scholar] [CrossRef]
- Venkatesh, V.; Davis, F.D. A theoretical extension of the technology acceptance model: Four longitudinal field studies. Manag. Sci. 2000, 46, 186–204. [Google Scholar] [CrossRef]
- Fishbein, M.; Ajzen, I. Belief, Attitude, Intention, and Behavior: An Introduction to Theory and Research; Addison-Wesley: Reading, MA, USA, 1975. [Google Scholar]
- Ajzen, I. From Intentions to Actions: A Theory of Planned Behavior. In Action Control; Springer: Berlin/Heidelberg, Germany, 1985; pp. 11–39. [Google Scholar]
- Davis, F.D.; Bagozzi, R.P.; Warshaw, P.R. User acceptance of computer technology: A comparison of two theoretical models. Manag. Sci. 1989, 35, 982–1003. [Google Scholar] [CrossRef]
- Ajzen, I. The theory of planned behavior. Organ. Behav. Hum. Decis. Process. 1991, 50, 179–211. [Google Scholar] [CrossRef]
- Lee, M.C. Factors influencing the adoption of internet banking: An integration of TAM and TPB with perceived risk and perceived benefit. Electron. Commer. Res. Appl. 2009, 8, 130–141. [Google Scholar] [CrossRef]
- Herrera, S.I.; Fénnema, M.C. Tecnologías móviles aplicadas a la educación superior. In XVII Congreso Argentino de Ciencias de la Computación; SEDICI: Buenos Aires, Argentina, 2011; pp. 620–630. [Google Scholar]
- Gómez-Ramirez, I.; Valencia-Arias, A.; Duque, L. Approach to M-learning acceptance among university students: An integrated model of TPB and TAM. Int. Rev. Res. Open Distrib. Learn. 2019, 20, 141–164. [Google Scholar] [CrossRef]
- Sung, H.J.; Jeon, H.M. Untact: Customer’s Acceptance Intention toward Robot Barista in Coffee Shop. Sustainability 2020, 12, 8598. [Google Scholar] [CrossRef]
- Lunney, A.; Cunningham, N.R.; Eastin, M.S. Wearable fitness technology: A structural investigation into acceptance and perceived fitness outcomes. Comput. Hum. Behav. 2016, 65, 114–120. [Google Scholar] [CrossRef]
- Kim, B.G.; Choi, Y.H. Effects of perceived quality on brand attitudes and purchase intention by the Taekwondo electronic hogu experience. Korean J. Sport 2017, 15, 513–522. [Google Scholar]
- Lee, S.I. A Study of the Influence of Technical and Indivisual Characteristics on the Acceptance Intention and Performance Expectation of Healthcare Werable Devices. Ph.D. Thesis, Konkuk University, Seoul, Korea, 2017. [Google Scholar]
- Park, S.U. Prediction of intention to use internet Taekwondo media using extended technology acceptance model. Taekwondo J. Kukkiwon 2020, 11, 47–59. [Google Scholar]
- Kline, R.B. Principle and Practice of Structural Equation Modeling; Guilford Press: New York, NY, USA, 1998. [Google Scholar]
- Hair, J.F.; Black, W.C.; Babin, B.J.; Anderson, R.E.; Tatham, R.L. Multivariate Data Analysis, 6th ed.; Pearson Prentice Hall: Upper Saddle River, NJ, USA, 2006. [Google Scholar]
- Fornell, C.; Larcker, D.F. Evaluating structural equation models with unobservable variables and measurement error. J. Mark. Res. 1981, 18, 39–50. [Google Scholar] [CrossRef]
- Nunnally, J.C.; Bernstein, I.H. The assessment of reliability. Psychom. Theory 1994, 3, 248–292. [Google Scholar]
- West, S.G.; Finch, J.F.; Curran, P.J. Structural Equation Models with Nonnormal Variables: Problems and Remedies. In Structural Equation Modeling: Concepts, Issues, and Applications; Hoyle, R.H., Ed.; Sage: Thousand Oaks, CA, USA, 1995; pp. 56–75. [Google Scholar]
- Leveaux, R. 2012 Olympic Games Decision Making Technologies for Taekwondo Competition. Commun. IBIMA 2012, 1–8. [Google Scholar] [CrossRef]
- Falcó, C.; Conchado, A.; Estevan, I. The effect of color on the use of electronic body protectors in taekwondo matches. Percept. Mot. Ski. 2016, 122, 812–824. [Google Scholar] [CrossRef]
- Sevinç, D.; Çolak, M. The effect of electronic body protector and gamification on the performance of taekwondo athletes. Int. J. Perform. Anal. Sport 2019, 19, 110–120. [Google Scholar] [CrossRef]
- Tasika, N. Reliability & linearity of an electronic body protector employed in taekwondo games: A preliminary study. J. Hum. Sport Exerc. 2013, 8, S622–S632. [Google Scholar]
- Kailian, G.S. Sport Taekwondo Referee Primer; Word Association Publishers: Tarentum, PA, USA, 2010. [Google Scholar]
- Ball, N.; Nolan, E.; Wheeler, K. Anthropometrical, physiological, and tracked power profiles of elite taekwondo athletes 9 weeks before the Olympic competition phase. J. Strength Cond. Res. 2011, 25, 2752–2763. [Google Scholar] [CrossRef]
- Moenig, U. Rule and equipment modification issues in World Taekwondo Federation (WTF) competition. Ido Movement for Culture. J. Martial Arts Anthropol. 2015, 15, 3–12. [Google Scholar]


Publisher’s Note: MDPI stays neutral with regard to jurisdictional claims in published maps and institutional affiliations. |
© 2021 by the authors. Licensee MDPI, Basel, Switzerland. This article is an open access article distributed under the terms and conditions of the Creative Commons Attribution (CC BY) license (http://creativecommons.org/licenses/by/4.0/).