Article

An Efficient Direction of Arrival Estimation Algorithm for Sources with Intersecting Signature in the Time–Frequency Domain

1
Department of Electrical Engineering, Foundation University, Islamabad 44000, Pakistan
2
Department of Electrical Engineering, University of Engineering and Technology, Peshawar 25000, Pakistan
3
Department of Information and Communicaiton, Yeungnam University, Gyeongsan 38541, Korea
*
Authors to whom correspondence should be addressed.
Appl. Sci. 2021, 11(4), 1849; https://doi.org/10.3390/app11041849
Submission received: 4 January 2021 / Revised: 9 February 2021 / Accepted: 16 February 2021 / Published: 19 February 2021
(This article belongs to the Section Electrical, Electronics and Communications Engineering)

Abstract

:
An efficient direction of arrival estimation method is proposed. The proposed algorithm accurately estimates the instantaneous frequency of signals received by multiple sensors (array of sensors/antennas). The estimated instantaneous frequency is then used to separate sources and estimate their direction of arrivals. Experimental results indicate that the proposed method achieves better performance than the existing methods both in terms of computational requirements and localization accuracy. It is also shown that the proposed method can work in under-determined situations.

1. Introduction

Direction of arrival (DOA) estimation is an important problem in many real-life applications such as MIMO communication and radar signal processing. Multiple Signal Classification (MUSIC) is a well-known algorithm for DOA estimation that first computes the covariance matrix of the received signals and then performs Eigen decomposition of the covariance matrix to estimate the DOA [1,2,3]. Time–frequency (TF) MUSIC algorithm further enhances the MUSIC algorithm by employing spatial time–frequency distributions (STFDs) that allow the selection of high energy points in the TF domain thus improving the estimate of the covariance matrix [4,5,6,7,8,9]. Conventional time-domain MUSIC algorithm or its TF extension are only applicable in the over-determined scenario, i.e., when the number of sensors is higher than the number of sources.
STFDs can be employed to estimate DOA in under-determined scenarios, i.e., when the number of sensors is not higher than the number of sources. STFDs are used to extract the TF signatures of sources and then estimate their DOA separately thus enabling the Spatial TF approach to become applicable in the under-determined scenario [9,10]. TF filtering is another computational and memory-efficient approach that first separates sources and then employs MUSIC algorithm to estimate their DOAs [11,12,13]. In order to separate sources either through TF filtering or employing STFD based approach, we need to find out the TF signature of sources [13,14,15,16,17]. The TF signature of sources can be extracted using instantaneous frequency (IF) estimation methods like connected component linking [18] or blind source separation based methods [19,20]. However, these methods are not applicable to signals that intersect each other as the IF estimation method may switch to a wrong path after the intersection point e.g., Figure 1 illustrates a scenario when signal components intersect each other and when signal components do not intersect. For such signals, one approach can be to use morphological image processing techniques to extract TF signatures of sources [14,15]. However, morphological operations are sensitive to noise. DOA can be estimated in an under-determined scenario by using an orthogonal projection operator in combination with short-time Fourier transform [21]. This method assumes that at any given TF point number of sources is less than or equal to 2 [21]. Parametric methods like Hough transform are another option to estimate DOA for more than 2 signals intersecting each other but this approach is limited only for linear frequency modulated signals [22]. Matching pursuit has also been used to estimate the TF signature of sources but this method requires signals to follow some parametric model [23]. In our earlier studies [24,25], two DOA estimation methods have been developed for sources that intersect each other in the TF domain. One of these methods first enhances STFD with directional smoothing and then employs the Viterbi algorithm for IF estimation followed by source localization [24,26]. The major limitation of this method is the extensive computational cost due to both the computation of the STFD and the Viterbi algorithm [27]. The other method uses ridge detection and tracking-based IF estimation method for source separation followed by DOA estimation [25,28]. The method is thus computationally efficient as compared to the Viterbi algorithm, but it still requires the computation of adaptive directional time–frequency distribution (ADTFD), which is a computationally expensive step.
In short, the DOA estimation in an under-determined scenario at a low signal-to-noise ratio becomes a challenging problem when signal components cross each other because the existing methods are either too computationally expensive or they require signal IF laws to follow any particular signal model. In this study, we propose a computationally efficient method to estimate DOA in an under-determined scenario. The proposed method first estimates the IF of a multi-component signal by developing an efficient IF estimation algorithm for multi-sensor scenario (i.e., when the signal is received by multiple sensors). The estimated IFs are then used to separate sources. Finally, the DOA of each source is separately estimated by employing the MUSIC algorithm.
The salient features of the method are:
  • The method can achieve good performance in low signal to noise ratios in both under-determined and over-determined scenario.
  • The method is applicable to a large class of signals and does not require signals to have a non-overlapping signature in the TF domain or follow a specific mathematical model.
  • The method is computationally efficient as compared to the methods of similar performance.
The key contributions of this study are as follows:
  • A computationally efficient and accurate multi-sensor IF estimation algorithm is developed that achieves better performance without requiring the computation of Adaptive directional time–frequency distributions [28] or Viterbi algorithm [26] thus both reducing computational cost and resulting in improved performance.
  • A DOA estimation method, based on multi-sensor IF estimation, is developed that achieves better performance as compared to our existing methods, which are the Viterbi-based algorithm and ridge tracking approach, both in terms of computational cost and performance [24,25].
The remaining paper is organized as follows. The signal model is presented in Section 2. The proposed methodology is elaborated in Section 3. The computational cost comparison with other related methods is given in Section 4. Numerical results are provided in Section 5 and work is concluded in Section 6.

2. Signal Model

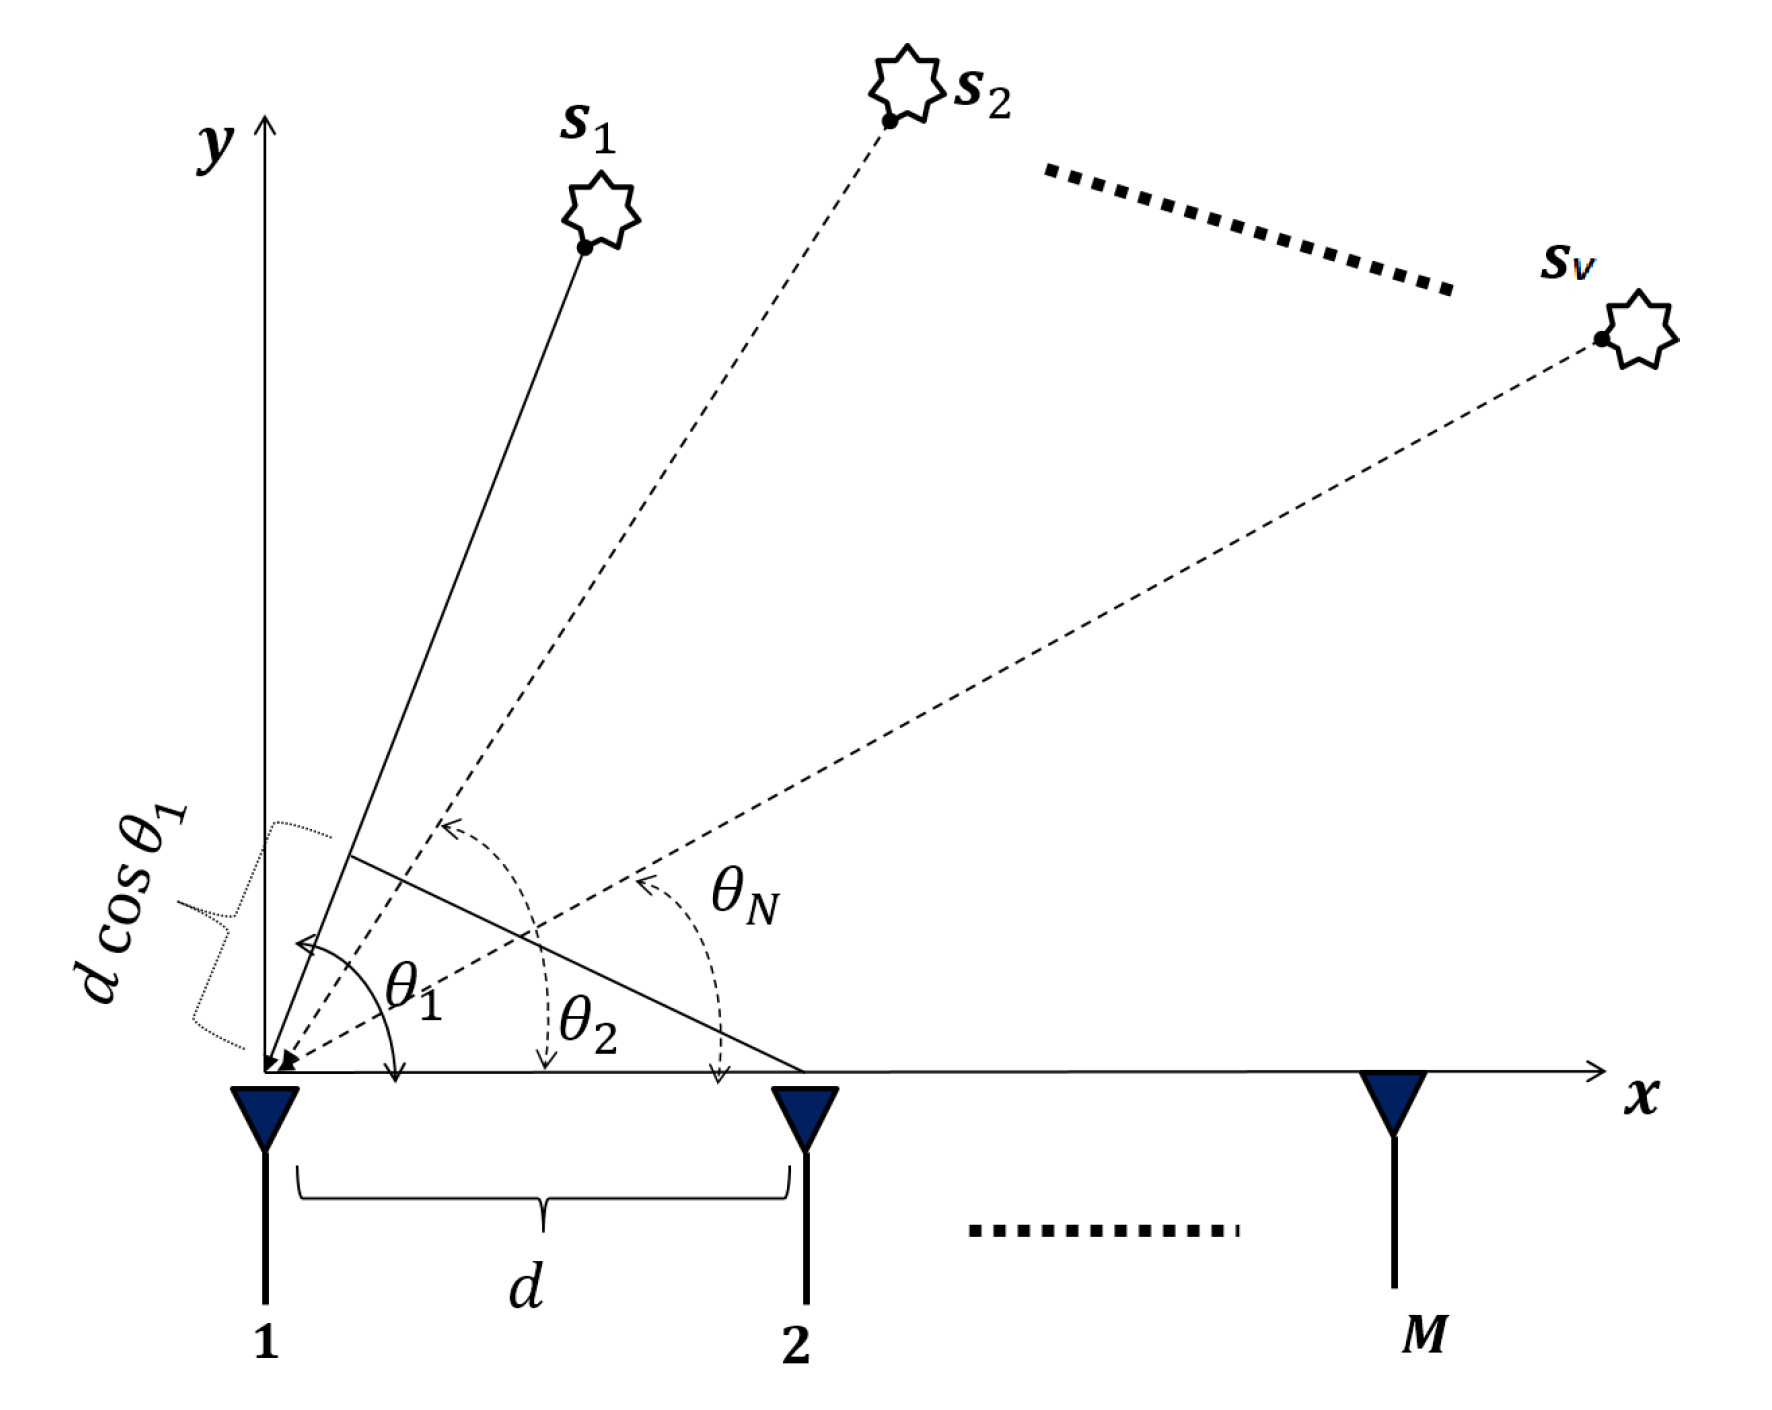
Let us consider a uniform linear array with M elements that receives a total of V source signals from different directions as shown in Figure 2. The sources are assumed to be static points from which the signal energy is originated. For example, the received signals may be emission of electromagnetic energy from transmitters at different locations as in the case of passive RADAR systems (bistatic RADAR system). It is also assumed that the sources are in the far-field. For simplicity, the sources and antenna array are considered as co-planar. The received signals are modeled as:
x t = A s t + w ( t ) = v = 1 V a θ v s v t + n t
In Equation (1), M × 1 vector x t = x 1 t , x 2 t , , x M t T contains the received signals, V × 1 sized vector s t = s 1 t , s 2 t , , s V ( t ) T contains V narrow band source signals, M elements of vector n ( t ) are additive white Gaussian noise (AWGN). Similarly, M × V matrix A denotes a steering matrix which is modeled as:
A = a θ 1 , a θ 2 , , a θ V
The v-th column a θ v in the steering matrix A is called a steering vector that corresponds to the signal s v t arrived from θ v direction:
a θ v = 1 , e j 2 π d λ cos θ v , e j 2 π 2 d λ cos θ v , , e j 2 π M 1 d λ cos θ v
In Equation (3), the parameter λ represents the wavelength and parameter d denotes the distance between sensors. Similarly, the v-th source signal, i.e., s v t , is a frequency modulated (FM) signal, given as:
s v t = α v t e j ϕ v t ,
where α v t and ϕ v t are the instantaneous amplitude and the instantaneous phase of s v t . The IF of s v t is given as:
f v t = 1 2 π d ϕ v t d t

3. Methodology

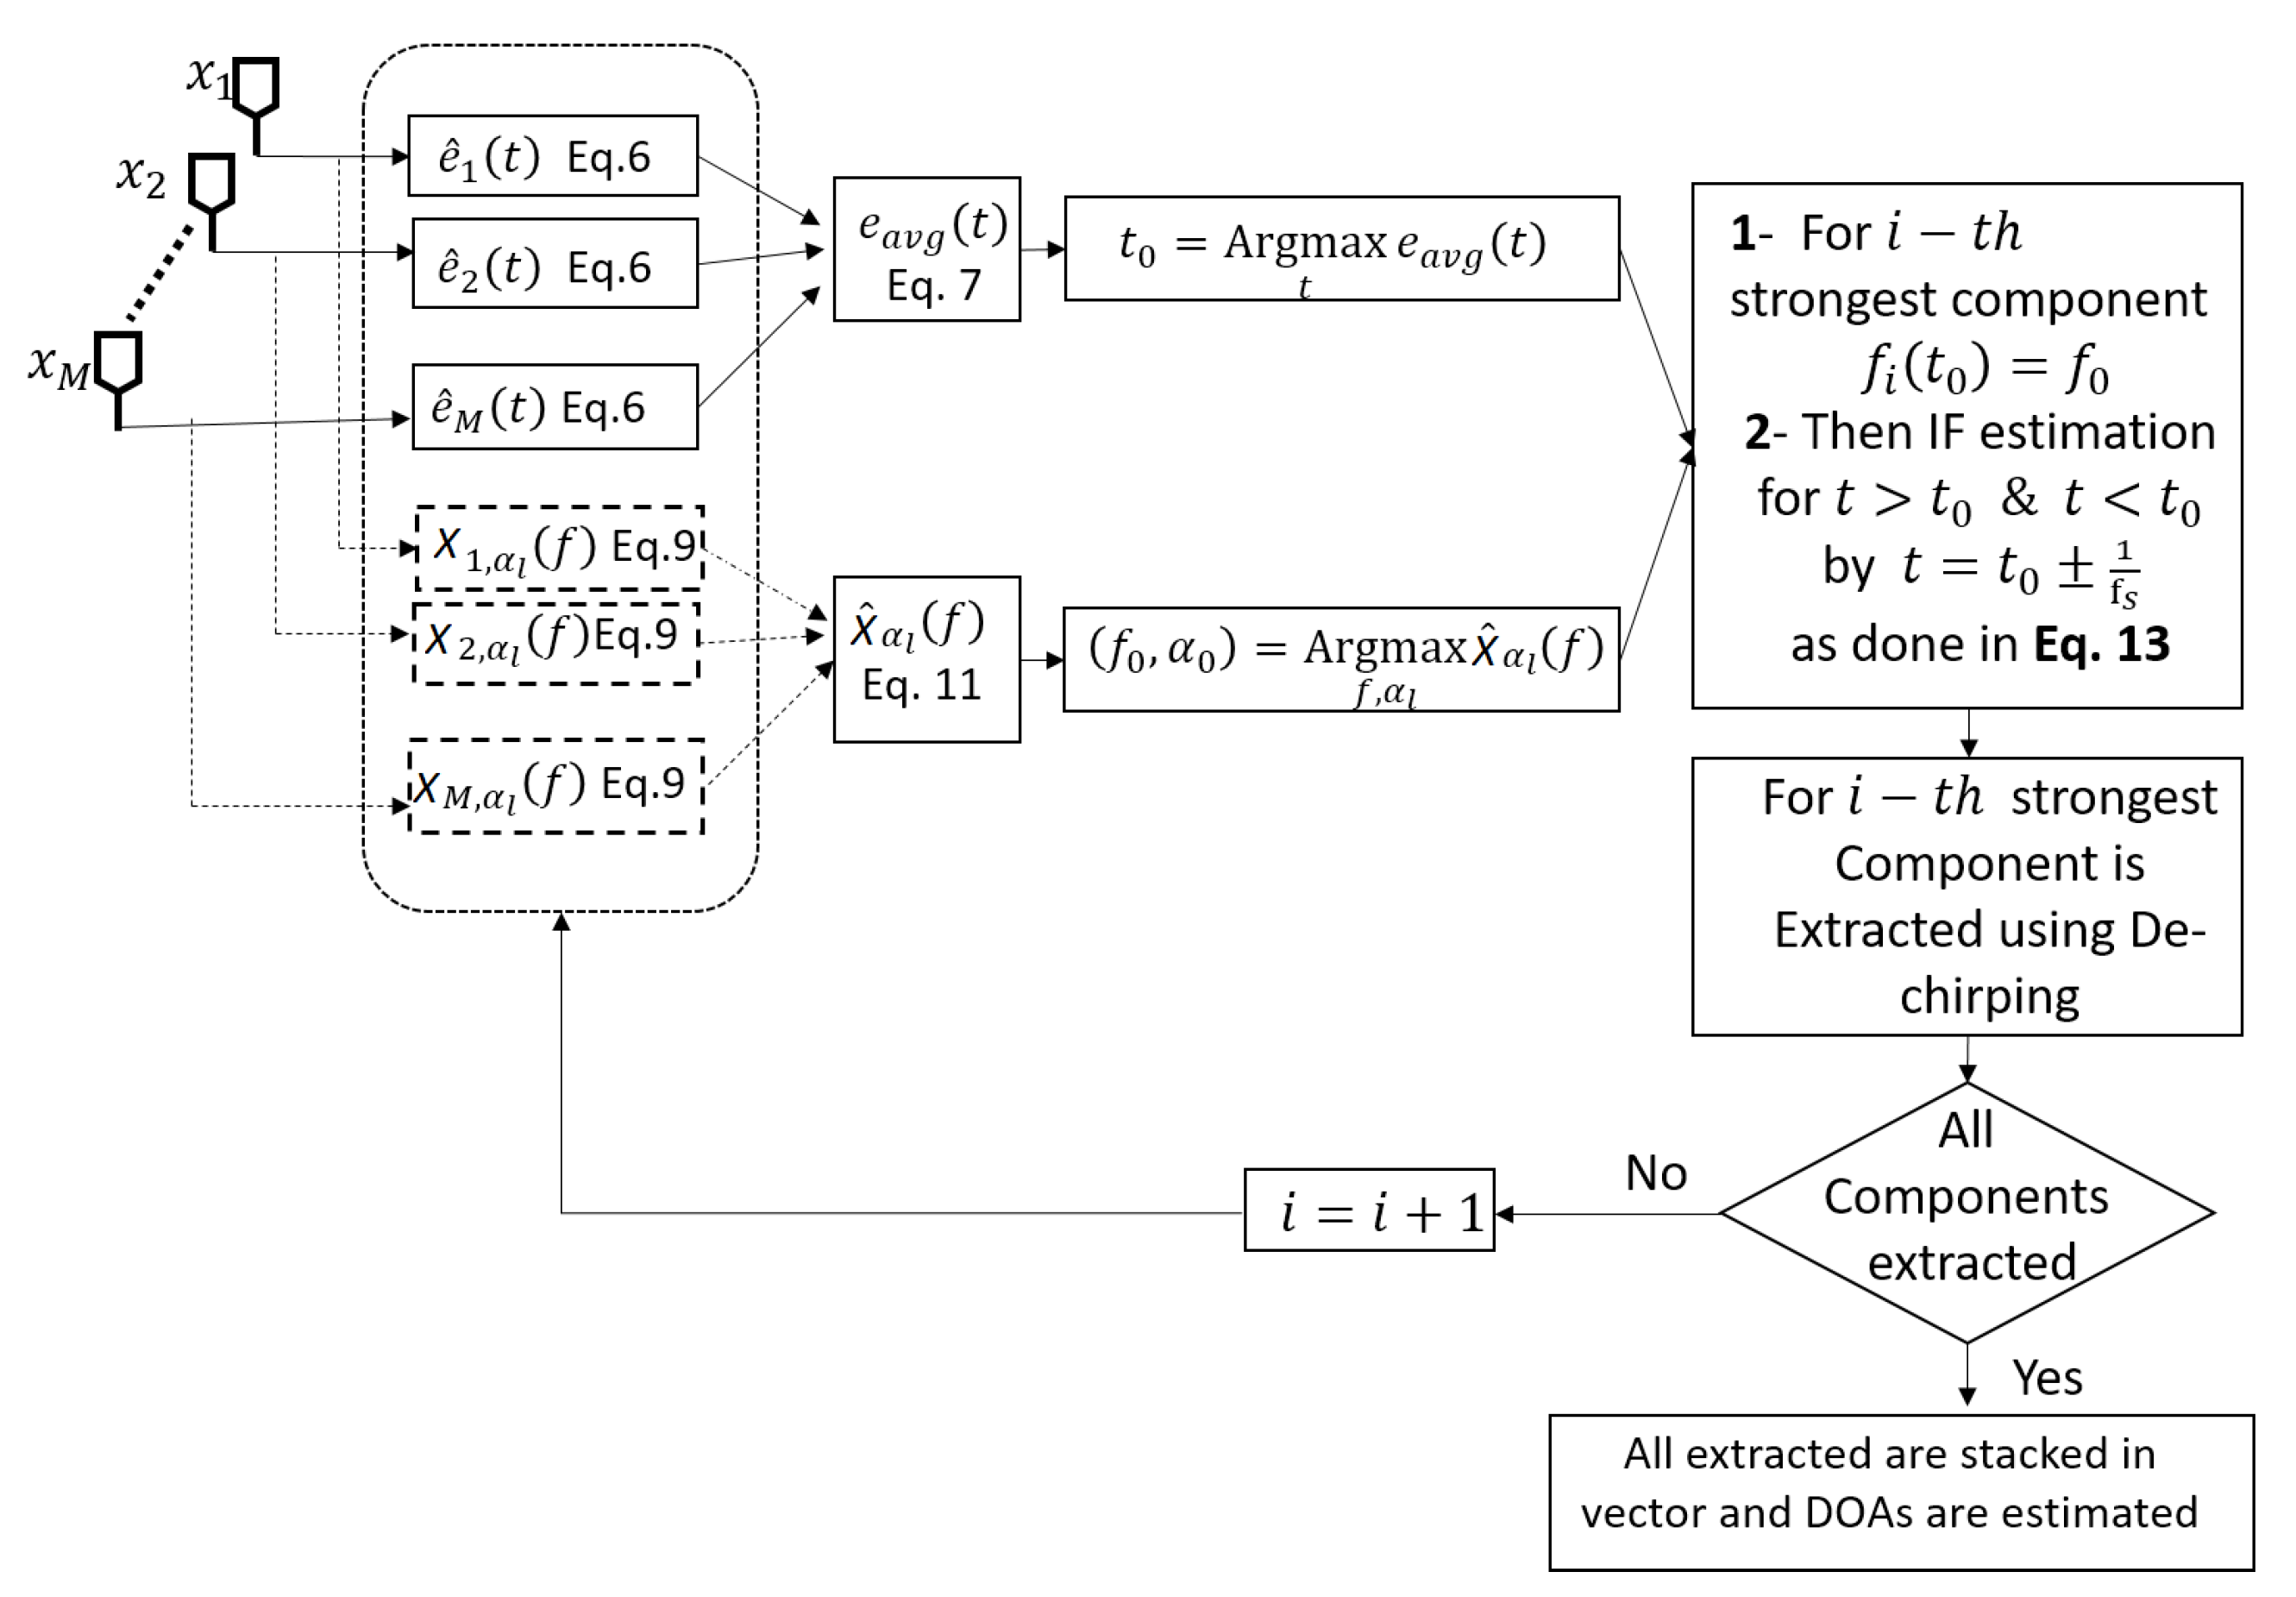
In this section, we present the details about the proposed DOA algorithm. In Section 3.1, an IF estimation scheme for signals received at multi-sensor is discussed. Then, in Section 3.2 we explain how the source signals are separated using the estimated IFs with the help of TF filtering. Finally, in Section 3.3 MUSIC algorithm is used to find the directions of the received source signals. For the facilitation of readers, the proposed methodology is illustrated in Figure 3.

3.1. Multi-Sensor IF Estimation Algorithm

In this section, we develop a multi-sensor IF estimation algorithm by extending an existing mono-sensor IF estimation algorithm [27]. The proposed algorithm first estimates the IF of the strongest component, removes it from the given signal and this process is repeated till the IF of all the components has been estimated. To estimate the IF of the strongest component, the method first searches for the strongest energy TF point and then tracks the IF by exploiting the slow variation in IF curves. The details of the algorithm are given in the following subsections.

3.1.1. Finding out Highest Energy Time-Instant

The energy with in a short time t + Δ T   to   t Δ T is found for the k-th sensor where k = 1 , 2 , , M , as:
e ^ k ( t ) = t + Δ T t Δ T x k ( τ ) 2 d τ ,
The short time energy is averaged across M sensors to find e avg t as:
e avg t = 1 M k = 1 M e k ^ ( t ) ,
The highest energy time-instant is at the location where e avg t is maximum:
t 0 = argmax t e avg t ,
The obtained t 0 will be used to compute the windowed Fourier transform of the signals received at all the M sensors for searching the location of the highest energy frequency bin.

3.1.2. Estimation of the Highest Energy Frequency Bin

Fractional Fourier Gaussian windows, i.e., w α l ( t t 0 ) , are used to window all signals received at M-sensors. Then the Fourier transform of the windowed signal at k-th sensor x k ( t ) w α l ( t t 0 ) is computed as [29]:
X k , α l ( f ) = e j 2 π f t x k ( t ) w α l ( t t 0 ) d t ,
where t 0 represents the time shift, k = 1 , 2 , , M ,
w α l ( t ) = e j α l / 2 j sin ( α l ) e μ 2 2 σ 2 e j π ( ( μ 2 + t 2 ) cos α l 2 t μ ) / sin α l d μ
and l = L , L + 1 , , 1 , 0 , 1 , L , α l = l L represents the rotation order and L is the number of quantization levels for α l . In this study, L = 100 . To reduce noise, the magnitude of the Fourier transform of the windowed signal is spatially averaged as:
X ^ α l ( f ) = k = 1 M | X k , α l ( f ) |
X ^ α l ( f ) is used to estimate both the peak frequency and rotation order:
( f 0 , α 0 ) = arg max f , α l X ^ α l ( f ) |
The IF at time-instant t 0 is given as: f i ^ ( t 0 ) = f 0 .

3.1.3. IF Estimation

Starting from the time instant t 0 first the IF is estimated for the case t > t 0 . Let us initialize i = 1 and t ^ = t 0 . Then t ^ is updated as: t ^ = t ^ + T s , where T s is the sampling period. To estimate the IF at t ^ , we estimate f 0 and α ^ that maximize the spatially averaged correlations of multi-sensor signals with the time-shifted and frequency modulated analysis window as:
( f 0 , α ^ ) = arg max f , α l k = 1 M e j 2 π f t x k ( t ) w α l ( t t ^ ) d t ,
The f i ^ ( t ) at t ^ becomes: f i ^ ( t ^ ) = f 0 . Note that search for the maximum frequency is restricted around f 0 Δ f f f 0 + Δ f and search for the rotation order, i.e., α is restricted around α 0 Δ α 0 , α 0 , Δ α 0 where Δ α 0 = 1 2 L + 1 . This restriction of the search space significantly reduces the computational cost. The process is repeated until t ^ < T , where T is the duration of the signal. We can employ a similar approach for IF estimation at t < t 0 .

3.2. TF Filtering Using IF and Covariance Matrix Estimation

Once the IF of a signal emitted by a source is estimated, a de-chirping based TF filter is applied to extract the source [30]. The de-chirping process using the IF f ^ v t for v = 1 , 2 , , V is implemented as follow:
First, the phase of the signal, i.e., ϕ ^ v t is estimated as:
ϕ ^ v t = 2 π 0 t f ^ v τ d τ . v = 1 , 2 , , V
Using ϕ ^ v t , we de-chirp x m ( t ) (signal received at m-th element of the antenna array) [12,30]:
y v , m t = x m ( t ) e j ϕ ^ v t = i = 1 V e j 2 π m 1 d λ cos θ i a i t e j ϕ i t e j ϕ ^ v t = e j 2 π m 1 d λ cos θ v a v t e j ϕ v t ϕ ^ v t + i = 1 i v K e j 2 π m 1 d λ cos θ i a i t e j ϕ i t e j ϕ ^ v t
Taking into account ϕ v t ϕ ^ v t 0 , we have
y v , m t = e j 2 π m 1 d λ cos θ v a ^ v t + i = 1 i k K e j 2 π m 1 d λ cos θ i a i t e j ϕ i t e j ϕ ^ v t
We can extract instantaneous amplitude and phase information, i.e., e j 2 π m 1 d λ cos θ v a ^ v t , from y v , m t by applying a low pass filter [12]. The source signal is obtained as:
x ^ v , m t = e j 2 π m 1 d λ cos θ k a ^ v t e j ϕ ^ v t
The aforementioned procedure is utilized to extract signals received at all m sensors for the ‘v-th source. The extracted signals are then stacked as:
x v t = x ^ v , 1 t , x ^ v , 2 t , , x ^ v , M t T .
From x v t , the covariance matrix is estimated:
D v = 1 T 0 T x v τ x v H τ d τ ,         v = 1 , 2 , , V .

3.3. Source Localization Using MUSIC Algorithm

The MUSIC algorithm is then employed as:
  • Both eigenvectors, i.e., v ^ 1 , v ^ 2 , v ^ 3 , v ^ M , and the corresponding eigenvalues, i.e., ε 1 , ε 2 , ε M are computed from D v .
  • The signal space is represented by the largest Eigen vector, i.e., v ^ 1 , and noise space is represented by the remaining vectors as there is the only one source in D v . The DOA is estimated from the peak of the spatial spectrum [1]:
    P MUSIC θ v = 1 i = 2 M a θ v v ^ i 2 ,

4. Computational Complexity

Each iteration of the multi-sensor IF estimation algorithm involves two major steps: (a) searching the highest energy TF point and (b) IF-estimation at other time-instants. Time-instant with highest instantaneous signal energy is estimated with O ( N W M ) , where W is the width of the window and N is the number of samples in the signal. The peak frequency bin is searched by using L Fourier transform operations for M sensors thus resulting in the computational cost of O ( M L W log W ) . The IF at other time-instant is estimated with the computational cost of O ( 3 P M W ) because the cost of computing Fourier transform at a single bin is O ( W ) and we compute FT using three different windows at P number of bins for M number of sensors. The IF is estimated at N samples so the computational cost for all time-instants excluding the starting point becomes O ( 3 P M W N ). The total computational cost of a single iteration thus becomes O ( 3 M P W N + M L W log W + N W M ) . The algorithm is repeated for V components so the total computational cost is O ( 3 V M P W N + V M L W log W + N W M V ) . The computational cost of TF filtering and MUSIC algorithm can be ignored as these operations are O ( N ) , which is less than the order of the proposed algorithm.

5. Experimental Results

5.1. Two Sources

Let us consider two sources emitting the following signals that are received by three sensors.
s 1 ( t ) = e ( 0.1 π j t + a j π t 3 )
s 2 ( t ) = e ( 0.45 π j t a j π t 3 ) ,
where a = 1.8311 × 10 5 . The sources are placed at angles 5 and 5 . The signal duration is from 0 to 128 s with sampling frequency equal to 1 Hz. The signals are received by uniform linear array of 4 sensors such that spacing between two sensors in one half of the wavelength. The estimated IF of the signal using the proposed algorithm vs. the original IF is shown in Figure 4 and the estimated DOA vs. the original DOA are shown in Figure 5. The length of the Gaussian window used in this study is 63 with σ = 1 and Δ f = 2 .
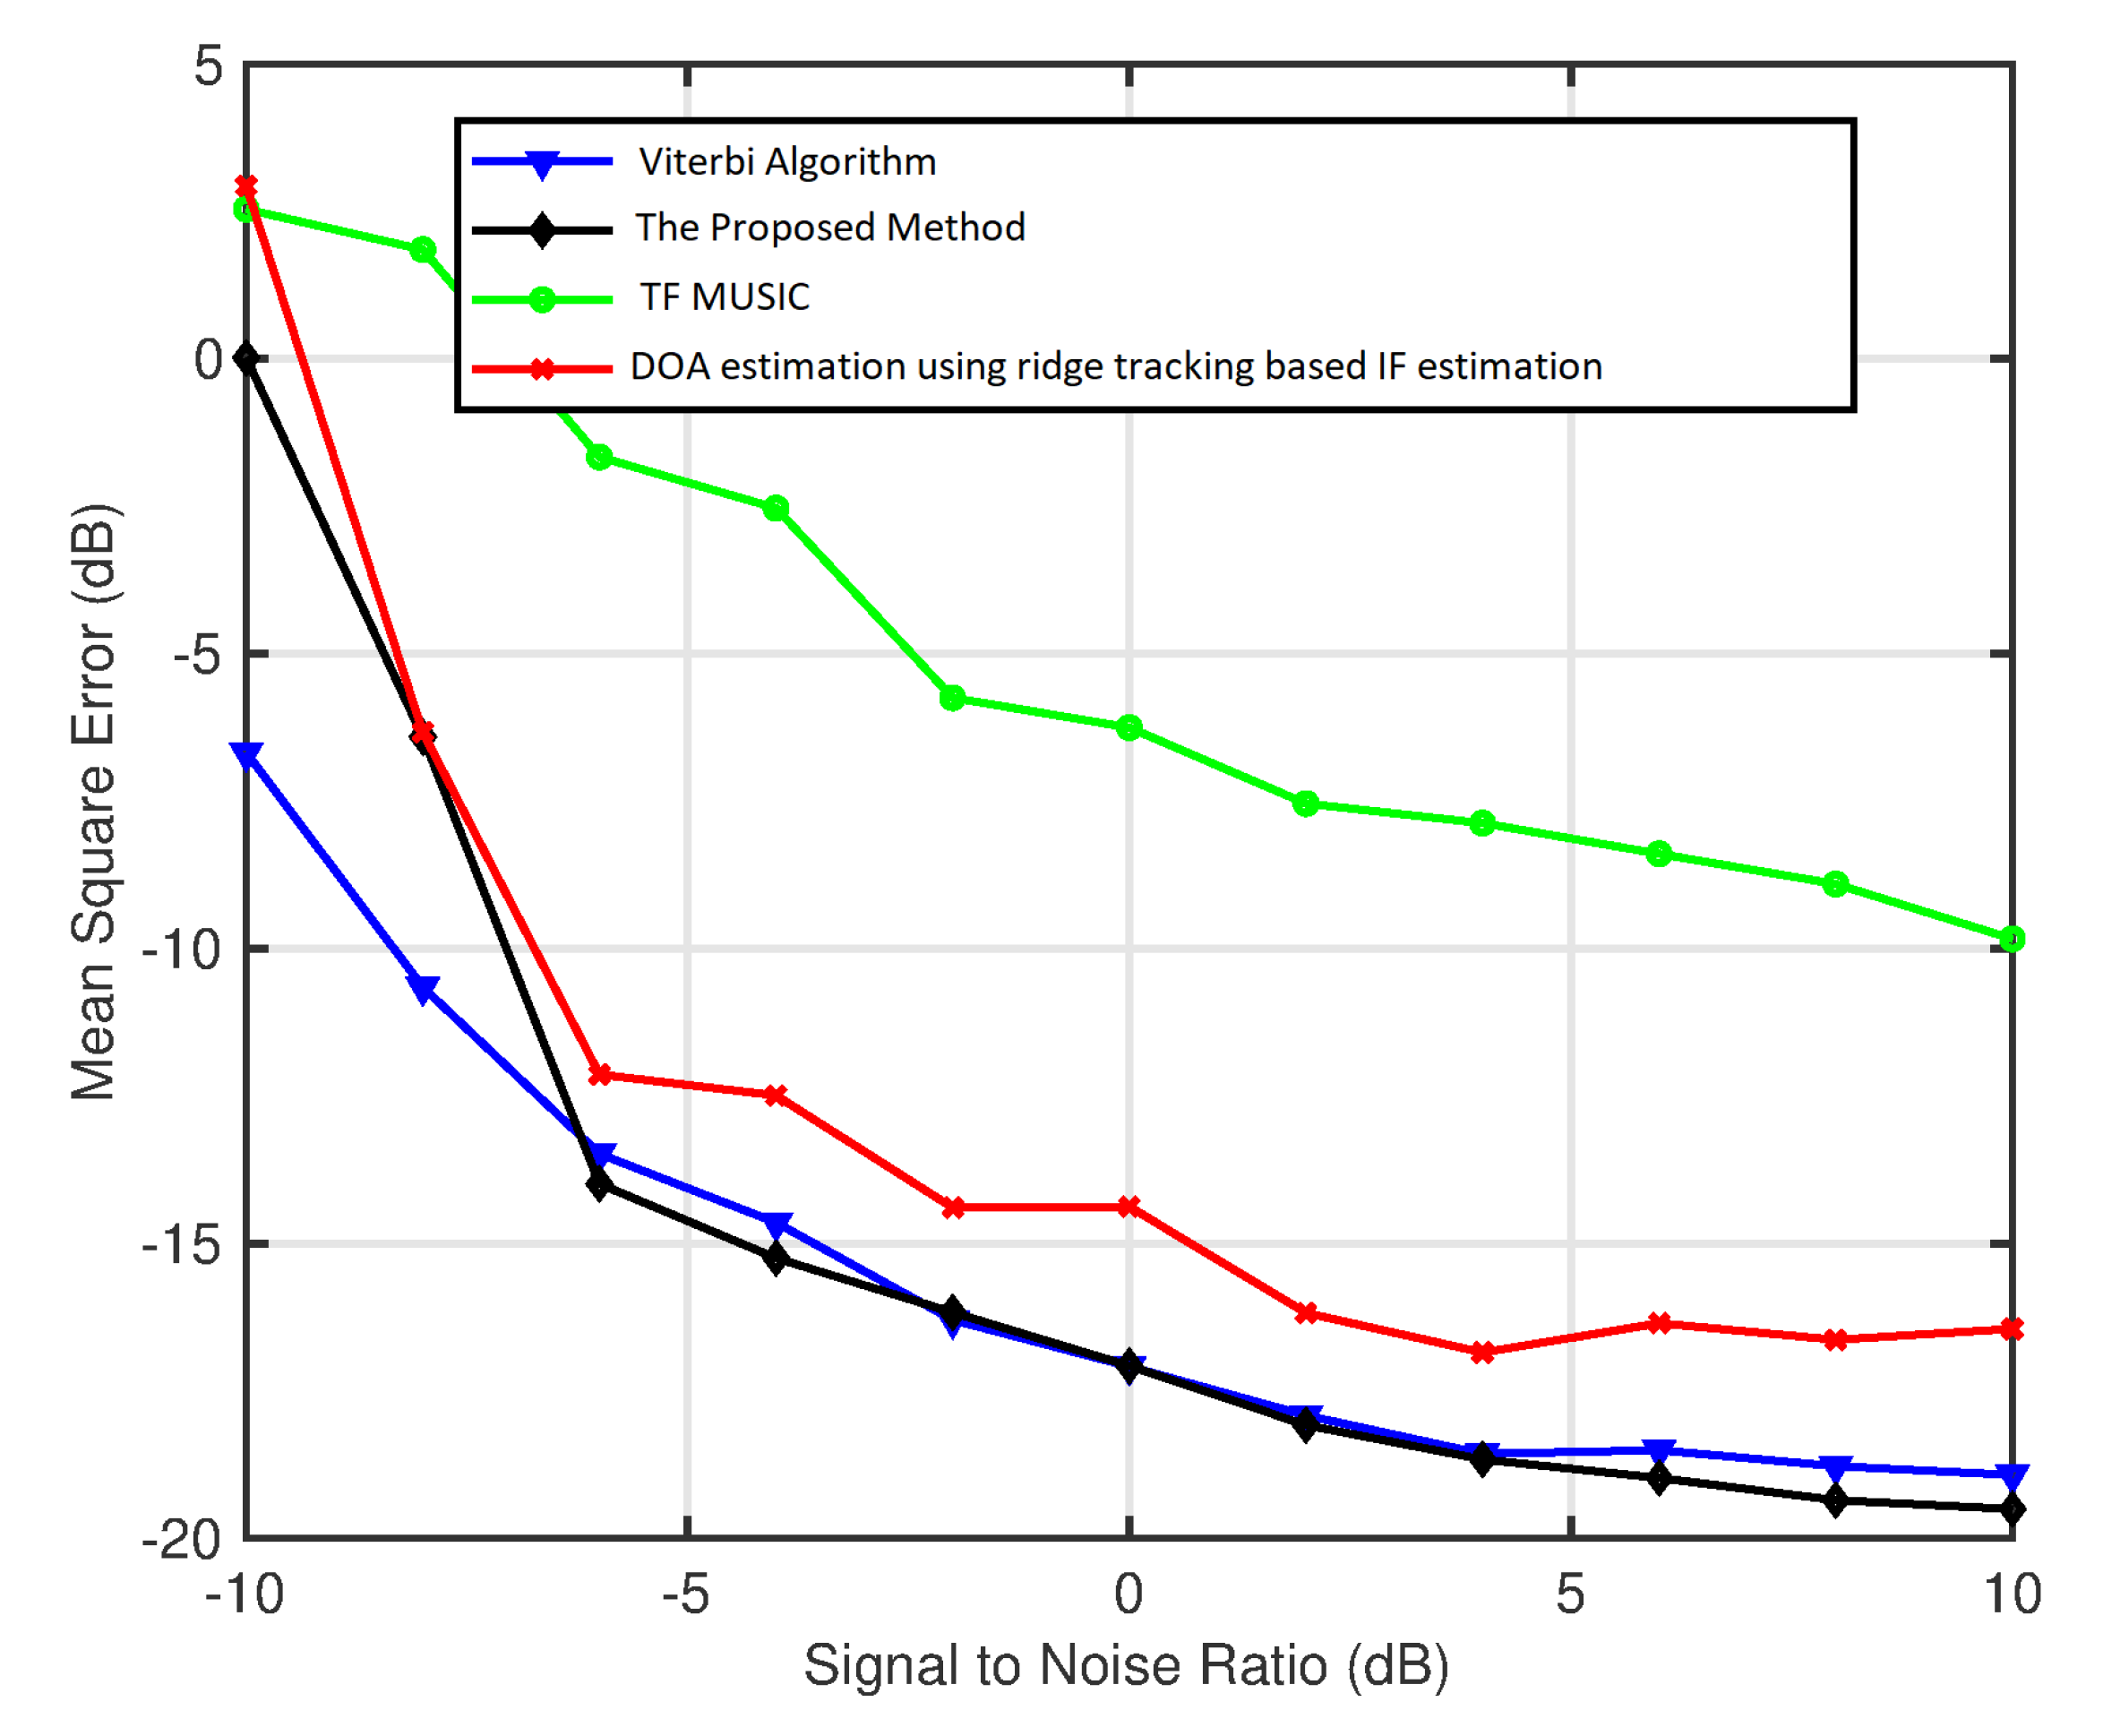
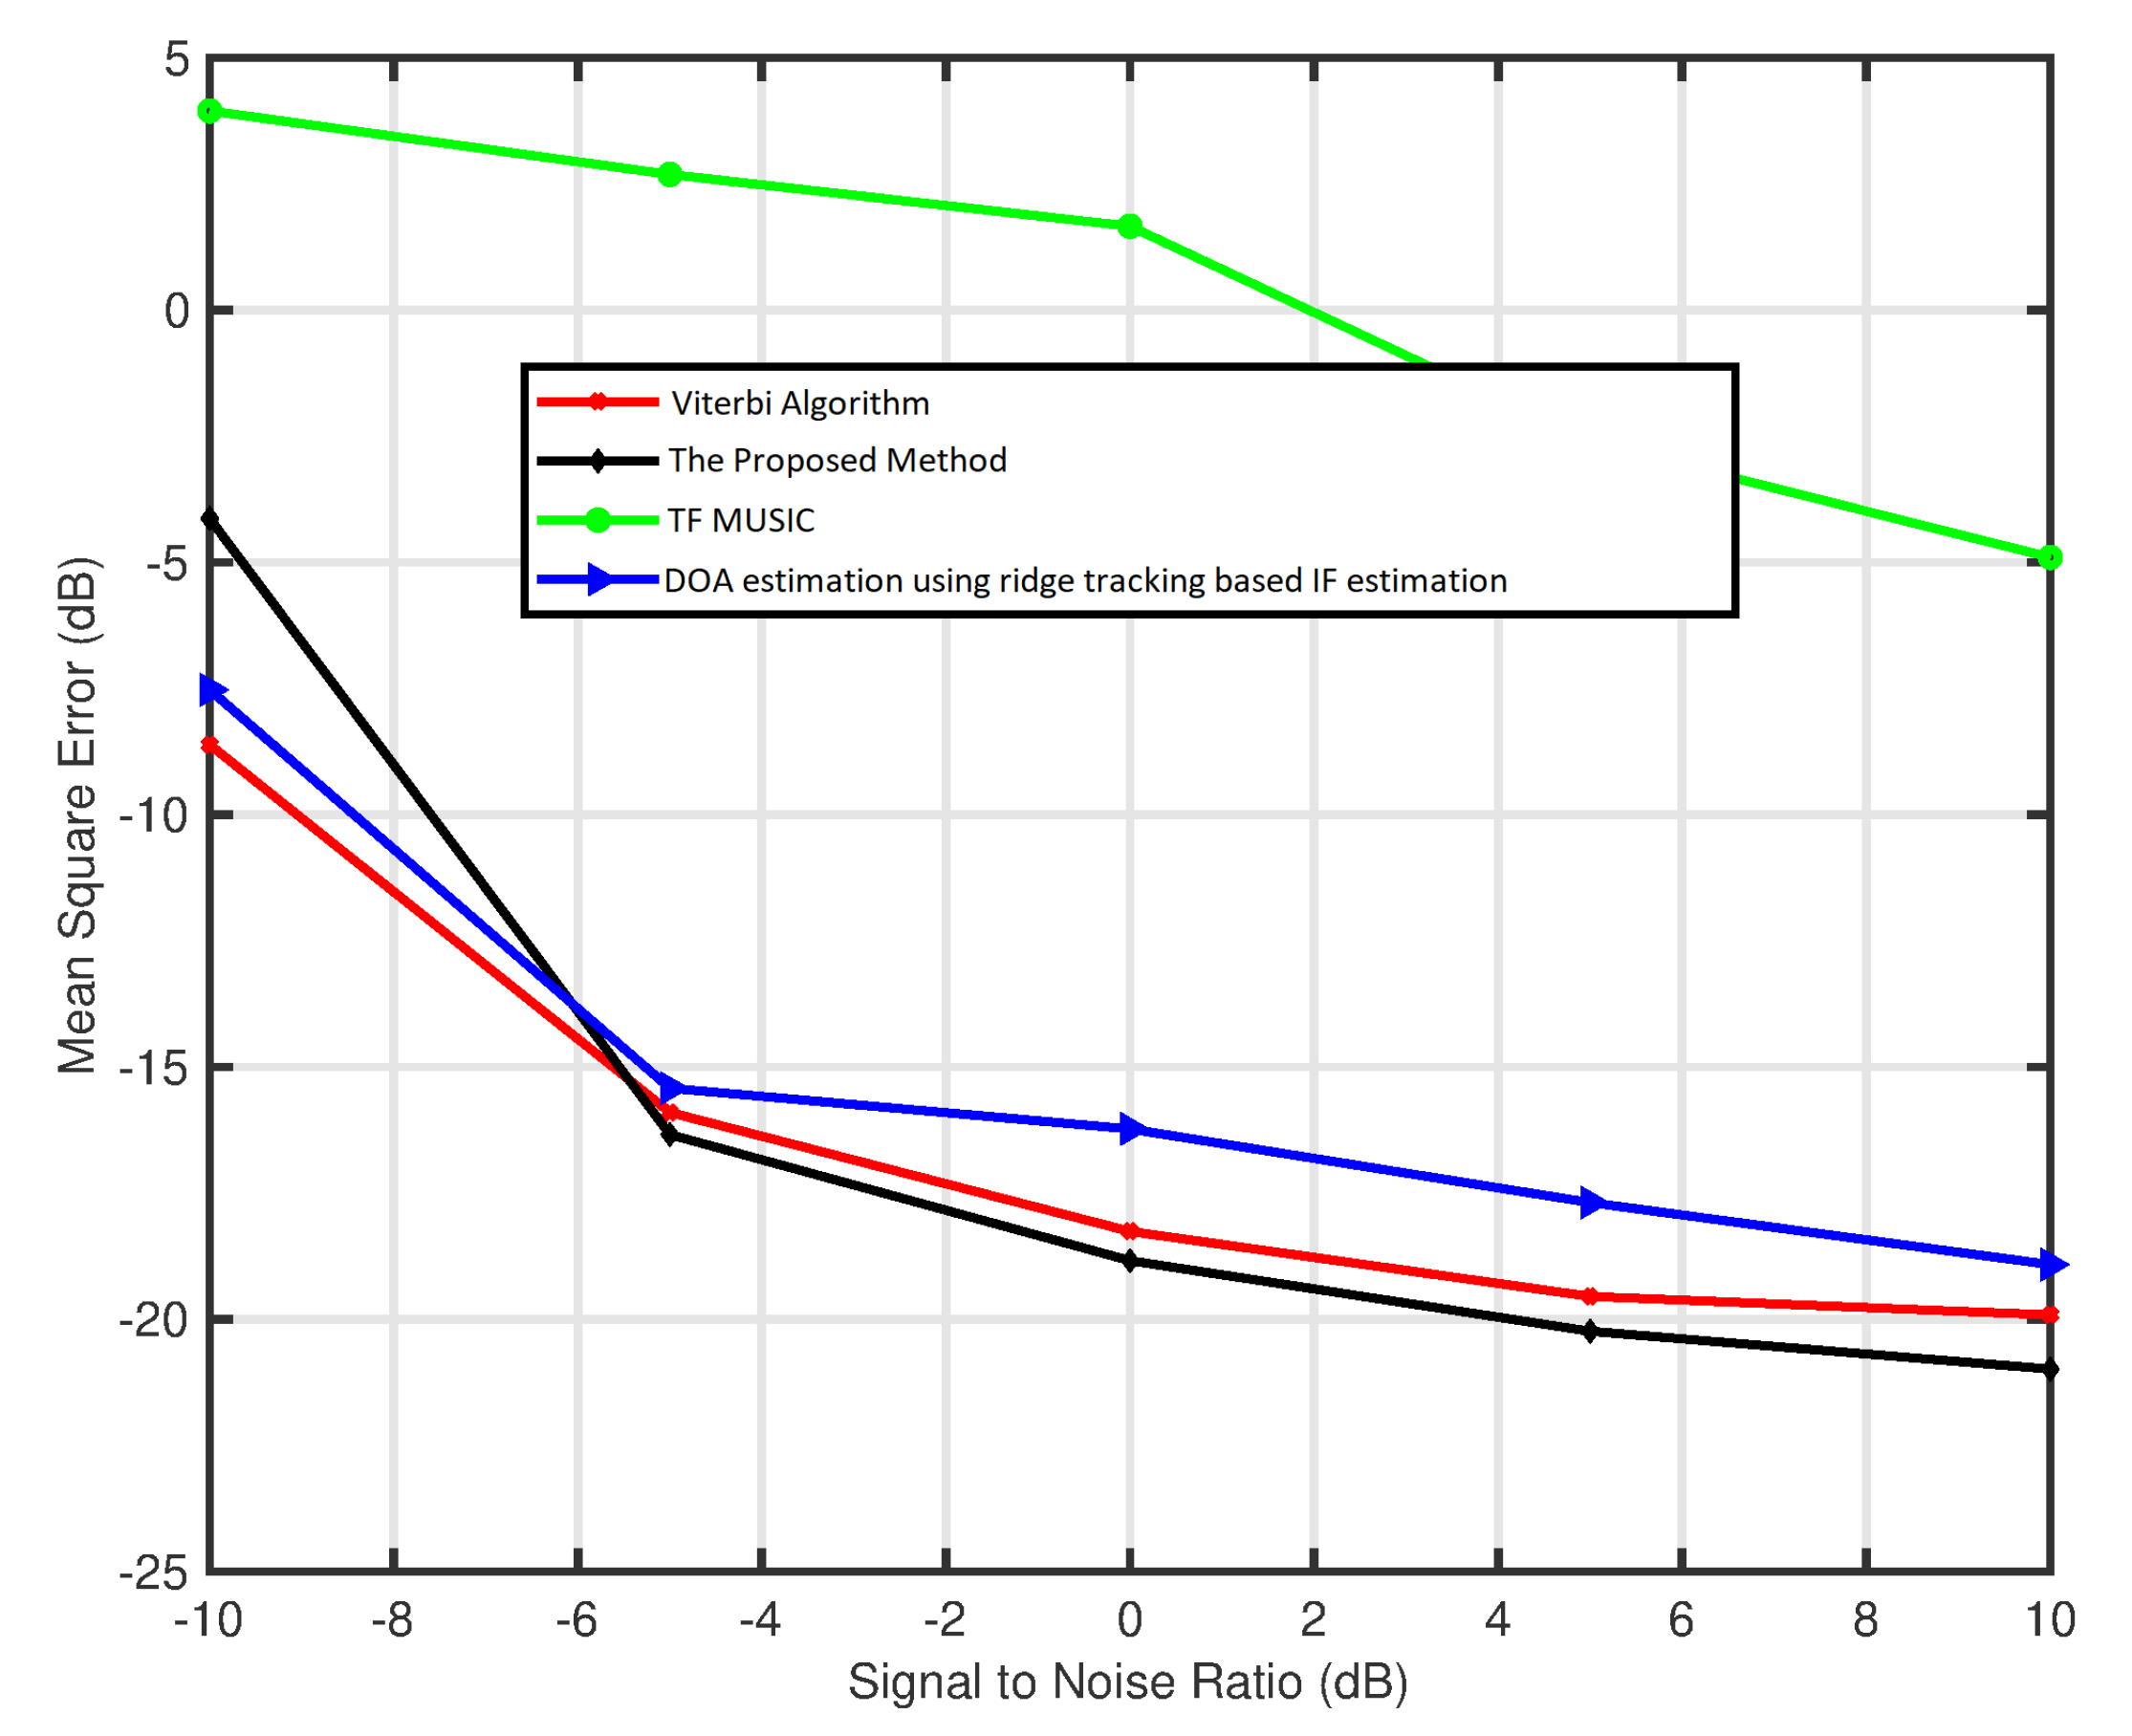
Let us compare the proposed algorithm with the conventional TF-MUSIC algorithm, the ADTFD based ridge tracking algorithm [25], and spatial adaptive TFD based Viterbi algorithm [24], for the signal to noise ratios (SNR) ranging from 10 dB to 10 dB, using the mean square error (MSE) as a criterion. The MSE between the original angle, i.e., θ and estimated angle, i.e., θ ^ is computed as:
M S E = 10 log 10 ( θ θ ^ ) 2
To estimate MSE 100 simulations are performed. The estimated MSE curves are plotted in Figure 6. The results demonstrate that the lowest MSE is obtained by the proposed algorithm for majority SNR.
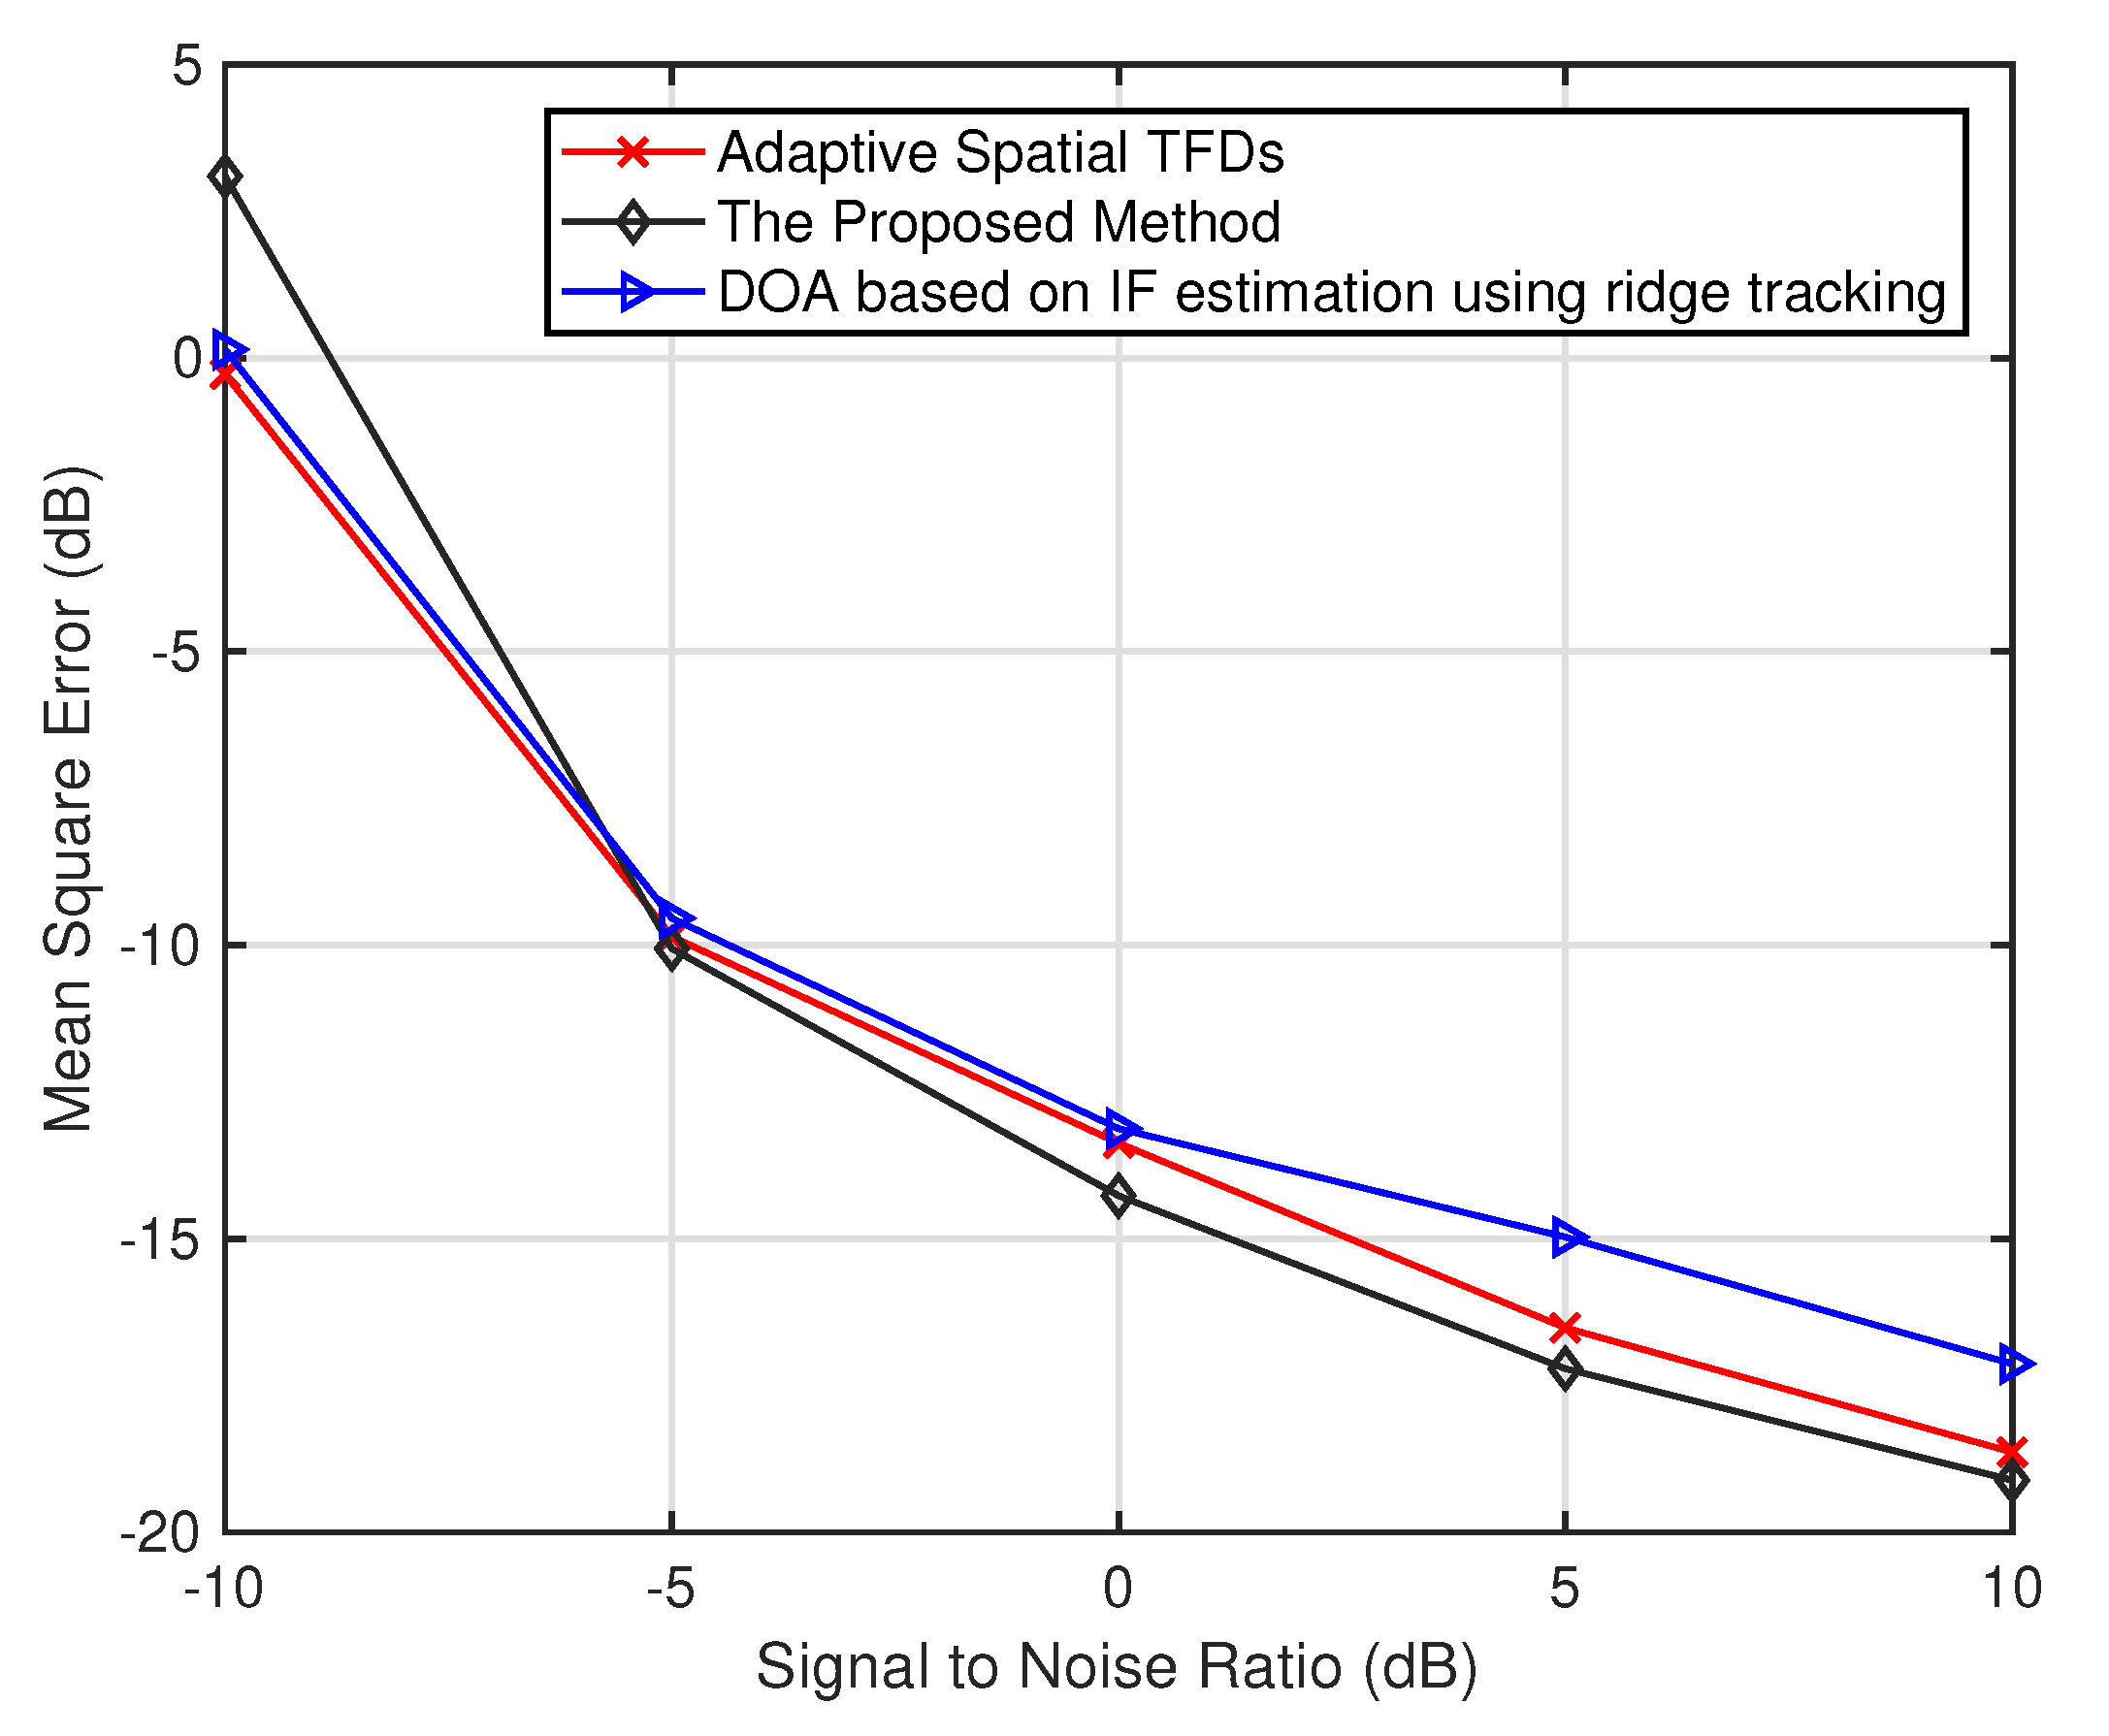
Let us now repeat the experiment for an under-determined scenario, i.e., for the number of sensors is equal to 2. In this scenario, the conventional TF-MUSIC algorithm cannot be employed, so the performance comparison is only made with the ADTFD based ridge tracking algorithm [25] and spatial adaptive TFD based Viterbi algorithm [24]. Figure 7 illustrates that the proposed method has the lowest MSE for SNR greater than −5 dB. The code to reproduce the aforementioned results can be downloaded from https://github.com/nabeelalikhan1/DOA-using-FAST-IF (accessed on 3 February 2021).

5.2. Three Source Signals

Let us consider a scenario when three sources placed at angles 5 , 0 and 5 emit the following signals.
s 1 ( t ) = e ( 0.05 π j t + a j π t 3 )
s 2 ( t ) = e ( 0.3 π j t a j π t 3 )
s 3 ( t ) = e ( 0.9 π j t a j π t 3 ) ,
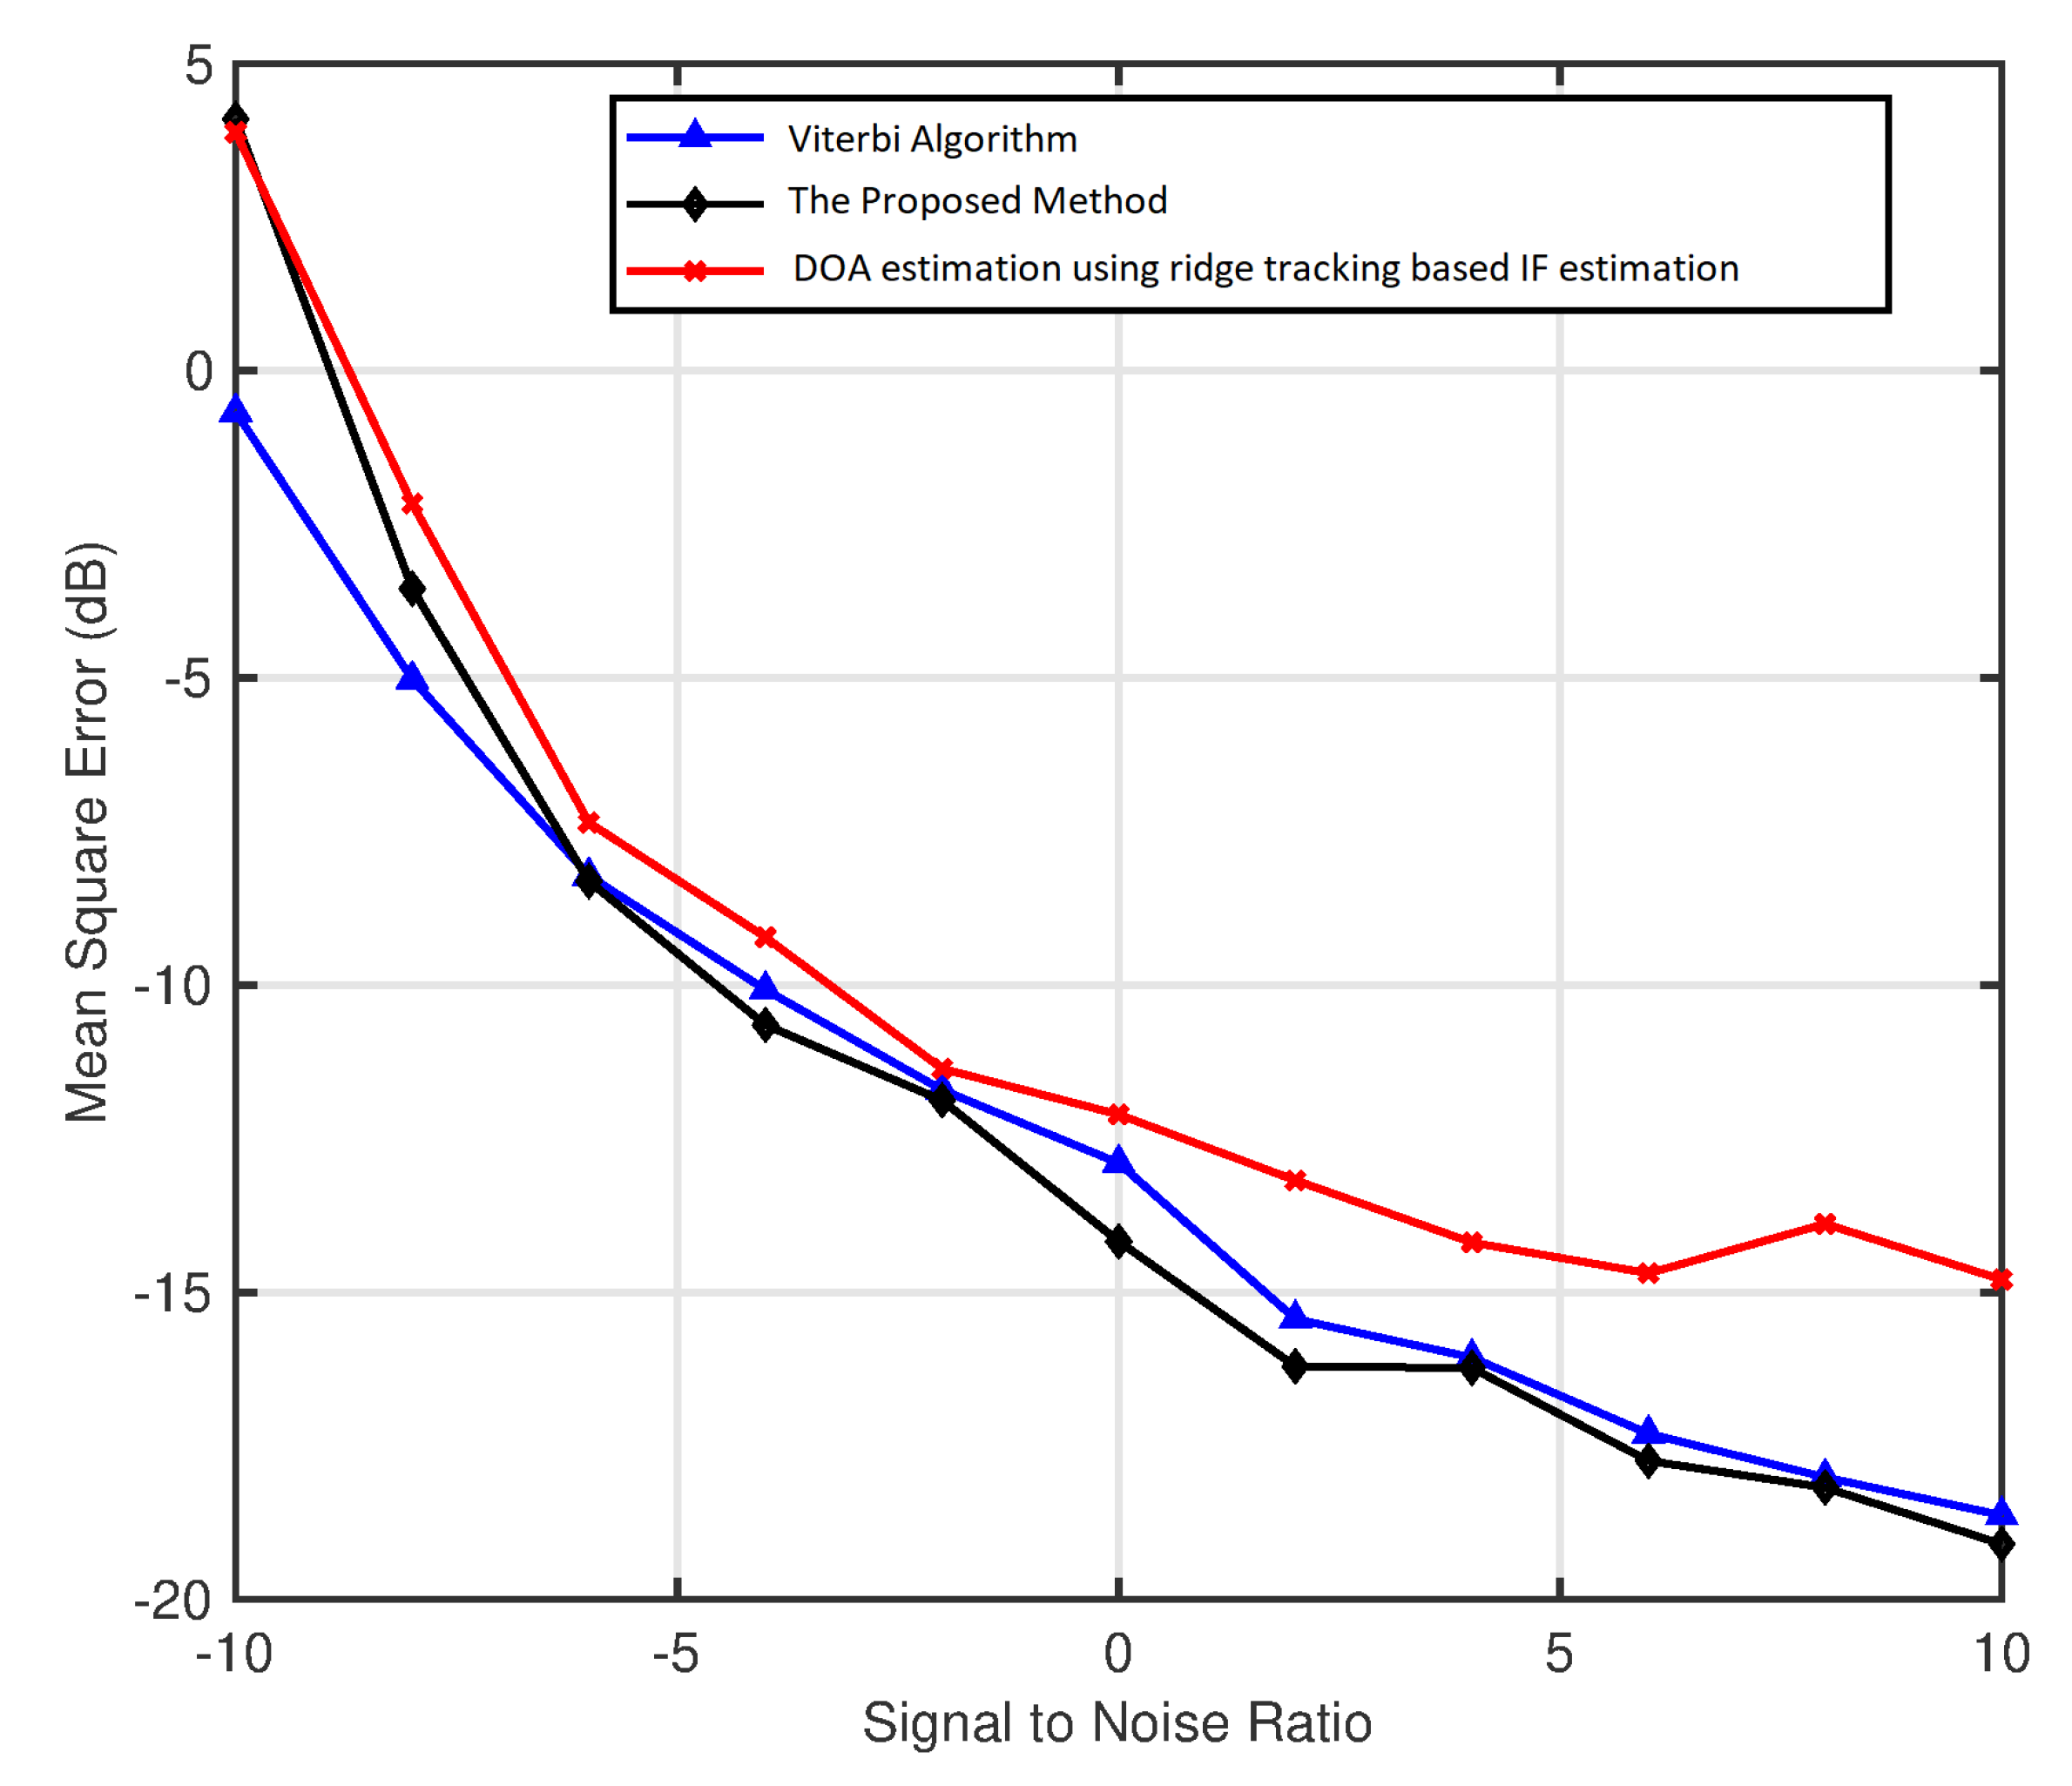
where a = 7.1208 × 10 6 . The signals are received by uniform linear array of four sensors such that spacing between two sensors in one half of the wavelength. Let us compare the accuracy of the proposed method with the state of art methods including the Viterbi algorithm, ridge tracking algorithm use MSE as criterion for SNR ranging from −10 dB to 10 dB by performing 100 simulations as shown in Figure 8.
Let us now repeat the experiment for an under-determined scenario by assuming that we now have 2 sensors to receive the signal emitted by three sources. The MSE curves are shown in Figure 9.

5.3. Interpretation of Results

Experimental results indicate that the proposed method has higher accuracy when compared with other recent methods [24,31]. The superior performance is due to the computationally efficient and robust IF estimation algorithm that results in accurate separation of sources thus accurate source localization. Commonly used IF estimation methods compute TFDs as a first step so that the signal energy is concentrated along IF curves in the TF plane and noise is spread out.
However, these TFDs fail to achieve good performance for signals with intersecting components thus resulting in the poor performance of the IF estimation algorithms [32]. This problem is partially mitigated by employing the adaptive directional kernel-based TFDs [28] or Viterbi Algorithm based methods [26,32], but these algorithms are computationally expensive. The computational cost of ridge detection and tracking method is O ( V M N 2 log N + V Q 2 N 2 ) , where Q is the size of the smoothing mask. The computational complexity of Viterbi based algorithms is O ( V M 2 N 2 l o g N + V M N 3 ) [33]. The proposed multi-sensor IF estimation algorithm accurately estimates the IF by adapting the direction of the analysis window with the signal characteristics thus resulting in accurate source separation and DOA estimates. The computational cost of the proposed method is O ( 3 V M P W N + V M L W log W + N W M V ) , which is much less than the ridge tacking and viterbrae-based algorithms.

6. Conclusions

A novel direction of arrival estimation algorithm has been developed. The proposed algorithm first separates sources by developing an efficient multi-sensor IF estimation and source separation algorithm and then employs the MUSIC algorithm for source localization. The proposed algorithm outperforms conventional TF-based source localization methods both in terms of its performance as well as computational requirements. Moreover, the proposed algorithm is applicable in both over-determined and under-determined situations. The main performance gain is achieved due to the multi-sensor IF estimation algorithm that can extract complicated TF signatures of intersecting signal components with the reduced computational cost at low signal-to-noise ratios.

Author Contributions

N.A.K.: software, formal analysis, methodology, conceptualization, writing—original draft. S.A.: writing—original draft, visualization, writing—review and editing, validation. K.C.: funding acquisition, supervision, project administration. All authors have read and agreed to the published version of the manuscript.

Funding

This work was partly supported by the Technology development Program of MSS [S2967489] and the Basic Science Research Program of the Ministry of Education (2018R1D1A3A03000837), South Korea.

Institutional Review Board Statement

Not applicable.

Informed Consent Statement

Not applicable.

Data Availability Statement

Not applicable.

Conflicts of Interest

The authors declare no conflict of interest.

References

  1. Trees, H.L.V. Optimum Array Processing; Wiley Interscience: New York, NY, USA, 2002. [Google Scholar]
  2. Swindlehurst, A.; Kailath, T. A performance analysis of subspace-based methods in the presence of model errors. I. The MUSIC algorithm. IEEE Trans. Signal Process. 1992, 40, 1758–1774. [Google Scholar] [CrossRef]
  3. Kassis, C.E.; Picheral, J.; Mokbel, C. Advantages of nonuniform arrays using root-MUSIC. Signal Process. 2010, 90, 689–695. [Google Scholar] [CrossRef] [Green Version]
  4. Zhang, Y.; Ma, W.; Amin, M. Subspace analysis of spatial time-frequency distribution matrices. IEEE Trans. Signal Process. 2001, 49, 747–759. [Google Scholar] [CrossRef] [Green Version]
  5. Amin, M.G.; Zhang, Y. Direction Finding Based on Spatial Time-Frequency Distribution Matrices. Digit. Signal Process. 2000, 10, 325–339. [Google Scholar] [CrossRef] [Green Version]
  6. Chabriel, G.; Kleinsteuber, M.; Moreau, E.; Shen, H.; Tichavsky, P.; Yeredor, A. Joint Matrices Decompositions and Blind Source Separation: A survey of methods, identification, and applications. IEEE Signal Process. Mag. 2014, 31, 34–43. [Google Scholar] [CrossRef]
  7. Belouchrani, A.; Amin, M. Time-frequency MUSIC. IEEE Signal Process. Lett. 1999, 6, 109–110. [Google Scholar] [CrossRef]
  8. Khan, N.A.; Ali, S. Robust spatial time-frequency distributions for DOA estimation using spatial averaging and directional smoothing. Signal Process. 2021, 180, 107897. [Google Scholar] [CrossRef]
  9. Boashash, B.; Aïssa-El-Bey, A.; Al-Sa’d, M.F. Multisensor Time–Frequency Signal Processing MATLAB package: An analysis tool for multichannel non-stationary data. SoftwareX 2018, 8, 53–58. [Google Scholar] [CrossRef]
  10. Boashash, B.; Aïssa-El-Bey, A. Robust multisensor time–frequency signal processing: A tutorial review with illustrations of performance enhancement in selected application areas. Digit. Signal Process. 2018, 77, 153–186. [Google Scholar] [CrossRef]
  11. Zhang, Y.D.; Amin, M.G.; Himed, B. Direction of arrival estimation of nonstationary signals exploiting signal characteristics. In Proceedings of the 11th International Conference on Information Science, Signal Processing and Their Applications (ISSPA), Montreal, QC, Canada, 2–5 July 2012; pp. 1223–1228. [Google Scholar]
  12. Guo, L.; Zhang, Y.; Wu, Q.; Amin, M. DOA estimation of sparsely sampled nonstationary signals. In Proceedings of the IEEE China Summit and International Conference on Signal and Information Processing (ChinaSIP), Chengdu, China, 12–15 July 2015; pp. 300–304. [Google Scholar] [CrossRef]
  13. Khan, N.A.; Ali, S. Sparsity-aware adaptive directional time–frequency distribution for source localization. Circuits Syst. Signal Process. 2018, 37, 1223–1242. [Google Scholar] [CrossRef]
  14. Ouelha, S.; Aïssa-El-Bey, A.; Boashash, B. Improving DOA Estimation Algorithms Using High-Resolution Quadratic Time-Frequency Distributions. IEEE Trans. Signal Process. 2017, 65, 5179–5190. [Google Scholar] [CrossRef]
  15. Heidenreich, P.; Cirillo, L.; Zoubir, A. Morphological image processing for FM source detection and localization. Signal Process. 2009, 89, 1070–1080. [Google Scholar] [CrossRef]
  16. Sharif, W.; Chakhchoukh, Y.; Zoubir, A. Robust spatial time-frequency distribution matrix estimation with application to direction-of-arrival estimation. Signal Process. 2011, 91, 2630–2638. [Google Scholar] [CrossRef]
  17. Chen, S.; Dong, X.; Xing, G.; Peng, Z.; Zhang, W.; Meng, G. Separation of Overlapped Non-Stationary Signals by Ridge Path Regrouping and Intrinsic Chirp Component Decomposition. IEEE Sens. J. 2017, 17, 5994–6005. [Google Scholar] [CrossRef]
  18. Rankine, L.; Mesbah, M.; Boashash, B. IF estimation for multicomponent signals using image processing techniques in the time-frequency domain. Signal Process. 2007, 87, 1234–1250. [Google Scholar] [CrossRef] [Green Version]
  19. Linh-Trung, N.; Belouchrani, A.; Abed-Meraim, K.; Boashash, B. Separating more sources than sensors using time-frequency distributions. EURASIP J. Appl. Signal Process. 2005, 2005, 2828–2847. [Google Scholar] [CrossRef] [Green Version]
  20. Lerga, J.; Sucic, V.; Boashash, B. An efficient algorithm for instantaneous frequency estimation of nonstationary multicomponent signals in low SNR. EURASIP J. Adv. Signal Process. 2011, 2011, 725189. [Google Scholar] [CrossRef] [Green Version]
  21. Zhang, H.; Bi, G.; Cai, Y.; Razul, S.G.; See, C.M.S. DOA estimation of closely-spaced and spectrally-overlapped sources using a STFT-based MUSIC algorithm. Digit. Signal Process. 2016, 52, 25–34. [Google Scholar] [CrossRef]
  22. Zhang, X.; Zhang, W.; Yuan, Y.; Cui, K.; Xie, T.; Yuan, N. DOA estimation of spectrally overlapped LFM signals based on STFT and Hough transform. EURASIP J. Adv. Signal Process. 2019, 2019, 1–10. [Google Scholar] [CrossRef] [Green Version]
  23. Ghofrani, S.; Amin, M.G.; Zhang, Y.D. High-resolution direction finding of non-stationary signals using matching pursuit. Signal Process. 2013, 93, 3466–3478. [Google Scholar] [CrossRef]
  24. Khan, N.A.; Ali, S.; Mohammadi, M.; Akram, J. Novel direction of arrival estimation using Adaptive Directional Spatial Time-Frequency Distribution. Signal Process. 2020, 168, 107342. [Google Scholar] [CrossRef]
  25. Khan, N.A.; Ali, S.; Mohammadi, M.; Haneef, M. Direction of arrival estimation of sources with intersecting signature in time-frequency domain using a combination of IF estimation and MUSIC algorithm. Multidimens. Syst. Signal Process. 2020, 31, 549–567. [Google Scholar] [CrossRef]
  26. Khan, N.A.; Mohammadi, M.; Djurovic, I. A Modified Viterbi Algorithm-Based IF Estimation Algorithm for Adaptive Directional Time-Frequency Distributions. Circuits Syst. Signal Process. 2019, 38, 2227–2244. [Google Scholar] [CrossRef]
  27. Khan, N.A.; Ali, S. A Robust and Efficient Instantaneous Frequency Estimator of Multi-component Signals with Intersecting Time-Frequency Signatures. Signal Process. 2020, 117. [Google Scholar] [CrossRef]
  28. Khan, N.A.; Mohammadi, M.; Ali, S. Instantaneous frequency estimation of intersecting and close multi-component signals with varying amplitudes. Signal Image Video Process. 2019, 13, 517–524. [Google Scholar] [CrossRef]
  29. Khan, N.A.; Boashash, B. Instantaneous frequency estimation of multicomponent nonstationary signals using multiview time-frequency distributions based on the adaptive fractional spectrogram. IEEE Signal Process. Lett. 2013, 20, 157–160. [Google Scholar] [CrossRef]
  30. Yang, Y.; Dong, X.; Peng, Z.; Zhang, W.; Meng, G. Component Extraction for Non-Stationary Multi-Component Signal Using Parameterized De-chirping and Band-Pass Filter. IEEE Signal Process. Lett. 2015, 22, 1373–1377. [Google Scholar] [CrossRef]
  31. Ali Khan, N.; Ali, S.; Jansson, M. Direction of arrival estimation using adaptive directional time-frequency distributions. Multidimens. Syst. Signal Process. 2018, 29, 503–521. [Google Scholar] [CrossRef]
  32. Li, P.; Zhang, Q.H. An improved Viterbi algorithm for IF extraction of multicomponent signals. Signal Image Video Process. 2018, 12, 171–179. [Google Scholar] [CrossRef]
  33. Djurovic, I.; Stankovic, L. An algorithm for the Wigner distribution based instantaneous frequency estimation in a high noise environment. Signal Process. 2004, 84, 631–643. [Google Scholar] [CrossRef]
Figure 1. Time–frequency representations of (a) non-overlapping signal components and (b) intersecting components.
Applsci 11 01849 g001
Figure 2. Uniform linear array receiving signal from multiple sources.
Applsci 11 01849 g002
Figure 3. The illustration of the proposed direction of arrival (DOA) estimation algorithm.
Applsci 11 01849 g003
Figure 4. Estimated IF (solid line) vs. original instantaneous frequency (IF) (dashed line).
Applsci 11 01849 g004
Figure 5. Spatial spectrum.
Applsci 11 01849 g005
Figure 6. Mean square error (MSE) curves of DOA estimates for over-determined scenario.
Applsci 11 01849 g006
Figure 7. MSE curves of DOA estimates for under-determined scenario.
Applsci 11 01849 g007
Figure 8. MSE curves of DOA estimates for over-determined scenario.
Applsci 11 01849 g008
Figure 9. MSE curves of DOA estimates for under-determined scenario.
Applsci 11 01849 g009
Publisher’s Note: MDPI stays neutral with regard to jurisdictional claims in published maps and institutional affiliations.