Article

Statistical Tolerance Analysis of 3D-Printed Non-Assembly Mechanisms in Motion Using Empirical Predictive Models

Engineering Design, Friedrich-Alexander-Universität Erlangen-Nürnberg (FAU), Martensstr 9, 91058 Erlangen, Germany
*
Author to whom correspondence should be addressed.
Appl. Sci. 2021, 11(4), 1860; https://doi.org/10.3390/app11041860
Submission received: 1 February 2021 / Revised: 11 February 2021 / Accepted: 11 February 2021 / Published: 20 February 2021
(This article belongs to the Special Issue Mechanical Tolerance Analysis in the Era of Industry 4.0)

Abstract

:
Fused Deposition Modelling (FDM) enables the fabrication of entire non-assembly mechanisms within a single process step, making previously required assembly steps dispensable. Besides the advantages of FDM, the manufacturing of these mechanisms implies some shortcomings such as comparatively large joint clearances and geometric deviations depending on machine-specific process parameters. The current state-of-the-art concerning statistical tolerance analysis lacks in providing suitable methods for the consideration of these shortcomings, especially for 3D-printed mechanisms. Therefore, this contribution presents a novel methodology for ensuring the functionality of fully functional non-assembly mechanisms in motion by means of a statistical tolerance analysis considering geometric deviations and joint clearance. The process parameters and hence the geometric deviations are considered in terms of empirical predictive models using machine learning (ML) algorithms, which are implemented in the tolerance analysis for an early estimation of tolerances and resulting joint clearances. Missing information concerning the motion behaviour of the clearance affected joints are derived by a multi-body-simulation (MBS). The exemplarily application of the methodology to a planar 8-bar mechanism shows its applicability and benefits. The presented methodology allows evaluation of the design and the chosen process parameters of 3D-printed non-assembly mechanisms through a process-oriented tolerance analysis to fully exploit the potential of Additive Manufacturing (AM) in this field along with its ambition: ‘Print first time right’.

1. Introduction and Motivation

Additive Manufacturing (AM) processes have successfully established themselves in industrial applications due to their batch size independent manufacturing costs and the great freedom of design [1]. Recently, 3D-printing of non-assembly mechanisms via Fused Deposition Modelling (FDM) or Stereolithography (SLA) has attracted the attention of research, as a subsequent assembly step becomes thereby dispensable which in turn can help reduce costs [2,3]. Consequently, whole functional assemblies including movable parts can be fabricated as one component [4]. Figure 1 shows a non-assembly mechanism 3D-printed via FDM. The moveable parts are thereby separated by water-soluble support material for a non-destructive removability to ensure their mobility and thus the functionality of the mechanism after the support has been removed. However, the manufacturing of these mechanisms still implies some shortcomings, viz. comparatively large joint clearances, ensuring the separability of the parts and geometric deviations, mainly influenced by the choice of machine-specific process parameters. Especially geometric deviations remain a major drawback that prevents the further progress of AM in the field of 3D-printing non-assembly mechanisms and hence its usage in industrial applications [2,5]. In order to meet the principle ‘Print first time right’ of AM, the virtual assurance of the functionality of these mechanisms through a statistical tolerance analysis with consideration of geometric deviations and joint clearance is essential. Although there has been research effort regarding the statistical tolerance analysis of systems in motion, also using predictive models, the current state-of-the-art lacks in providing suitable methods for the consideration of both geometric part deviations and comparatively large joint clearance, especially for additively manufactured non-assembly mechanisms [6,7]. With the aim of closing this gap and to help less AM-experienced engineers in designing non-assembly mechanisms and choosing suitable process parameters, this contribution proposes a methodology for a statistical tolerance analysis to ensure the functionality of these kinds of mechanisms. The integration of information derived by multi-body-simulation (MBS) of the mechanisms and the usage of empirical predictive models for the consideration of geometric deviations resulting from the AM-process enables a realistic prediction of the functionality of non-assembly systems in motion manufactured via FDM, prior to their production. This contribution thus aims to provide the designer with a methodology to fully exploit the advantages of FDM in the field of 3D-printing functional non-assembly mechanisms.
The paper is structured as follows—first of all, Section 2 presents the related work regarding the statistical tolerance analysis of systems in motion considering joint clearance, the influence of process parameters on geometric deviations in FDM and their prediction using empirical predictive models. Subsequently, Section 3 introduces the holistic methodology for the statistical tolerance analysis of non-assembly mechanisms considering geometric deviations and joint clearances resulting from the FDM-process. Section 4 presents the application of the proposed methodology to a 3D-printed planar 8-bar mechanism whereby the results are subsequently discussed in Section 5. Finally, in Section 6 conclusions are drawn and an outlook is given.

2. State-of-the-Art and Related Work

Besides the advantages of AM in general, viz. the geometric freedom in design and its batch size-independent manufacturing costs, there are still some drawbacks, especially for manufacturing non-assembly mechanisms [2]. In order to ensure the functionality of these mechanisms, tolerance analysis is a suitable tool for an early evaluation of the design and the choice of suitable process parameters.

2.1. Tolerance Analysis of Systems in Motion Considering Joint Clearance and Geometric Deviations

Various approaches for computer-aided tolerance analysis have been developed during the last decades, whereby the three major approaches are tolerance stacks, tolerance analysis based on the Small Displacement Torsor and vector loops [6]. Gaps between parts resulting from their geometric part deviations can thereby be considered using the vector loops approach. Therefore, the assembly is modelled as a chain of vectors, whereby each part is represented as a vector. For the integration of joint clearance, the clearance vector is introduced. The vector loop is thus enhanced through a virtual massless link connecting the two centre points of the joint-pair. This clearance vector can be defined according to worst-case or stochastic scenarios or due to a certain joint force [9]. The tolerance analysis of systems in motion considering joint clearance and geometric deviations has been a constant topic of research in the field of conventionally manufactured and assembled mechanisms [7,10]. However, Schaechtl et al. propose an approach for the tolerance analysis of 3D-printed mechanisms. Tolerance values are hereby chosen based on experience and the influence of varying process parameters is thus neglected [11]. Stuppy and Meerkamm introduced the “integrated tolerance analysis of systems in motion”. This methodology can be used for the tolerance analysis of mechanisms with deviations from both, manufacturing and operating [9]. Walter et al. extended this methodology by the consideration of interactions between deviations for systems in motion using meta-modelling techniques for representing affected deviations. The methodology was thereby applied to a non-ideal crank-mechanism [7]. According to Flores et al., there are three main approaches for modelling the mechanisms in motion affected by joint clearance—the massless link approach, the spring-damper approach and the momentum exchange approach [12]. In order to enhance the tolerance analysis of systems in motion affected by clearance, an MBS can be used to derive the missing joint forces [12]. For modelling the impact of journal and bearing in an MBS, two approaches are firmly established, namely the continuous and the discontinuous approach. In the continuous contact model approach, the forces arising from the impact act perpendicular to the impact zone. This model can either be linear (Kelvin-Voigt model) or non-linear (Hertz law) [12]. Lankarani and Nikravesh presented an approach of a force model for the simulation of joint clearance in which both elastic and damping effects are considered. The damping effect is hereby directly linked to the energy dissipated during the impact process. With the help of this approach, the dynamics of mechanisms including planar revolute clearance joints can be modelled for tolerance analysis [13]. Rhyu and Kwak proposed an optimisation approach for designing mechanisms in which tolerances and joint clearances were considered, which was later applied to a planar four-bar mechanism including kinematic joints affected by clearance [14].

2.2. Geometric Part Deviations in FDM

The FDM-process is controlled by numerous process parameters, influencing the geometric accuracy and consequently the total quality, such as functionality or aesthetics of 3D-printed parts [15]. Especially for non-assembly mechanisms, the dimensional accuracy of the individual parts is essential for fitting in the assembly [2]. For producing parts that meet a required dimensional accuracy, a proper selection of suitable process parameters is therefore essential. Build direction and layer height significantly influence the dimensional accuracy of the fabricated part and thus have to be considered in the design stage of mechanisms. The influence of process parameters on geometric deviations of parts manufactured via FDM has been studied extensively by many researchers in the last years. Wang et al. for example examined the influence of layer thickness, deposition style, support style, deposition orientation in X- and Z-direction and the build location on their influence on the part accuracy. The results indicated that the deposition in the Z-direction was the most significant parameter affecting the dimensional accuracy [16]. Sood et al. investigated the influence of layer height, build orientation, raster orientation, raster width and air gap. Regarding the results, it became obvious that layer height was the most significant parameter [17]. In general, a small layer height results in smaller geometric deviations, whereby the build time is significantly increased. Bakar et al. fabricated complex parts in order to investigate the influence of the part shape on geometric deviations. Hereby it was observed that a cylindrical shape results in higher geometric deviations than other shapes due to its dependence on the build direction [18]. Peng et al. conducted an experimental design in order to determine the influence of process parameters in FDM and thus layer thickness and filling velocity were found to be the most significant process parameters influencing the geometric accuracy [19]. According to Deswal et al. the geometric accuracy of FDM parts depends upon few process parameters like build orientation, number of contours, layer height, raster width, air gap and raster angle [20]. Sheoran et al. concluded through experiments that, for both geometric deviations and surface roughness, the chosen layer height is the most significant process parameter [21]. A Taguchi design of experiment (DoE) was used by Mahmood et al. in order to evaluate the effect of process parameters on part deviations and tolerances of FDM parts. It was concluded that parallelism, angularity and position had the largest deviation among the geometric deviations [22]. In summary, basic relationships between significant process parameters, viz. layer height and part build orientation and geometric part deviations can be determined in coherence with the layer-wise manufacturing principle of FDM. However, the quantification of their influence on the geometric part deviations is quite difficult, since it is always case- and machine-specific. Therefore, empirical predictive models using ML algorithms can help determining the resulting deviations of printed parts, influenced by the chosen process parameters [23].

2.3. Investigating Geometric Part Deviations in FDM Using Empirical Predictive Models

Machine learning (ML) offers promising techniques and algorithms to predict geometric part deviations and has already proven its applicability for conventional manufacturing processes, such as milling [24] and turning [25]. In context of AM, the methods of ML imply major advantages as it offers the possibility of discovering implicit knowledge and the identification of relationships between process parameters in large data sets as for example their influence on geometric deviations of additively manufactured parts [26]. Using ML techniques, predictive models can be built and thus be used for prediction and performance optimisation [23]. The complexity of the AM-process makes it highly suitable for the common ML techniques as supervised learning methods, like Support Vector Machines (SVM), Artificial Neural Networks (ANN) and Gaussian Processes (GP), because of the accessibility of labelled data sets [23,26]. Huang et al. developed a predictive model for geometric deviations resulting through shrinkage in the FDM process. The predictive model is able to learn from the data obtained from a certain number of tested part shapes. This allows to take effective countermeasures for compensating part deformations of new and not yet tested parts in advance [27]. Sahu et al. compared the results from experiments determining geometric part deviations of additively manufactured ABS-parts with fuzzy decision-making logic [28]. In order to predict and subsequently compensate geometric part deviations resulting from the FDM-process, Moroni et al. trained a GP on previously gained training data. It was concluded that it is purposeful to determine resulting part deviations before fabrication, so the design can be adapted a priori [29]. Sood et al. analysed different process parameters on their influence on geometric deviations of additively manufactured parts using ANN and Taguchi method [17]. Noriega et al. developed a predictive model for investigating the actual dimensions of FDM parts by training ANNs with experimental data, gained through tests and measurements. The authors claim that the achieved accuracy of the prediction is proven to be more accurate than the manufacturing accuracy of the FDM process itself [30].

2.4. Discussion of the State-of-the-Art

It can be concluded that statistical tolerance analysis of systems in motion considering joint clearance has been steadily improved over the past decades and has already been partly implemented in commercial software tools. However, kinematic joints are thereby mostly presented as ideal and joint clearance is thus still neglected. For the 3D-printing of non-assembly mechanisms including kinematic joints, the consideration of joint clearance is inevitable, as these clearances are comparatively large to ensure the separability of the parts after manufacturing and thus have to be considered for a realistic representation of the motion behaviour [11]. Another significant drawback of FDM is the resulting, comparatively high, geometric deviation, which is strongly influenced by the choice of process parameters. Thus, it has been a constant research topic in the last few years. Especially for non-assembly mechanisms part deviations play a crucial role for their functionality and have to be taken into account in the tolerance analysis. Predicting geometric deviations of printed parts based on process parameters is therefore purposeful as it offers the possibility of considering their influence on the functionality of the mechanism, so the design and the process parameters can be adapted before fabrication. In particular in FDM, it is essential, as there is currently no specific guideline for tolerancing and hence these values have to be estimated [31]. A process-oriented prediction of part deviations and resulting joint clearances overcomes this drawback by taking the influence of the manufacturing process directly into tolerance analysis [32]. ML techniques therefore offer suitable algorithms and have already proven its applicability in the field of AM [29] and tolerance analysis [7].
In summary, it can be stated that there are already some promising approaches for analysing systems in motion affected by clearance. However, these approaches focus primarily on conventionally manufactured and assembled mechanisms, neglecting the potential but also the inherent challenges of additively manufactured non-assembly mechanisms. For ensuring their functionality and thus fully exploiting the potential of 3D-printing in this field, existing approaches have to be further enhanced with process-specific information, for example, through MBS and empirical predictive models to deal with the main challenges, comparatively large joint clearances and geometric part deviations resulting from the FDM process.

3. Statistical Tolerance Analysis of 3D Printed Non-Assembly Mechanisms in Motion

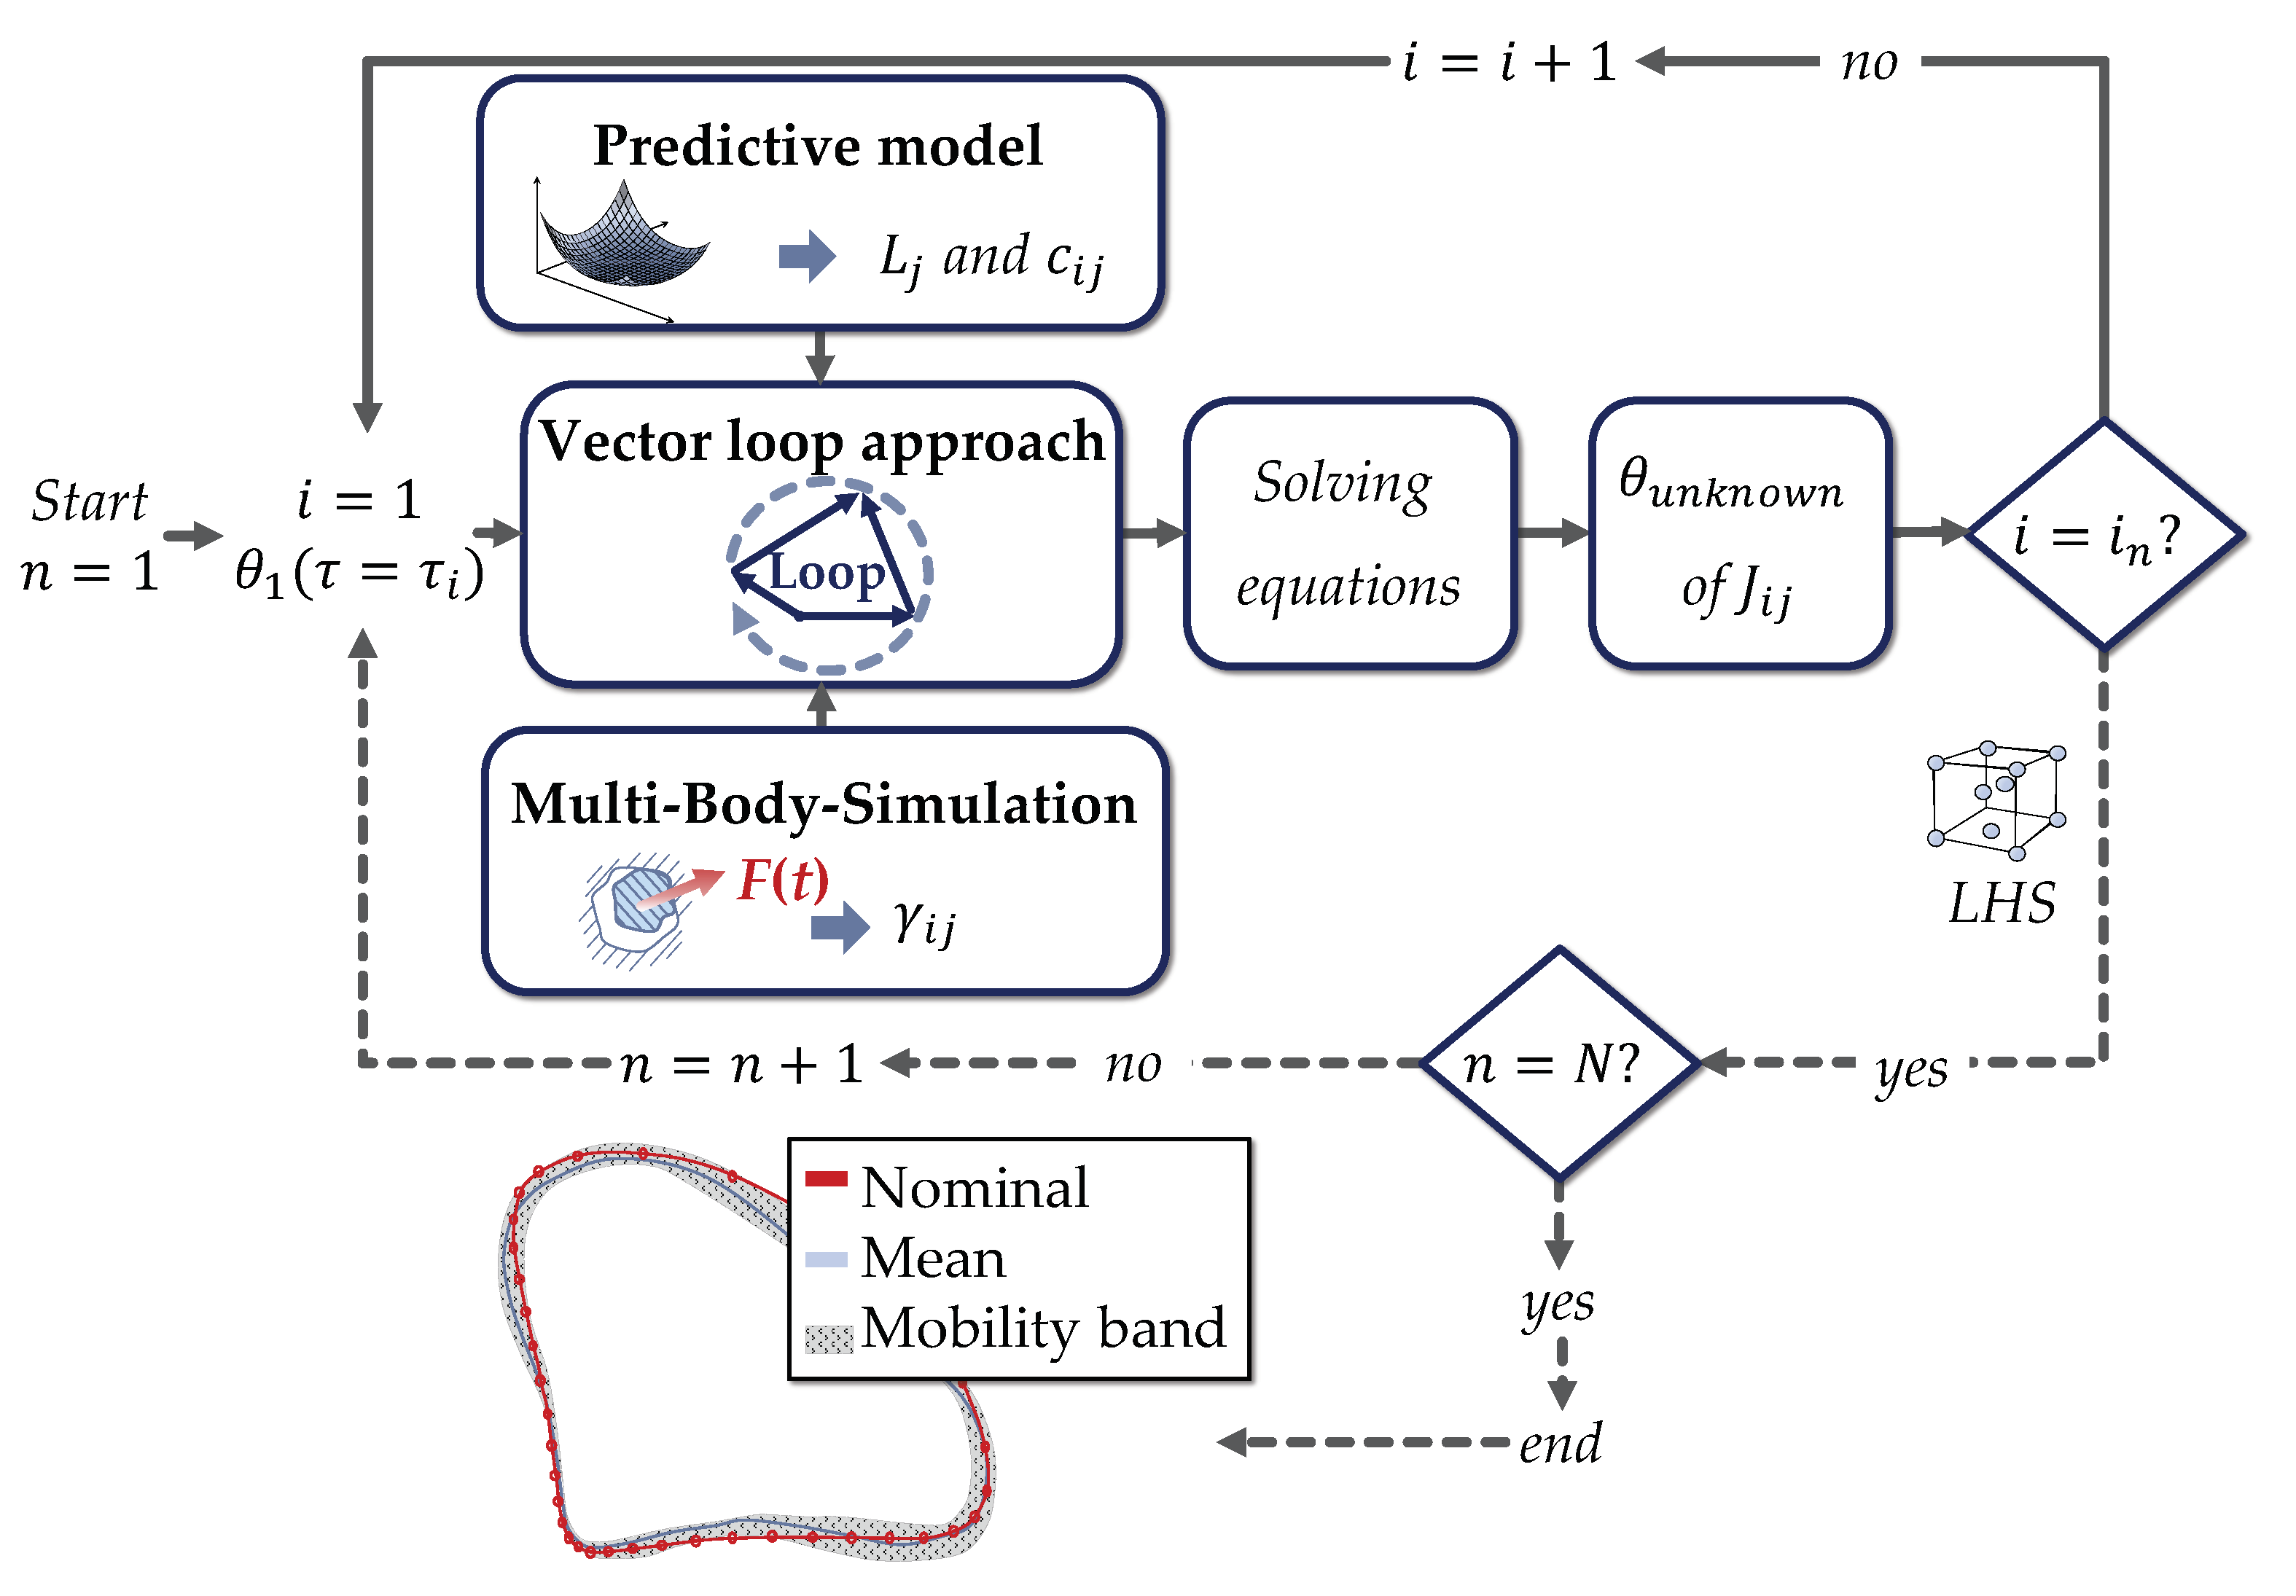
In order to deal with the highlighted challenges, this paper proposes a methodology for the enhancement of the statistical tolerance analysis of 3D-printed systems in motion. The conceptual framework, partitioned in an experimental and a simulative part, is shown in Figure 2 and discussed in detail afterwards. In order to consider the comparatively large joint clearances which are essential for ensuring the separability of the parts, information derived through a MBS are used for the tolerance analysis. Geometric part deviations resulting from the FDM-process itself are considered in terms of empirical predictive models. Thereby, these geometric part deviations can be predicted before fabricating the entire mechanisms with respect to the chosen process parameters and the part’s geometric characteristics based on empirically gathered training data.

3.1. Tolerance Analysis of Systems in Motion Considering Joint Clearance

As mentioned in Section 2.1, there are different approaches for the tolerance analysis of systems in motion. In this contribution, the vector loop approach is used due to its suitability to systems in motion and the possibility of considering joint clearance according to [11]. To show the general idea of the vector loop approach for planar non-assembly mechanisms, it is applied in the following to a schematic 4-bar mechanism with two kinematic joints affected by clearance ( J 12 and J 23 ), whereby each of the linkages L j is thus represented as a vector (see Figure 3).
The clearance is hereby modelled as the virtual, massless clearance vector c i j connecting the two centre points of the joint pair as can be seen in Figure 3c [33]. For determining the degrees of freedom (DoF) and thus the required number of vector loop equations p for characterising the motion behaviour, the equation according to Goessner for a mechanism consisting of g linkages and n joints is used [34]:
p = g ( n 1 ) .
Applying this equation to the shown mechanism including four linkages L j and four joints J i j , it becomes evident that one vector loop is sufficient for the characterisation of its motion behaviour. The resulting equation consists of a real and an imaginary part, which both must be equal to zero. In the following, only the summarised form of the equation will be shown (for further information, please refer to [11]):
L 1 · e j · θ 1 + c 12 · e j · γ 12 + L 2 · e j · θ 2 + c 23 · e j · γ 23 L A B L 3 · e j · θ 3 = 0 .
As for this non-linear vector loop equation, an explicit solution is difficult to find, a numerical solution is required. Therefore, a numerical and iterative method needs to be applied in order to determine the unknown angles θ of each joint J i j for every discretisation step in order to reproduce the motion behaviour of the planar mechanism. In this paper, the vector loop approach is illustratively applied to planar mechanisms, however it is also applicable for three-dimensional mechanisms as the model can be enhanced by adding another equation for the third dimension [6,35]. The dimensional length deviation of the linkages L j and their influence on the motion behaviour are thereby considered through the integration of empirical predictive models. For the consideration of the clearance vectors, the missing information such as their lengths c i j and the force angle γ have to be known a priori for solving the equation.
In order to determine the missing information for solving the vector loop equation, including joint clearance, a MBS is purposeful. With the help of MBS, systems in motion can be simulated using commercial software tools. Hereby the systems can be described by mathematical substitute models. Based on these dynamic models, joint forces and angles of kinematic joints can be determined and thus be used for solving the vector loop equation in the tolerance analysis for the nominal mechanism without deviations [33]. Assuming the surface of the joints is rigid and there is no friction, the direction of the clearance vector coincides with the normal direction of the collision plane. With this premise, the clearance vector c , consisting of the clearance c and the force angle γ i j , points in the same direction as the joint force (see Figure 3c) [33]. Thus, the joint force derived through the MBS can be used for determining the clearance vector c i j for the vector loop equation (see Equation (2)).

3.2. Determination of Geometric Part Deviations Using Empirical Predictive Models

A key aspect for tolerancing in AM is the determination of geometric part deviations resulting from the process. As there is currently no FDM-specific guideline for tolerancing as part deviations are strongly machine-specific, tolerance values have to be determined through a trial-and-error process, which is time- and cost-intensive [31]. In order to avoid this iterative process during the design stage for every new nominal design and set of process parameters, empirically built-up predictive models for considering the influence of process parameters and design features on geometric part deviations and thus determining resulting tolerances are purposeful. Predictive models or meta-models are therefore useful methods to evaluate an approximation of high-fidelity models (e.g., the FDM process). Physics-based equations to determine the influence of process parameters on part deviations can therefore be substituted [26]. These models automatically learn the relationship between input features and output objectives based on a previously gathered training data set [36]. Despite these advantages, there are some challenges that have to be faced when building up a predictive model. Gathering training data is a tedious task and so the training data sets are usually small, whereby the quality of the model can thus be impaired. Another cause of poor performance of the model is the overfitting and underfitting issue [23]. Overfitting means that the algorithm tries to fit every data point in the training set, whereby the model is highly sensitive to noises or outliners. A multitude of input parameters can cause the model to overfit and impair the quality of the model [23]. Consequently, the input parameters have to be reduced to the most significant ones. Preliminary experiments are thus purposeful to determine these parameters to ensure a sufficient model productivity [26]. To identify these most significant parameters in this contribution, preliminary studies were conducted, whereby test joint specimens printed via FDM are optically measured for examining geometric deviations. Subsequently, the results are evaluated in the context of a literature review concerning their influence on the geometric accuracy of FDM printed parts. In further experiments, the process parameters were varied for gathering the training data for the predictive models. The procedure for setting up empirical predictive models is schematically shown in Figure 4.
The experimentally gathered data set is utilised for training the predictive models. ML therefore offers various algorithms, whose suitability depends upon the amount of available data and their quality. Regression models therefore help to describe basic relationships, whereas neural networks are capable of recognizing complex relationships within the data sets [23,26]. A requirement for good prediction quality, however, is a suitable evaluation of the model. For the evaluation and thus the selection of the most suitable model, the Root Mean Square Error (RMSE) in combination with the Coefficient of Prognosis (CoP) can be applied. The value for the CoP is calculated as follows [37]:
C o P = 1 S S E P r e d i c t i o n S S T .
S S E P r e d i c t i o n is thereby defined as the sum of squared prediction errors, which are estimated based on cross validation, whereas S S T is defined as equivalent to the total variation [37].
In this paper, empirical predictive models are used for an early determination of resulting joint clearances and tolerances of non-assembly mechanisms manufactured via FDM based on chosen process parameters and predefined nominal part characteristics. Subsequently, this information can be used in the statistical tolerance analysis for considering the nominal deviation of the linkages L j and the resulting joint clearances c i j in the vector loop equation (see Section 3.1) for their realistic representation.

3.3. Sampling Technique

Sampling techniques are used in tolerance analysis to determine the influence of part deviations on a certain quality criterion due to their greater capability and more independent applicability compared to simplified statistical formulas. Therefore, techniques like Monte-Carlo and Latin-Hypercube are well-established [38,39]. The dimensional part deviations of the linkages L j and the resulting joint clearances c i j as a result of the FDM process are represented in terms of tolerances and are therefore used for sampling. These values are determined through the empirical predictive models, which are trained on previously gathered research data (see Section 3.2). Consequently, through using a sampling technique for the tolerance analysis based on vector loops, the motion behaviour of the shown 4-bar mechanism can be simulated. The influence of deviations can thus be considered for a realistic representation of the motion behaviour. Using a certain sampling size N, the motion behaviour of N different virtual systems is realistically described [32]. The requirement or a certain quality criterion of a system on which the influence of tolerances is evaluated on its fulfilment is defined as the functional key characteristic (FKC) [40]. In this contribution, the motion accuracy of the kinematic joints is defined as the FKC. Figure 5 shows the procedure for the statistical tolerance analysis based on vector loops using sampling technique as an adaption of the conceptual framework (see Figure 2). The missing information for numerically and iteratively solving the vector loop equation (see Equation (2)), viz. the dimensional deviation of the linkages L j and the resulting clearance vector c i j consisting of the joint clearance c i j and the force angle γ i j are determined and integrated through predictive models, respectively MBS. As a result, the unknown angles θ u n k n o w n of all kinematic joints J i j and thus the motion behaviour of the mechanism can be determined for every discrete step i to i n depending on the given starting angle θ 1 . This angle is known since the position of the first linkage L 1 is defined by the drive as a function of time τ . The influence of geometric part deviations resulting from the FDM process on the motion accuracy are considered through sampling for a certain sampling size N (illustrated by the dotted line). Therefore, the mobility band of specific kinematic joints consisting of N coupling curves for different virtual mechanisms and thus the FKC can be calculated.

4. Application

In this section, the presented methodology is exemplarily applied to a case study of a FDM-printed non-assembly mechanism. The application is intended to demonstrate the applicability of the methodology. Hereby, the focus lies on the evaluation of the nominal design and the chosen process parameters of an already existing mechanism with respect to its functionality. The presented methodology is therefore more likely to be applied in the last design step, the tolerance design, than in the parameter design according to Taguchi [41]. After presenting the case study in detail, the developed methodology is incrementally applied.

4.1. Presentation of the Case Study

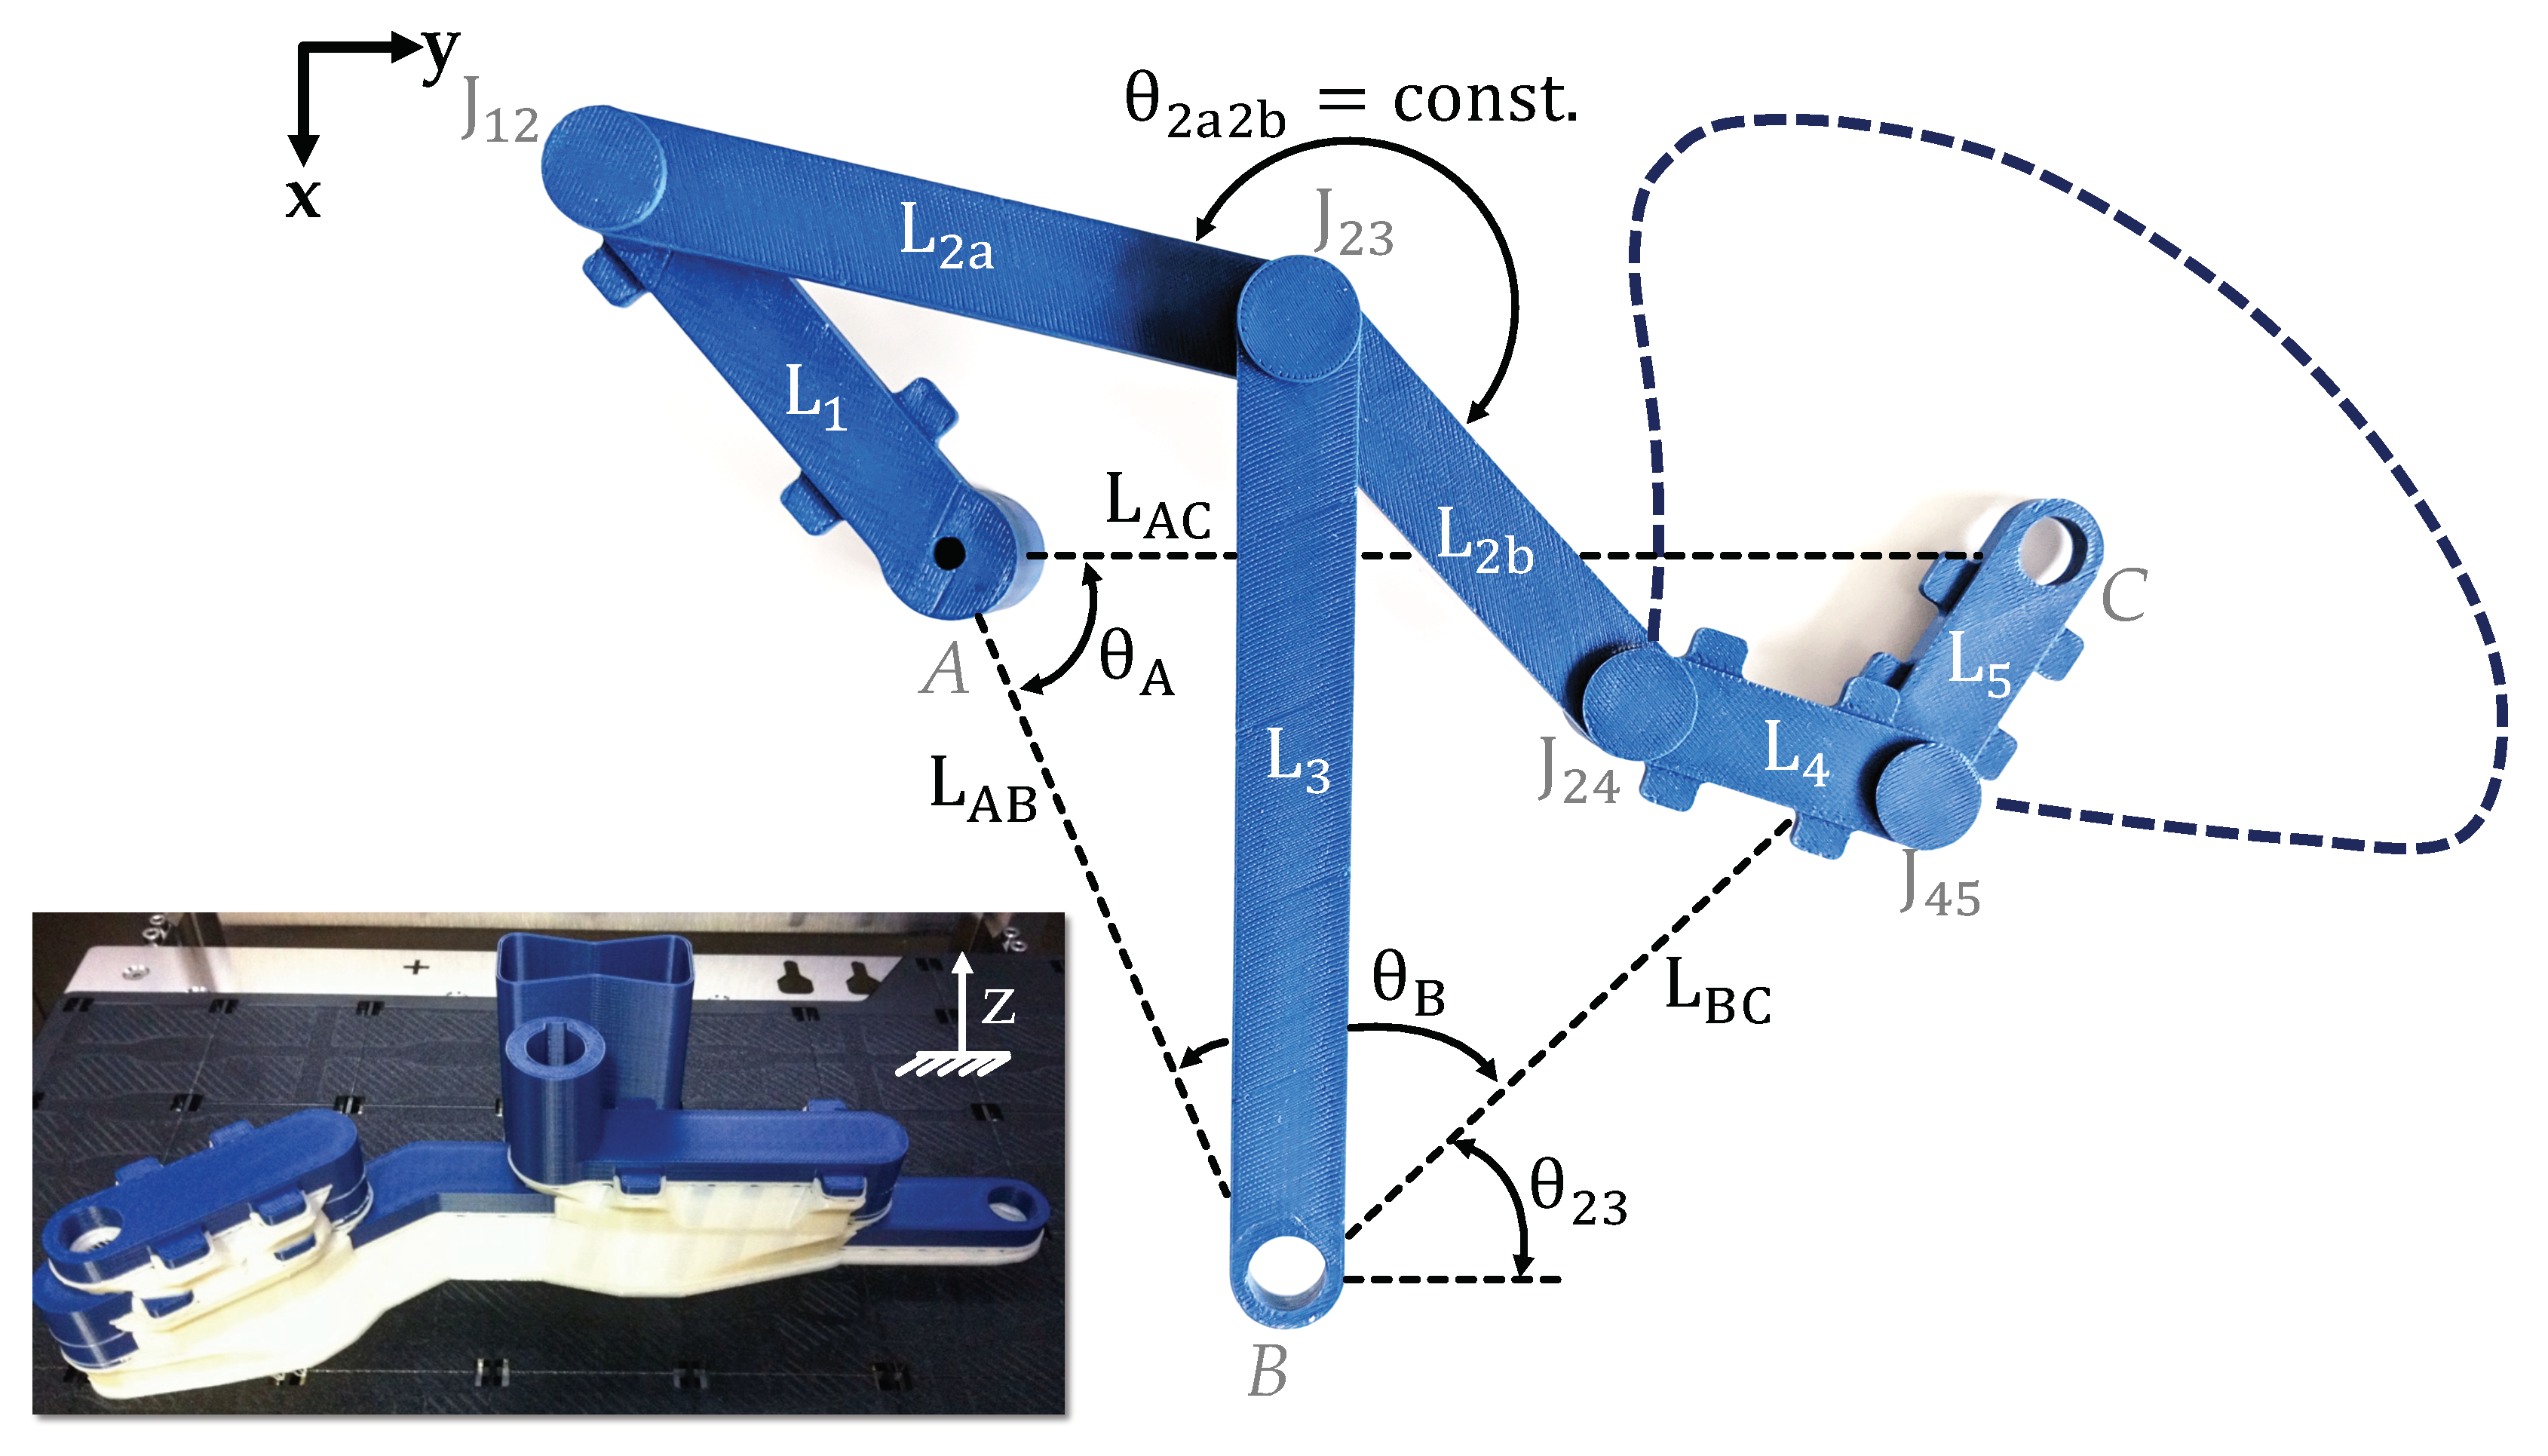
For the case study, a planar 8-bar mechanism, designed to execute a precisely defined continuous motion, is chosen to show the general applicability of the presented methodology. The nominal design parameters of the linkages are thereby defined according to [42]. For successfully 3D-printing the mechanism fully functional, planar and radial joint clearances of the kinematic joints were adapted according to findings in preliminary studies of Hallmann et al. Thereby minimum achievable joint clearances of FDM-printed non-assembly mechanisms were systematically determined [8]. According to the resulting guidelines for non-assembly mechanisms, a minimum joint clearance of c = c i j = 0.4 mm for kinematic joints is achievable, avoiding bonding of journal and bearing during printing and thus is chosen for the presented case study. The planar clearance of c p l a n a r = 0.2540 mm was defined according to the chosen maximum layer height in the DoE, resulting in at least one layer of support material between adjacent moveable parts. Subsequently, the mechanism was 3D-printed fully functional as a single component with FDM-machine Stratasys F370 using Acrylonitrile-Butadiene-Styrene (ABS) as build material and a water-soluble support material for a non-destructive removability of support structures within the kinematic joints J i j . Figure 6 shows the successfully 3D-printed 8-bar mechanism. In order to save space and thus support material, the alignment of the mechanism in the build chamber was optimised as can be seen in the illustration.
The nominal parameter values of the case study are listed in the Table 1.

4.2. Tolerance Analysis Model

For the tolerance analysis of the mechanism, the vector loop approach (see Section 3.1) is used. Applying Equation (1) to the shown 8-bar mechanism consisting of eight linkages g and seven kinematic joints n, it becomes apparent that two vector loop equations are required for solving the vector loop model [11]. The summarised equations are listed in the following:
L 1 · e i · θ 1 + c 12 · e i · γ 12 + L 2 a · e i · θ 12 + c 23 · e i · γ 23 L A B · e i · θ A L 3 · e i · θ 23 = 0 ,
L 1 · e j · θ 1 + c 12 · e j · γ 12 + e j · θ 12 ( L 2 a + L 2 b · e i · θ 2 a 2 b ) + c 23 · e j · γ 23 + c 24 · e j · γ 24 + L 4 · e j · θ 24 + c 45 · e j · γ 45 + L 5 · e j · θ 45 L A C · e j · 0 = 0 .
For solving this set of non-linear equations, the Newton-Raphson method is applied and missing information concerning the clearance vector and the dimensional deviations of the linkages needs to be derived through MBS and predictive models (cf. procedure in Figure 5).
In order to determine the missing angle γ i j of the clearance vector c i j for solving the vector loop equation, a MBS (see Section 3.2) of the presented 3D-printed mechanism is built up, using the commercial software MSC ADAMS as it is suitable for virtually model systems in motion. Herein the so-called ‘Impact-function’ is implemented, which is similar to the continuous contact force model introduced by Lankarani and Nikravesh [13]. This function is used for modelling the interaction between journal and bearing and thus the joint clearance of the regarded mechanism. After the substitute model of the mechanism was defined, the simulation of the motion behaviour was conducted for two revolutions, whereby the joint forces and the hence calculated angles γ i j are subsequently exported for the second revolution since influences from the numerical run-in phase are thus avoided. The results are used for solving the vector loop equations including the clearance vectors c i j of the mechanism. In Figure 7, the forces of the kinematic joints J i j for the 8-bar mechanism for the joint clearance c = 0.4 mm are illustrated.

4.3. Empirical Predictive Models

The last step for fully solving the vector loop equations is to determine the resulting joint clearance c i j for the clearance vector c i j and the geometric deviation of the linkages L j , respectively their tolerances, to consider the influence of the process parameters on the motion accuracy of the regarded mechanism by empirical predictive models (see Section 3.2). For determining the most significant parameters influencing the accuracy of 3D-printed mechanisms, preliminary studies were conducted. Findings coincide with related researches concerning this topic, as the build orientation along the Z-axis, the layer height, the seam style and the part’s geometry have a major impact on geometric deviations of 3D-printed parts [15,43]. As a result, the following process parameters and a varying part geometry are considered for gathering the training data (see Figure 8).
Further process parameters, viz. extrusion temperature, extrusion speed and ambient temperature are predefined as they are automatically chosen by the used FDM machine Stratasys F370 itself for the used material ABS and thus cannot be varied or controlled by the operator. The part geometry, viz. the size of pin and hole and the linkage length also plays a major role and must therefore be taken into account for gathering the training data. Hence the nominal geometry of the parts is varied in the DoE using the highest, the smallest and a mean value of the linkage lengths presented in Table 1. For gathering the training data for the predictive models, following parameters and factor levels were chosen for the full-factorial DoE (see Table 2).
After 3D-printing a total number of 288 test specimens according to the defined DoE, including 12 repeat tests and non-destructively removing the support structures, they were digitalised by a GOM ATOS 12M scanner and the geometric deviations are determined using GOM Inspect software. For evaluating the geometric part deviations, three part characteristics were measured, the diameter of pin and hole to determine the resulting clearance and the axis of the linkages to determine the dimensional length deviation, that is, the tolerance values. In total, 288 data points for each training data set were acquired and stored in .csv-files, which are subsequently used as the input values for training the predictive models. Figure 9 shows examples of the 3D-printed non-assembly test specimens after printing before the support structures were dissolved non-destructively in a subsequent cleaning process.
Before the test data is suitable for training the predictive models, the data is randomised. This randomisation is based on a random swapping of the input variables and is particularly advisable when using full-factorial DoE since the parameters are mostly sorted mathematically and thus approximations are always determined for certain data groups but not for the entire testing space [37]. Due to their good model adaption, GP and SVM were chosen as ML techniques since they provide a suitable method for the prediction of geometric part deviations resulting from the FDM process, especially for smaller data sets [44]. For building up the predictive models, the functionality of MATLAB 2019a was utilised. After the input variables have been defined, the training data is randomised according to a predefined distribution. In this process, 20 % of the training data is kept out in order to subsequently evaluate the forecast quality of the models based on the calculation of the CoP. The predictive models are then generated based on the training data set. For the application, two different predictive models are required. One for predicting the dimensional deviations of the linkages and one for predicting the resulting joint clearances of the mechanism. In order to determine the forecast quality of the predictive models and to check their applicability to the training data set, the RMSE values are automatically calculated and the CoP values (see Equation (3)) are calculated using the kept out data set. The advantage of CoP over Root-Mean-Squared-Error (RSME) is its automatic scaling of the value. For example, a value of 0.8 corresponds to a forecast quality of 80 % for the forecast accuracy of new data points and in general represents a suitable value [37,44]. As a consequence, the CoP values in combination with the RMSE values of the different models can be compared more precisely. The results are illustrated in following Table 3.
Regarding the results in Table 3 it becomes evident that both GP and SVM indicate suitable values and thus good forecast quality, which seems plausible as both are especially suitable for operating in smaller training data sets because of their good model adaption and their low implementation effort [44].

4.4. Results of the Tolerance Analysis

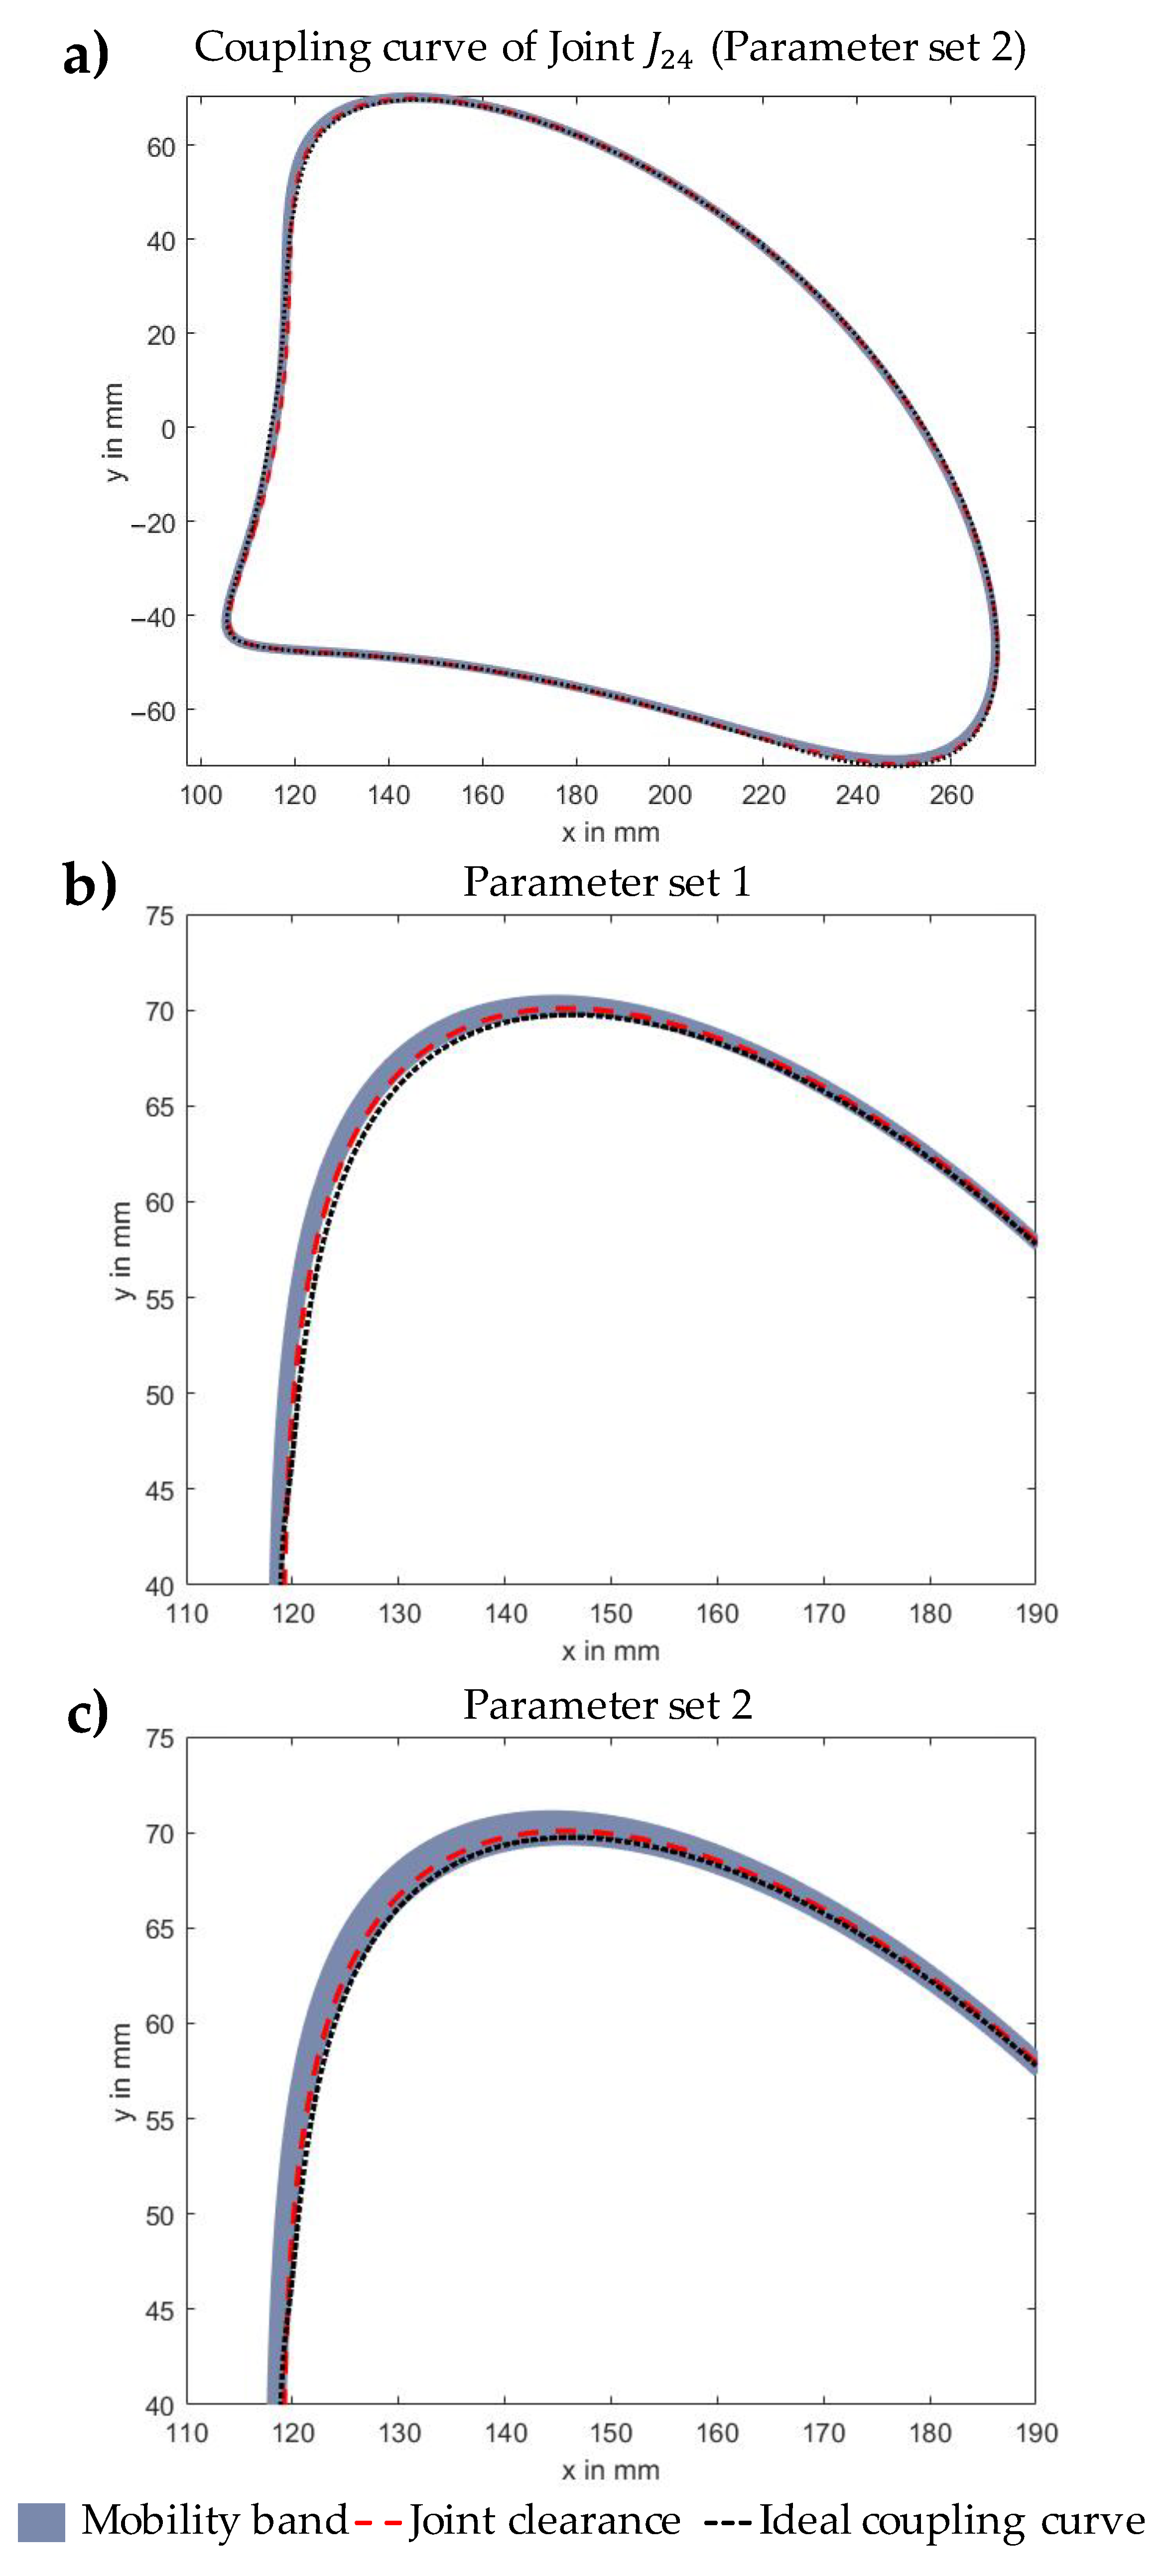
Since all necessary information for solving the vector loop equations is now available, the motion behaviour of the mechanism can be statistically analysed using sampling techniques (see Section 3.3). For the integration of the predictive model, using the SVM algorithms, the objective values, viz. the tolerance value of the linkage deviation and the resulting joint clearance are used for sampling. These values are therefore assumed to be normally distributed ( σ = t / 6 ). Furthermore the number of samples N is set to 10,000 with which valid results could be achieved in prior studies in combination with reasonable computing time [7]. This enables the generation of N different virtual mechanisms, while the predictive models create a single discrete value [32]. For the N virtual non-assembly mechanisms, this results in 10,000 different coupling curves which represents the mobility band of the mechanism. Figure 10 illustrates the coupling curve and the mobility band of the kinematic joint J 24 as a result of the statistical tolerance analysis using sampling technique. Thereby, the mobility band in comparison to the ideal coupling curve of the 3D-printed mechanism for different process parameter sets (cf. Table 4) can be calculated. In order to evaluate the results in this context, two parameter sets were defined according to a best case scenario (low layer height, optimal build orientation Z and seam style) in parameter set 1 and a worst case scenario (higher layer height, unfavourable build orientation Z and seam style) in parameter set 2 for 3D-printing non-assembly mechanisms [8].
In order to evaluate the functionality of the presented mechanism for the different parameter sets, the movement accuracy for the coupling curve of kinematic joint J 24 is defined as the FKC as a function of the time τ (see Section 3.3):
F K C ( τ ) = J 24 = L 1 · e j · θ 1 + c 12 · e j · γ 12 + e j · θ 2 ( L 2 a + L 2 b · e i · θ 2 a 2 b ) + c 23 · e j · γ 23 .
Consequently, the coupling curve of joint J 24 and thus the maximum deviation from the nominal movement accuracy of the FKC is calculated using a 95% quantile for the two different sets in order to evaluate their influence on the defined key characteristic.
The results of the statistical tolerance analysis comparing both parameter sets are illustrated in Table 5.
The results in Table 5, in combination with Figure 10, indicate that both comparatively large joint clearances and the influence of the geometrical part deviations significantly affect the coupling curve of the regarded additively manufactured kinematic joint. The comparison of the results for the different parameter sets shows that the choice of process parameters has a greater impact on the motion accuracy of the mechanism as parameter set 1 indicates a smaller deviation and thus a smaller mobility band (see Figure 10). This seems plausible as a larger layer height, a build orientation in Z-direction of 90° and the seam style ‘align’ generally lead to higher deviations in both, linkages and joint clearance. For a better classification of the results, the deviation from the desired motion accuracy is additionally calculated for the influence of joint clearance, neglecting the influence of the geometric part deviations. In this case the deviation is about 1.75 mm.

5. Discussion

The proposed methodology presents an approach for ensuring the functionality of FDM-printed non-assembly mechanisms taking into account comparatively large joint clearance and geometric part deviations depending on the choice of process parameters. The results of the statistical tolerance analysis using sampling technique of the presented case study indicate that the joint clearance has a major influence on the motion behaviour and thus has to be considered (1.75 mm maximum deviation). The same applies to the geometric deviations of the linkages resulting from the FDM process as they also mainly influence the motion behaviour of the mechanism which can be seen in the higher deviation of the FKC (2.21 mm and 2.58 mm deviation). Furthermore, it can be stated that the choice of process parameters has an impact on the motion accuracy as parameter set 1 results in a smaller deviation of the coupling curve (see Table 5).
The joint clearance was considered in the tolerance analysis in terms of MBS. Hereby gravity and friction within the joints were neglected in the first approach due to the high computational effort. For a further enhancement of the MBS, gravity affecting the journal and friction between journal and bearing can additionally be considered and subsequently evaluated on their influence. Through the implementation of predictive models using ML techniques, the geometric deviations resulting from the choice of process parameters were precisely predicted in terms of tolerances and resulting joint clearances. The trained models indicate good forecast quality regarding the CoP and the RMSE values in Table 3. The integration of these empirical predictive models in the statistical tolerance analysis eliminates a major drawback as there is currently no applicable guideline for tolerancing in FDM and tolerance values have to be estimated. In order to predict geometric deviations of printed parts considering other process parameters, further experiments need to be conducted. Hereby the usage of a different printers is purposeful as parameters like e.g., extrusion temperature and velocity can be varied and thus be considered. Since this contribution proposes a general methodology for ensuring the functionality of additively manufactured non-assembly mechanisms, with some process-specific adaptions, it can be applied to other AM technologies, such as SLA and SLM as well. Furthermore, for a realistic representation of the joint clearance affected by form deviations like e.g., the staircase effect resulting from the AM process, the surface of bearing and journal could be considered in terms of Skin Model Shapes or Statistical Shape Analysis for the integration in tolerance analysis [45]. Hereby, the influence of the seam style could also be evaluated more precisely as it may cause clattering motion within the joint.

6. Conclusions and Outlook

In this contribution, a methodology for the statistical tolerance analysis of additively manufactured non-assembly mechanisms using empirical predictive models was presented. Since the current state-of-the-art concerning statistical tolerance analysis lacks in providing suitable methods for the consideration of comparatively large joint clearances and part deviations resulting from the AM process, this contributions thus closes this gap by the integration of predictive models and MBS. The application to an additively manufactured 8-bar mechanism has shown the general applicability of the methodology and the benefit of analysing its motion behaviour based on the chosen process parameters. It can be stated that the proposed methodology is suitable for evaluating the functionality of additively manufactured non-assembly mechanisms before fabrication. With the help of predictive models and MBS, the deviation from the desired coupling curve can be calculated, whereby the influence of geometric deviations and large joint clearances resulting from the FDM process depending on the choice of process parameters can be considered more precisely. Thus, this contribution provides less AM-experienced engineers with a methodology to evaluate and optimise their design and choose suitable process parameters before fabrication.
Ongoing research activities will focus on the experimental validation of the presented methodology. Therefore, the motion behaviour of the presented 3D-printed non-assembly mechanism will be optically measured to determine its real motion behaviour and compare the results to the presented methodology. Subsequently, the general applicability of the presented methodology has to be checked, applying it to other AM-processes, e.g., SLA and SLM. Moreover, a future topic concerning the further improvement of non-assembly AM mechanisms for their use in industrial applications is the optimisation of process parameters. Therefore, a combination of ML techniques with a subsequent optimisation of the FDM-process parameters may be purposeful [23]. Other techniques in the pre-processing of the mechanisms, like adaptive slicing and non-planar printing are promising methods for the further improvement of the geometric accuracy of additively manufactured parts in general [46,47].

Author Contributions

Conceptualization, P.S., B.S. and S.W.; methodology, P.S.; software, P.S.; investigation, P.S.; writing—original draft preparation, P.S.; writing—review and editing, B.S. and S.W.; visualization, P.S.; supervision, B.S. and S.W.; project administration, S.W.; funding acquisition, S.W.; All authors have read and agreed to the published version of the manuscript.

Funding

This research was funded by the German Research Foundation (DFG), grant number WA 2913/27-1.

Informed Consent Statement

Not applicable.

Data Availability Statement

Not applicable.

Acknowledgments

The authors thank the German Research Foundation (DFG) for supporting the research project “Statistical tolerance analysis of linkage mechanisms taking into account deviations from additive manufacturing” under the grant number WA 2913/27-1.

Conflicts of Interest

The authors declare no conflict of interest.

Abbreviations

The following abbreviations are used in this manuscript:
ABSAcrylonitrile-butadiene-styrene
AMAdditive Manufacturing
CoPCoefficient of prognosis
DoEDesign of experiment
DoFDegree of Freedom
FDMFused Deposition modelling
FKCFunctional key characteristic
MBSMulti-body-simulation
MLMachine learning
SLAStereolithography
SLMSelective Laser Melting

References

  1. Wohlers, T.; Campbell, R.I.; Diegel, O.; Huff, R.; Kowen, J. Wohlers Report 2020: 3D Printing and Additive Manufacturing State of the Industry; Wohlers Associates: Fort Collins, CO, USA, 2020. [Google Scholar]
  2. Cuellar, J.S.; Smit, G.; Zadpoor, A.A.; Breedveld, P. Ten guidelines for the design of non-assembly mechanisms: The case of 3d-printed prosthetic hands. Proc. Inst. Mech. Eng. H 2018, 232, 962–971. [Google Scholar] [CrossRef] [PubMed] [Green Version]
  3. Culmone, C.; Henselmans, P.W.J.; van Starkenburg, R.I.B.; Breedveld, P. Exploring non-assembly 3d printing for novel compliant surgical devices. PLoS ONE 2020, 15, e0232952. [Google Scholar] [CrossRef] [PubMed]
  4. Mavroidis, C.; DeLaurentis, K.J.; Won, J.; Alam, M. Fabrication of non-assembly mechanisms and robotic systems using rapid prototyping. J. Mech. 2001, 123, 516–524. [Google Scholar] [CrossRef]
  5. Zhu, Z.; Anwer, N.; Mathieu, L. Shape transformation perspective for geometric deviation modelling in additive manufacturing. Procedia CIRP 2018, 75, 75–80. [Google Scholar] [CrossRef]
  6. Schleich, B.; Wartzack, S. A quantitative comparison of tolerance analysis approaches for rigid mechanical assemblies. Procedia CIRP 2016, 43, 172–177. [Google Scholar] [CrossRef] [Green Version]
  7. Walter, M.; Sprügel, T.; Wartzack, S. Tolerance analysis of systems in motion taking into account interactions between deviations. Proc. Inst. Mech. Eng. Part B J. Eng. 2013, 227, 709–719. [Google Scholar] [CrossRef] [Green Version]
  8. Hallmann, M.; Schleich, B.; Wartzack, S. Erarbeitung von Gestaltungsrichtlinien für die Konstruktion additiv gefertigter Mechanismen. In Konstruktion für die Additive Fertigung 2018; Lachmayer, R., Lippert, R.B., Kaierle, S., Eds.; Springer: Berlin/Heidelberg, Germany, 2020; Volume 22, pp. 129–143. [Google Scholar] [CrossRef]
  9. Stuppy, J.; Meerkamm, H. Tolerance analysis of mechanisms taking into account joints with clearance and elastic deformations. In Proceedings of the Design Society: International Conference on Engineering Design, Palo Alto, CA, USA, 24–27 August 2009; pp. 488–500. [Google Scholar]
  10. Polini, W. To model joints with clearance for tolerance analysis. Proc. Inst. Mech. Eng. Part B J. Eng. Manuf. 2014, 228, 1689–1700. [Google Scholar] [CrossRef]
  11. Schaechtl, P.; Hallmann, M.; Schleich, B.; Wartzack, S. Tolerance analysis of additively manufactured non-assembly mechanisms considering joint clearance. Procedia CIRP 2020, 92, 27–32. [Google Scholar] [CrossRef]
  12. Flores, P.; Ambrósio, J. Revolute joints with clearance in multibody systems. Comput. Struct. 2004, 82, 1359–1369. [Google Scholar] [CrossRef] [Green Version]
  13. Lankarani, H.M.; Nikravesh, P. Continuous contact models for impact analysis in multibody systems. Nonlinear Dyn. 1994, 5, 193–207. [Google Scholar]
  14. Rhyu, J.H.; Kwak, B.M. Optimal stochastic design of four-bar mechanisms for tolerance and clearance. J. Mech. Trans. 1988, 110, 255–262. [Google Scholar] [CrossRef]
  15. Mohamed, O.A.; Masood, S.H.; Bhowmik, J.L. Optimization of fused deposition modelling process parameters for dimensional accuracy using i-optimality criterion. Measurement 2016, 81, 174–196. [Google Scholar] [CrossRef]
  16. Wang, T.M.; Xi, J.T.; Jin, Y. A model research for prototype warp deformation in the fdm process. Int. Adv. Manuf. Technol. 2007, 33, 1087–1096. [Google Scholar] [CrossRef]
  17. Sood, A.K.; Ohdar, R.K.; Mahapatra, S.S. Improving dimensional accuracy of fused deposition modelling processed part using grey taguchi method. Mater. Des. 2009, 30, 4243–4252. [Google Scholar] [CrossRef]
  18. Bakar, N.S.A.; Alkahari, M.R.; Boejang, H. Analysis on fused deposition modelling performance. J. Zhejiang-Univ.-Sci. A 2010, 11, 972–977. [Google Scholar] [CrossRef]
  19. Peng, A.; Xiao, X.; Yue, R. Process parameter optimization for fused deposition modelling using response surface methodology combined with fuzzy inference system. Int. J. Adv. Manuf. Technol. 2014, 73, 87–100. [Google Scholar] [CrossRef]
  20. Deswal, S.; Narang, R.; Chhabra, D. modelling and parametric optimization of fdm 3d printing process using hybrid techniques for enhancing dimensional preciseness. Int. J. Interact. Des. Manuf. (IJIDeM) 2019, 13, 1197–1214. [Google Scholar] [CrossRef]
  21. Sheoran, A.J.; Kumar, H. Fused deposition modelling process parameters optimization and effect on mechanical properties and part quality: Review and reflection on present research. Mater. Today Proc. 2020, 21, 1659–1672. [Google Scholar] [CrossRef]
  22. Mahmood, S.; Qureshi, A.J.; Talamona, D. Taguchi based process optimization for dimension and tolerance control for fused deposition modelling. Addit. Manuf. 2018, 21, 183–190. [Google Scholar] [CrossRef]
  23. Weichert, D.; Link, P.; Stoll, A.; Rüping, S.; Ihlenfeldt, S.; Wrobel, S. A review of machine learning for the optimization of production processes. Int. J. Adv. Manuf. Technol. 2019, 104, 1889–1902. [Google Scholar] [CrossRef]
  24. Denkena, B.; Dittrich, M.A.; Uhlich, F. Self-optimizing cutting process using learning process models. Procedia Technol. 2016, 26, 221–226. [Google Scholar] [CrossRef]
  25. Gupta, A.K.; Guntuku, S.C.; Desu, R.K.; Balu, A. Optimisation of turning parameters by integrating genetic algorithm with support vector regression and artificial neural networks. Int. J. Adv. Manuf. Technol. 2015, 77, 331–339. [Google Scholar] [CrossRef]
  26. Razvi, S.S.; Feng, S.; Narayanan, A.; Lee, Y.T.T.; Witherell, P. A review of machine learning applications in additive manufacturing. In Proceedings of the 39th Computers and Information in Engineering Conference, American Society of Mechanical Engineers, Anaheim, CA, USA, 18–21 August 2019; Volume 1. [Google Scholar] [CrossRef]
  27. Huang, Q.; Nouri, H.; Xu, K.; Chen, Y.; Sosina, S.; Dasgupta, T. Predictive modelling of geometric deviations of 3d printed products—A unified modelling approach for cylindrical and polygon shapes. In Proceedings of the 2014 IEEE International Conference on Automation Science and Engineering (CASE), Taipei, Taiwan, 18–22 August 2014; pp. 25–30. [Google Scholar] [CrossRef]
  28. Sahu, R.K.; Mahapatra, S.S.; Sood, A.K. A study on dimensional accuracy of fused deposition modelling (FDM) processed parts using fuzzy logic. J. Manuf. Sci. Prod. 2013, 13, 183. [Google Scholar] [CrossRef]
  29. Moroni, G.; Petrò, S.; Polini, W. Geometrical product specification and verification in additive manufacturing. Procedia CIRP 2017, 66, 157–160. [Google Scholar] [CrossRef]
  30. Noriega, A.; Blanco, D.; Alvarez, B.J.; Garcia, A. Dimensional accuracy improvement of FDM square cross-section parts using artificial neural networks and an optimization algorithm. Int. J. Adv. Manuf. Technol. 2013, 69, 2301–2313. [Google Scholar] [CrossRef]
  31. Lieneke, T.; Denzer, V.; Adam, G.A.; Zimmer, D. Dimensional tolerances for additive manufacturing: Experimental investigation for fused deposition modelling. Procedia CIRP 2016, 43, 286–291. [Google Scholar] [CrossRef] [Green Version]
  32. Heling, B.; Oberleiter, T.; Rohrmoser, A.; Kiener, C.; Schleich, B.; Hagenah, H.; Merklein, M.; Willner, K.; Wartzack, S. A concept for process-oriented interdisciplinary tolerance management considering production-specific deviations. Proc. Des. Soc. Int. Conf. Eng. Des. 2019, 1, 3441–3450. [Google Scholar] [CrossRef] [Green Version]
  33. Erkaya, S.; Uzmay, I. Investigation on effect of joint clearance on dynamics of four-bar mechanism. Nonlinear Dyn. 2009, 58, 179–198. [Google Scholar] [CrossRef]
  34. Gössner, S. Mechanismentechnik: Vektorielle Analyse Ebener Mechanismen, 3rd ed.; Logos Verlag: Berlin, Germany, 2017. [Google Scholar]
  35. Polini, W. Geometric Tolerance Analysis. In Geometric Tolerances; Colosimo, B., Senin, N., Eds.; Springer: London, UK, 2011. [Google Scholar] [CrossRef]
  36. Qi, X.; Chen, G.; Li, Y.; Cheng, X.; Li, C. Applying neural-network-based machine learning to additive manufacturing: Current applications, challenges, and future perspectives. Engineering 2019, 5, 721–729. [Google Scholar] [CrossRef]
  37. Most, T.; Will, J. Sensitivity analysis using the metamodel of optimal prognosis. In Proceedings Weimarer Optimierungs- und Stochastiktage 8.0; Dynardo: Weimar, Germany, 2011. [Google Scholar]
  38. Hallmann, M.; Schleich, B.; Wartzack, S. From tolerance allocation to tolerance-cost optimization: A comprehensive literature review. Int. J. Adv. Manuf. Technol. 2020, 107, 4859–4912. [Google Scholar] [CrossRef]
  39. Hallmann, M.; Schleich, B.; Heling, B.; Aschenbrenner, A.; Wartzack, S. Comparison of different methods for scrap rate estimation in sampling-based tolerance-cost-optimization. Procedia CIRP 2018, 75, 51–56. [Google Scholar] [CrossRef]
  40. Thornton, A.C. A mathematical framework for the key characteristic process. Res. Eng. Des. 1999, 11, 145–157. [Google Scholar] [CrossRef]
  41. Taguchi, G.; Chowdhury, S.; Wu, Y.; Taguchi, S.; Yano, H. Taguchi’s Quality Engineering Handbook; John Wiley, & Sons: Hoboken, NI, USA; ASI Consulting Group: Livonia, MI, USA, 2005. [Google Scholar]
  42. Hain, K. Getriebespiel-Atlas: Eine Zusammenstellung Ungleichförmig übersetzender Getriebe für den Konstrukteur; VDI-Verlag: Düsseldorf, Germany, 1973. [Google Scholar]
  43. Alafaghani, A.; Qattawi, A. Investigating the effect of fused deposition modelling processing parameters using taguchi design of experiment method. J. Manuf. Process. 2018, 36, 164–174. [Google Scholar] [CrossRef]
  44. Gal, Y.; Ghahramani, Z. Dropout as a bayesian approximation: Representing model uncertainty in deep learning. arXiv 2015, arXiv:1506.02142. [Google Scholar]
  45. Schleich, B.; Wartzack, S. Tolerance analysis of rotating mechanism based on skin model shapes in discrete geometry. Procedia CIRP 2015, 27, 10–15. [Google Scholar] [CrossRef] [Green Version]
  46. Ahlers, D.; Wasserfall, F.; Hendrich, N.; Zhang, J. 3D printing of nonplanar layers for smooth surface generation. In Proceedings of the 2019 IEEE 15th International Conference on Automation Science and Engineering (CASE), Vancouver, BC, Canada, 22–26 August 2019. [Google Scholar] [CrossRef]
  47. Wasserfall, F.; Hendrich, N.; Zhang, J. Adaptive slicing for the FDM process revisited. In Proceedings of the 2017 13th IEEE Conference on Automation Science and Engineering (CASE), Xi’an, China, 20–23 August 2017; pp. 49–54. [Google Scholar] [CrossRef]
Figure 1. Additively manufactured non-assembly 4-bar mechanism after the Fused Deposition Modelling (FDM)-process and after the support removal [8].
Applsci 11 01860 g001
Figure 2. Framework for the statistical tolerance analysis of 3D-printed non-assembly mechanisms using empirical predictive models.
Applsci 11 01860 g002
Figure 3. (a) Vector loop of a 4-bar-mechanism with two kinematic joints affected by clearance. (b) Schematic representation of joint clearance for kinematic joint J 23 (joint clearance illustrated exaggerated). (c) Schematic representation of clearance vector c 23 for kinematic joint J 23 .
Applsci 11 01860 g003
Figure 4. Procedure for gathering a suitable training data set to predict geometric deviations of 3D-printed parts.
Applsci 11 01860 g004
Figure 5. Procedure for the statistical tolerance analysis of 3D-printed non-assembly mechanisms.
Applsci 11 01860 g005
Figure 6. 3D-printed, fully functional 8-bar non-assembly mechanism fabricated via FDM.
Applsci 11 01860 g006
Figure 7. Resulting joint forces for one revolution of the 8-bar mechanism simulated in MSC ADAMS for joint clearance c = 0.4 mm.
Applsci 11 01860 g007
Figure 8. Schematic representation of the considered process parameters and the part geometry for manufacturing non-assembly mechanisms via FDM.
Applsci 11 01860 g008
Figure 9. Non-assembly test specimen for gathering training data for the predictive models using FDM machine Stratasys F370.
Applsci 11 01860 g009
Figure 10. (a) Coupling curve of kinematic joint J 24 as a result of the statistical tolerance analysis (Parameter set 2). (b) Section of whole coupling curve for parameter set 1. (c) Section of whole coupling curve for parameter set 2.
Applsci 11 01860 g010
Table 1. Nominal design parameters of the presented case study.
DefinitionDesign ParameterNominal Value
Linkage 1 L 1 81 mm
Linkage 2a L 2 a 116 mm
Linkage 2b L 2 b 87 mm
Linkage 3 L 3 161 mm
Linkage 4 L 4 60 mm
Linkage 5 L 5 53 mm
Linkage AC L A C 203.5 mm
Angle θ 2 a 2 b 215°
Radial clearance c i j 0.4 mm
Planar clearance c p l a n a r 0.2540 mm
Table 2. Design of experiment (DoE) for experimentally gathering the training data sets.
ParametersFactor Levels
Layer height0.1778 mm; 0.2540 mm
Seam stylealign; random
Build orientation Z-direction0°; 90°
Linkage length53 mm; 87 mm; 161 mm
Table 3. Coefficient of Prognosis (CoP) and root mean squared error (RMSE) values for the different empirical predictive models.
Empirical Predictive ModelCoP ValueRMSE Value [mm]
SVM Joint clearance0.92160.0356
GP Joint clearance0.91830.0362
SVM Tolerance value0.89060.0666
GP Tolerance value0.89260.0653
Table 4. Chosen process parameters for both parameter sets.
Parameter Set 1Parameter Set 2
Layer height0.1778 mm0.2540 mm
Build orientation Z90°
Seam Stylerandomalign
Table 5. Deviation of the desired motion behaviour for the functional key characteristic (FKC), using a 95 % quantile for the different parameter sets.
Parameter Set 1Parameter Set 2
Predicted tolerance0.36 mm0.47 mm
Predicted deviation of clearance c0.04 mm0.14 mm
Deviation FKC2.21 mm2.58 mm
Publisher’s Note: MDPI stays neutral with regard to jurisdictional claims in published maps and institutional affiliations.