Article

Optimal Design and Experimental Verification of Ultrasonic Cutting Horn for Ceramic Composite Material

1
School of Mechanical Engineering, Hanyang University, Seoul 04763, Korea
2
Global Technology Center of Samsung Electro-Mechanics, Suwon 16674, Korea
*
Author to whom correspondence should be addressed.
Appl. Sci. 2021, 11(4), 1954; https://doi.org/10.3390/app11041954
Submission received: 8 January 2021 / Revised: 15 February 2021 / Accepted: 18 February 2021 / Published: 23 February 2021
(This article belongs to the Special Issue Ultrasonic Transducers and Related Apparatus and Applications)

Abstract

:
We developed and optimized a block-type ultrasonic horn that can be used for cutting hard materials. The proposed block-type sonotrode consists of an aluminum horn and a tungsten carbide blade to increase the cutting of hard materials. We designed an initial ultrasonic block horn that has double slots and an exponential stepped profile. We developed a finite element model of the initial model and analyzed the characteristics of natural frequency and displacement. We formulated a DOE table and response surface to perform sensitivity analysis and analyze the correlation between the design variables and characteristics of the proposed block horn. The optimal ultrasonic block horn was derived via a multi-objective optimal design problem to maximize the amplitude uniformity of the proposed horn and frequency separation. We fabricated the optimal block horn and verified it experimentally. An ultrasonic cutting experiment was conducted to find the ultrasonic cutting force with hard ceramic composite materials. A cutting test with a conventional cutting machine under the same condition was also conducted to compare the cutting force. The proposed optimal ultrasonic cutter requires 70% less cutting force than the conventional cutter to cut a ceramic composite material and the cutting surface with the application of the proposed optimal ultrasonic cutter is much cleaner with no crack and delamination than that with the application of the conventional cutter.

1. Introduction

Ultrasonic vibration has been applied to various manufacturing machines such as bonding, welding, drilling, and cutting machines by resonating a tool at ultrasonic frequency to assist in the manufacturing process [1,2,3,4,5,6,7,8,9]. Ultrasonic machining has many advantages over the conventional machining process. In ultrasonic cutting machines, the ultrasonic vibration applied to a cutting tool reduces the required cutting force and decreases the friction force between the workpiece and tool, which decreases the stress applied to a workpiece, thus generating a uniform surface and cross section of the cut product. Figure 1a shows the structure of a block-type ultrasonic cutting machine that consists of a piezoelectric oscillator, booster, shaft and sonotrode. The piezoelectric oscillator is used as a resonator that generates ultrasonic vibration at the natural frequency of the cutting machine. The booster transmits the vibration to the horn and amplifies or dampens the vibration as necessary. The shaft combines the booster and the horn, and transmits the vibration coming from the booster to the horn. The vibration reaching the horn is amplified and transferred to the blade. Finally, the ultrasonic vibration arriving at the blade assists the cutting process. There are many different types of ultrasonic cutting horns, depending on the shape. Among them, a horn whose width is more than one-third of the horn material wavelength is called a block-type horn [10]; such a horn is also called a food cutting blade, wedge blade, or guillotine blade. The block-type ultrasonic cutter has a larger width than the other types, so they are mainly used to cut large raw materials into smaller pieces. However, the block-type cutting horn is only used for cutting and splitting of soft materials such as rubber, plastic and foodstuffs, not hard material. The main reason is that the block-type ultrasonic horn and blade are made of a single material such as titanium, aluminum, and stainless steel to increase their high wear resistance, high Q-factor and good acoustic characteristics [8]. Therefore, this monolithic structure with ultrasonic material has lower hardness than tungsten carbide or tool steel, which are commonly used as a tool tip. This limitation can be overcome by developing a horn with ultrasonic material and a blade with high hardness material and combining them to expand the application area of ultrasonic cutting machines to cut hard material.
Many researchers have investigated the ultrasonic cutting mechanism of block-type horns using an analytical method. Zahn et al. studied the reduction of the cutting force of several workpieces according to the working conditions of block-type ultrasonic cutters [11]. Lucas et al. developed a finite element model for ultrasonic cutting of a single and double layer model [12]. Deibel et al. investigated the ultrasonic cutting of laminated paper using a dynamic model and calculated the cutting force [13]. However, these studies focused on the characteristics of the block-type cutter according to the ultrasonic cutting process or working conditions, and the effect of the geometric characteristics of the horn was not analyzed. Some researchers have studied the characteristics of ultrasonic cutters with respect to the geometry of ultrasonic horns. Lucas et al. added small slots to an ultrasonic horn and analyzed the effect of the small slots on the frequency isolation and vibration uniformity, Cardoni et al. further considered the thickness of the horn as a design variable to analyze the frequency characteristics of the horn [14,15]. Roopa Rani et al. studied the displacement, stress, and heat specification of various horns with different cross-sectional shapes through experimental and analytical methods, and Nguyen et al. developed a horn with a B-spline cross-sectional shape and further investigated its characteristics [16,17]. In addition, many researchers have investigated the displacement and frequency characteristics of various ultrasonic machines considering the geometrical characteristics of the horn, but it was a single-material ultrasonic horn and blade, and they did not even consider the various geometrical design variables simultaneously [7,18,19,20,21,22,23,24,25,26].
In this study, we proposed an optimal block-type ultrasonic cutter with dissimilar material that combines an aluminum horn with a tungsten carbide blade in order to cut hard materials as well as soft materials. We designed an initial ultrasonic block horn, developed a finite element model of the initial model and analyzed the characteristics of its natural frequency and displacement. We formulated a multi-objective optimal design problem of the ultrasonic block horn to maximize the amplitude uniformity and frequency separation to ensure cutting performance. We calculated the optimal design problem and proposed an optimal block-type ultrasonic horn and also performed the sensitivity analysis to analyze the correlation between many design variables and characteristics of the ultrasonic horn. We fabricated the proposed optimal block horn and verified it experimentally. An ultrasonic cutting experiment was conducted to find the ultrasonic cutting force with hard ceramic composite materials. A cutting test with a conventional cutting machine under the same conditions was also conducted to compare the cutting force and the cutting surface.

2. Initial Design and Finite Element Analysis of an Ultrasonic Cutting Horn

2.1. Conceptual Design of a Sonotrode

Figure 1b shows a basic structure of the initial sonotrode model, which consists of a horn, blade and shaft. The horn and blade were bonded using epoxy-based adhesives. The materials of the horn and blade were aluminum and tungsten carbide, respectively. Table 1 shows the material properties of the horn, blade and shaft. The length of the horn is the main variable that determines the axial mode frequency. The relation between the length of the horn and axial mode frequency can be obtained by solving the following wave equation [18]:
λ = c f = 1 f E ρ = 2 l
where λ, f, E, ρ and l represent the wavelength, axial mode frequency, elastic modulus, density and length of the horn, respectively. Generally, the axial mode frequency of a block-type horn is in the low ultrasonic range of 20–40 kHz [15]. Therefore, the axial mode frequency was determined to be 28.5 kHz, which is in that range. Using the length of the horn calculated by axial mode frequency and the horn material properties, the value from Equation (1) was 88.9 mm. The horn was designed to have a reduced rectangular cross section that was stepped toward a lower face. This reduction in cross-sectional area amplifies the vibration passing through the horn, which creates a high vibration at the lower face of the horn. The horn had double slots that divide the horn into two side bars and one middle bar, and these bars have a shorter edge compared to the whole edge of the horn. These slots create uniform vibration at the lower face of the horn, because the vibration at the lower face of the horn tends to be greatest at the center and becomes smaller along the edge due to the shaft being located in the middle of the horn. Additionally, each side bar was designed to have a greater thickness than the middle bar at the upper part and has the same thickness at the lower part to create uniform vibration at the lower face of the horn. This is because the vibration at the lower face of the side bars should be amplified more than the middle bar. In addition, the width (length of the horn along the x-axis) was designed to be reduced at the lower part of the horn to amplify the vibration at this edge.

2.2. Finite Element Analysis

We developed a finite element model using ANSYS software to analyze the characteristics of the proposed sonotrode model. The convergence of the developed finite element model was secured, and it had 20,155 hexahedral elements with a size of 2.5 mm. Figure 2 shows the developed finite element model and boundary conditions. For the boundary conditions, the displacement of the shaft was constrained along the x- and y-axes. The natural frequencies and mode shapes were calculated by modal analysis. The frequency isolations are defined as follows:
f 1 st isolation = f axial f axial 1
f 2 nd isolation = f axial + 1 f axial
where faxial, faxial−1, faxial+1, f1st isolation and f2nd isolation represent the axial mode frequency, one lower mode frequency, one higher mode frequency, the 1st frequency isolation and the 2nd frequency isolation. Figure 3 shows the mode shape of the axial mode and one lower and higher mode. In the axial mode, the horn vibrates along the axial direction. The one lower and higher mode of the sonotrode are the bending motion of the horn lower part and blade. The one lower mode shape is the 2nd bending mode, where both ends of the blade deform in the y-axis direction, and the one higher mode shape is the 3rd bending mode where both ends and the center of the blade deform in the y-axis direction. The axial frequency, the 1st frequency isolation and the 2nd frequency isolation were 28,520 Hz, 1588 Hz and 864 Hz, respectively.
The maximum displacement at the horn lower face, minimum displacement at the horn lower face, gain and displacement uniformity were calculated by harmonic analysis. The gain and displacement uniformity were defined as follows:
α = ( u low ) min ( u low ) max · l00
g = ( u low ) max ( u upp ) max
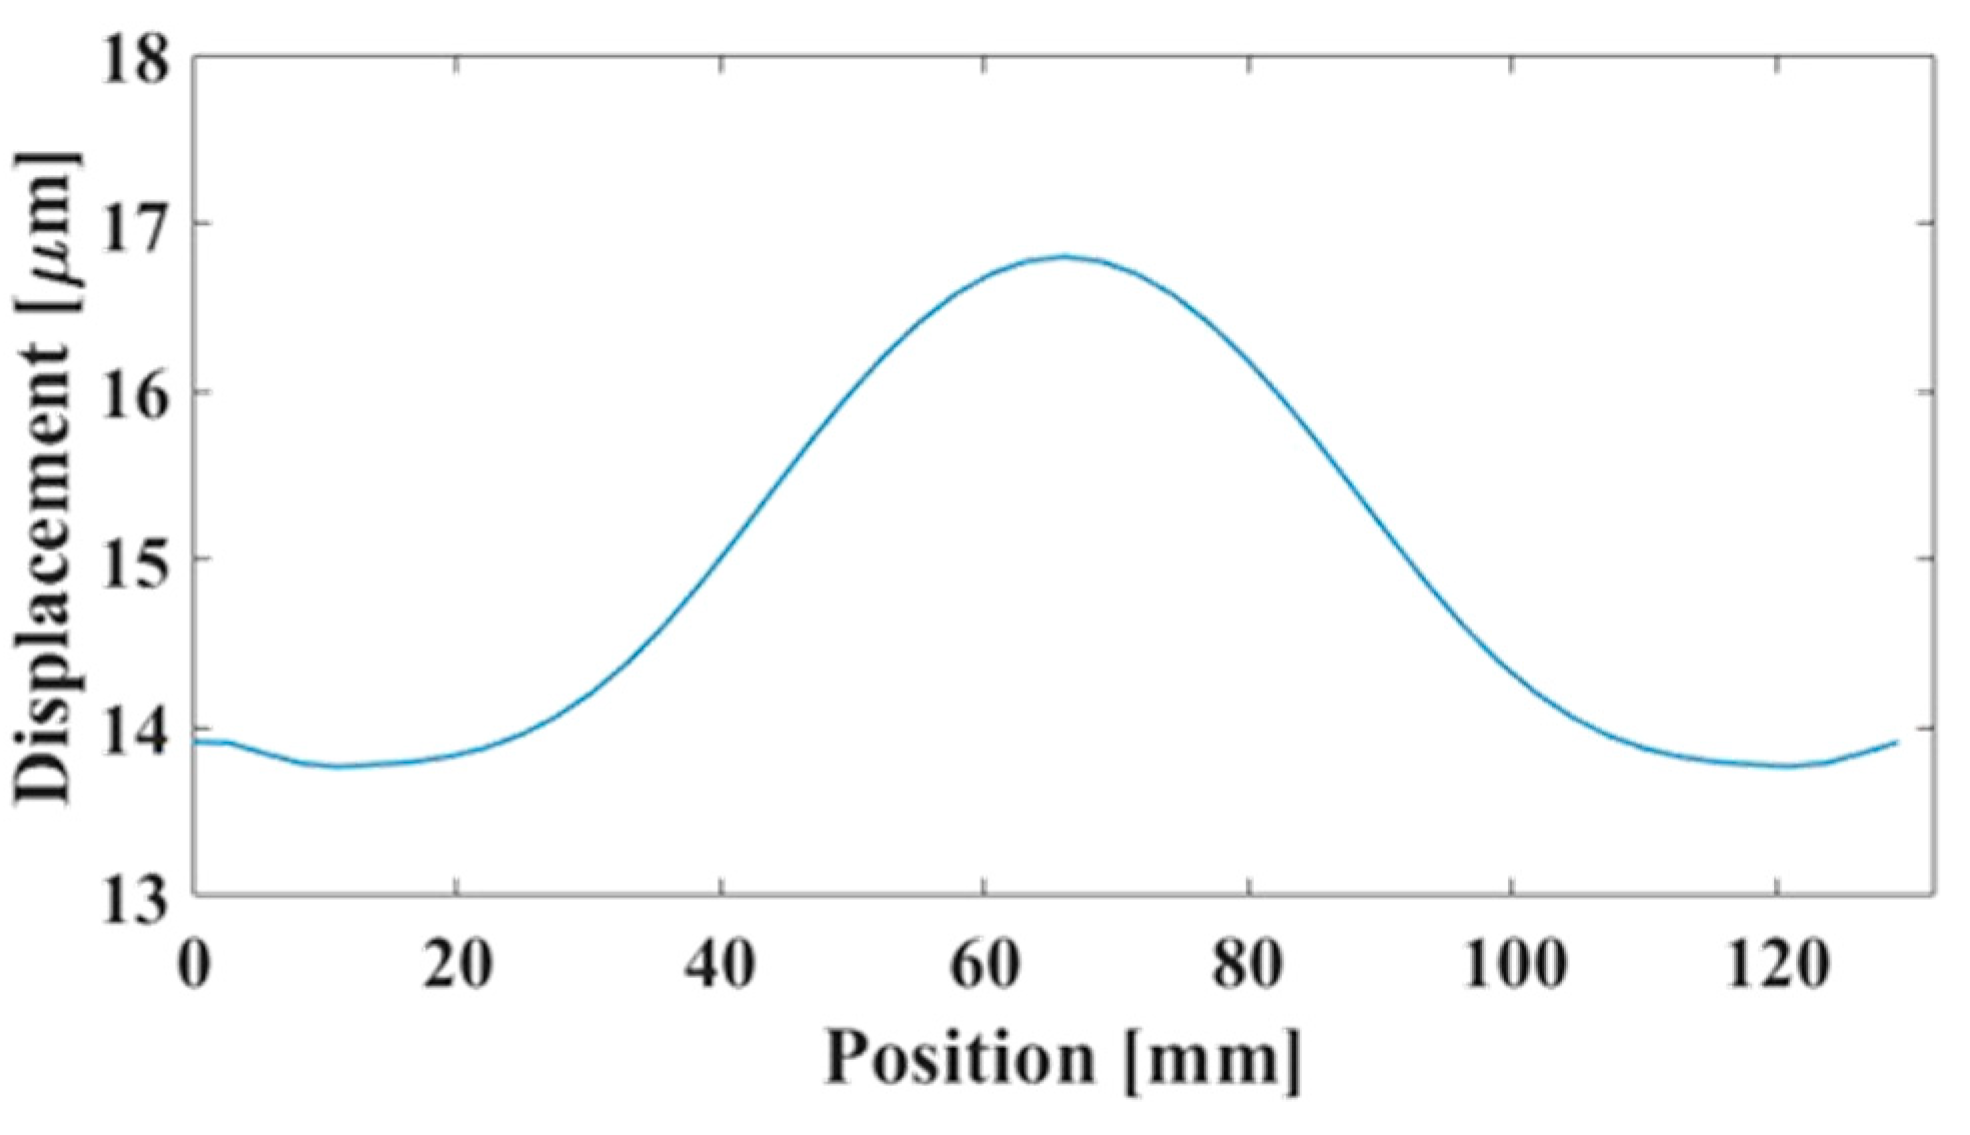
where a, g, (ulow)min, (ulow)max and (uupp)max represent the displacement uniformity, gain, minimum displacement at the horn lower face, maximum displacement at the horn lower face and maximum displacement at the horn upper face, respectively. Under the analysis conditions, the displacement of the shaft was constrained along the x- and y-axes, and the axial mode frequency was used as the excitation frequency. Figure 4 shows the calculated displacement along the horn lower face. The maximum displacement, minimum displacement, displacement uniformity and gain were 16.80 μm, 13.76 μm, 1.07 and 81.9%, respectively. These dynamic characteristics (natural frequency, frequency isolation, displacement) are changed with changes in the design variables, so it is very hard to decide the specific values of design variables using the trial and error method. Therefore, we used the optimal design method to derive the best horn model.

3. Optimization of the Developed Ultrasonic Cutting Horn

3.1. Sensitivity Analysis

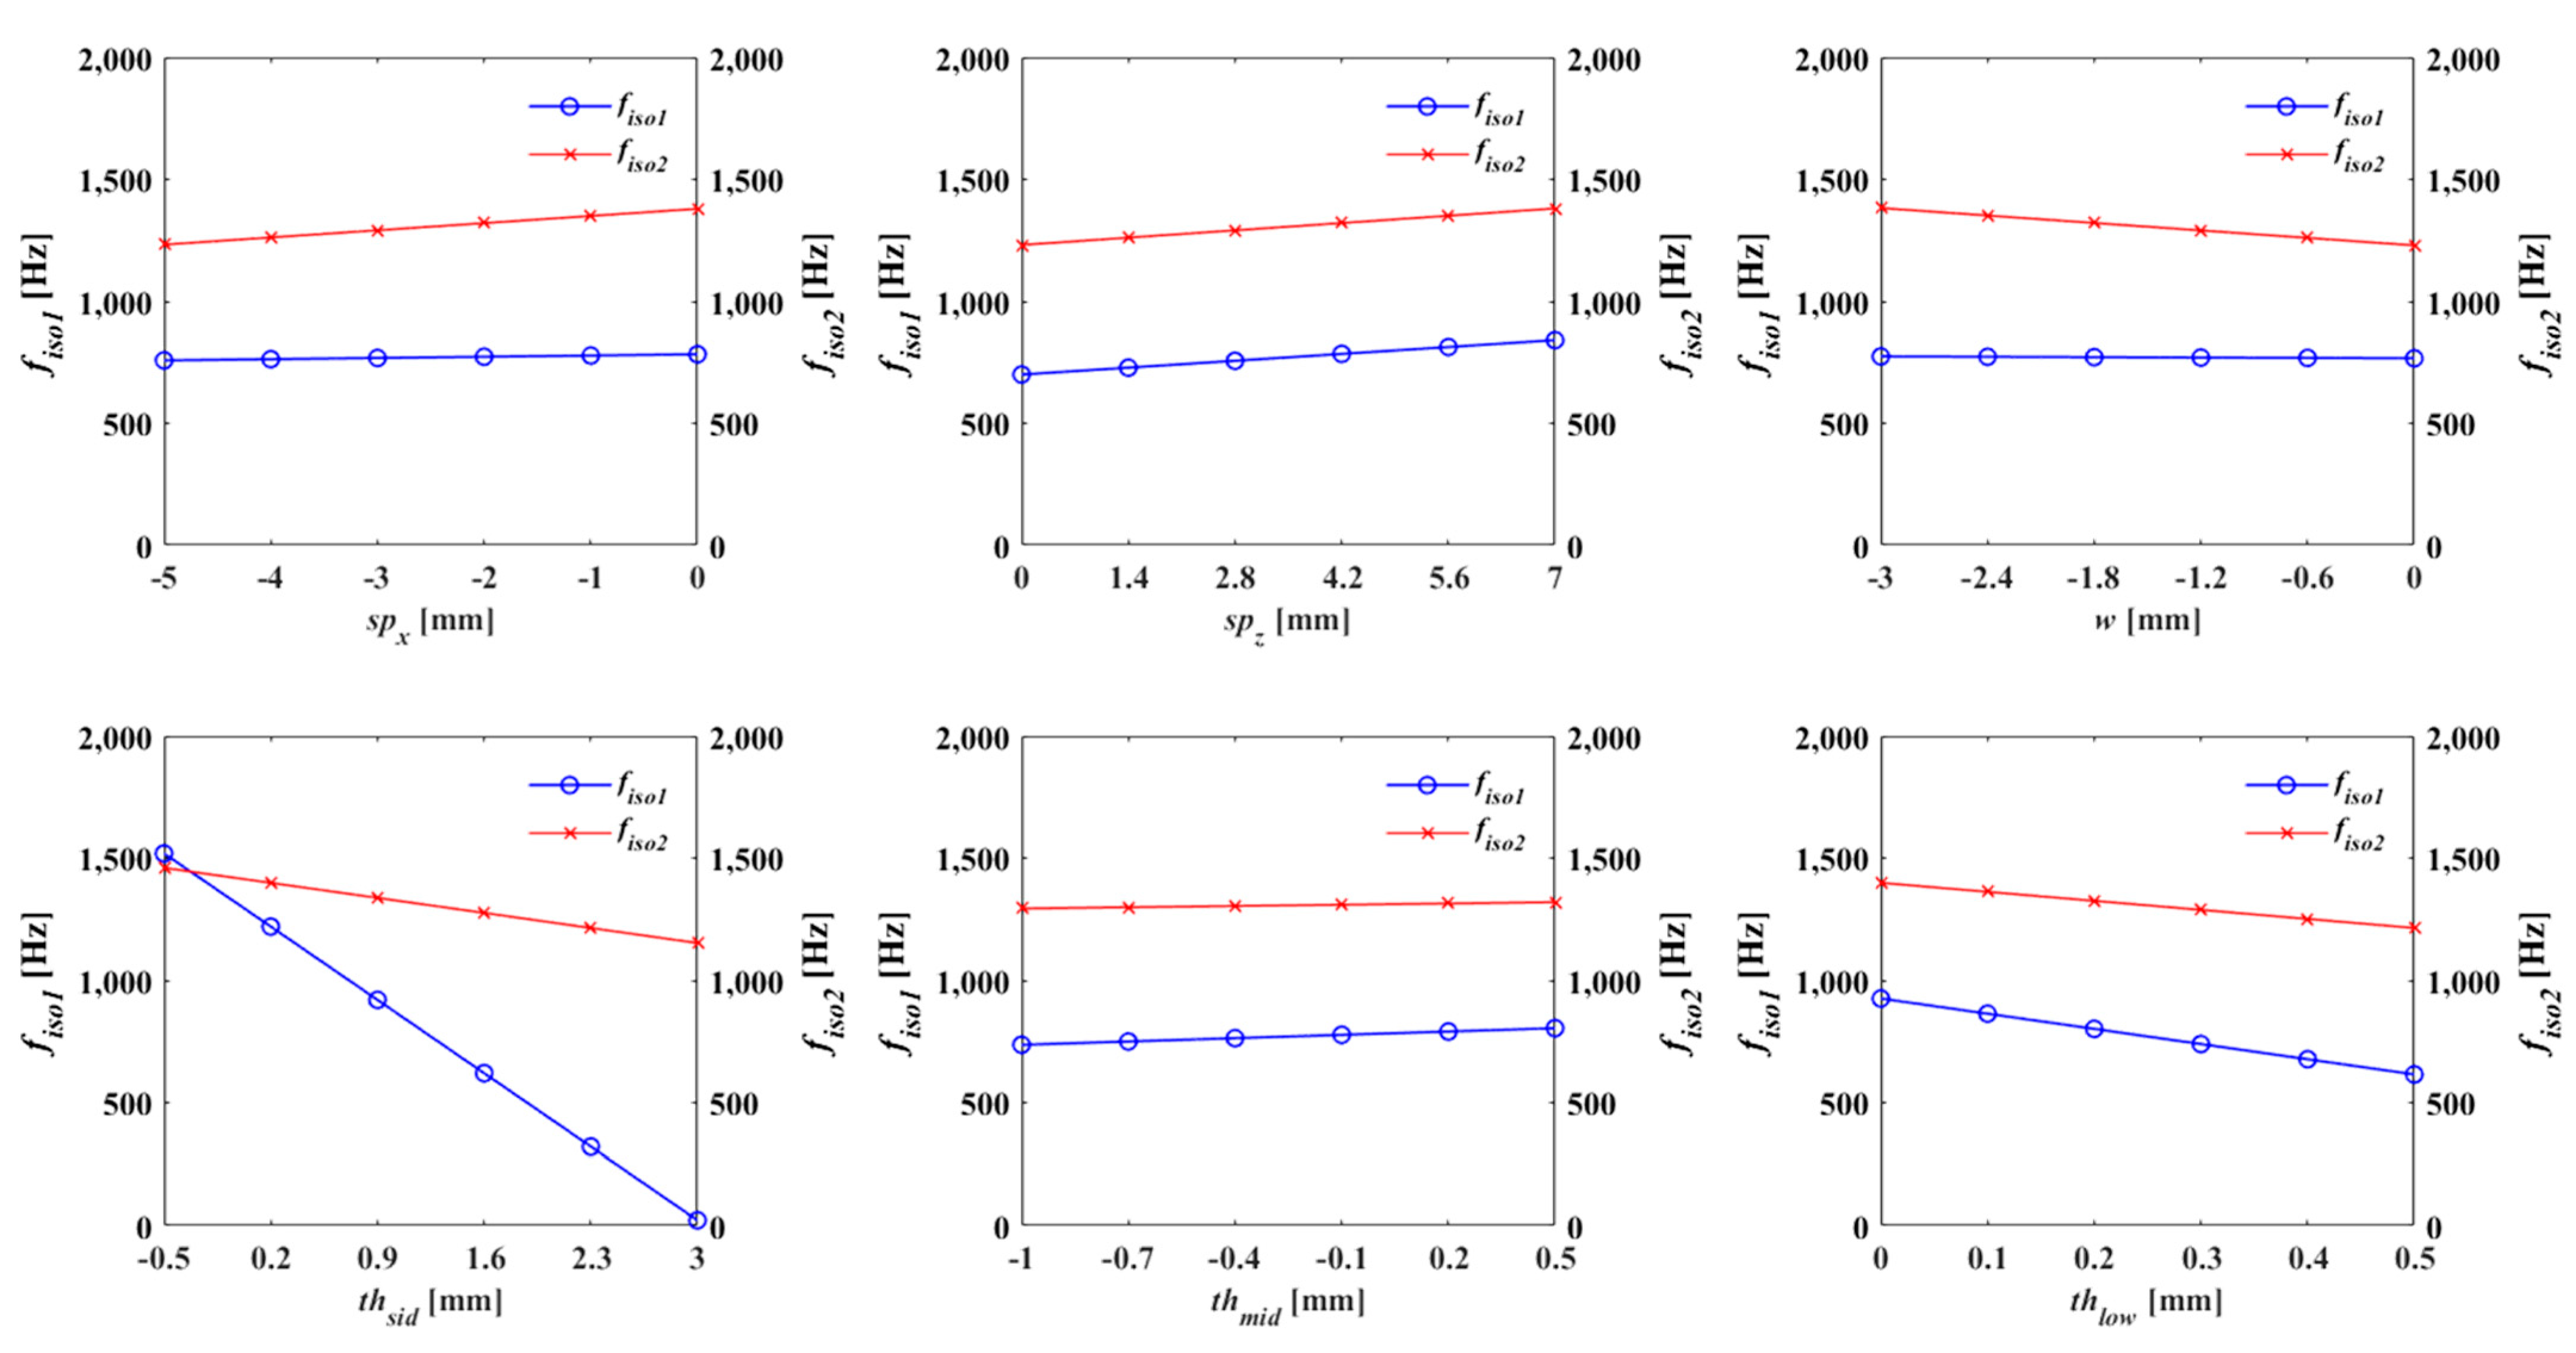
We performed sensitivity analysis of the proposed block-type horn. Figure 5 shows the input parameters of the x-axis position of the slot, the z-axis position of the slot, width, thickness of the side part, thickness of the middle part and thickness of the lower part. Table 2 shows the upper and lower limit of each input parameters. The output parameters were the 1st frequency isolation, 2nd frequency isolation, gain and displacement uniformity. The sensitivity analysis was performed in the following steps: (1) a design-of-experiments (DOE) table is established by the optimal space filling method; (2) modal and harmonic analysis of every sample point are performed to complete the DOE table; (3) the response surface is formulated by a neural network method; and (4) the sensitivity analysis is performed using the response surface. Figure 6 shows the 1st and the 2nd frequency isolation according to the variation of the x-axis position of the slot, z-axis position of the slot, width, thickness of the side part, thickness of the middle part and thickness of the lower part. The thickness of the side part has the greatest influence on the 1st frequency isolation and decreases as the thickness increases. The effect of the thickness of the side part also has the greatest influence on the 2nd frequency isolation, which decreases as the thickness of side part increases. Figure 7 shows the displacement uniformity and gain according to the variation of the x-axis position of slot, the z-axis position of the slot, width, thickness of the side part, thickness of the middle part and thickness of the lower part. The z-axis position of the slot and the thickness of the side part have the great influence on the displacement uniformity. The displacement uniformity increases as the z-axis position of the slot decreases to negative or the thickness of the side part increases. The z-axis position of the slot and the thickness of the middle part have the great influence on the gain. The gain increases as the z-axis position of the slot decreases to negative or the thickness of the middle part increases. The result of the sensitivity analysis shows that every design variable influences the output parameters differently, but the most critical variable among them was the thickness of the side part.

3.2. Optimization

We formulated a multi-objective optimal design problem to maximize the 1st and 2nd frequency isolation and displacement uniformity as follows:
Maximize α l f l st isolation + α 2 f 2 nd isolation + α 3 α
subject to ( f isolation ) lower _ limit f l st isolation ( f isolation ) lower _ limit f 2 nd isolation ( α ) lower _ limit α ( X i ) lower _ limit X i ( X i ) upper _ limit
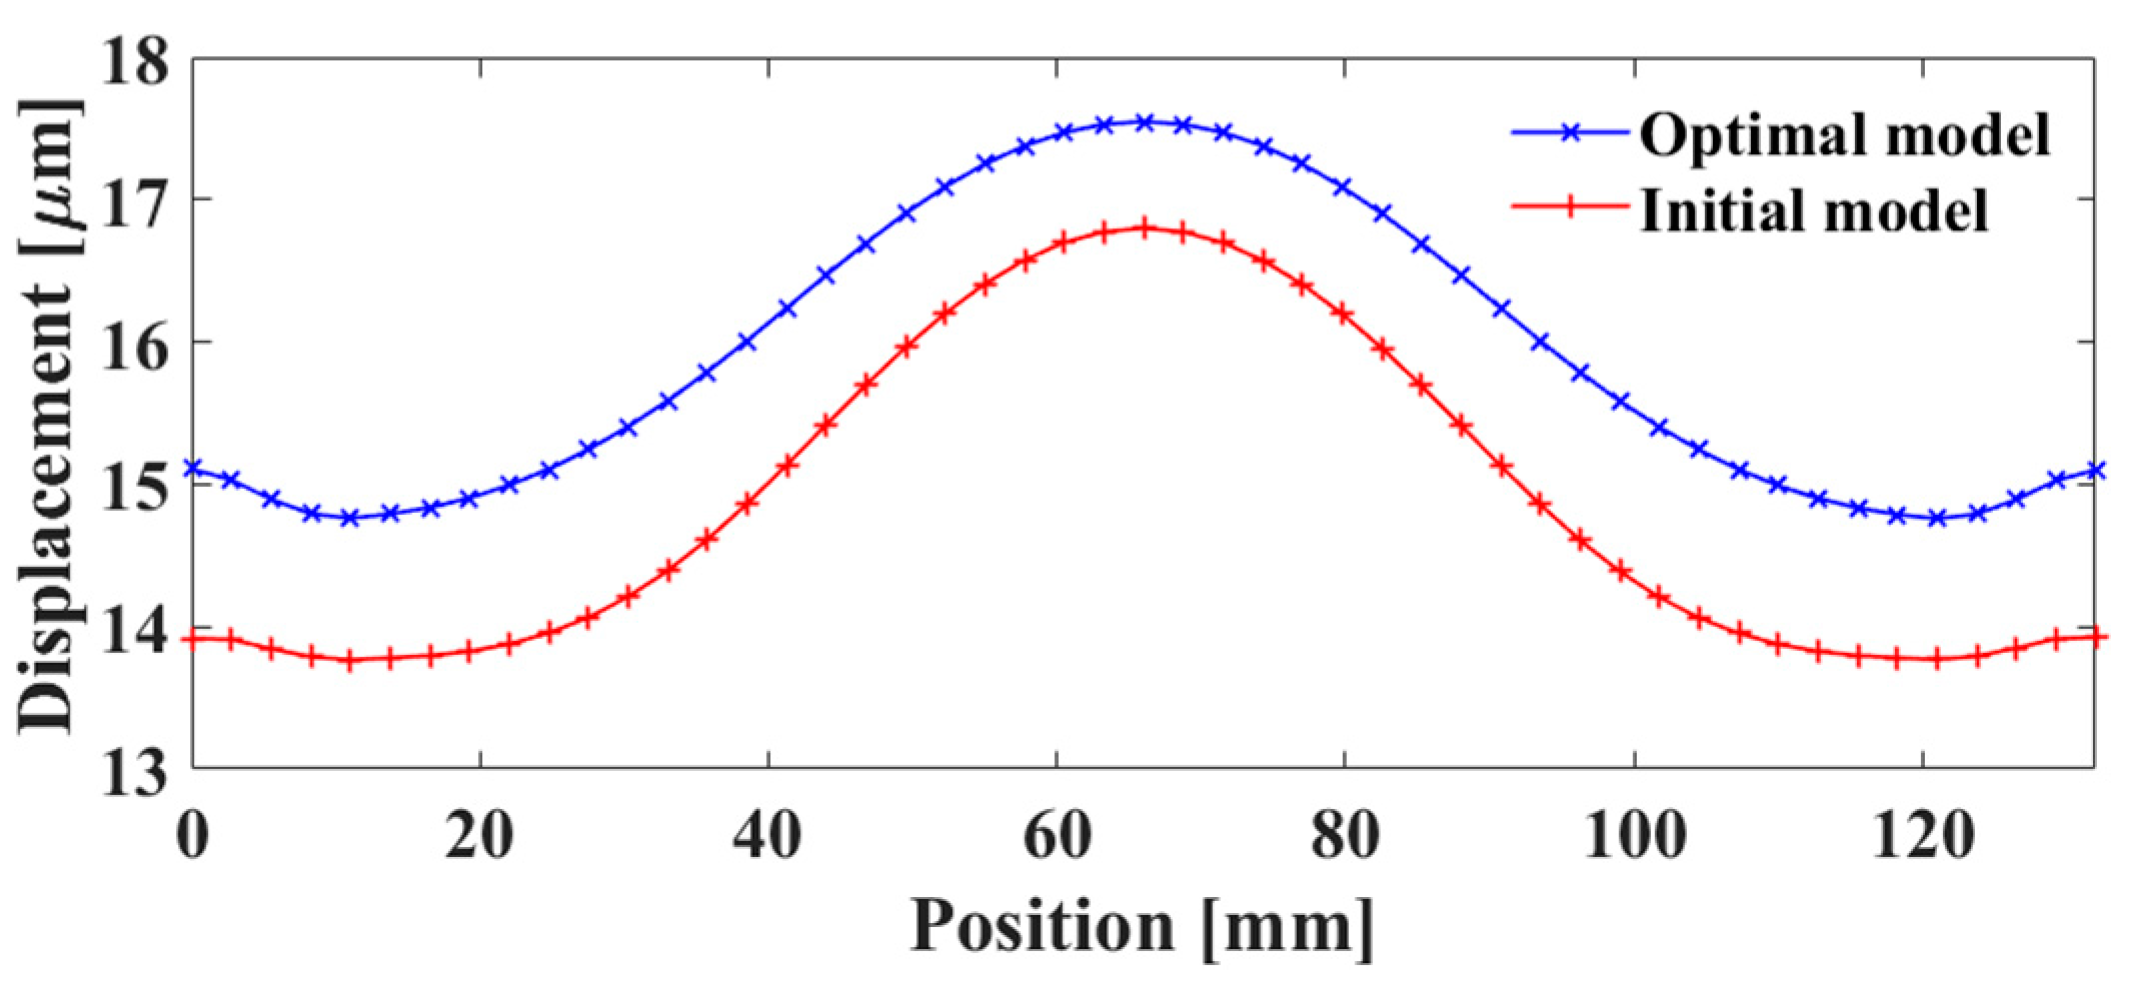
where α1, α2 and α3 represent the weight factors of the output parameters, and we set each of these values as 0.333, 1 and 0.333, respectively. The weight factor of the f2nd isolation is greater than the others in order for both frequency isolations to be at the same level. (fisolation)lower_limit and (a)lower_limit represent the lower limits of the frequency isolations and displacement uniformity, and these values were set as 1200 and 84. Xi, (Xi)lower_limit and (Xi)upper_limit represent the design variable, upper and lower limits of the design variables. The input parameters are the design variables used in the sensitivity analysis. The optimal design problem was solved using the multi-objective genetic algorithm. In addition, finite element analysis of the optimal model was performed under the same analysis conditions as the analysis of the initial model, and the variation of each output parameter was confirmed. Table 3 shows the input and output parameters of the initial and optimal model. In the optimal model, the x-axis position and width of the slot were smaller than the initial model. Additionally, the thickness of the lower part was the same as the initial model, and the z-axis position of the slot, the thickness of middle bar, and the thickness of the side bar were larger than the initial values. Table 4 shows the output parameters of the optimal and initial models. Figure 8 shows the displacement at the lower face of each model. The optimal model has a maximum and minimum displacement greater than the initial model, by 0.75 μm and 1 μm, respectively. In addition, the difference between the maximum and minimum displacement was 0.25 μm smaller than the initial model. The 1st and 2nd frequency isolations were 1189 Hz and 1181 Hz, respectively. The 1st frequency isolation was 358 Hz less than the initial model, and the 2nd frequency isolation increased by 403 Hz. Both the 1st and 2nd frequency isolations of the optimal model were greater than 1000 Hz.

4. Fabrication and Experimental Verification

4.1. Displacement Measurement Experiment

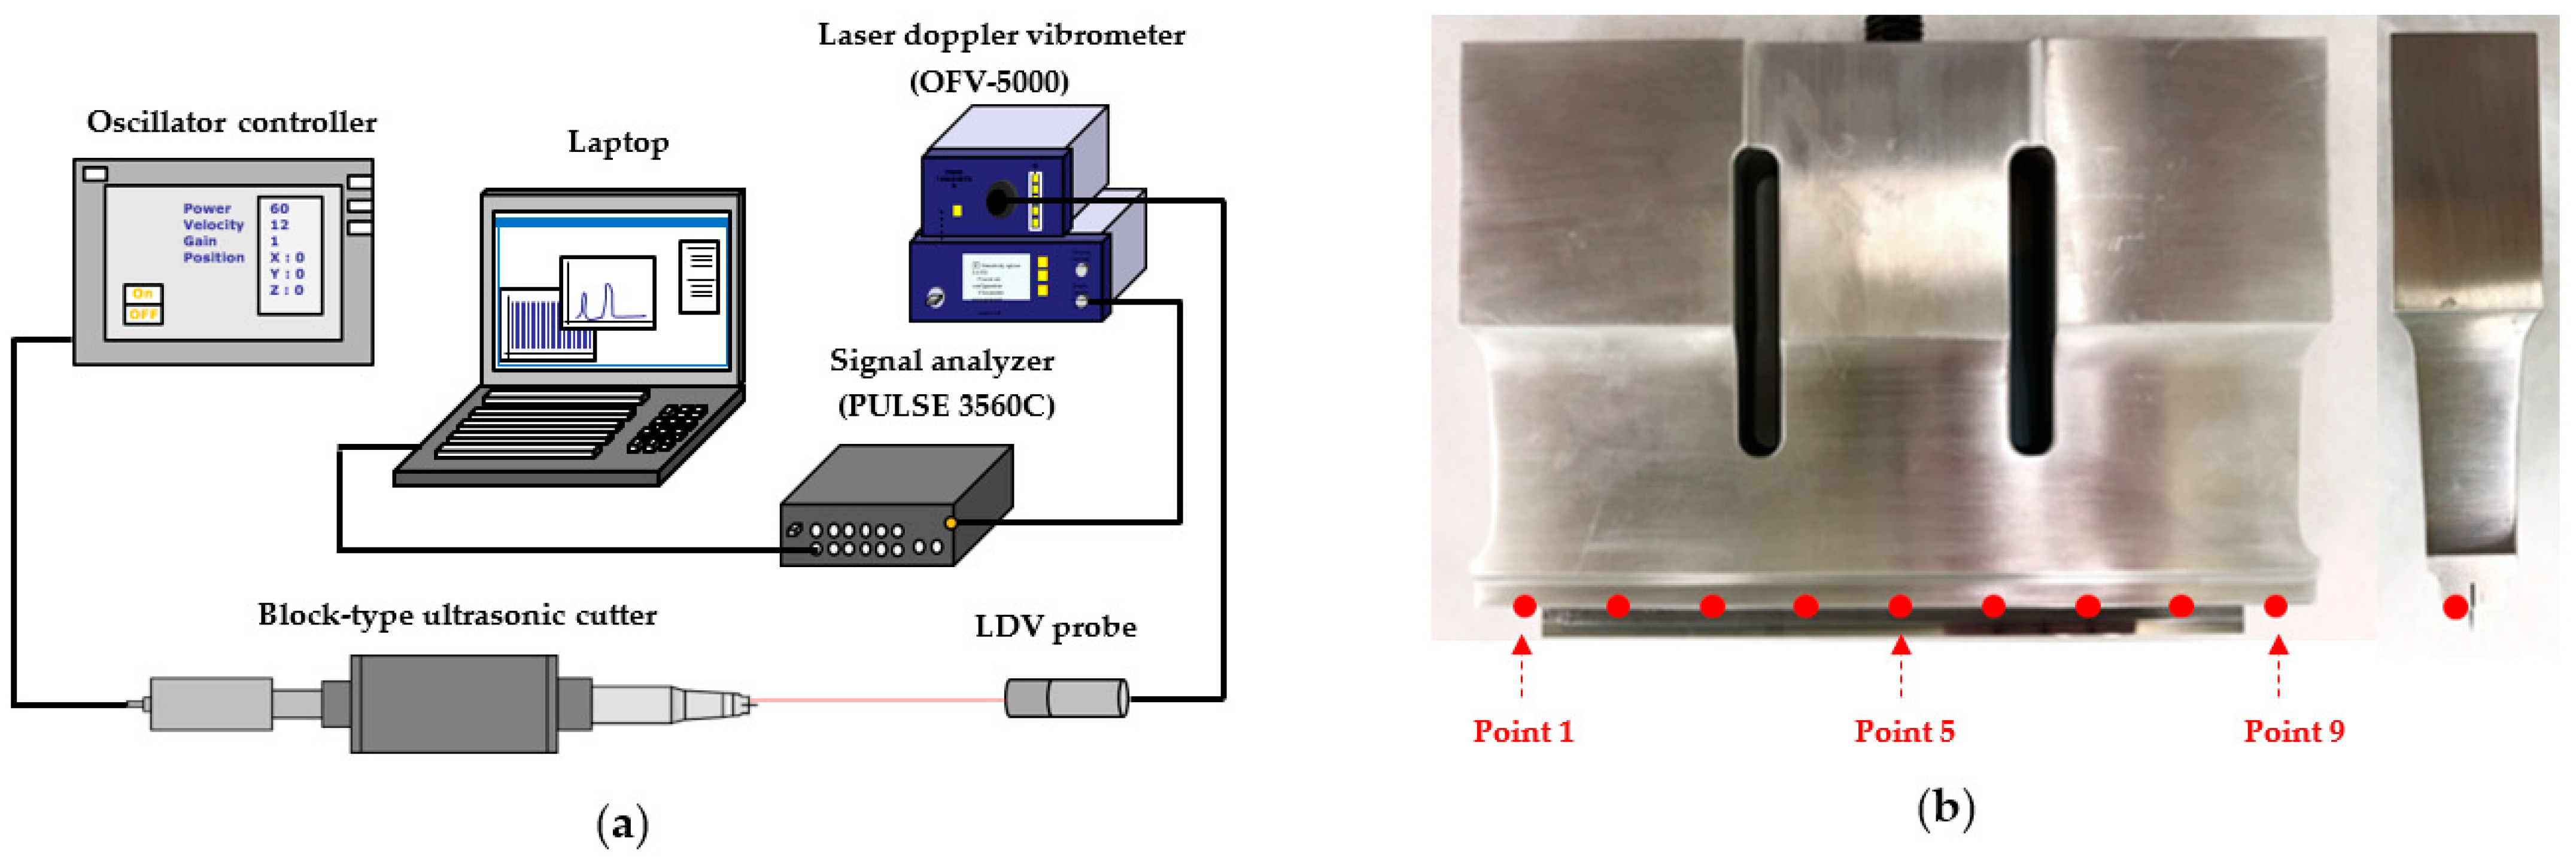
The optimal model of the proposed horn was fabricated, and a displacement measurement experiment was conducted to verify the optimal design. Figure 9a shows the experimental set-up, which consists of a block-type ultrasonic cutting machine (developed block-type horn and oscillator), laser Doppler vibrometer sensor (LDV, Polytec), signal analyzer (B&K PULSE), and laptop. Figure 9b shows the prototype horn and the displacement measurement points on the lower face of the horn. The value of the data measured over 1 s was used for the output displacement at the lower face of the horn.
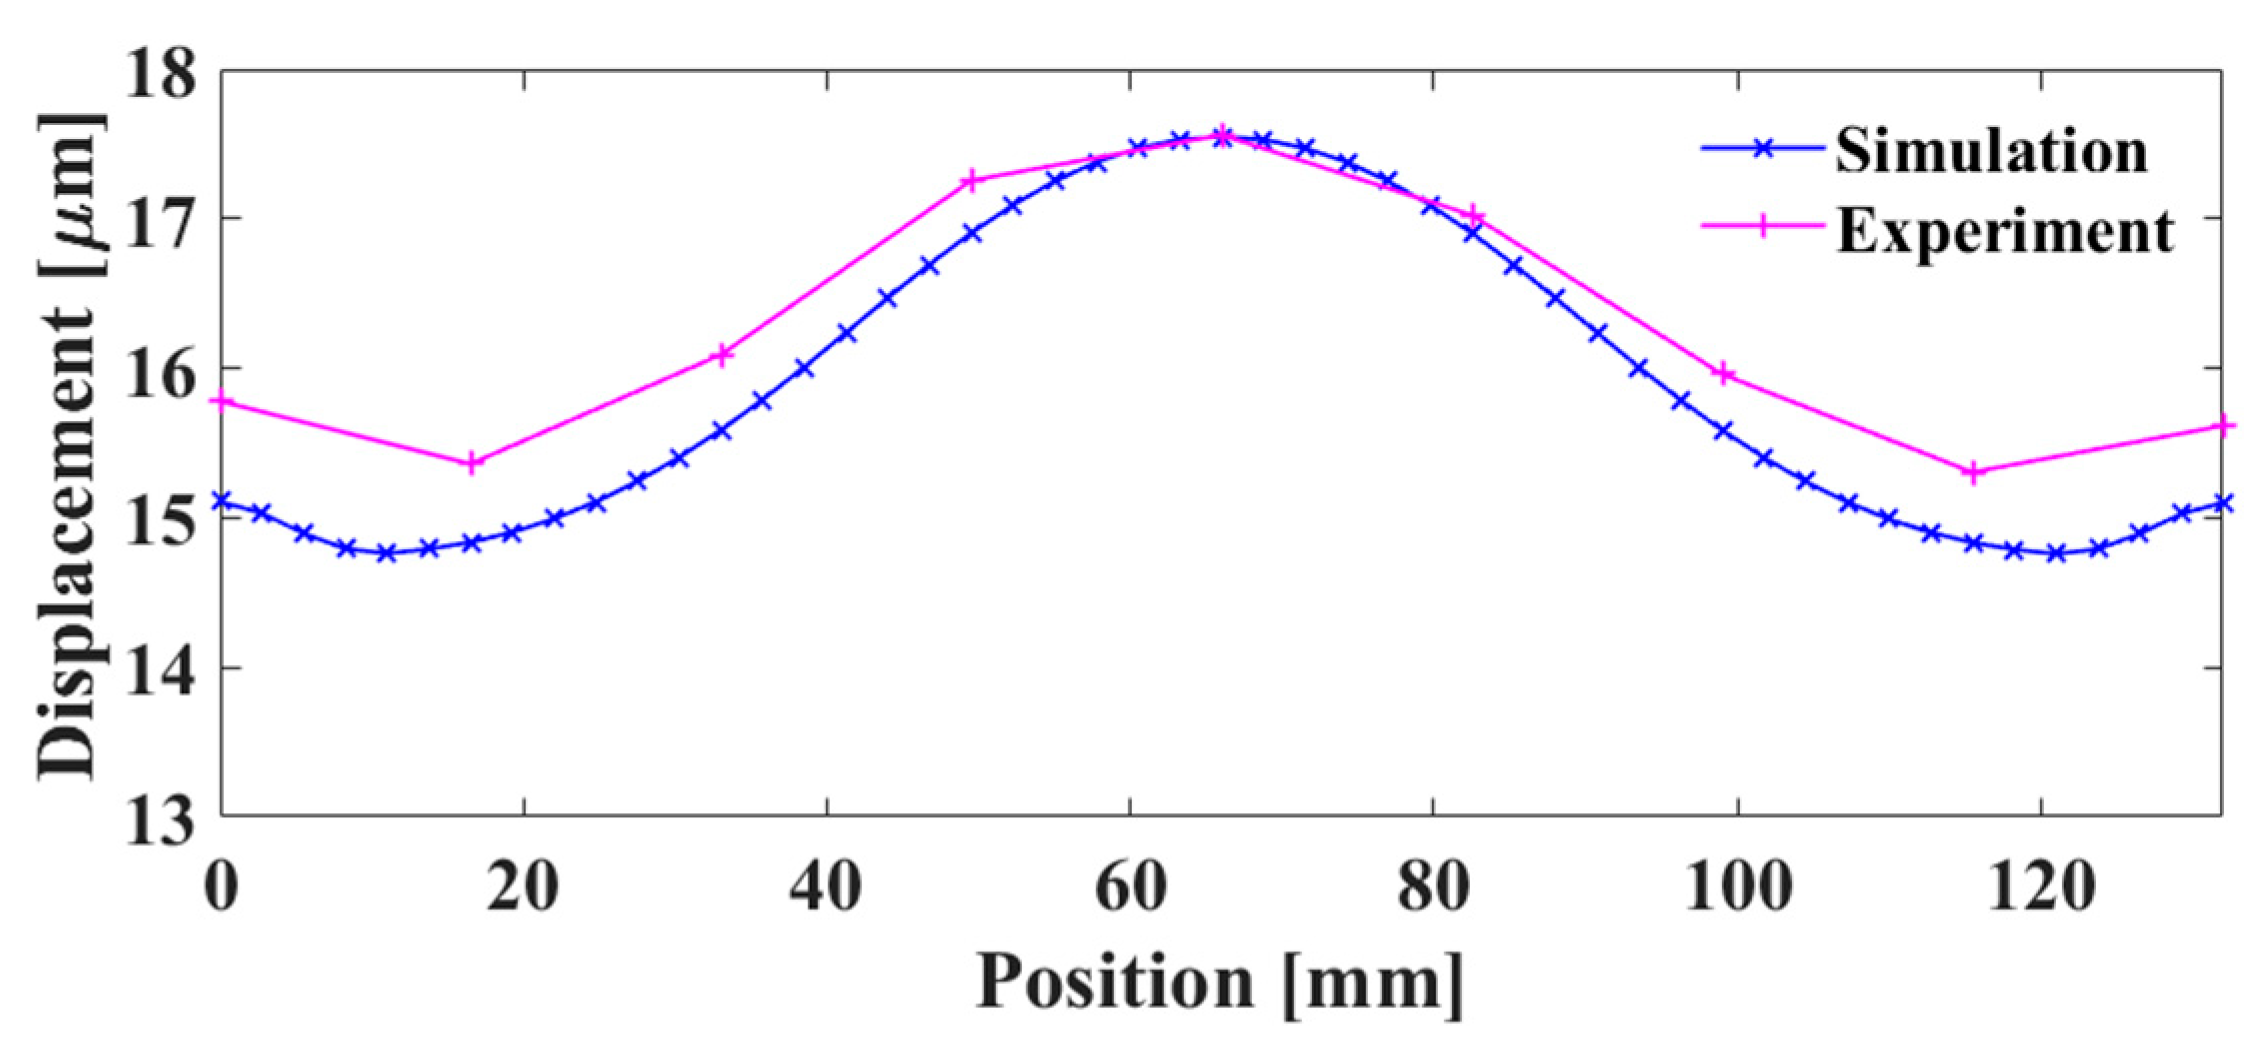
The ultrasonic horn was excited by a resonator at 28.5 kHz, as we intended from the design stage, and the experiments were performed repeatedly at nine points at the lower face. Figure 10 shows the simulated and measured displacement at the lower face of the horn. Table 5 shows the maximum and minimum displacements of the results and displacement difference at the lower face of the horn. The measured maximum displacement of 17.56 μm occurred at point 5. The reason for this is that point 5 is located at the center of the horn, and the shaft, which is the maximum vibration source, is also located in the same position. The minimum displacement of 15.30 μm occurred near point 8. This is because the width at the lower part of the horn was designed to be reduced to amplify the vibration at each edge of the horn. The difference between the measured and simulated displacements was less than 4%, which shows that the fabricated horn well matched with simulation horn.

4.2. Cutting Experiment

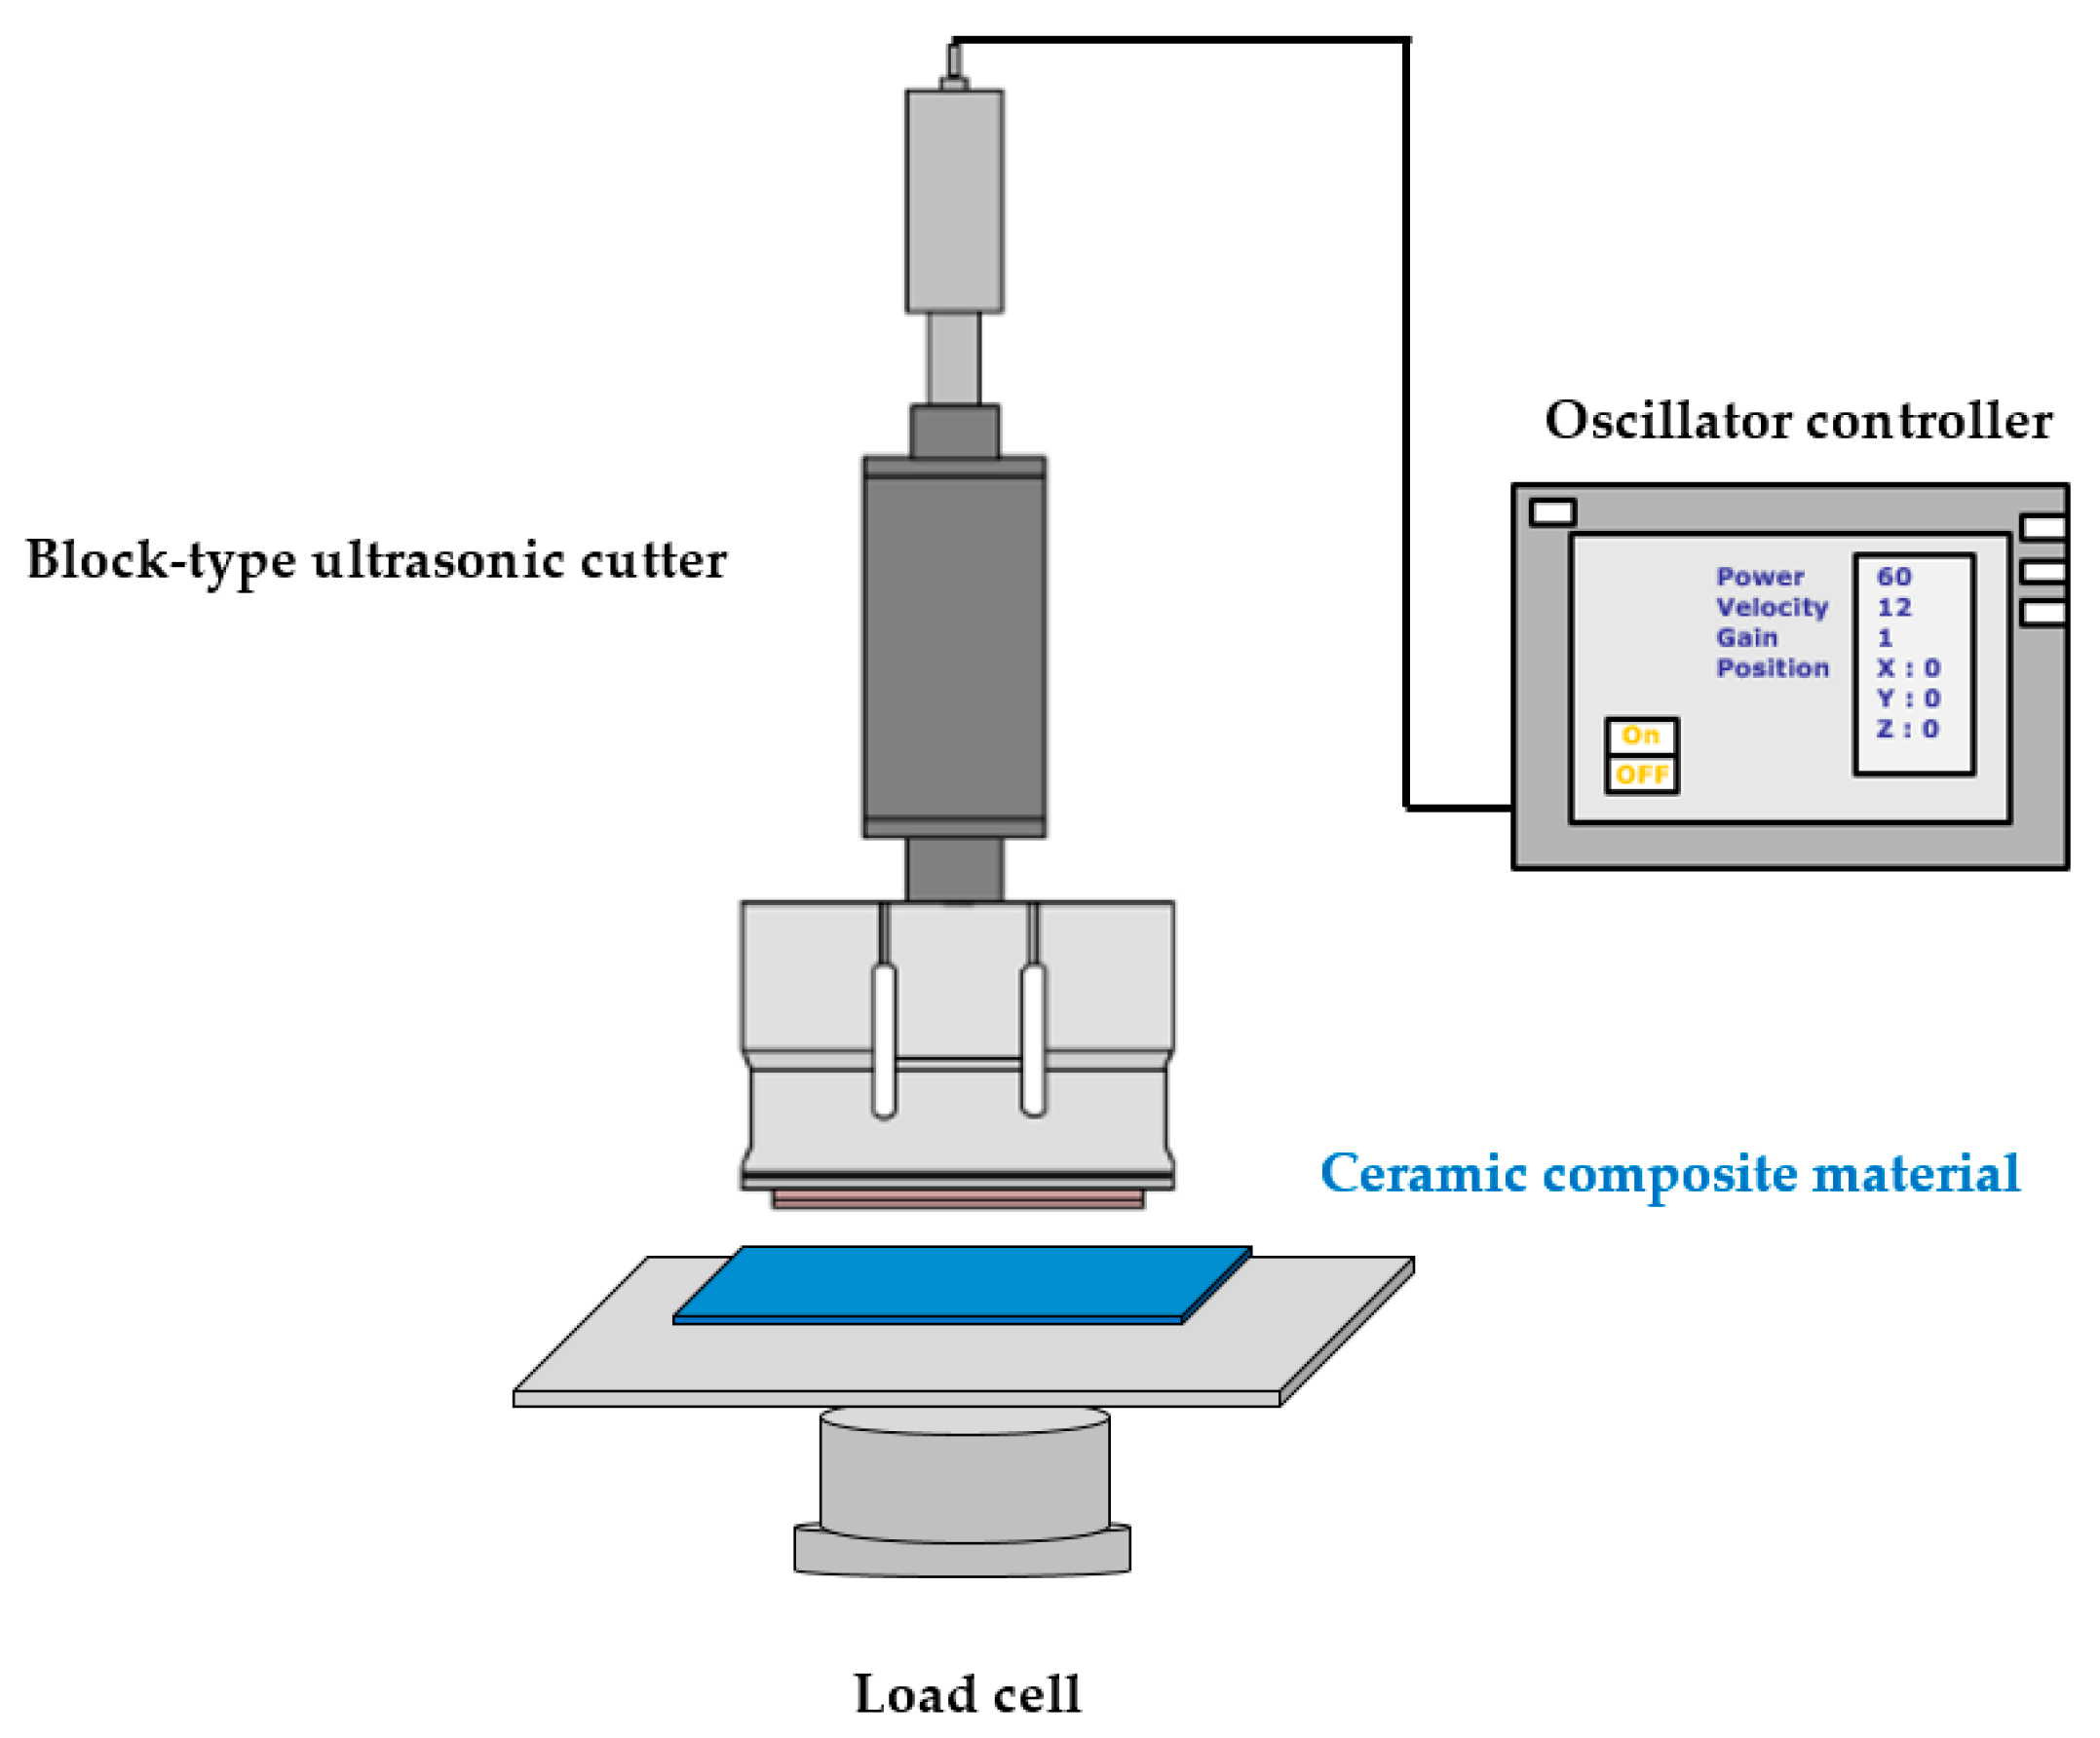
The cutting experiment was performed to confirm the effectiveness of the ultrasonic-assisted cutting using the fabricated ultrasonic horn. Figure 11 shows the experimental set-up of the cutting experiment. The load cell was used to measure the cutting force and the oscillator was used to resonate the horn to a natural frequency of 28.5 kHz. The cutting work was conducted in the axial direction of the ultrasonic cutter, and the resonance frequency was applied for 0.1 s before and after the contact occurs. Silicon composite materials (8 GPa Vickers hardness, 18-μm thickness), which are actively used in electronic products, were used as the experimental specimens. The cutting speed was 100 mm/s, in order to cut two specimens per second. The average cutting force of the 10 cutting experiments was measured. The experiments were conducted with and without an ultrasonic vibration excitor. Table 6 shows the cutting force of the 10 cutting experiments with and without an ultrasonic vibration excitor. The output cutting force of the optimized cutter assisted by ultrasonic vibration was 78.5 N and the output cutting force without using ultrasonic vibration was 234.0 N. The cutting force assisted by ultrasonic vibration was reduced to 30% of the conventional cutting force. Figure 12 shows samples of the cutting surface of the specimens photographed using a scanning electron microscope (SEM). As shown in Figure 12a, the cutting surface without an ultrasonic vibration excitor had crack and delamination in which lamination layer being apart or defected. On the other hand, as shown in Figure 12b, the cutting surface with an ultrasonic vibration excitor was clean, with no faults. This can be explained by the fact that the reduced cutting force with the application of the ultrasonic vibration excitor decreases the friction force between the horn and the specimen and improves the quality of the cutting surface.

5. Conclusions

We proposed a block-type ultrasonic cutting sonotrode that consists of an aluminum horn and a tungsten carbide blade. It has good characteristics of wear resistance, hardness and fatigue strength, which makes it possible to apply for cutting hard materials. We investigated the correlation between the design variables and characteristics of the proposed block-type horn in terms of frequency isolations, displacement uniformity and gain. We proposed an optimal horn design by performing a multi-objective optimal design. We fabricated the optimal horn, and verified it by displacement measurement experiment. The results showed that the optimal model was well designed and was fabricated within 4% error. We also conducted an experiment of cutting a silicon composite material. The cutting force using ultrasonic vibration was reduced to 30% of the conventional cutting force and shows better quality of cutting surface. This research will contribute to expanding the application area of ultrasonic cutting machines to cut hard materials such as electronic components.

Author Contributions

Conceptualization, M.H.; Methodology, Y.C. and B.K.; Investigation, B.K.; Project administration, G.J.; Writing—original draft, M.H.; Writing—review & editing, M.H., Y.C. and G.J. All authors have read and agreed to the published version of the manuscript.

Funding

This research received no external funding.

Informed Consent Statement

Not applicable.

Data Availability Statement

No new data were created or analyzed in this study.

Conflicts of Interest

The authors declare no conflict of interest.

References

  1. Abdo, B.M.A.; El-Tamimi, A.; Nasr, E.A. Rotary ultrasonic machining of alumina ceramic: An experimental investigation of tool path and tool overlapping. Appl. Sci. 2020, 10, 1667. [Google Scholar] [CrossRef] [Green Version]
  2. Cao, W.; Zha, J.; Chen, Y. Cutting force prediction and experiment verification of paper honeycomb materials by ultrasonic vibration-assisted machining. Appl. Sci. 2020, 10, 4676. [Google Scholar] [CrossRef]
  3. Chu, N.-H.; Nguyen, V.-D.; Do, T.-V. Ultrasonic-assisted cutting: A beneficial application for temperature, torque reduction, and cutting ability improvement in deep drilling of Al-6061. Appl. Sci. 2018, 8, 1708. [Google Scholar] [CrossRef] [Green Version]
  4. Kim, T.-G.; Ahmad, S.F.; Yun, B.-J.; Kim, H.D. Cutting blade measurement of an ultrasonic cutting machine using multi-step detection. Appl. Sci. 2019, 9, 3338. [Google Scholar] [CrossRef] [Green Version]
  5. Mathieson, A.; Wallace, R.; Cleary, R.; Li, L.; Simpson, H.; Lucas, M. Ultrasonic needles for bone biopsy. IEEE Trans. Ultrason. Ferroelectr. Freq. Control 2017, 64, 433–440. [Google Scholar] [CrossRef] [Green Version]
  6. Harkness, P.; Lucas, M.; Cardoni, A. Maximization of the effective impulse delivered by a high-frequency/low- frequency planetary drill tool. IEEE Trans. Ultrason. Ferroelectr. Freq. Control 2011, 58, 2387–2396. [Google Scholar] [CrossRef] [PubMed]
  7. Kim, S.R.; Lee, J.H.; Yoo, C.D.; Song, J.-Y.; Lee, S.S. Design of highly uniform spool and bar horns for ultrasonic bonding. Ieee Trans. Ultrason. Ferroelectr. Freq. Control 2011, 58, 2194–2201. [Google Scholar] [PubMed]
  8. Hayashi, M.; Jin, M.; Thipprakmas, S.; Murakawa, M.; Hung, J.-C.; Tsai, Y.-C.; Hung, C.-H. Simulation of ultrasonic-vibration drawing using the finite element method (FEM). J. Mater. Process. Technol. 2003, 140, 30–35. [Google Scholar] [CrossRef]
  9. Sui, H.; Zhang, X.; Zhang, D.; Jiang, X.; Wu, R. Feasibility study of high-speed ultrasonic vibration cutting titanium alloy. J. Mater. Process. Technol. 2017, 247, 111–120. [Google Scholar] [CrossRef]
  10. Lucas, M.; Smith, A.C. Redesign of ultrasonic block horns for improved vibration performance. J. Vib. Acoust. 1997, 119, 410–414. [Google Scholar] [CrossRef]
  11. Zahn, S.; Schneider, Y.; Rohm, H. Ultrasonic cutting of foods: Effects of excitation magnitude and cutting velocity on the reduction of cutting work. Innov. Food Sci. Emerg. Technol. 2006, 7, 288–293. [Google Scholar] [CrossRef]
  12. Lucas, M.; MacBeath, A.; McCulloch, E.; Cardoni, A. A finite element model for ultrasonic cutting. Ultrasonics 2006, 44 (Suppl. 1), e503–e509. [Google Scholar] [CrossRef]
  13. Deibel, K.R.; Kaiser, F.; Zimmermann, R.; Meier, L.; Bolt, P.; Wegener, K. Longitudinal ultrasonic vibration assisted guillotining of stacked paper. Ultrasonics 2014, 54, 1585–1593. [Google Scholar] [CrossRef] [PubMed]
  14. Lucas, M.; Petzing, J.; Cardoni, A.; Smith, L.; McGeough, J. Design and characterisation of ultrasonic cutting tools. Cirp Ann. 2001, 50, 149–152. [Google Scholar] [CrossRef]
  15. Cardoni, A.; Lucas, M. Enhanced vibration performance of ultrasonic block horns. Ultrasonics 2002, 40, 365–369. [Google Scholar] [CrossRef]
  16. Nguyen, H.T.; Nguyen, H.D.; Uan, J.Y.; Wang, D.A. A nonrational B-spline profiled horn with high displacement amplification for ultrasonic welding. Ultrasonics 2014, 54, 2063–2071. [Google Scholar] [CrossRef]
  17. Roopa Rani, M.; Rudramoorthy, R. Computational modeling and experimental studies of the dynamic performance of ultrasonic horn profiles used in plastic welding. Ultrasonics 2013, 53, 763–772. [Google Scholar] [CrossRef] [PubMed]
  18. Amin, S.G.; Ahmed, M.H.M.; Youssef, H.A. Computer-aided design of acoustic horns for ultrasonic machining using finite-element analysis. J. Mater. Process. Technol. 1995, 55, 254–260. [Google Scholar] [CrossRef]
  19. Nad, M. Ultrasonic horn design for ultrasonic machining technologies. Appl. Comput. Mech. 2010, 4, 68–78. [Google Scholar]
  20. Jung, W.; Ra, J.; Park, K. Design optimization of ultrasonic horn for micro-pattern replication. Int. J. Precis. Eng. Manuf. 2012, 13, 2195–2201. [Google Scholar] [CrossRef]
  21. Choi, Y.-J.; Park, K.-H.; Hong, Y.-H.; Kim, K.-T.; Lee, S.-W.; Choi, H.-Z. Effect of ultrasonic vibration in grinding; horn design and experiment. Int. J. Precis. Eng. Manuf. 2013, 14, 1873–1879. [Google Scholar] [CrossRef]
  22. Wang, D.A.; Nguyen, H.D. A planar Bezier profiled horn for reducing penetration force in ultrasonic cutting. Ultrasonics 2014, 54, 375–384. [Google Scholar] [CrossRef]
  23. Wang, T.T.; Wu, J.; Ying, K.M.; Li, W.G.; Guo, H. An ultrasonic micro knife based on triangular silicon horn chip. Key Eng. Mater. 2015, 1363–1367. [Google Scholar] [CrossRef]
  24. Satpathy, M.P.; Sahoo, S.K. Experimental and numerical studies on ultrasonic welding of dissimilar metals. Int. J. Adv. Manuf. Technol. 2017, 93, 2531–2545. [Google Scholar] [CrossRef]
  25. Jagadish, R.A. Design and performance analysis of ultrasonic horn with a longitudinally changing rectangular cross section for USM using finite element analysis. J. Braz. Soc. Mech. Sci. Eng. 2018, 40, 359. [Google Scholar] [CrossRef]
  26. Wang, J.; Zhang, J.; Feng, P.; Guo, P. Experimental and theoretical investigation on critical cutting force in rotary ultrasonic drilling of brittle materials and composites. Int. J. Mech. Sci. 2018, 135, 555–564. [Google Scholar] [CrossRef]
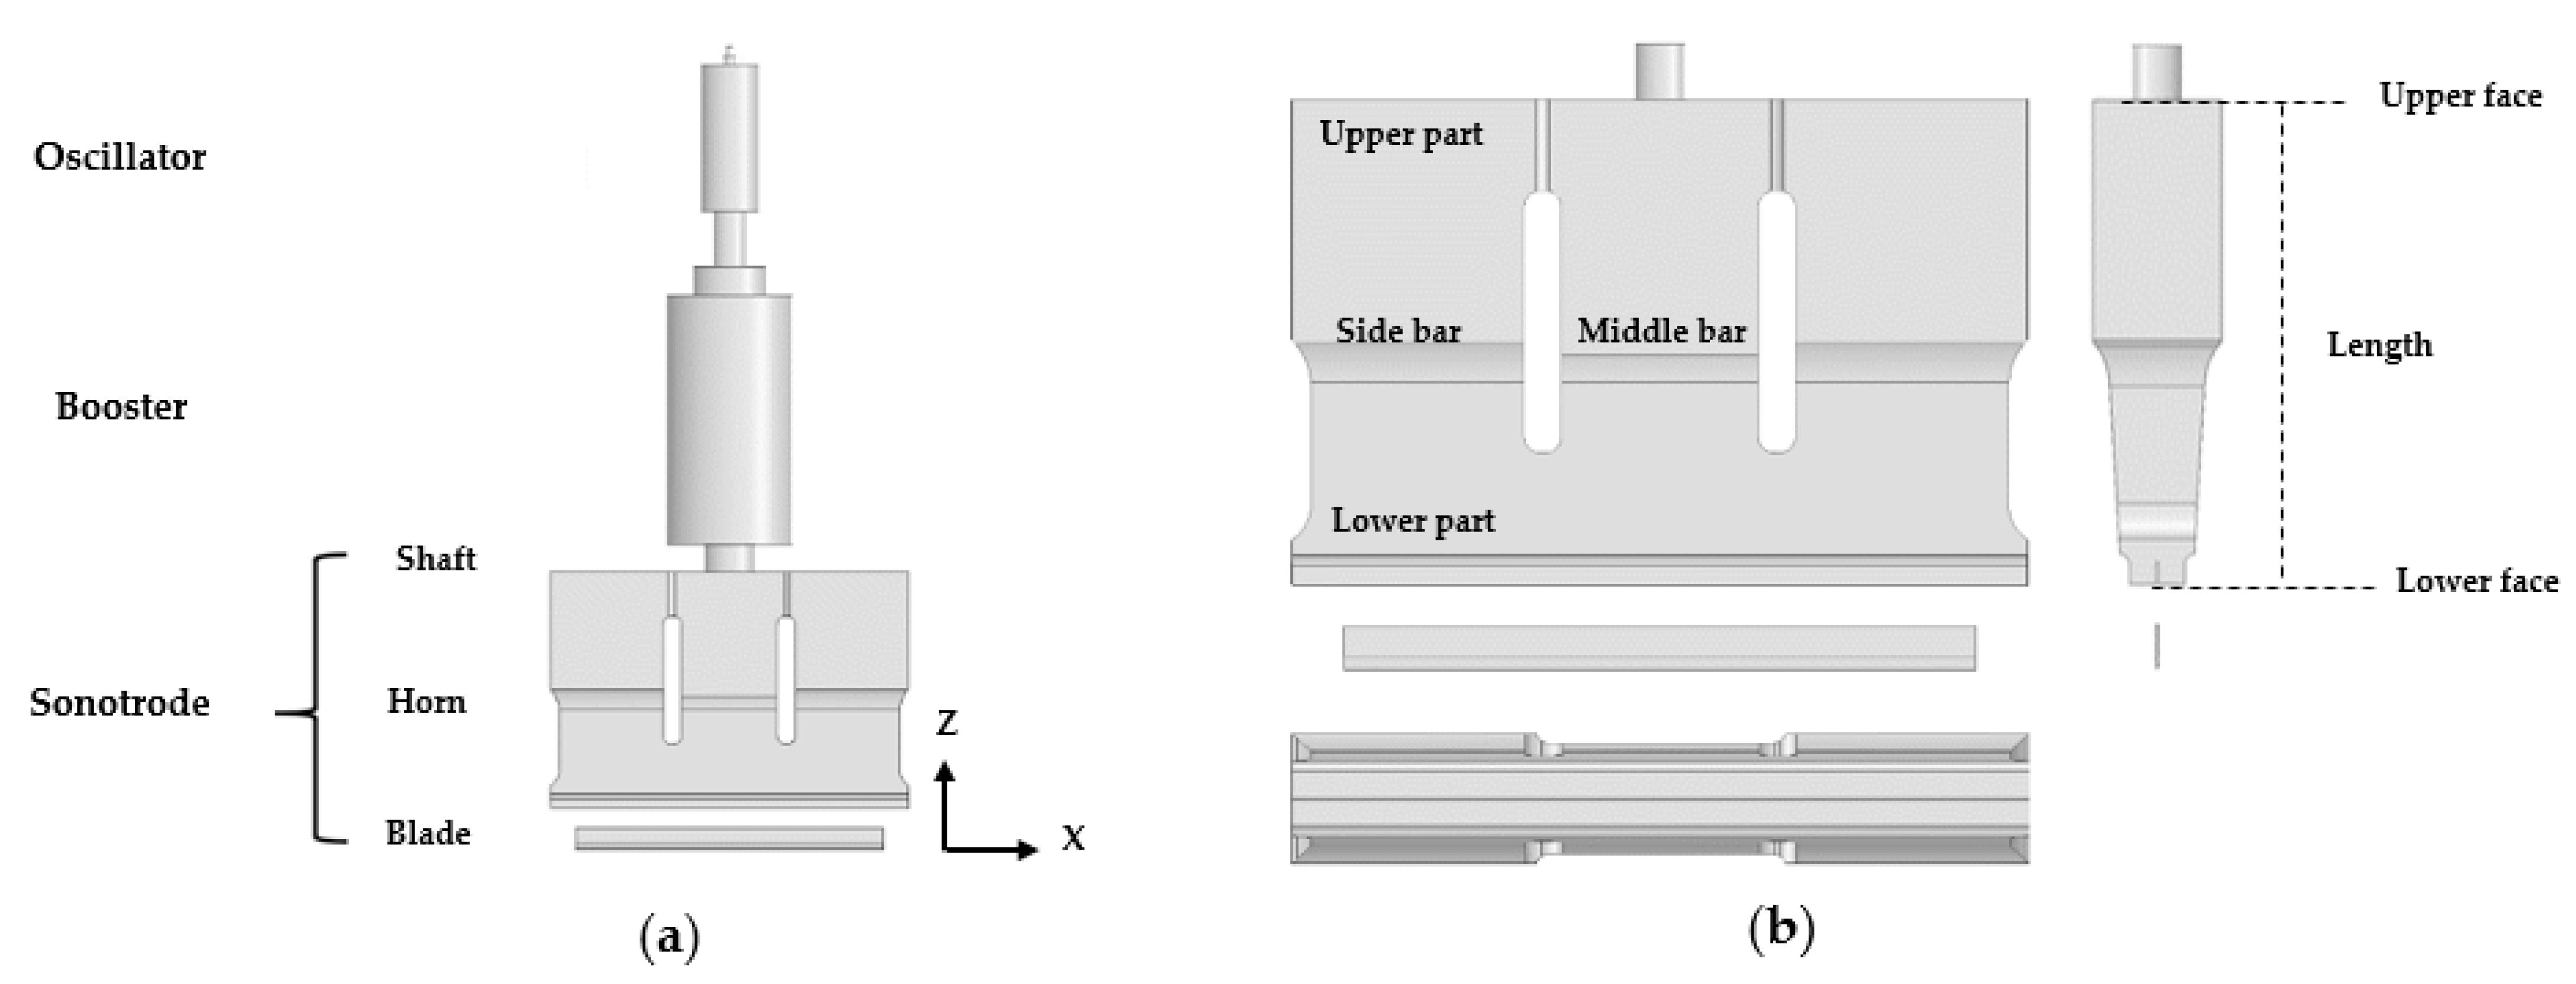
Figure 1. (a) A block-type ultrasonic cutting machine and (b) a sonotrode.
Applsci 11 01954 g001
Figure 2. Finite element model of the initial sonotrode.
Applsci 11 01954 g002
Figure 3. Mode shape and natural frequency of the (a) one lower mode (faxial−1), (b) axial mode (faxial) and (c) one higher mode (faxial+1).
Applsci 11 01954 g003
Figure 4. Simulated displacement at the lower face of the initial block-type horn model.
Applsci 11 01954 g004
Figure 5. Design parameters of a block-type ultrasonic cutting horn.
Applsci 11 01954 g005
Figure 6. The 1st order trend lines of the frequency isolations according to the variation of the design parameters of the ultrasonic cutting horn.
Applsci 11 01954 g006
Figure 7. The 1st order trend lines of the displacement uniformity and gain according to the variation of the design parameters of the ultrasonic cutting horn.
Applsci 11 01954 g007
Figure 8. Simulated output displacement of the optimal and initial models at the horn lower face.
Applsci 11 01954 g008
Figure 9. (a) Experimental set-up for a displacement measurement experiment and (b) fabricated optimal model and measuring points.
Applsci 11 01954 g009
Figure 10. Simulated and experimental output displacement of the optimal model.
Applsci 11 01954 g010
Figure 11. Cutting experiment set-up.
Applsci 11 01954 g011
Figure 12. SEM images of cutting surface (a) without the application of ultrasonic vibration and (b) with the application of ultrasonic vibration.
Applsci 11 01954 g012
Table 1. Material properties of a sonotrode.
ComponentMaterialYoung’s Modulus [GPa]Density [kg/m3]Poisson’s Ratio
HornAl707571.928020.34
BladeWC50013,8340.2
ShaftSCM43520562870.29
Table 2. Lower and upper limits of the design variables.
Parameter NameSymbolLower BoundaryUpper Boundary
x-axis position of slot [mm]spx18.423.4
z-axis position of slot [mm]spz42.049.0
Width [mm]w61.564.5
Thickness of side part [mm]thsid21.525.0
Thickness of middle part [mm]thmid18.019.5
Thickness of lower part [mm]thlow16.016.5
Table 3. Initial and optimal values of design variables.
Parameter NameSymbolInitial ModelOptimal Model
x-axis position of slot [mm]spx23.421.3
z-axis position of slot [mm]spz42.043.4
Width [mm]w64.563.5
Thickness of side part [mm]thsid22.022.7
Thickness of middle part [mm]thmid19.019.5
Thickness of lower part [mm]thlow16.016
Table 4. Simulated output values of initial and optimal models.
Parameter NameInitial ModelOptimal Model
Displacement [μm]Maximum16.8017.55
Minimum13.7614.76
Axial mode frequency [Hz]28,520 28,478
One lower mode frequency [Hz]26,932 27,289
One higher mode frequency [Hz]29,366 29,659
1st frequency isolation [Hz]1588 1189
2nd frequency isolation [Hz]846 1181
Table 5. Simulated and experimental output displacement of the optimal model.
Displacement [μm]Axial Mode Frequency [Hz]
MaximumMinimum
Simulation17.5514.7628,478
Experiment17.5615.3028,480
Difference [%]0.063.520.01
Table 6. Cutting force measured in the cutting experiment.
Test #Cutting Force [N]
Ultrasonic CuttingConventional Cutting
176.3235.6
277.9240.1
382.4228.9
475.5232.5
576.9234.8
678.4239.4
780.4229.8
881.2234.5
976.8231.2
1078.8233.0
average78.5234.0
Publisher’s Note: MDPI stays neutral with regard to jurisdictional claims in published maps and institutional affiliations.