1. Introduction
Finding lost or injured people in the wild is, unfortunately, a frequent need that is not limited to particular regions or countries [
1]. The registered number of cases may be higher during some seasons (for example, summer in touristic areas) and in certain terrain types, but it is not possible to exclude any scenario completely. Search and rescue (SAR) missions often require a large number of engaged searchers, dogs and technical support (sea and ground vehicles, planes, helicopters, etc.). Moreover, a large percentage of missions last for more than one day, which makes these missions very expensive and logistically demanding. The speed and precision of the search is essential because every additional hour needed to search for a person decreases their probability of survival and increases the search area [
2]. Furthermore, a longer-lasting mission is a more expensive mission. Therefore, fast and appropriate mission planning and monitoring of mission development are critical for success. The standard tool for mission leaders is Geographic Information System (GIS). Some very good commercial GIS solutions exist, such as ArcGIS [
3], as well as open-source solutions such as the QGIS Open Source Geographic Information System licensed under the GNU General Public License [
4], which are used as tools for visualization of terrain, mission planning and monitoring.
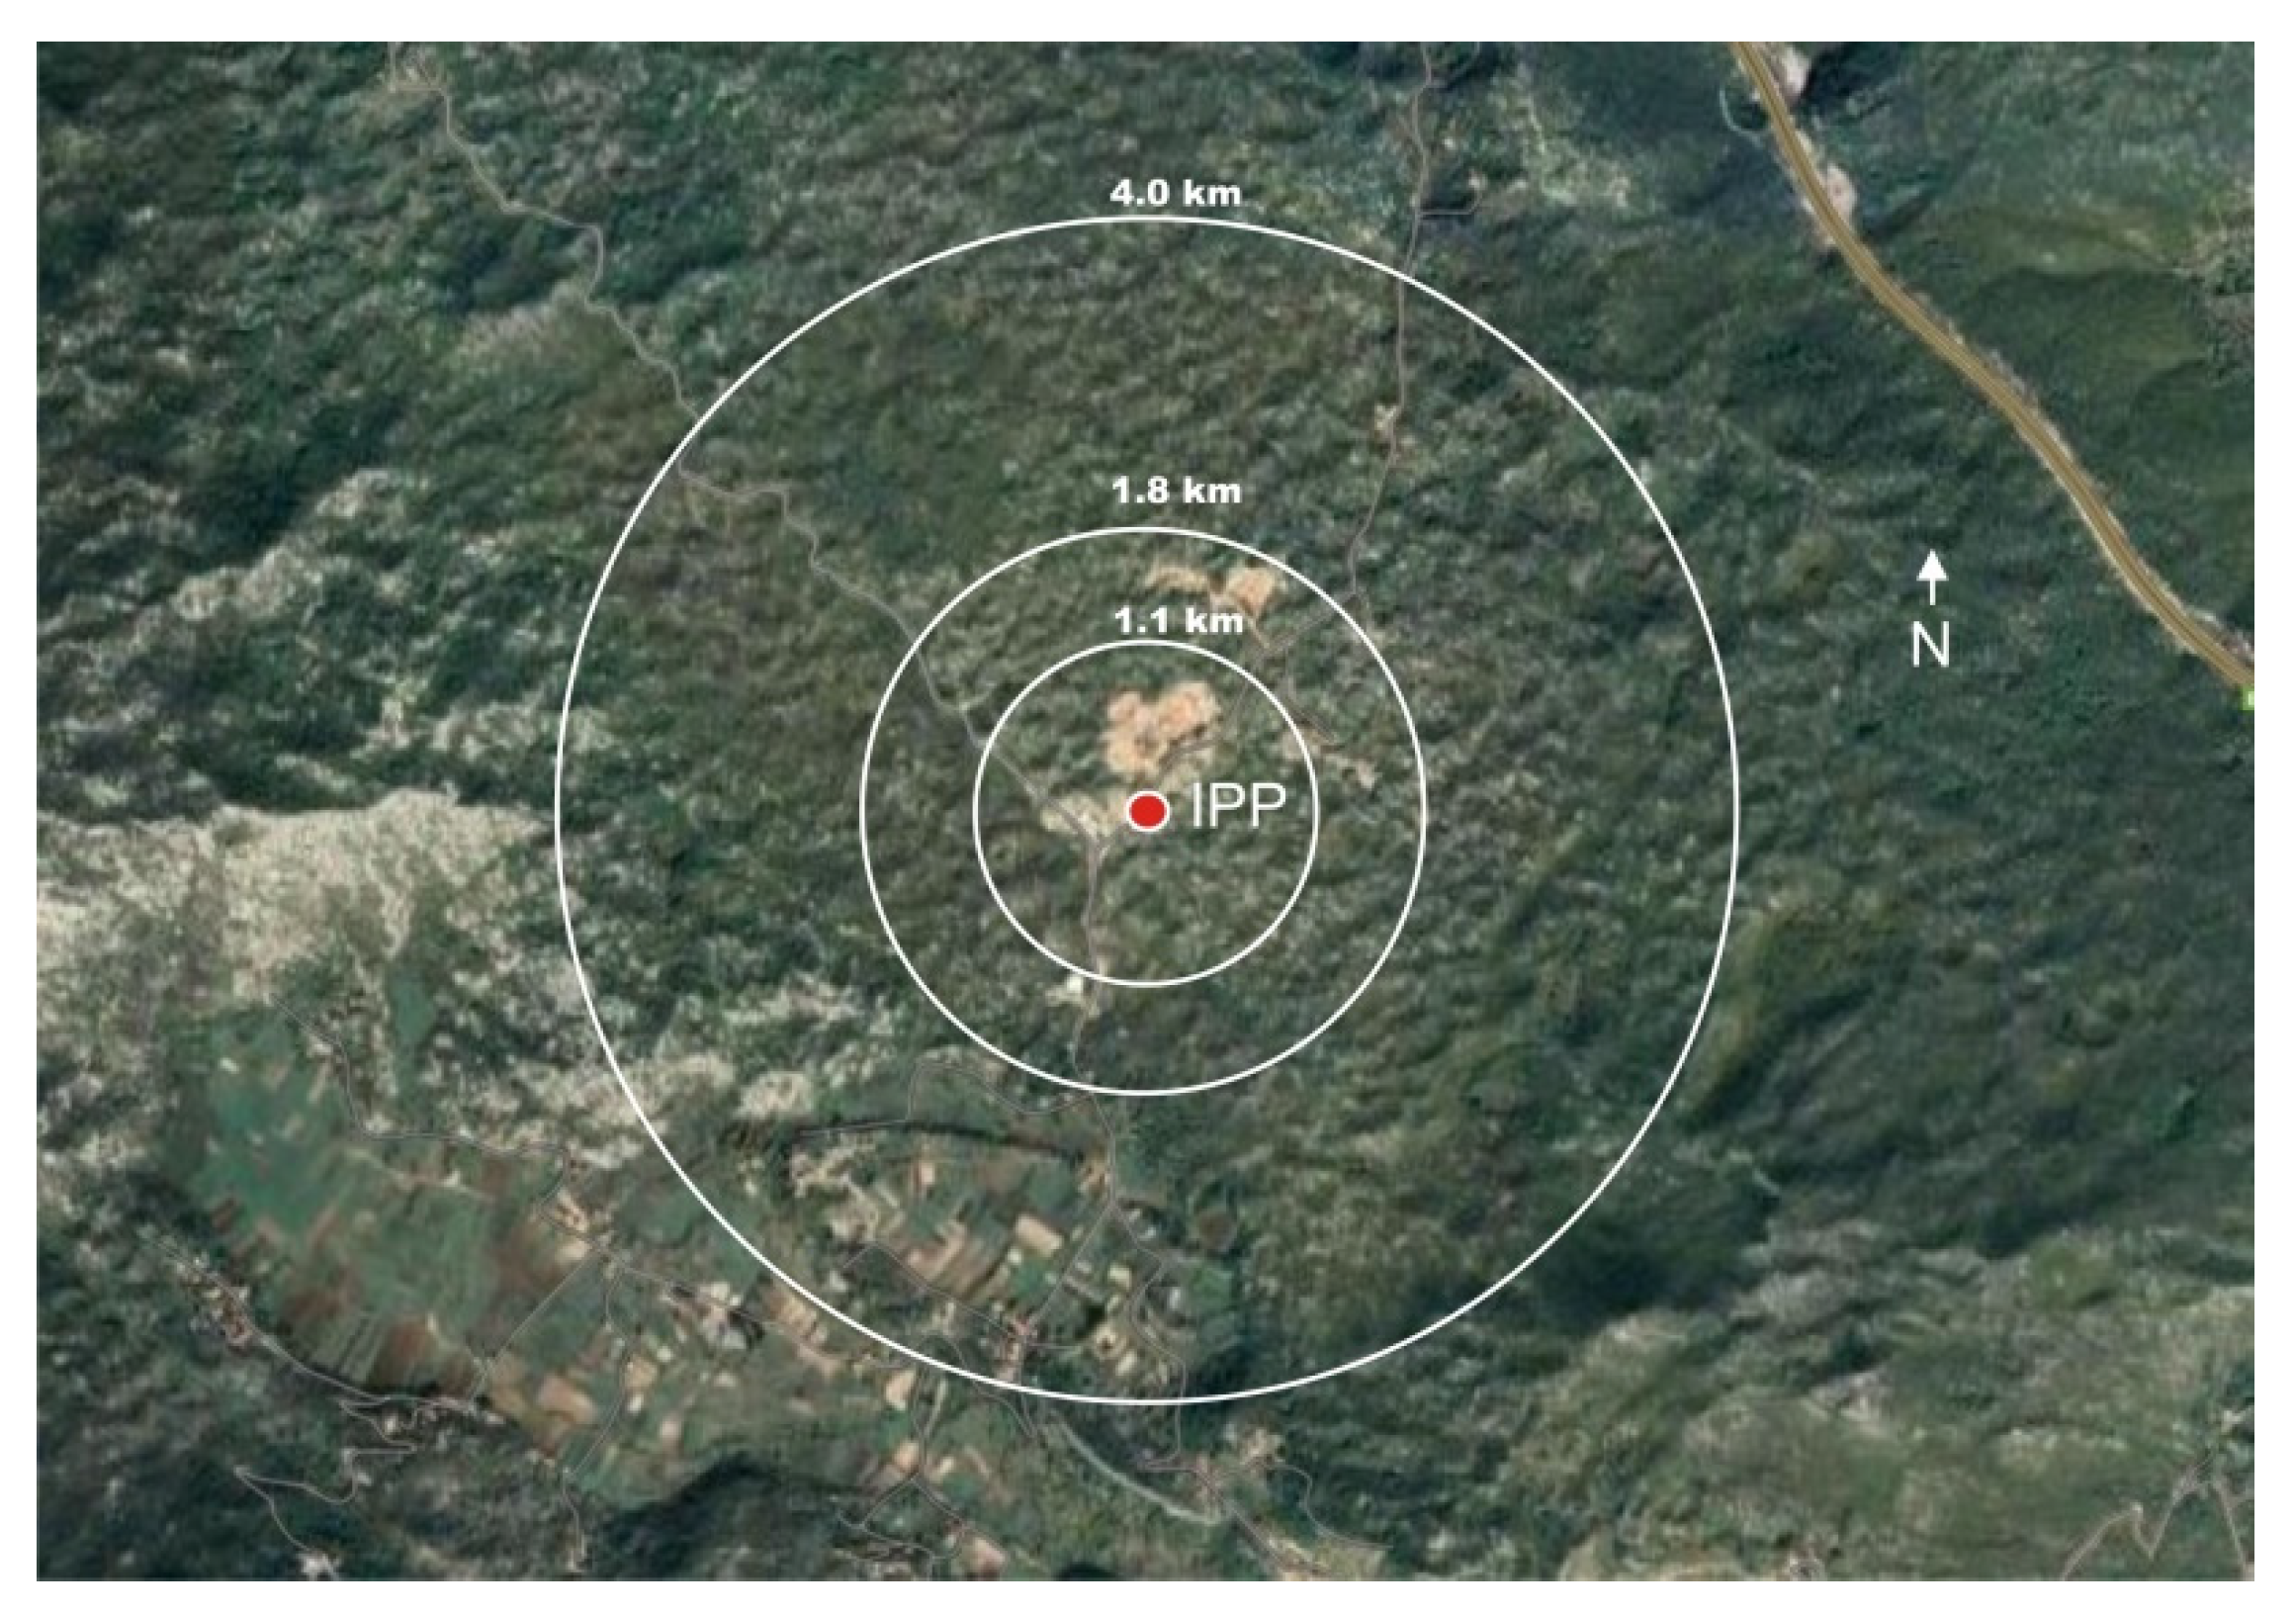
Planning usually starts with determining the initial planning point (IPP). The usual position of the IPP is the Point Last Seen (PLS), the point where a reliable witness saw the subject for the last time. Alternatively, the IPP can be a location where we are relatively certain the subject was recently located. In that case, this point is called the Last Known Position (LKP) [
2]. The next step in planning is defining the area around the IPP that will be observed [
5,
6]. This area is usually defined using statistical data gathered from several search and rescue missions and stored in a unified database—the International Search and Rescue Incident Database (ISRID). Based on the type of person that has been lost, summary statistics are available for the Euclidean distance from IPP, the track offset, the dispersion angle, find location, scenario, mobility and survivability [
7].
An area definition based on Euclidean distance from the IPP (the so-called “Ring” approach) is not the only way to define the starting area that will be investigated [
5], but it is probably the simplest, and therefore the most commonly used, approach (
Figure 1).
It is worth noticing that estimation of LKP can be based on a mobile phone positioning approach [
8,
9,
10]. A mobile phone’s position can be derived from the measurement of its signals. The most important measurements are propagation time, angle of arrival and carrier phase. Each measurement defines a locus on which the mobile phone must lie. The point at which the loci from multiple measurements intersect defines the position. Use of a passive positioning method to locate 4G mobile phones in post-disaster scenarios by capturing the random access preamble was proposed in [
11]. Furthermore, a smartphone can be equipped with an application that, without a signal, emits a Wi-Fi signal which, in turn, acts as a distress beacon over a distance of several kilometers [
12]. However, all approaches based on the positioning of a mobile phone signal have some limitations. First, network signals should be available at the search area, which is quite often a problem in non-urban areas (or an application should be pre-installed, such as in [
12]). The second problem is related to the fact that a lost person should have a mobile phone with still working batteries (and searchers should know that phone number). The third problem might be the time needed for getting permissions to use data of the network provider to reconstruct the last known approximate location of the mobile phone. Therefore, the most likely scenario is a visual search of the terrain by rescuers or drones.
Around the IPP, segments with similar types of terrain are defined and each is divided into areas that can be searched by some assigned resources (searchers, dogs, drones, etc.). As already stated, the GIS software is the basis for visualizing these areas and can also be used for situational awareness and basic incident management tasks [
13].
The available online maps used in GIS may be quite old and sometimes misleading. Changes can be significant when comparing maps taken during different times of the year. Moreover, there is always the possibility that some new roads, houses or other infrastructures have been built. These facts affect the planning and search priorities. To provide the best possible input for the planners and search teams, up-to-date information about the terrain is of essential importance. This is the first reason for introducing and proposing an approach that will incorporate aerial images of the area of interest taken at the time of the mission. Another reason is that these images (if taken with sufficient resolution) can be used for the automatic detection of humans [
14,
15]. In [
16], a fixed-wing unmanned aerial vehicle (UAV) with a DLR Modular Airborne Camera System (MACS) and Wi-Fi-based 10 Mbit/s data downlink was tested for real-time mapping. The authors reported a typical operation of the overall system at a height of 200 m above the ground and at a speed of 80 km/h with a frame rate of 2 Hz. For data downlink, a civil Wi-Fi-based radio link with pointing antennas on both sides was used. Image data provided by the real-time processing tool chain were transmitted to a ground control station 80 km away. In this research, the authors showed that the redundancy optimized image data enable seamless real-time mapping of the recorded area at an average data link rate of about 1–10 Mbit/s.
Satellite images acquired on the day of the mission are generally not available to rescuers. Therefore, the use of fixed-wing drones, due to their longer autonomy and higher cruising speed compared to rotary wing copters, could be a solution for land surveying and searching for lost or injured persons. The goal of providing reliable throughput for transfer of high-resolution images from UAV to GS can be tackled from two perspectives: hardware and software. Hardware perspective comprises improvements in datalinks and antenna systems while software mostly focuses on image compression algorithms. Compact multi-frequency antennas have received substantial attention in recent years [
17,
18]. They offer the additional benefit of being easily mounted on a small UAV. Wavelet-based antenna systems as well as fractal antennas show promise of providing the small antennas and unifying design, analysis, and optimization. Recent progress in the study of fractal antennas [
19,
20,
21] suggests some attractive solutions for using a single small antenna operating in several frequency bands. Fractal-wavelet modelling has prominent application in image compression which allow significant reductions in amount of data that must be transmitted from UAV [
22,
23,
24,
25,
26,
27].
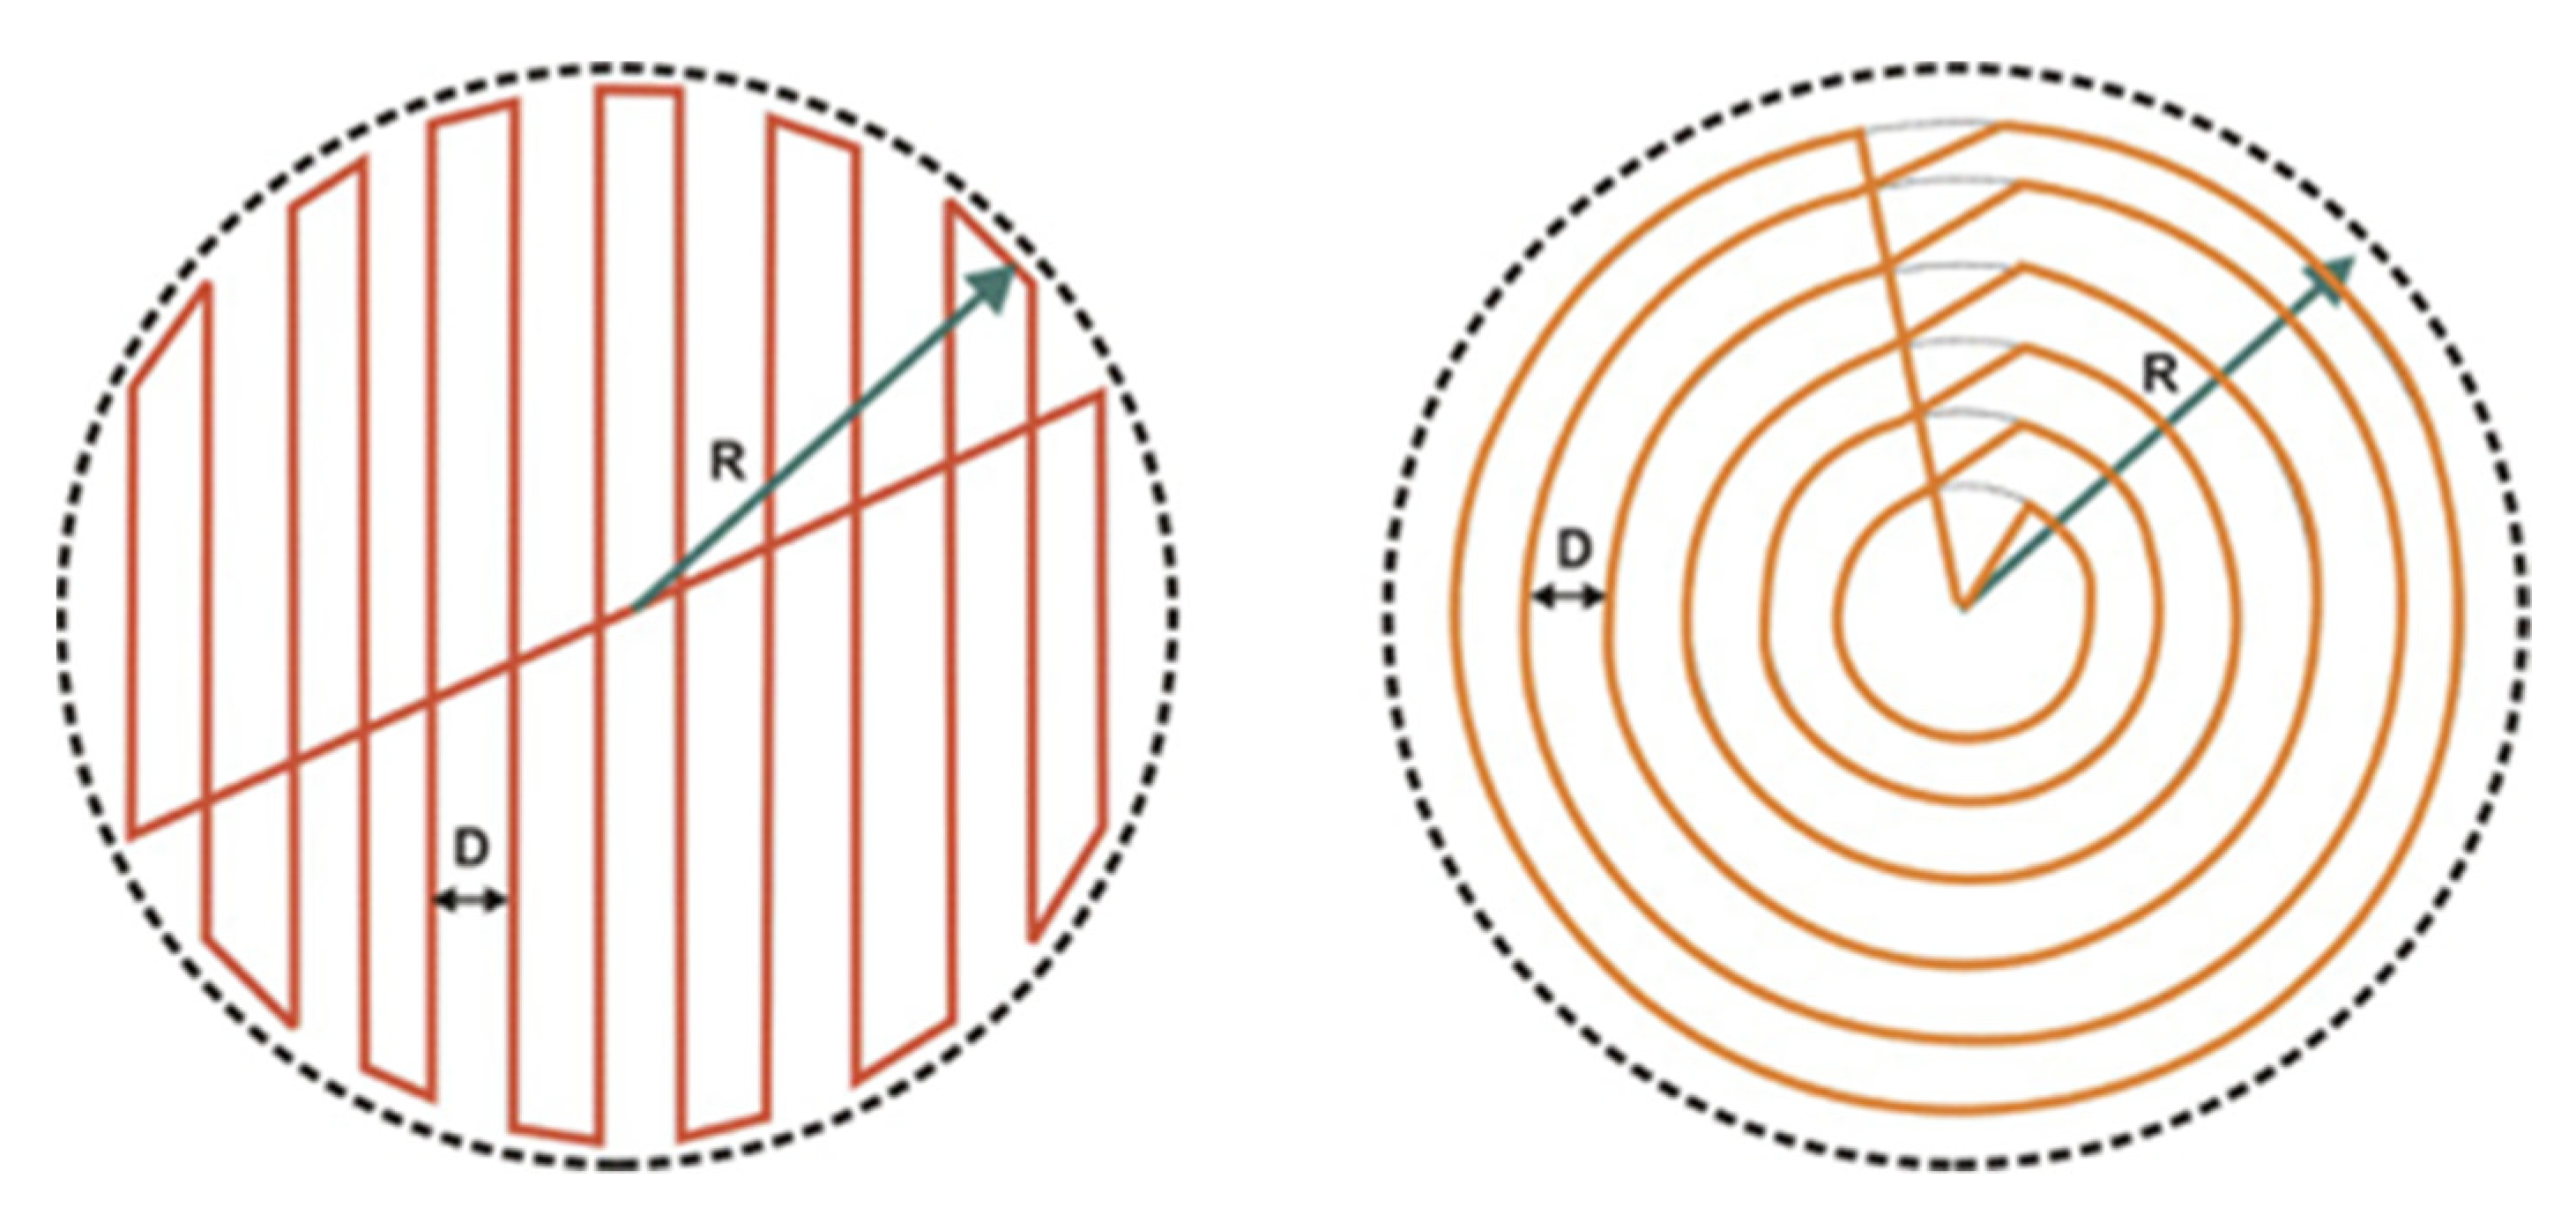
Different flight plans can be adopted depending on the search area (
Figure 2). An actual search mission usually starts from the IPP and then spreads outwards towards the defined statistical limits (based on the ISRID database information). Because of this fact, in addition to standard flight plans, a circular flight plan has been proposed. Standard handbooks for rescuers [
2] use statistical search areas with up to a 5-km radius (distance from the IPP), although that distance may be shorter.
A comparison of the two paths is given in
Table 1. An approximate estimation of the UAV flight length (only 2D) for a circular flight plan is given in Equation (1):
where
D is the difference between two successive trajectory radii (
Figure 2) and n is the number of circles around the IPP (
n = (
R −
D/2)/
D). In the case of steep terrain, UAV flight altitudes might change during the mission, so flight length calculation is more complicated [
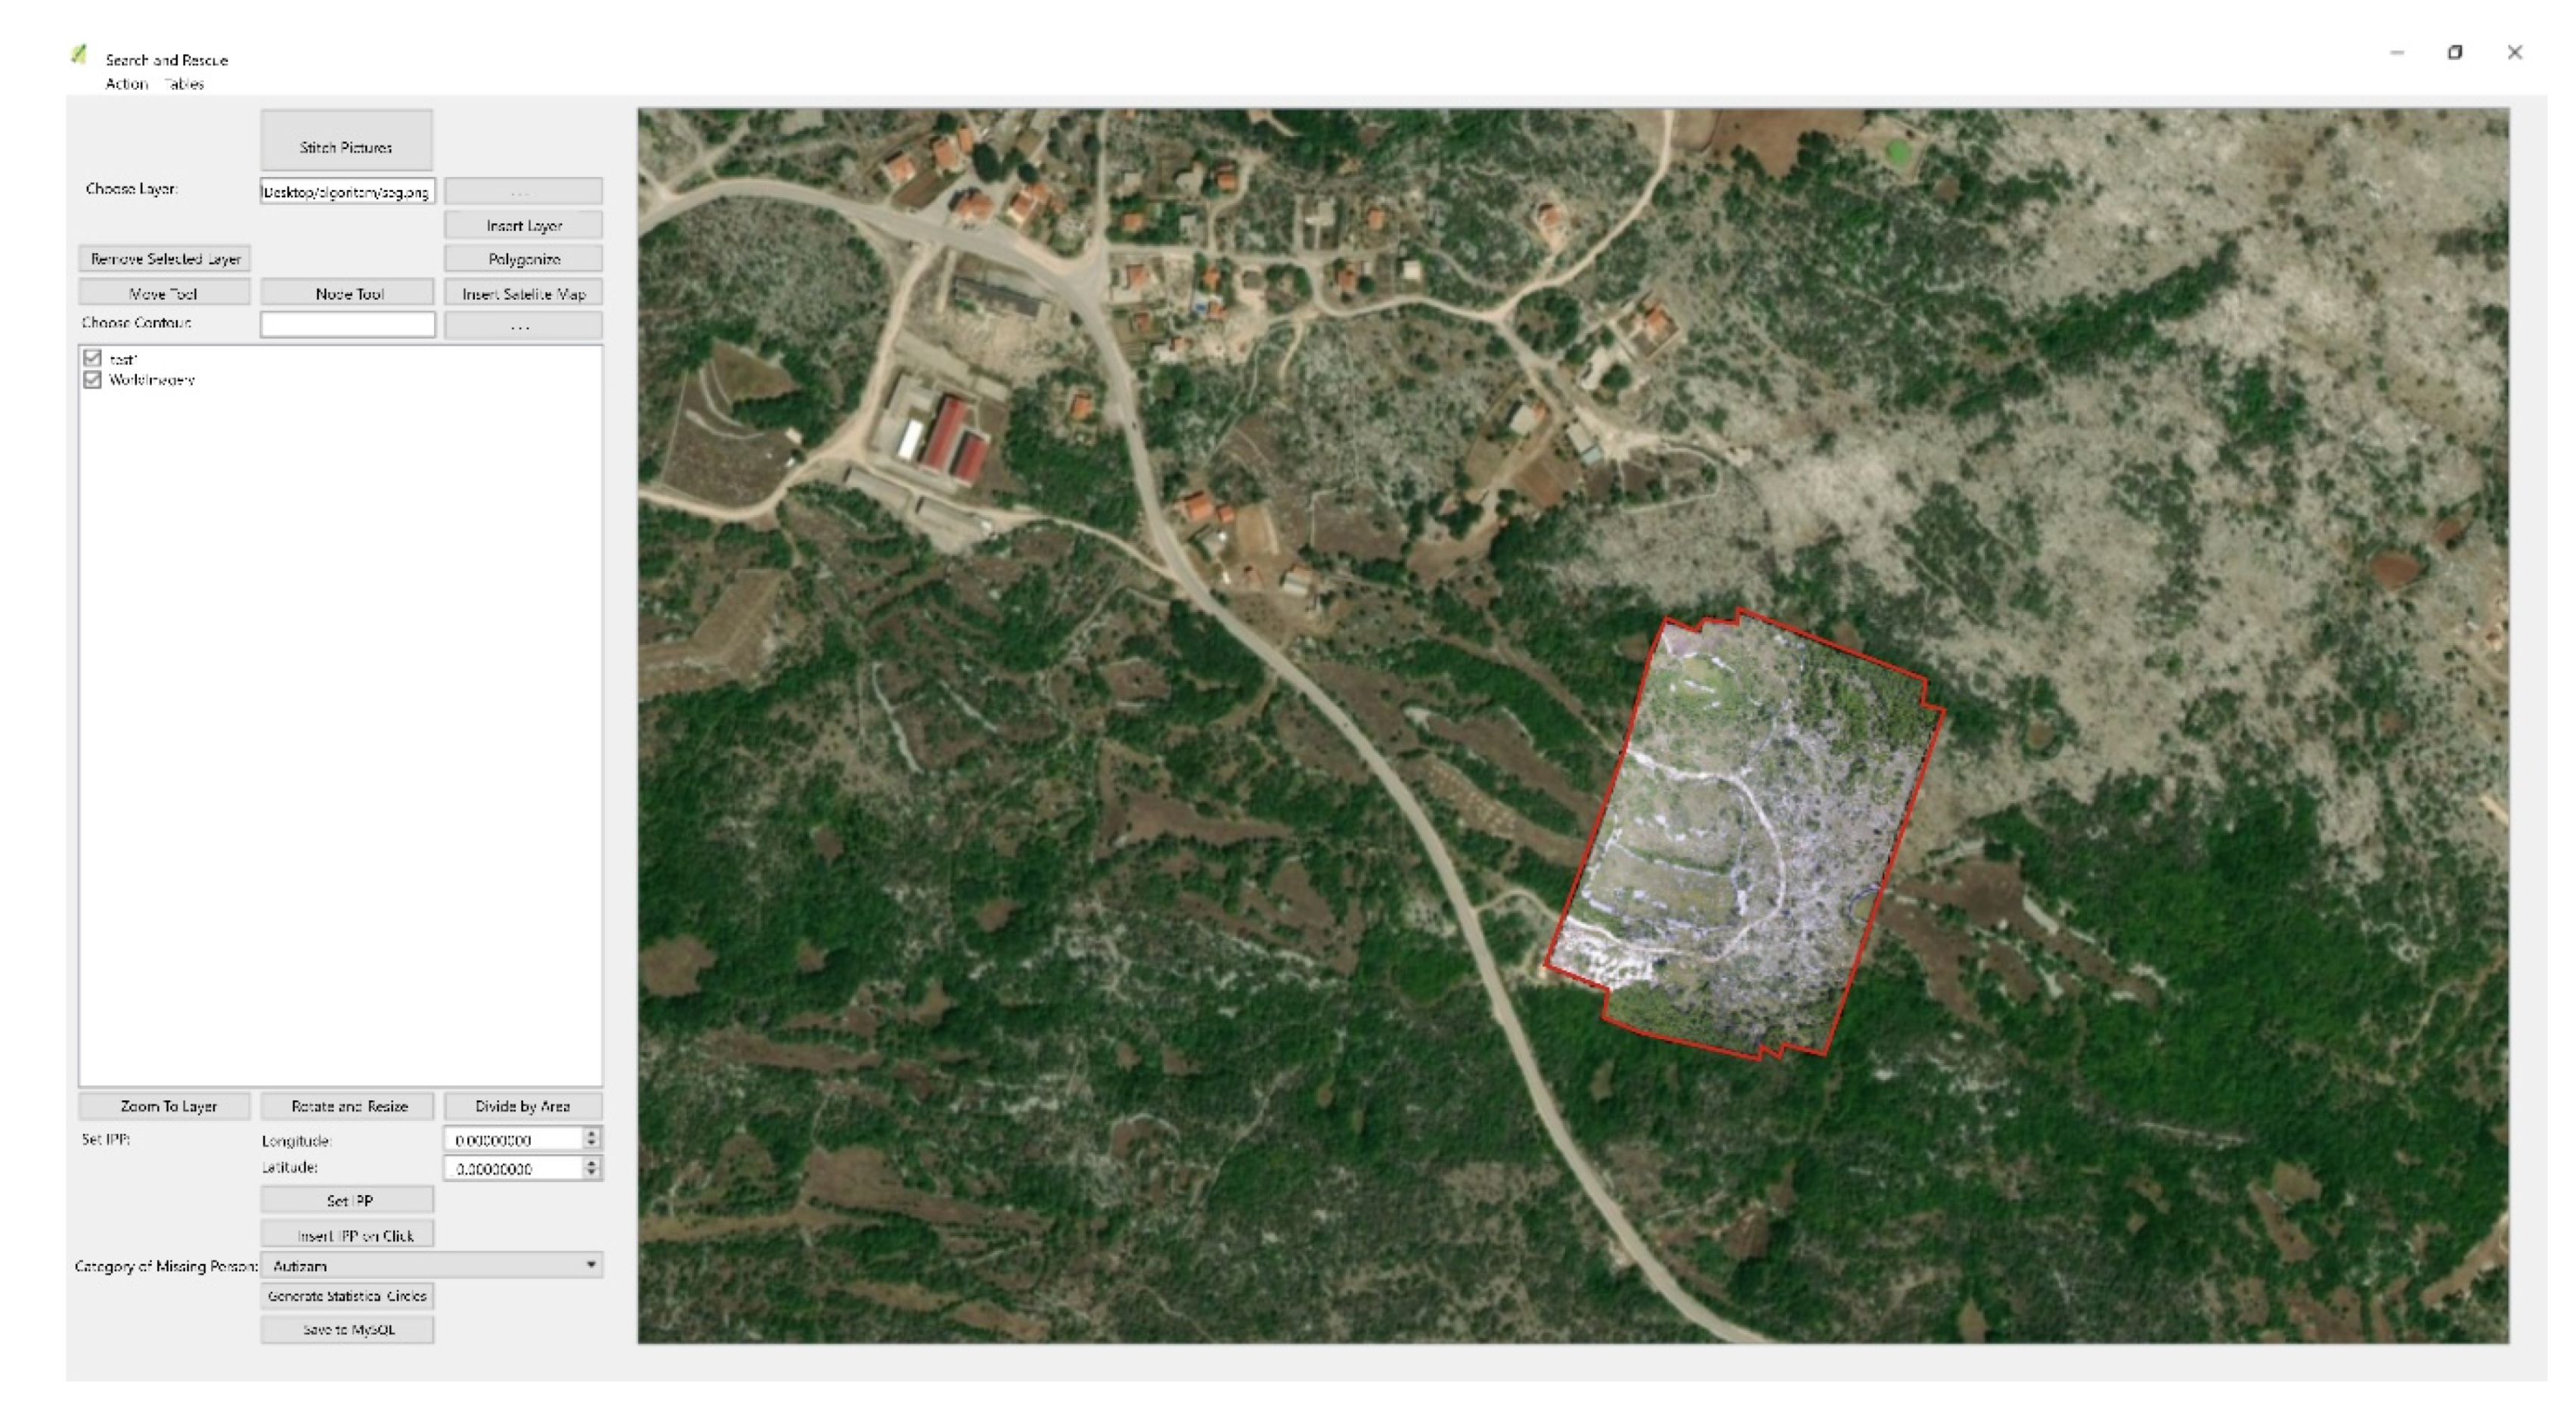
28]. Depending on the available camera sensor resolution, flight altitude and the UAV velocity, the time needed to acquire images of the area of interest can be calculated. This aspect is not the focus of the current paper, but for the desired resolution (~5 cm/pixel) and flight altitude (~200 m), the flight time needed to survey a search area can take a few hours (around 200 min for a 3.8-km search radius from the IPP for v = 20 m/s). Since time is a critical factor for a search and rescue mission, the real-time transfer of images acquired from the UAV to the ground station (GS) is necessary. The acquired images can then be used to update maps (
Figure 3) with Structure from Motion software, such as Agisoft [
29], Pix4D [
30] and ArcGIS Drone2Map [
31] (or other approaches to 2D image stitching), and imported into the GIS as a new layer [
32].
Thus, in this paper, we propose a system based on a commercial data link for the real-time UAV-GS transfer of high-resolution images in non-urban areas. A set of tests were designed and carried out to confirm the viability of the proposed solution. Our solution provides new data for the GIS platform to visualize and plan a search, even in areas that are not covered with Global System for Mobile Communications (GSM) signals or other means of data transfer.
The paper is organized as follows.
Section 2 provides a review of the relevant literature and methods used in this type of problem, while
Section 3 describes the conducted tests for all used methods.
Section 4 contains all the experimental results together with a detailed analysis, and
Section 5 concludes the paper and discusses future intentions for research, as well as potential improvements.
2. Materials and Methods
Although approaches focused on reducing the amount of data transferred from a UAV to a GS using image compression methods [
27] and compressive sensing [
33,
34] exist, they usually demand rather significant computing power on the UAV to provide fast reduction (compression). More importantly, these data reduction techniques still (to some degree) decrease image quality and, therefore, the results of the image analysis. Thus, the goal of this research was to investigate solutions for transferring high-resolution images from a camera mounted on a UAV to the ground at a rate that will satisfy the demand for real-time coverage of the surveilled area.
2.1. Data Rate Estimation
For an SAR application, the complete system (UAV with sensors and a communication module) should be portable and not too expensive. Otherwise, it will be unlikely that an average (although trained) rescuer will use it. Requirements for the data rate between the UAV and GS in a mission scenario can be calculated using the following procedure:
Determine the necessary ground sampling distance (GSD) (in cm/pixel);
For the chosen camera sensor with m x n pixels, calculate the area covered with one orthophoto image and the dimensions in meters (Equation (2)):
where area width is single image footprint perpendicular to the flight direction and area height is single image footprint in the flight direction.
- 3.
Depending on the UAV camera sensor and applied lenses (field of view (FOV)), calculate the necessary UAV flight altitude:
where
F is the focal length of the camera (in millimeters) and
SW is the camera sensor width (in millimeters).
- 4.
Calculate the time needed between successive images taken by the UAV camera using Equation (4):
where
v is the UAV velocity in m/s,
s′ is the distance (in meters) travelled by the UAV between two successive images and
io is the image overlap for two successive images (in percent).
Note that, opposite to common approaches, in Equation (3), area height is used instead of area width. This is done because we rotated images by 90°, so we have more available image pixels in the flight direction and, therefore, more available time between successive images acquired by the UAV camera. This can be illustrated with the following example.
Example: For a 20-MP camera, GSD 4 cm/pix and io = 70%; m = 3632; n = 5456; area height = 218.24 m; area width = 145.28 m; ∆t = 6.54 s (v = 10 m/s).
Since images are compressed in the Joint Photographic Experts Group (JPEG) format, the expected size of a 20-MP image is approximately 8–9 MB. This means that the required data rate per second is between 2.7 and 3 MB/s for a UAV velocity of v = 20 m/s. If the UAV velocity is 10 m/s, the required data rate per second is between 1.35 and 1.5 MB/s.
2.2. Data Link
For the intended type of UAV application, there are several possible communication solutions [
35]. The IEEE 802.11 standard is a low-cost solution operating in the 2.4 to 5 GHz range. Another solution is cellular 3/4G communication; however, since SAR missions target campaigns on non-urban and possibly mountainous terrain, it is likely that a wireless signal will not be available. Solutions based on analogue signal communications, however, have problems with poor image quality and low resolution. Satellite links are popular solutions for larger fixed-wing aircraft and UAVs but are not practical for smaller UAVs due to their equipment size [
36], antenna design and energy efficiency [
37]. Moreover, the price of satellite link systems is an issue. There are a few challenges in transmitting data through an open-air interface [
38,
39]. Interfering signals that occur in the same frequency band as the wireless video link will act as in-band noise (for example, another UAV in the area, a nearby Wi-Fi hotspot or a mobile phone). Reflection, scattering, diffraction and shadowing effects together with a direct or visual line-of-sight (VLOS) path are known as multipath propagation in communications and result in fading of the received signal due to constructive and deconstructive superposition [
40]. Multiple paths and reflections can exist, especially in cluttered or urban environments. Multipath signals cancel the direct propagation path. Cancelling occurs because of the phase shift associated with different propagation delays. Lastly, mobility is an imperative issue that needs to be addressed in SAR UAVs. Along with robustness, keeping the throughput intact while a UAV is moving is also important. Moreover, the mobility requirements of data links are high for fixed-wing aircrafts compared to rotary quadcopters.
As already described in the previous section, the expected maximal distance of the UAV to the IPP (and the GS in its vicinity) is around 5 km. Therefore, long-range solutions for communications at distances over 50 km [
41,
42] will not be discussed here. It should be mentioned that these kinds of solutions are generally much more expensive than others. Therefore, the important requirement of keeping the system costs within a reasonable price range would be very difficult or impossible to satisfy. Future 5G and beyond 5G systems are also not likely to be available in typical non-urban SAR environments [
43].
Finally, after considering available solutions on the market such as those in [
44,
45,
46,
47,
48], a Microhard pMDDL2450 data link [
49] (
Table 2) that has the required features while being in the acceptable price range was chosen for testing and inclusion as part of a UAV communication system for SAR missions.
To determine the viability of the proposed data link, a simple link power budget calculation can be performed (Equation (5)). This calculation sums all the gains and losses from the UAV transmitter, cables and connectors, as well as the free space to the GS receiver [
50].
where
PRX is the received power,
PTX is the transmitter power output,
GATX is the transmitter antenna gain,
LTX is the losses from the transmitter (cable, connectors, etc.),
LFS is the free space path loss,
LM is the miscellaneous losses (fade margin, polarization misalignment, etc.),
GARX is the receiver antenna gain and
LRX is the losses from the receiver (cable, connectors, etc.).
The free space path loss is calculated using the following expression [
51]:
where
d is the distance between antennas in kilometers and
f is the frequency in megahertz.
The used data for power budget link calculation are given in
Table 3. For example, if
d = 5 km and
f = 2400 MHz, the calculation using Equation (6) results in
LFS (dB) = 114.0236 dB and
PRX (dBm) = −68.5236 (dBm). Since the specified receiver sensitivity is 98 dBm, the link margin, (−98) – (−68.5236), is about −30 dB, which is sufficient for use under adverse weather conditions.
2.3. System Architecture
The goal of this research was to test the chosen data link in a real-life scenario with a UAV and to determine if this hardware can be used for the real-time streaming of high-resolution aerial images. Flight beyond line of sight (BLOS) was not tested. Although this is a likely scenario when searching for people in a mountainous terrain, a simple scenario for testing the data rate with a line of sight between the UAV and antenna was considered to be a necessary step towards presenting a solution that would not have such limitations (
Figure 4). Possible architecture types for BLOS include multi-hop communication and multiple unmanned aerial vehicles [
52,
53,
54,
55,
56].
Another possibility that could be considered for more flat terrain is using a tethered UAV equipped with a data link modem at a location close to the IPP [
57]. Tethered UAVs can be lifted up to 100 m altitude and maintain the position for an unlimited time since it is powered with an energy cable from the supply on the ground.
Other than the Microhard pMDDL2450 data link, the UAV was equipped with a 2× omnidirectional 2-dbi antenna, and the antenna on the GS side was a directed panel 14-dbi MIMO 2.4-GHz antenna (
Figure 5). A directional panel was used because directional antennas provide a much better performance in terms of communication range than omnidirectional antennas since they can concentrate radio signals in desired directions, enhancing the range of our end-to-end communication [
58,
59]. The gain pattern chart of the directional antenna [
60] is given in
Figure 6.
3. Results
As explained in the previous section, the system is used for the transmission of high-resolution images from a UAV to a ground station. It was necessary to test the real data rates of the used data links for various distances between the transmitter and receiver.
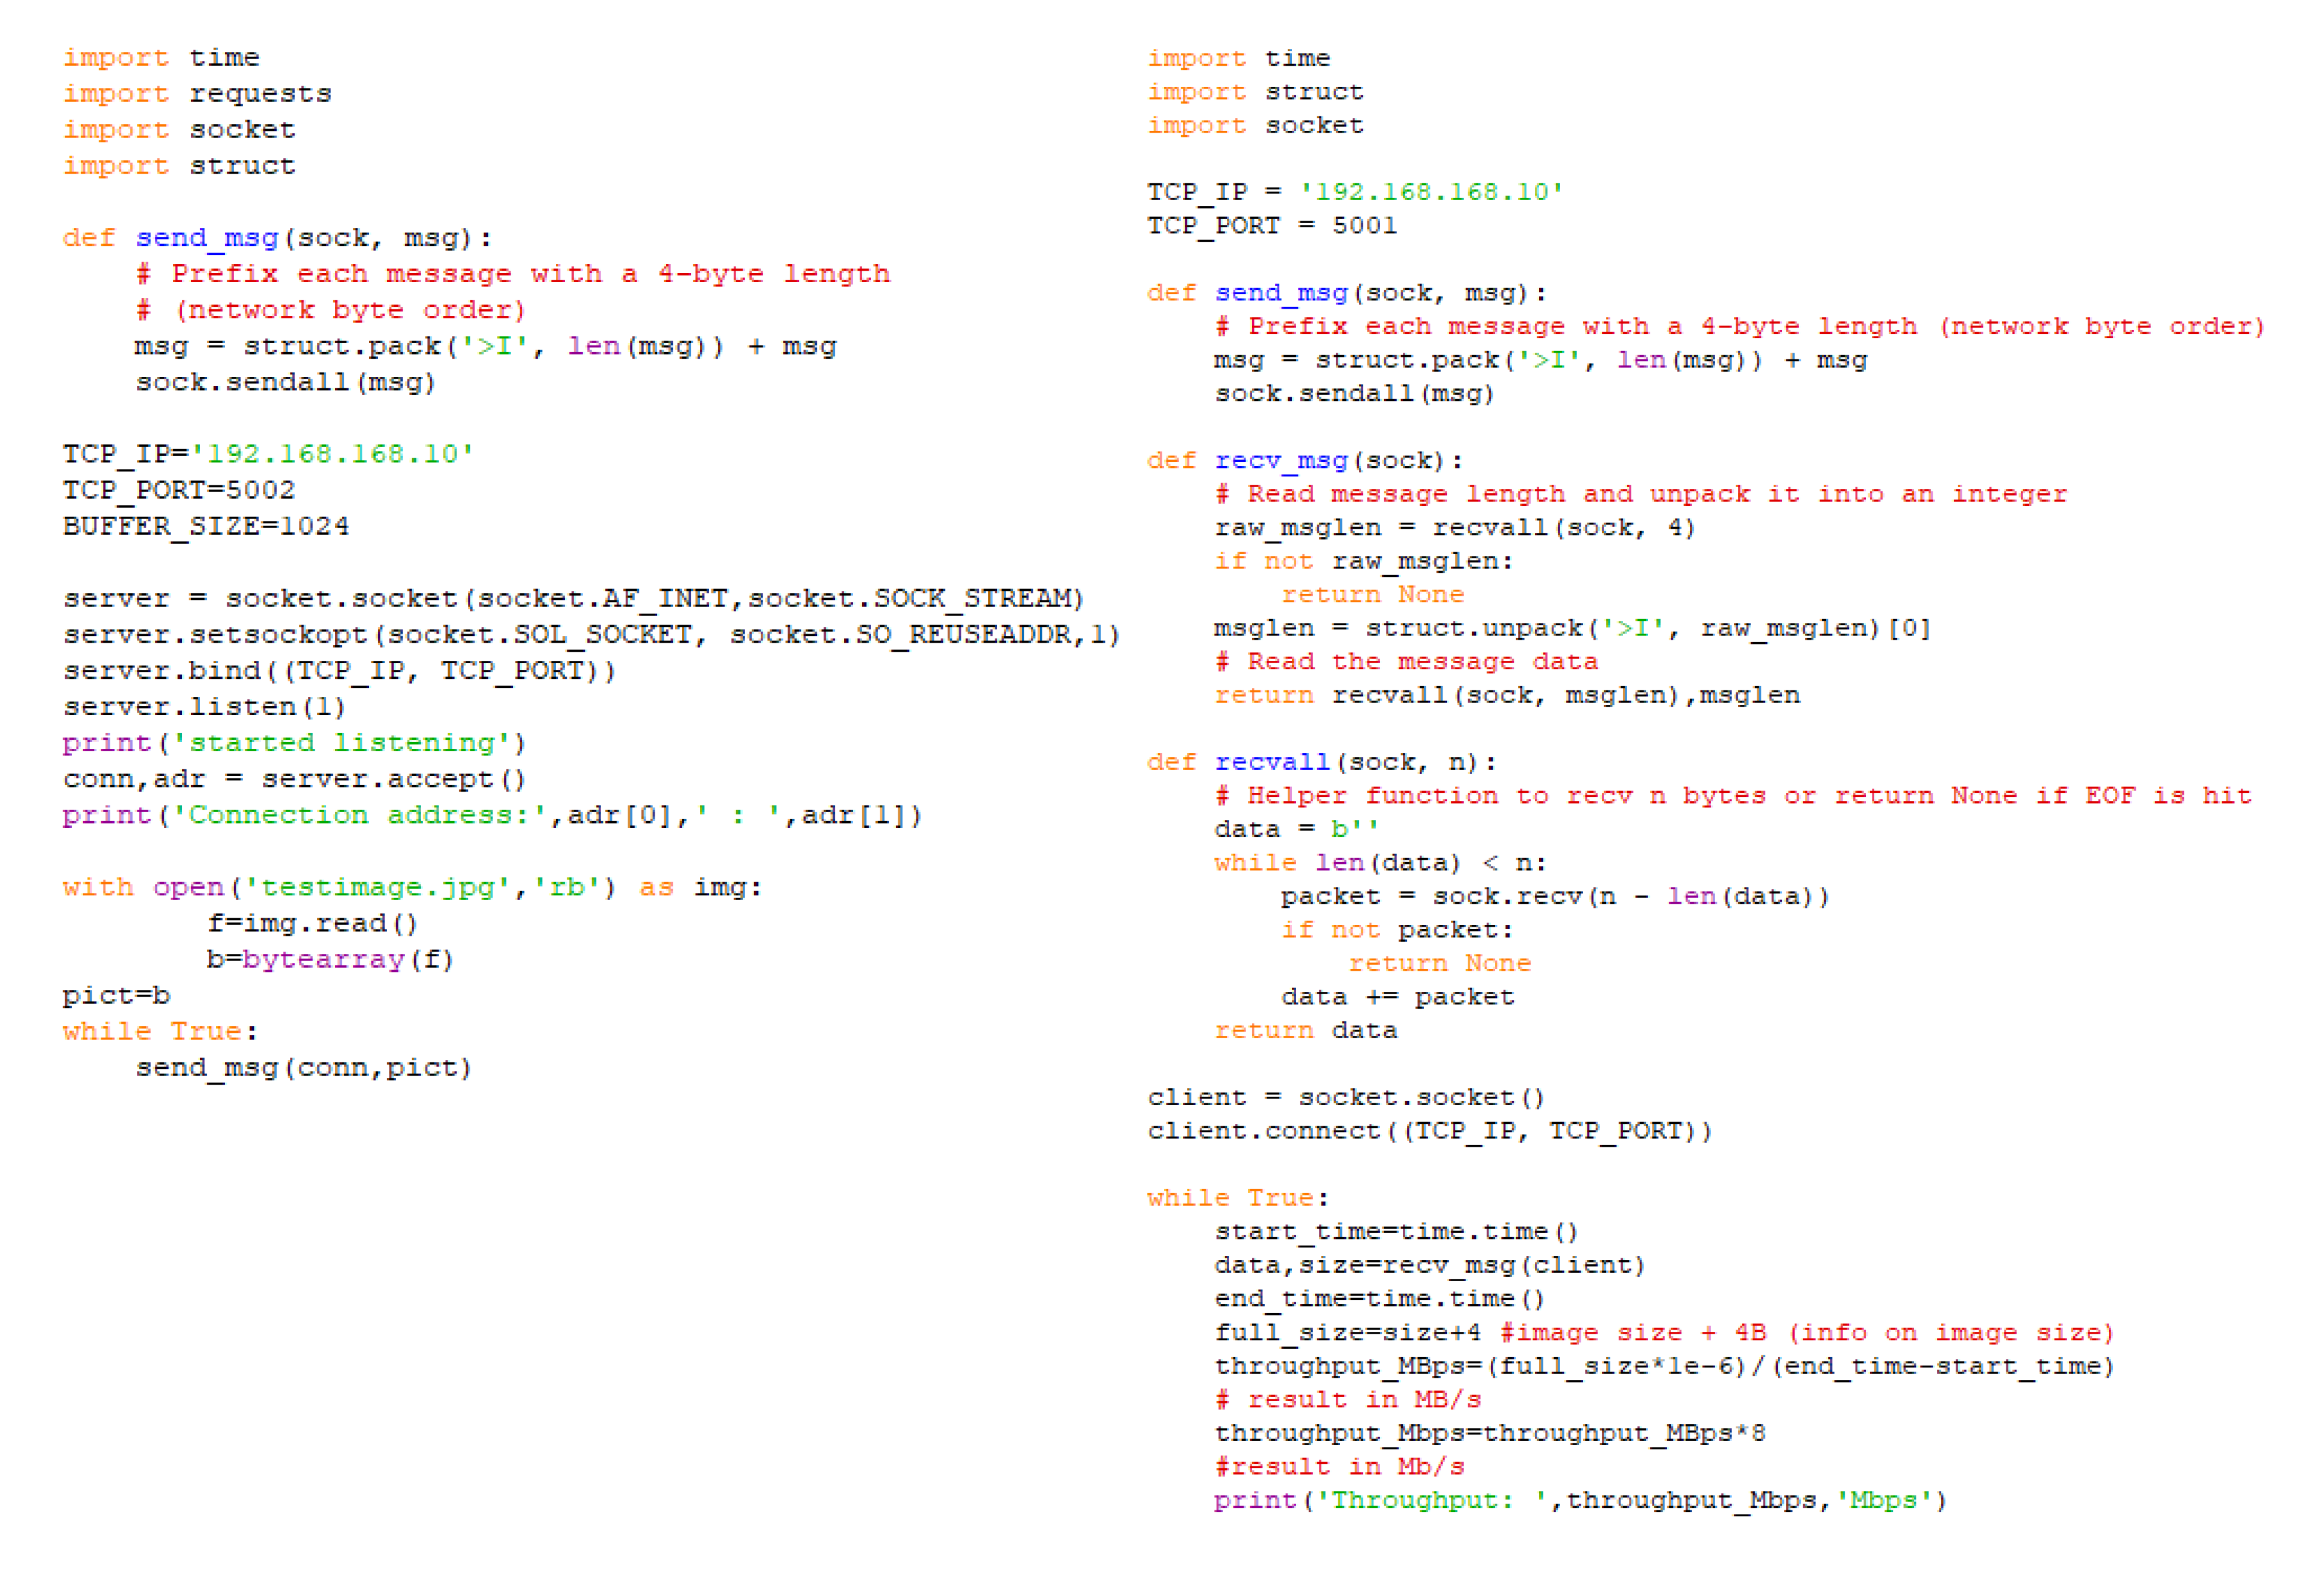
This system consists of a laptop computer, a Raspberry Pi 3 single board computer (RPi3), two pMDLL2450 modules (transceivers), a power supply and connection cables. Raspberry Pi 3 starts a server that waits for the client’s connection. After connection with the client (laptop computer) is established, RPi3 starts sending data (image files) to the client. The test code was written in Python programming language. A code snippet for the server side and for the client side is presented in
Figure 7. A wireless link is established using two pMDLL2450 modules, each connected to the computers (laptop and RPi3) with an Ethernet cable. The modules were in Master-Slave mode (the module connected to RPi3 was the Slave; the module connected to the laptop was the Master). Several data rate tests for various distances were performed.
3.1. Test 1
The first test was an indoor laboratory test whose goal was to confirm that the system works correctly as a precondition for outdoor tests. The distance between the transmitter and receiver was around 3 m. The Raspberry Pi 3 and pMDLL2450 data link modules were connected to the laboratory power supplies (5 and 12 V).
pMDLL2450 module setup:
The system worked as assumed, with an average data rate of around 2.8 MB/s. Notably, the antenna position did not significantly affect the data rate, but this does not mean that this situation will hold true for greater distances.
3.2. Test 2
The goal of the second test was to measure data rate as a function of the distance between two transmitters. The ground station with one pMDLL2450 data link module remained stationary while the other pMDLL2450 data link module and the Raspberry Pi 3 computer in charge of sending data were moving. The tests were carried out until a 275-m distance was reached. The data rate readings were taken every 25 m. The complete system was 1.5 m in height. This was an outdoor test, so all the equipment was powered using batteries. The Raspberry Pi 3 was powered by a 4.8-V battery with a 2300-mAh capacity, and the data link was powered by a 9.6-V battery with a 1900-mAh capacity. The pMDLL2450 module setup was the same as the setup from Test 1 except for the Tx/Rx power. For this test, Tx/Rx power was set to 30 dbm (1 W). The results are shown in
Figure 8.
The throughput stagnates and even rises with an increase in distance (
Figure 8), which is the opposite to the expected results. The reason for this result is the small distance between the transmitters. Moreover, optical visibility between the transmitting and receiving ends was always achieved.
3.3. Test 3
The following test was designed to determine the distance between the transmitter and receiver at which the data rate drops below the required amount and when the connection is lost. In the case of a connection lost at distances under 5 km, the system was considered to be unsatisfactory for our scenario. The measurement procedure was the same as for Test 2. Some data link parameters, however, were changed: the wireless distance parameter was set to its maximal value—3000 m.
Figure 9 presents the measured throughput results for various distances between the ground station and the mobile transmitter. As expected, the throughput decreases with distance. The minimal measured throughput value was 1.4 MB/s, which can be considered satisfactory. The second requirement—a minimum 5-km connection distance—was not met because the connection was lost at 1.1 km. This was likely due to the low height at which the transmitter and receiver were positioned (1.5 m). Therefore, a subsequent test with the transmitter and receiver positioned at more realistic heights was required.
3.4. Test 4
In this test, the ground station (GS) was stationary and positioned at 4 m above ground. At the selected locations, the UAV with the transmitter was moved vertically to determine the data rate’s dependency on the UAV altitude. Four measurement location points with different horizontal distances from the GS were selected. The maximal UAV altitude was 100 m. The measurement location was flat, agricultural land, a few kilometers south-southeast of the town of Sinj, Croatia. The first measurement location point (ML1) was at a distance of 1450 m from the GS (
Figure 10).
The second measurement location point (ML2) was at a distance of 2750 m from the GS. The third point (ML3) was at a distance of 4250 m, and the fourth (ML4) at a distance of 5400 m from the GS.
pMDLL2450 module setup:
Tx power = 30 dbm;
Bandwidth = 8 MHz.
The measured throughput for all four measurement location points is presented in
Table 4.
For the first two MLs (ML1 and ML2), the measured throughput was satisfactory.
Table 4 indicates that better results were obtained when the antennas on the UAV and ground station were perpendicular to each other.
For ML3 and ML4, the throughput dropped under the desired values. We assume that this drop occurred due to the height differences and obstacles between the GS and UAV. Although a connection was not possible at heights under 100 m, the encouraging fact is that connection was not lost for the measurements at a 100-m altitude. Moreover, for these last two measurements, the bandwidth parameter at pMDLL2450 was reduced to 4 MHz. The best measured results for all distances are given in
Figure 11.
Although the measured throughput for distances over 3 km drops under the desired (needed) values, the assumption is that the system might work because connection remained stable at higher altitudes (there was no connection lost at distances under 5 km). The desired throughput could be improved using a directional antenna at the ground station that will be oriented towards the UAV direction. This was the motivation for the final set of measurements.
3.5. Test 5
For this test, a directional antenna was used. The ground station antenna was at a height of 3 m and directed towards the UAV with a transmitter module. The parameter setup for the pMDLL2450 modules was the same as that used in Test 4. The measurement location was flat, karst terrain around Konjsko—about 10 km north of Split, Croatia (
Figure 12).
Throughput was measured for various distances, UAV altitudes and yaw angles. The measurement results for six different measurement location points are shown in
Table 5. From the data presented in
Table 5, it can be concluded that this system can satisfy the required throughput for the search and rescue scenario that we presented in this paper. The last measured distance was 6 km from the ground station. Even at that distance, the result obtained for 0° UAV yaw angle was marginally acceptable. The UAV flight altitude has a significant impact on the throughput. At greater distances from the ground station, the altitude should be higher due to different obstacles and terrain curvatures. The throughput for various distances and UAV flight altitudes is shown in
Figure 13. For the targeted 5-km range, the measured optimal height is 90 m. The UAV antenna yaw angle related to the ground station antenna is also an important factor for throughput.
Although the results for all measured location points were not always consistent, in most cases, a UAV antenna yaw angle of 90° yielded the best results (
Figure 14).
4. Discussion
Search and rescue missions usually require an updated situation of the search area as quickly as possible. However, in addition to the time needed for generation of updated maps (which depends on the number of images to be processed, the spatial resolution and the extent of the captured area) [
61,
62], time needed for acquiring images on the processing site can also postpone the whole process completion for hours. Therefore, transmitting images acquired by a UAV camera during flight is an essential demand for SAR mission success.
The measured throughput confirmed that the proposed system with the chosen data link module can be used for real-time transmission of high-resolution images acquired with a camera on a UAV. This is in line with the declared data rate of 20 Mbps at 5 km. The measured throughput at a 5-km distance was ultimately lower (1.4 MB/s or 11.2 Mbps), but that result was expected. During the tests, the connection stability was dependent on the presence of obstacles between the transmitting and receiving ends. Recent research on long-range communication for unmanned search and rescue aircraft systems [
63] reported a single-link throughput of 10.6 Mbps using a local dedicated Long-Term Evolution (LTE) network and a quite stable multi-link throughput of ~20 Mbps, but our approach is not dependent on the third-party infrastructure, while still providing sufficient throughput.
In the paper [
64], the authors developed a rapid aerial monitoring system for emergency responses which can successfully acquire the sensory data of a test site in real time. By processing the data, the system can produce high-quality orthoimages. The GSD of the presented experiment was 3 cm and single-image ground coverage was 145 × 90 m. However, there is no information on the achieved (and measured) throughput of images to the ground station. Although our achieved throughput results are lower than reported in [
16], that approach uses a high image compression (0.4% of the original size) before transmission. Therefore, additional use of the acquired images for searching for a lost person using some image processing algorithm [
15,
65] is unlikely, and detection results would be poor because of lost details in the received images. Our demands for a high resolution, a high data rate and a low system price are the limitations for satellite-based image transmission [
66].
Our next challenge was the optimization of the subsequent step in the planning process, which was creating a mosaic of transmitted images and georeferencing it on a map using GIS software. For that purpose, we developed a QGIS plugin for search and rescue mission planning. Currently, within the plugin, two methods for stitching images are available (top left corner in application GUI, presented in
Figure 3). The first method uses Image Composite Editor (ICE), an advanced panoramic image stitcher created by the Microsoft Research Computational Photography Group [
67]. This free development tool does not provide data needed for georeferencing output results into a map. Therefore, an additional algorithm was developed for the calculation of the correct GPS position and orientation of the resulting map part. It uses the GPS data from each single image used for generation of the map part. Another method is using a commercial solution for mosaicking images. For this purpose, the Agisoft Metashape software [
29] was used. A request for image stitching is generated within QGIS software as a Python script and the result is automatically imported into the QGIS environment. An example of the part of the map produced with Agisoft is presented in
Figure 15. In this example, 37 images were used and the achieved processing time on a desktop computer (Intel i7 processor, 16 GB RAM, nVidia GTX 9700 GPU) was around 20 s. Although Agisoft metashape and Image Composite Editor are essentially different software tools, because Agisoft performs photogrammetric processing of digital images and generates 3D spatial data while ICE generates 2D images, both can be used for this application (importing updated maps into QGIS). Nevertheless, is worth noting that since Agisoft output has all the data needed for georeferencing as well as digital elevation data, these features can be used for further steps of mission planning (terrain passability calculation, terrain segmentation and search sectors’ definition), which is not the case with ICE output. However, Agisoft software is not cheap (around USD 5000 per license), so a free option such as ICE should not be discarded. At the moment, both options are available on user request from the QGIS GUI, but adding an automated request for image stitching directly from the Python script on the client side (GS) should not be a problem.
For our application, around 10–20 images per minute (depending on flight parameters and used hardware) will be received. Since the intention is to have maps updated as soon as possible, waiting for all images to be received and stitching them after that is not an acceptable option. A more reasonable approach would be making smaller updated map patches at appropriate time intervals. The optimal interval length is yet to be determined but, at the moment, we are planning to start with forwarding acquired images to the stitching phase every 2 min.
Another issue for this type of operation could be flight missions in areas where the GPS signal is not reliable or even not fully available. As a solution, UAV localization based on simultaneous localization and mapping (SLAM) [
68] could be introduced. These algorithms need a rather powerful onboard computer on the UAV. However, due to relatively high UAV altitudes while scanning the area, it is expected that a GPS signal will be available.
Scenarios of non-urban search and rescue missions usually involve various types of terrain that must be surveyed. Hilly and mountainous environments are common and must be considered when presenting a final system solution. Possible approaches using a tethered UAV on the receiving side or a multi-UAV approach were already discussed in
Section 2.3. Finding the best solution is a future challenge. The research presented in this work showed that the core of a future system can be made from the presented modules. Although some other systems with data link modules have higher data rates in their specifications, as already stated, we sought to keep system’s price relatively low. Since this part of the market and the related technological solutions are very dynamic [
53,
64], some new and superior devices at reasonable prices could be available soon, thereby allowing improvements in the throughput or limitations in the sizes of images that can be transmitted.
Another important factor is the preparation time for initial mission planning based on the newly collected images of the terrain. To shorten the period of constructing updated maps, which corresponds to the time needed for the UAV to fly over the area of interest, there are several possible approaches. The first is based on a two-stage flight of the fixed-wing UAV. In the first stage, the UAV would fly at a higher altitude and collect images of a large area with a lower resolution. These images would only be used to make a new map but could not be used for the detection of people due to insufficient resolution. In the second stage, the UAV would fly at lower altitudes, providing images with a resolution appropriate for detection. Another possible approach can be based on the periodical collecting of images and updating maps of areas known for frequent cases of SAR missions. In both cases, the preparation time for starting a search of the wider area for SAR missions would be significantly reduced, while proper and reliable maps would be available to the mission planners.


