Article

Characterization of a Human In Vitro Intestinal Model for the Hazard Assessment of Nanomaterials Used in Cancer Immunotherapy

1
Institute of Biomedical Studies, Baylor University, One Bear Place #97266, Waco, TX 76798-7266, USA
2
Department of Environmental Science, Baylor University, One Bear Place #97266, Waco, TX 76798-7266, USA
3
Vireo Advisors, LLC, Boston, MA 02130-4323, USA
*
Author to whom correspondence should be addressed.
Appl. Sci. 2021, 11(5), 2113; https://doi.org/10.3390/app11052113
Submission received: 22 January 2021 / Revised: 16 February 2021 / Accepted: 20 February 2021 / Published: 27 February 2021
(This article belongs to the Special Issue Nanobiopolymers in Medicine and Healthcare)

Abstract

:

Featured Application

There is a need to improve the sophistication of in vitro models for safety testing in the drug discovery pipeline.

Abstract

There is momentum in biomedical research to improve the structure and function of in vitro intestinal models that better represent human biology. To build a more comprehensive model, three human cell-types were co-cultured and characterized: i.e., HT29-MTX (intestinal mucous-producing goblet cells), Caco-2 (colon epithelial cells), and Raji B (lymphocytes). Raji B cells transformed a subpopulation of Caco-2 epithelial cells into phagocytic and transcytotic immune-supporting microfold cells (M-cells). A suite of bioassays was implemented to investigate steady-state barrier integrity and cellular communication. The model demonstrated a potentiating effect in metabolism and pro-inflammatory markers. Barrier integrity and cell seeding density seem to play a role in the reliability of endpoint readouts. Microscopic analysis elucidated the importance of multi-cell biomimicry. The data show that monocultures do not have the same characteristics inherent to triple cell culture models. Multiple cell types in an in vitro model produce a better representation of an intact organ and aid in the ability to assess immunomodulatory effects of nanomaterials designed for cancer theranostics after ingestion. As many national and international agencies have stressed, there is a critical need to improve alternative-to-animal strategies for pharmaceuticals in an effort to reduce animal testing.

1. Introduction

Animal models, specifically rodents, are the most common model utilized in toxicological and pharmacological research [1]. Rodent studies serve as a prerequisite for safety and efficacy assessments for pharmaceutics after ingestion, inhalation, transdermal, and intravenous exposures [1]. Within the class of rodent models, murine studies account for roughly 95% of published papers and clinical reports. Of note, there are a variety of physiological differences between the mouse and higher-order mammalian species, especially when it comes to assessing biological effects after ingestion [2]. For instance, mouse intestinal tracts have both macroscopic and microscopic differences to that of the human and these lead to variability in the interpretation and translation of biochemical and molecular results between species [3,4]. One promising technique that could be utilized in assessing the toxicity of therapeutics is in vitro human intestinal models. To avoid the pitfalls associated with interspecies variations, complex human cell cultures have received attention from many different local, national, and international agencies as a viable alternative-to-animal strategies that can provide valuable insights in infectious disease, immunology, drug discovery, and toxicology studies [5,6].
The most recognized in vitro cell-type used for intestinal permeability studies is enterocytes (e.g., Caco-2 cell line). The structure and function of this cell is similar to enterocytes of the human gut, as the cells were harvested from a human and subsequently cultured in vitro. However, the use of enterocytes as a monolayer in in vitro studies is limited as Caco-2 cells are derived from the colon rather than the small intestine. Cells that reside in the small intestine have fewer tight junctions to allow for absorption of nutrients and water while cells in the colon have more tight junctions that result in lowered absorption [7,8,9,10]. However, Caco-2 cells can be differentiated into a phenotype with elevated absorption abilities (i.e., Caco-2 to M-cells) via the addition of B-cells (such as Raji B) which allows for considerations of the non-specific absorption of digested materials in the lumen [11]. The morphological, physiological, and biochemical differences among cells lining the colon versus small intestine should be taken into consideration when interpreting results from monocultures of precursor cells (Caco-2) to differentiated cultures (those that include M-cells) in order to develop a more sophisticated model.
Cell model choice strongly depends on the biological function of interest because the structure–function relationship that exists at the molecular level is dependent upon biochemical processes inherent to specific cell-types. For example, phagocytic cells, such as M-cells, are responsible for active transport mechanisms, where they maintain homeostasis through the trafficking of antigens from the lumen to immune cells creating either a tolerogenic or inflammatory response [12,13,14]. Disruptions in homeostasis can lead to exacerbated immune responses and subsequent disease. Because immune cells, such as T-cells or B-cells, are responsible for most of the interferon and interleukin cytokine production, incorporating M-cells into intestinal co-culture models is critically important to translate from in vitro responses to potential in vivo outcomes [15,16,17,18].
The move towards co-cultured intestinal models allows for the integration of critical cell-types at the luminal interface. Because the intestinal tract consists of a compounded network of cells, communications, and involuntary biokinetics, the utilization of triple cell cultures which mimic the intestinal cellular architecture provides a better toxicological and pharmacological model than single monolayers. Within the human intestinal tract, there are approximately six different types of mammalian cells as well as the mucosa and microbiome [19,20,21]. Therefore, an in vitro intestinal model should include mucus-producing cells. Most commonly, goblet cells (e.g., HT29-MTX cell line) serve in this role [22,23,24]. It has been shown that the three-dimensional structure is crucial for the differentiation of certain cells while the culturing of different cell-types together allows for a better likeness in continuous crosstalk, via intercellular signaling that occurs in vivo [25,26,27].
Previous studies have reported notable characteristics of enterocyte monolayers and co-culture systems. Araújo et al. examined the effect of cell-type ratios on certain biomarkers and discovered that differentiated Caco-2 and mucus-producing HT29-MTX cells decreased permeability after treatment with chitin, indicating the importance of multiple cells-types in creating cohesive barrier functionality [28]. Biomarkers, such as actin filament, can be measured through fluorescence microscopy and used to help confirm cell differentiation [29,30,31]. However, data on other biomarkers in these models, such as inflammatory cytokine secretion, are lacking. Utilizing complex modeling can aid in the interpretation of ingested nanomaterials in pharmacology and toxicology. By measuring immunomodulatory responses, complex modeling can help determine efficiency and potency of ingestible therapeutics used in cancer immunotherapy [32,33].

2. Materials and Methods

Individual Cell Populations. Human colon carcinoma Caco-2 (ATCC, Manassas, VA, USA) were used between the passages of 38–45. Mucus-producing HT29-MTX (Sigma, St. Louis, MO, USA), and human Burkitt’s lymphoma Raji B (ATCC) cell lines were obtained and used at passages numbers 3–10. Dulbecco’s Modified Eagle Medium/F-12 (DMEM/F12; 1:1), RPMI-1640, 10% fetal bovine serum, 10,000 U/mL penicillin, 10 mg/mL streptomycin (MP Biomedicals, Santa Ana, CA, USA), and trypsin–EDTA (Invitrogen, Waltham, MA, USA) were used to maintain cultures. Transwell® polycarbonate inserts (i.e., 12 wells, pore diameter of 4 μm polycarbonate) were purchased from Midland Scientific, Inc., Omaha, NE, USA. Caco-2 and HT29-MTX were grown in separate flasks using DMEM-F12 supplemented with 10% fetal bovine serum and a 1% penicillin and streptomycin cocktail at 37 °C under a 5% CO2 water saturated atmosphere. Upon confluency (between 80–90%) cells were harvested from flasks using trypsin–EDTA and subsequently reseeded at 5 × 10⁵ cells per 75 cm2 flask with culture media replaced every other day. Raji B cells were similarly cultured as above, with RPMI-1640 supplemented with 10% fetal bovine serum and 1% penicillin and streptomycin. In preparation of acclimating Raji B cells into a triple cell culture model utilizing DMEM/F12, over a 4-day period, RPMI-1640 cell culture medium was replaced by 25% of DMEM/F12 per day. This allowed cells to slowly acclimate to supplemented DMEM/F12 cell culture medium.
Triple Cell Culture Model Assembly. Triple cell culture model assembly of Raji B, Caco-2, and HT29-MTX cells was seeded at a ratio of 9:9:1 (unless otherwise stated) with the HT29-MTX and Caco-2 cells on the apical chamber of Transwell® inserts and the Raji B on the basolateral compartment. The cells were maintained under identical conditions to the monocultures with medium changes every other day. To assemble the layers, first Raji B cells were plated at a known seeding density with 1.5 mL culture medium. Then, the Transwell® was inserted, and Caco-2 cells were then seeded at an equivalent density to Raji B cells onto the insert. HT29-MTX cells were seeded last at a density of 1/9 that of the Caco-2 population at the time of Caco-2 seeding to allow for HT29-MTX cells to embed within the Caco-2 layer for proper in vivo correlation [24,34,35,36,37]. Total volume was increased to 2 mL (1.5 mL on the well; 0.5 mL on the insert) of DMEM/F12; 1:1 culture medium). Caco-2 cells took approximately 5 days to differentiate with Raji B exposure.
Cellular Metabolism. Metabolic activity was measured using the MTS ((3-(4,5-dimethylthiazol-2-yl)-5-(3-carboxymethoxyphenyl)-2-(4-sulfophenyl)-2H-tetrazolium)) assay (Promega, Madison, WI, USA). Raji B, Caco-2, and HT29-MTX cells were seeded separately and in triple cell culture and incubated for 24 h at 37 °C in 5% CO2 environment. MTS solution was added to each cell culture per the manufacturer’s directions [38,39]. After a 2-h 37 °C incubation, the absorbance was measured at 490 nm using a plate reader (Synergy, BioTek, Winooski, VT, USA).
Pro-Inflammatory Response Markers. Pro-inflammatory response markers were measured using an enzyme-linked immunosorbent assay (ELISA) for interleukin 6 (IL-6, Invitrogen, Carlsbad, CA, USA). Raji B, Caco-2, and HT29-MTX cells were seeded separately and in triple cell culture and incubated for 24 h at 37 °C in 5% CO2 environment. After incubation, cells were washed with phosphate buffer solution (PBS) (Invitrogen) and lysed with RIPA Buffer (Invitrogen). Lysate was collected and centrifuged at 12,000 rpm. Lysate samples and standards were plated per manufacturers direction, and absorbance was read on a plate reader (Synergy H1, BioTek) at 450 nm (620 nm as a reference wavelength) [40,41]. Raw data was normalized for protein content which was recommended by the manufacturer (high/low protein controls). All indicated time points refer to time beyond 24 h (i.e., for the 1 h time point, cells were prepared 25 h after seeding; for 6 h time point, 30 h after seeding; for 24 h time point, 48 h after seeding; for 48 h time point, 72 h after seeding).
Monolayer Integrity. Transepithelial/transendothelial electrical resistance (TEER) is an indicator of the modulation of the passage of substances through a membrane, (i.e., decreased integrity is related to increased permeability) [42]. Data collected was used to monitor cell culture confluence, monolayer formation, and epithelial barrier function [43]. The electrical resistance of a cellular monolayer, measured in ohms, quantitatively measured the barrier integrity and the TEER measurements on the triculture model may be interpreted as a “simulated” intestinal barrier integrity [35].
Caco-2, HT29-MTX, and Raji B cells were seeded individually at 13,000 cells/cm2 density on Transwell® inserts (membrane area 1.1 cm2, pore size 0.4 μm, Corning®, Corning, NY, USA) in triplicate. The triple cell culture was seeded in triplicate as follows: Caco-2 cells at 6000 cells/cm2 density in the Transwell® insert, Raji B cells at 60,000 cells/cm2 density in the Transwell®, and HT29-MTX cells at 1000 cells/cm2 density were seeded on top of the Caco-2 cells in the Transwell® insert. TEER was measured twice daily for seven days using an epithelial voltohmmeter (EVOM) with “chopstick” electrodes (World Precision Instruments, LLC, Sarasota, FL, USA). The monocultures were measured after confluency and up to 7 days, while the triple co-culture was measured after differentiation was reached (approximately 5 days), then measured for resistance. Resultant data was an averaged triplicate with each value measured from a different point in the same well.
Oxidative Stress. ROS-Glo™ H2O2 luminescent assay (Promega, Madison, WI, USA) was utilized to assess oxidative stress in cells at varying seeding densities (4000; 7000; 10,000; and 13,000 cells/cm2) and ratios as previously described for maximum density. Cells were plated, allowed to rest for 24 h, and then used per manufacturer instructions and as previously described (Vasanthi Bathrinarayanan, Brown, Marshall, and Leslie, 2018). Menadione (50 µM; MilliporeSigma, St. Louis, MO, USA) was added to positive control wells and allowed to incubate for 2 h. Luminescence was read on a Synergy H1 Microplate reader (BioTek Instruments, Inc., Winooki, VT, USA).
Cellular Morphology Microscopy –Confocal Imaging. Cells were treated and stained as previously described [44]. Briefly, cells were grown in chamber slides (Lab-Tek II, Rochester, NY, USA) for 48 h, permeabilized per manufacturer instructions (Image-It Fix-Perm kit, Molecular Probes, Eugene, OR, USA), washed, and stained (Actin Green 488 Ready Probes reagent, Invitrogen, followed by MitoTracker™ Red CMXRos and NucBlue™ Live Cell Stain Ready Probes reagent, Molecular Probes, Eugene, OR, USA). Slides were fixed with 2 drops of ProLong Diamond Anti-fade Mountant (Molecular Probes) and a coverslip placed and allowed to set for 24 h. Images were obtained using Confocal Laser Scanning Microscope (FV-3000, Olympus Corp., Shinjuku, Japan) and rendered with FV31S-SW Windows 10. Fluorescent quantification was performed using Cell Sens Dimension 2 and Windows 10 software. Images were analyzed in full color where minimum, maximum, and average fluorescence were captured and graphed. All images were analyzed at highest magnification images (60× under oil immersion) utilizing Microsoft Excel (Microsoft Corporation, Redmond, WA, USA) and Graphpad Prism software (Graphpad Software, San Diego, CA, USA).
Cellular Morphology–Scanning Electron Microscopy. Cells were grown in 2-well chamber slides (Lab-Tek II, Rochester, NY, USA). The media was carefully replaced with a 2.5% glutaraldehyde (Electron Microscopy Sciences, EMS, Hatfield, PA, USA) solution in PBS (pH 7.4) and incubated at room temperature for 30 min. The cell culture wells were washed three times with PBS (Gibco, Waltham, MA, USA) for 10 min each wash. A 1% osmium tetroxide (EMS) solution in PBS was placed in the wells and incubated at 4 ºC for 3 h. The cells were then washed with PBS, again. A dehydration series was carried out with ethanol. Cells were incubated in ethanol ranging in concentrations starting from 50%, 70%, 90%, and 100%. Each concentration of ethanol was repeated twice and left to dehydrate for 10 min. The wells of the chamber slide were then removed, and the slide was submerged in 100% ethanol. A glass cutter was then used to gather sections of the slide for critical point drying (Leica, Wetzlar, Germany). The cells underwent critical point drying for 2 h and were mounted on a scanning electron microscope (SEM) pin stub (EMS) and sputter coated (Leica) with a layer of 20 nm iridium. A line of silver epoxy (EMS) was put between the glass slide and pin stub to reduce charging. Cells were imaged on a Scanning Electron Microscope Versa 3D (FEI, Hillsboro, OR, USA) at 30 kV, spot size 5.0, working distance 5.0 mm, and detected by secondary electrons.
Statistical analyses. Two-way analysis of variance (ANOVA; alpha = 0.05) was performed per data set. In order to confirm assessment of the parametric two-way ANOVA results, Tukey’s Honest Significant Differences (HSD) was conducted. All statistical analysis was performed in Prism 8.3.0 (GraphPad, San Diego, CA, USA). TEER data was loaded into the R statistical computing environment and plotted using the ggplot2 data visualization package, using a simple linear regression method and a 95% confidence interval generated by the smoothed conditional means geometry (geom_smooth). Statistical significance was indicated with “*” when p < 0.05.

3. Results

Nanomaterials have been shown to serve as unique drug carrier entities with tunable physical and chemical properties such as size, shape, composition, charge, and bioavailability [45]. In recent years, progress has been made in understanding the role of absorption and transport of nanomaterials (either as carriers of pharmaceutical ingredients or as pharmaceuticals themselves) in the gastrointestinal (GI) tract after ingestion. Nanomaterials have also been developed and evaluated for utility in bioimaging and diagnostics [46]. While in vivo murine models have provided some immunological information after ingestion of nanomaterial-enabled pharmaceuticals, little is known about the potential for screening unintended immunotoxicological effects of nanomaterials using in vitro models.
Here, we developed a viable human in vitro intestinal model capable of assessing endpoints such as cell ratios and viability as well as the interrogation of distinct and intestinally relevant markers. The added value of this work is the evaluation of high versus low seeding densities as measured in the three individual intestinal cell monocultures as well as within the triple cell culture. The markers included in this study probed for (i) steady-state barrier integrity, through transepithelial electrical resistance (TEER) of mono- and triple- culture systems, and (ii) cellular communication (through metabolic activity, inflammatory stress, and ROS generation), and (iii) cellular morphology (through microscopy to visualize cell differentiation).

3.1. Culturing Methods

The tri-culture model design utilized two culturing methods. The first method was optimized for TEER, MTS, and IL-6 measurements and used a Transwell® 12-well plate where the Raji B cells were seeded in the basolateral compartment followed by Caco-2 cell seeding into the Transwell® insert that recapitulated an apical compartment. Caco-2 and HT29-MTX cells were seeded at a ratio of 9:1, which allowed for Caco-2 cells to form a consistent monolayer with interspersed HT29-MTX cells to enable mucus layer formation. The suspended Raji B cells allowed for a portion of Caco-2 cells to differentiate into M-cell-like phenotype after approximately 5 days, most notably characterized visually by a loss of the majority of microvilli. This culturing method is depicted in Figure 1A.
The second culturing method was used for SEM and confocal microscopy imaging and required chamber slides as the culture dish, where Caco-2 cells and HT29-MTX are seeded together at a ratio of 9:1, respectively, and Raji B cells were added after adherence. Interactions among and between HT29-MTX, Raji B, and Caco-2 cells in both monolayers and triple cell cultures can be seen in Figure 1B–E. Panel C shows the undifferentiated Caco-2 enterocytes (labeled as C(E)) and differentiated Caco-2 M-cells (labeled as C(M)) adhered flat on the chamber slide surface; before differentiation, the surface of cells appears rough and after differentiation the surface of cells appear smooth. In addition, Raji B cells (B-cells) and HT29-MTX (goblet) cells are present. Panel B shows a high-resolution image of HT29-MTX cells with fully functioning microvilli adhering to the slide surface. Panels C and D show undifferentiated Caco-2 (enterocytes) and differentiated Caco-2 (M-cells), respectively. Undifferentiated cells retain microvilli while differentiated cells drastically reduce or remove them altogether; however, in either phenotype, the cells adhere and grow into confluent monolayers. Panel E shows a population of Raji B (B cells). These cell-types stay suspended and rarely adhere to any surface when cultured.

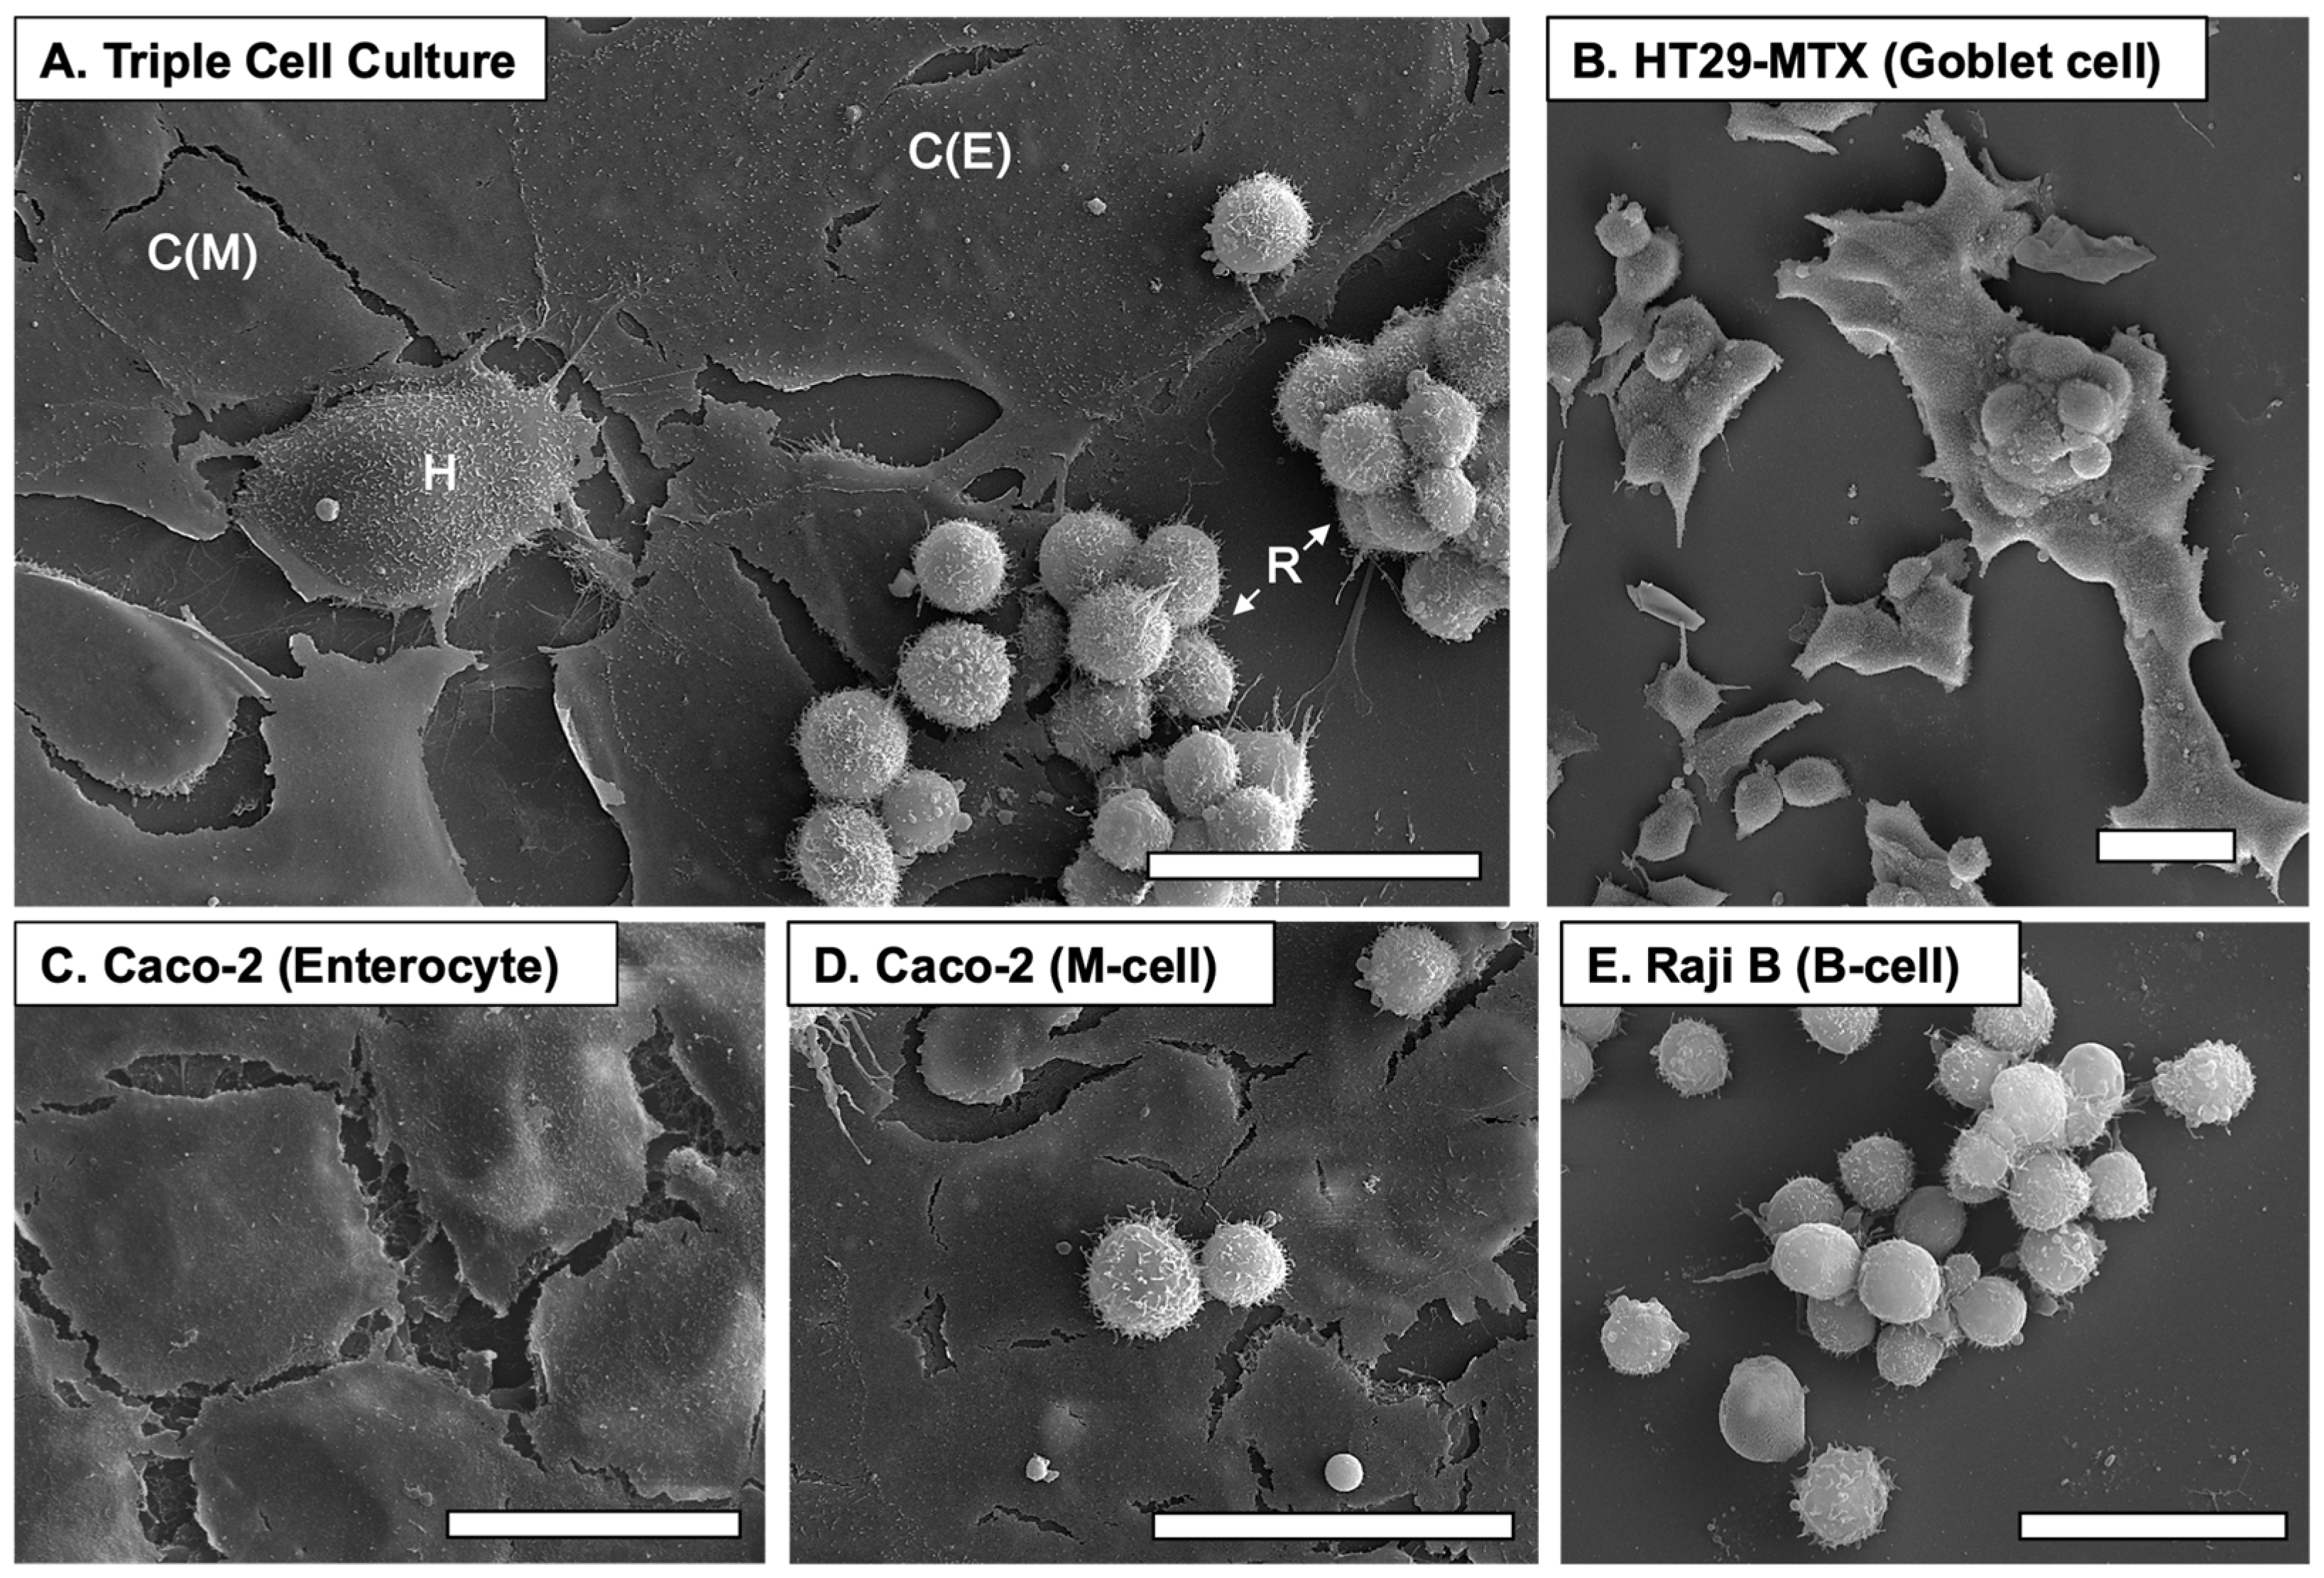
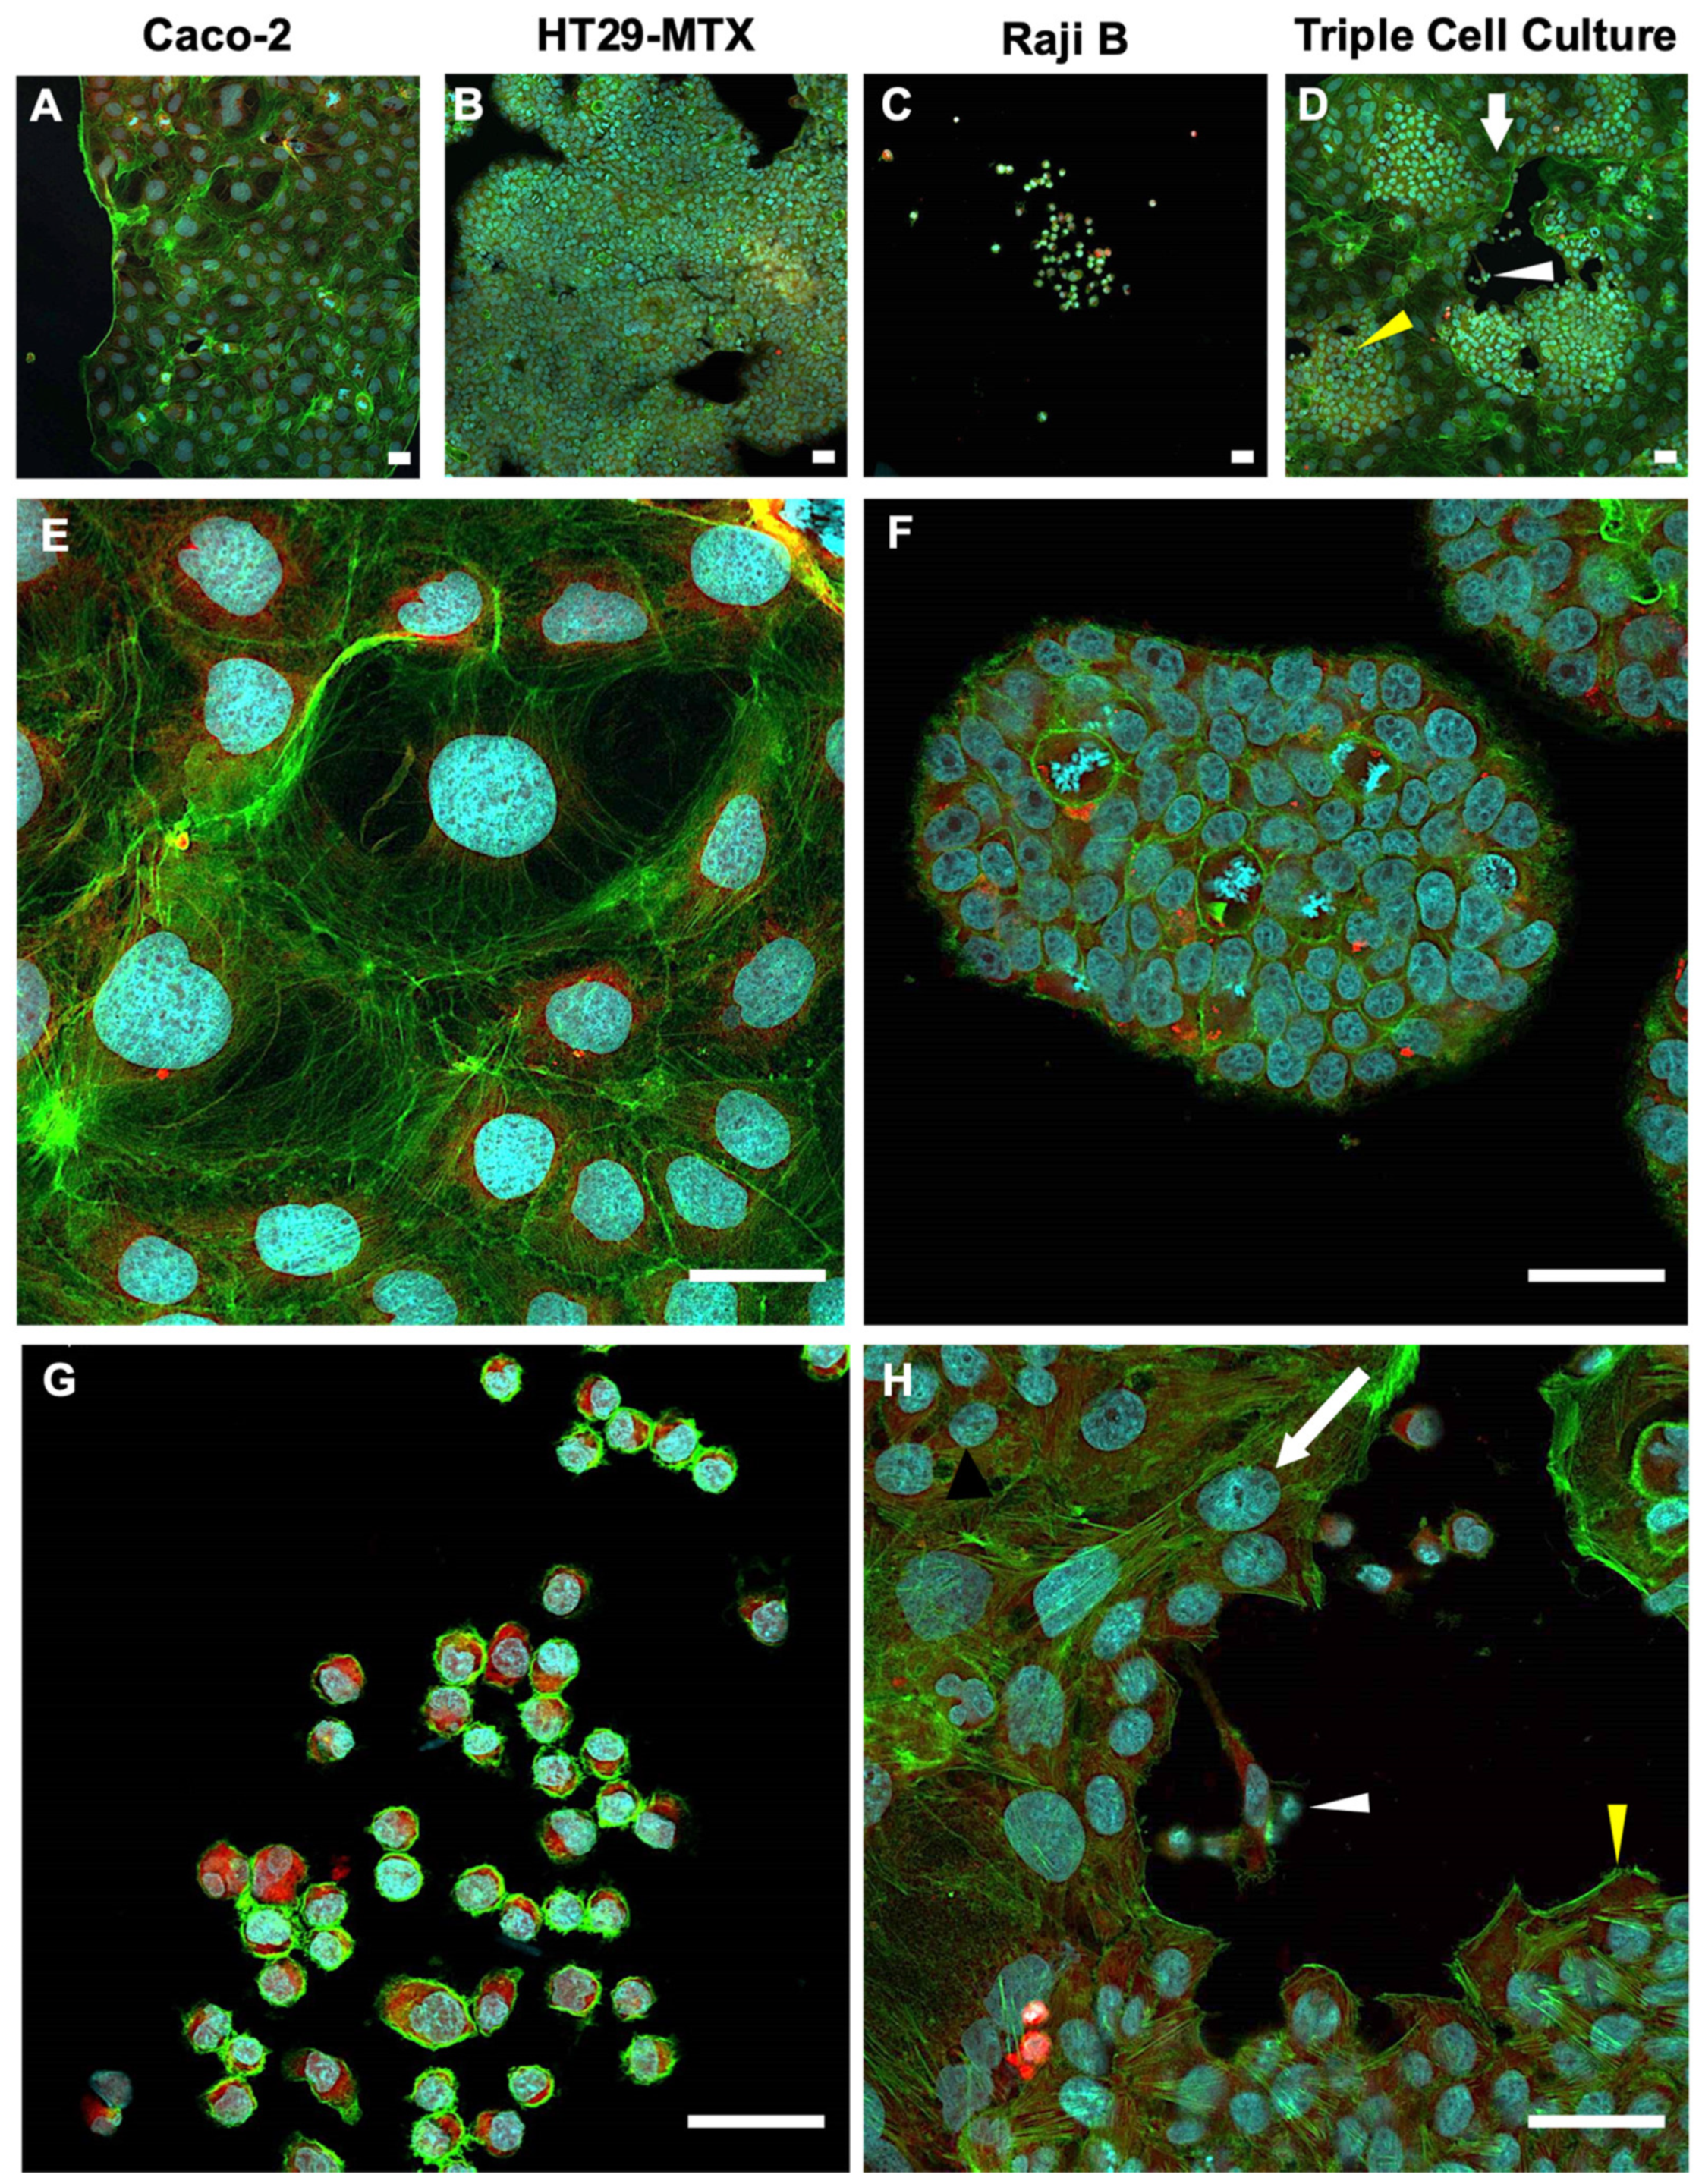
3.2. Culture Morphologies

Confocal microscopy showed monolayers of adherent cells (i.e., Caco-2 and HT29-MTX) grow as a single plane to confluency (Figure 2). Raji B cells, a suspended cell population, tend to group together in culture media but fail to form dense clusters. As monolayers, HT29 and Raji B cells (Figure 2A–C,E–G) exhibited an increased amount of mitochondria stain (i.e., MitoTracker™ Red CMXRos), actin stain (i.e., ActinGreenTM), and DNA stain (i.e., NucBlueTM) indicating a higher basal rate of mitochondrial activity, increased cellular function and increased nuclear activity (respectively) when cells are cultured individually rather than as a triple cell culture (Figure 2D,H) [47]. None of the fluorescently labeled endpoints were statistically different when comparing the Caco-2 monolayer against the triple cell culture, indicating that the triple cell culture model can supplant the monolayer for baseline data while incorporating additional cell-types to properly mimic immunological response. While the role of Raji B cells in the context of an intestinal tri-cultures is to induce differentiation of a portion of Caco-2 cells to M-cell like phenotypes. Distinguishing these cell-types is not easily discernable. However, with the use of nuclear staining, confocal microscopy can help to identify these cells based on size (Figure 2H).

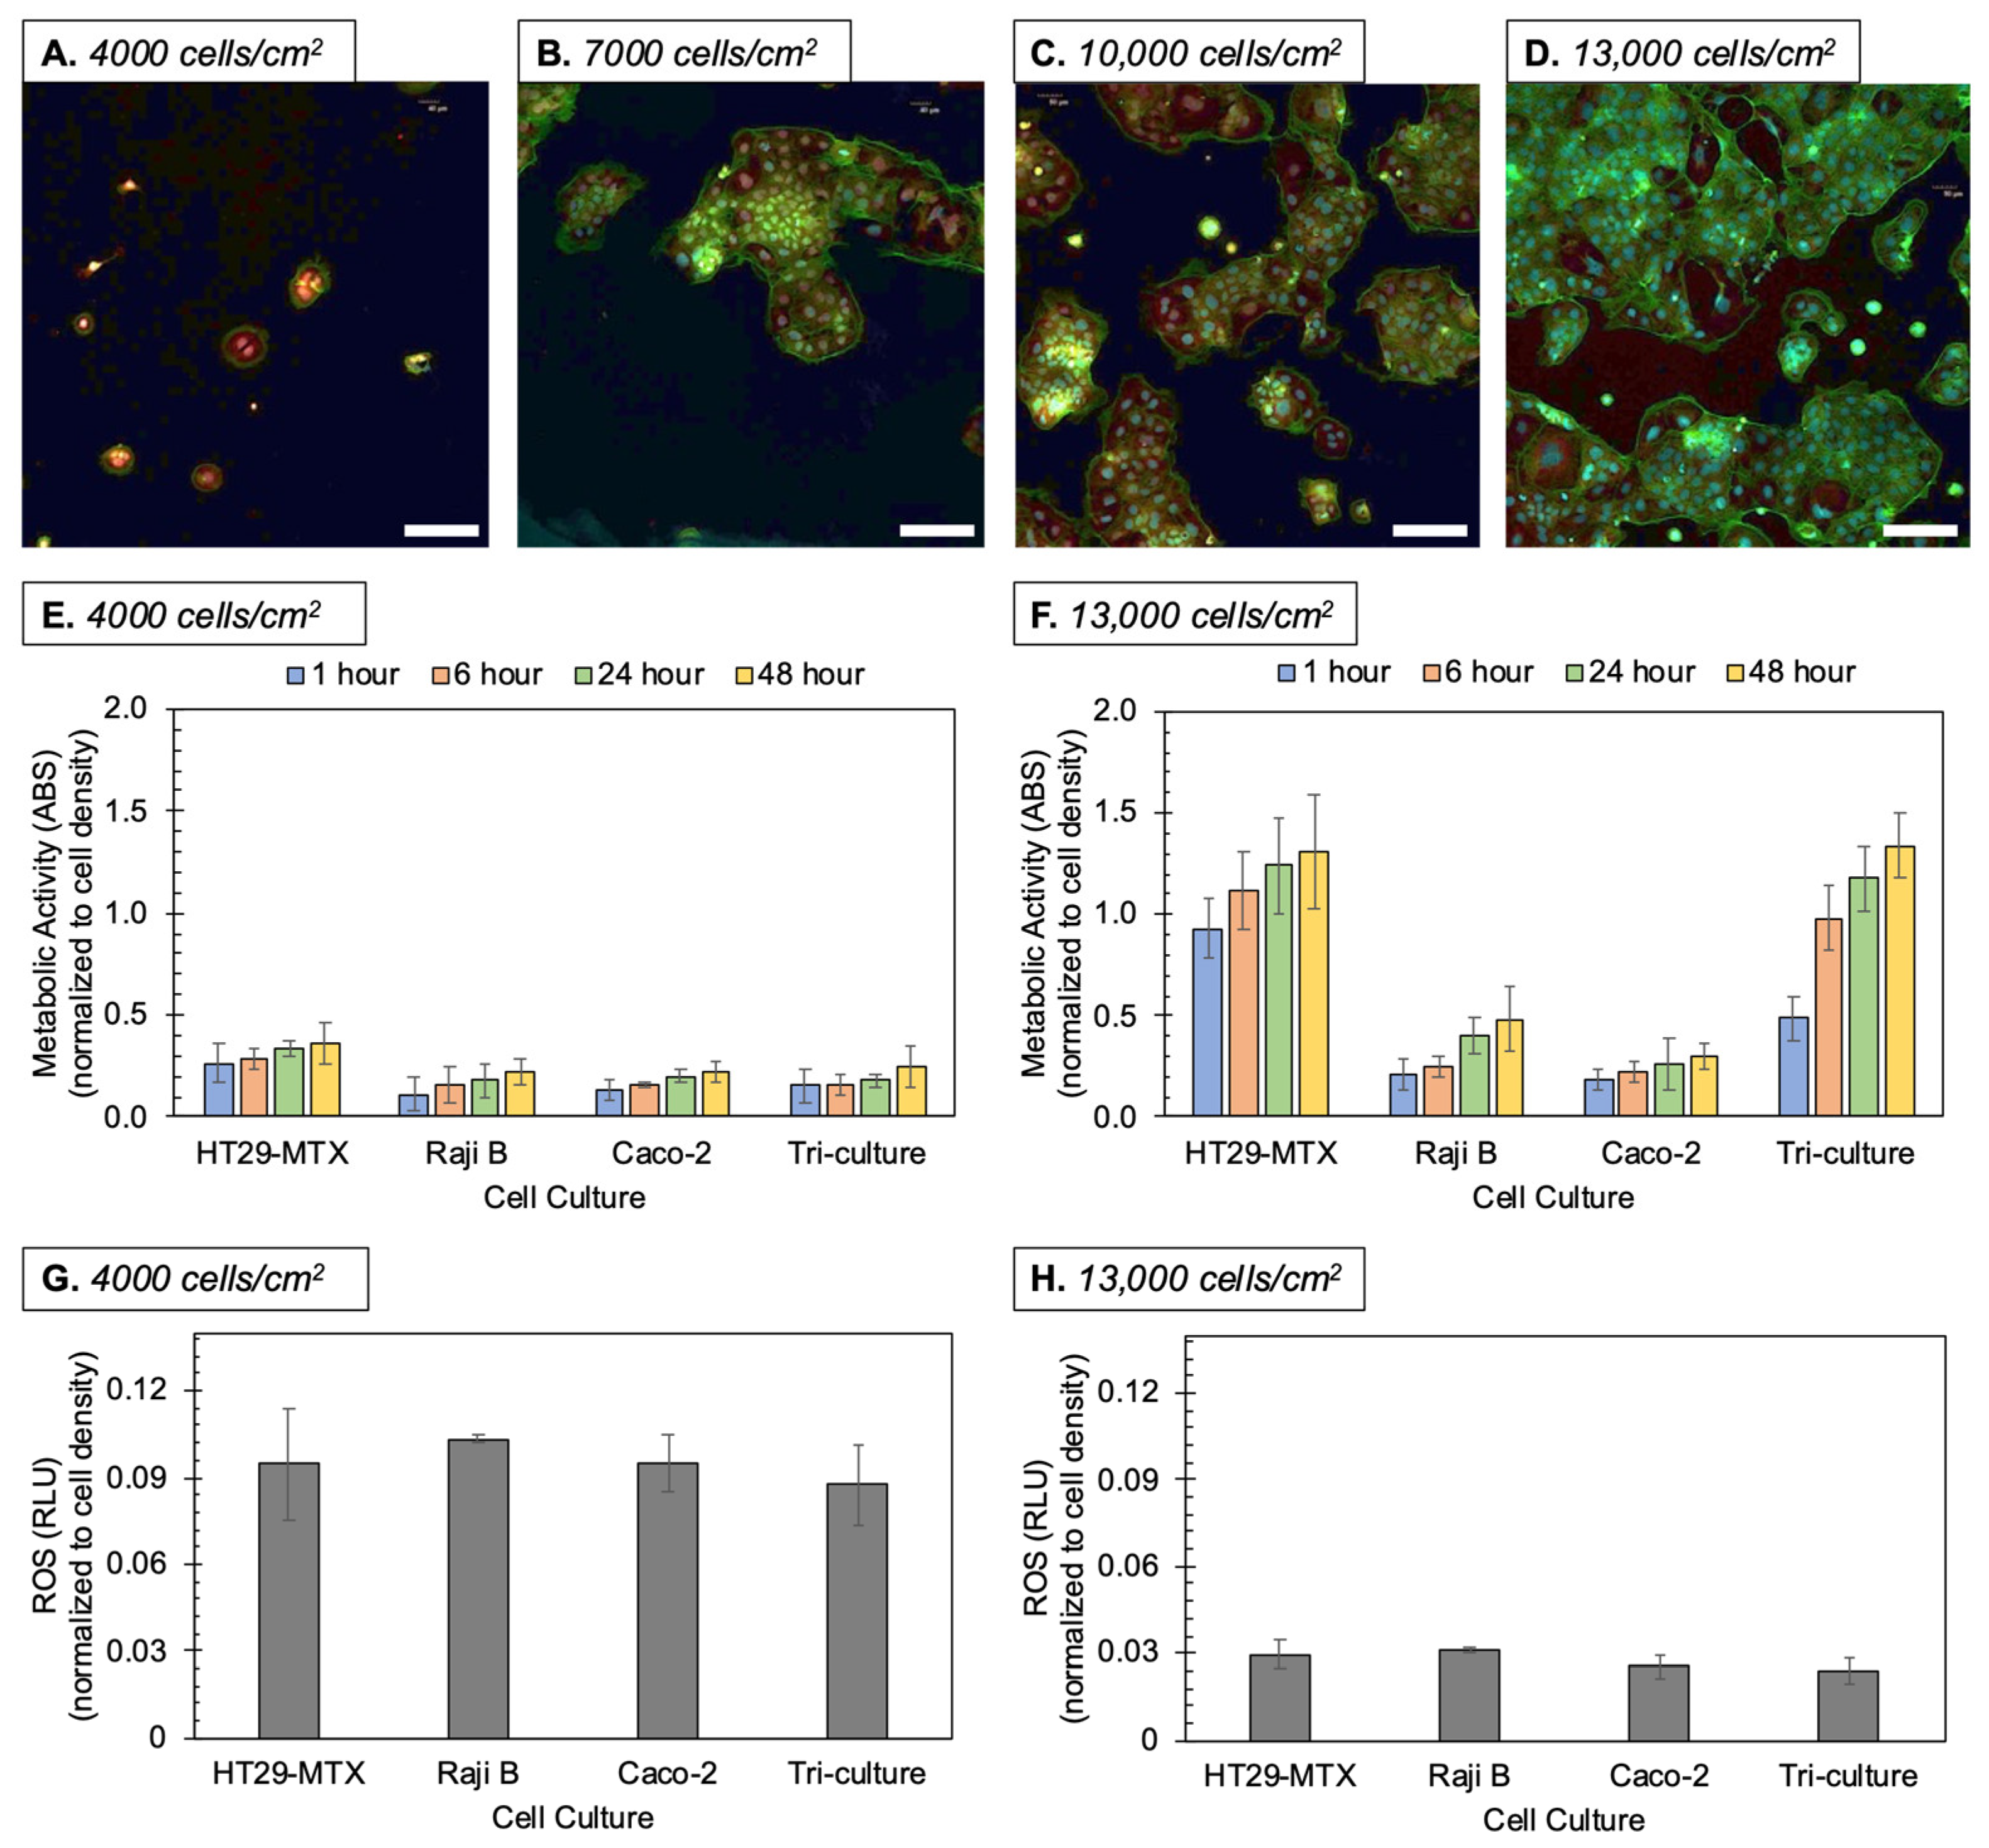
3.3. Oxidative Stress

Baseline expression of oxidative stress in Caco-2 monocultures over increasing seeding densities is shown in Figure 3A–D. Lower cell density resulted in increased oxidative stress and reduced metabolic activity in both monocultures and triple cell cultures. At optimal cell density, goblet cells have increased metabolic response compared to Caco-2 and Raji B cells; the triple cell culture model follows a similar trend to monoculture cell-types and has sustained metabolic activity throughout growth. Confocal laser scanning microscopy of Caco-2 and Raji B cells stained with MitoTracker™ Red CMXRos showed increased red hues at lower seeding densities (4000 cells/cm2) indicating increases in mitochondrial activity as compared to higher seeding densities (13,000 cells/cm2) with reduced red hues indicative of a healthy cell population. Metabolic activity was measured concurrently at the low and high seeding densities using MTS absorbance. At the lower seeding density, metabolic activity, which was normalized to cell density, did not exceed 0.5 throughout the monoculture and triple cell culture models. At higher seeding densities, metabolic rate of HT29-MTX monocultures was markedly increased compared to the other monocultures. The triple cell culture followed a similar trend at higher seeding density with sustained higher metabolic activity throughout the two-day study. Differences between the individual cell-types, as well as the triple cell culture model, become more apparent at higher seeding densities. Figure 3G–H shows similar levels of reactive oxygen species (ROS) between the lowest seeding density (4000 cells/cm2) and the highest seeding density (13,000 cells/cm2) with a trend toward lower ROS at higher densities. This data is supported by the confocal fluorescence micrographs shown in Figure 3A,D.

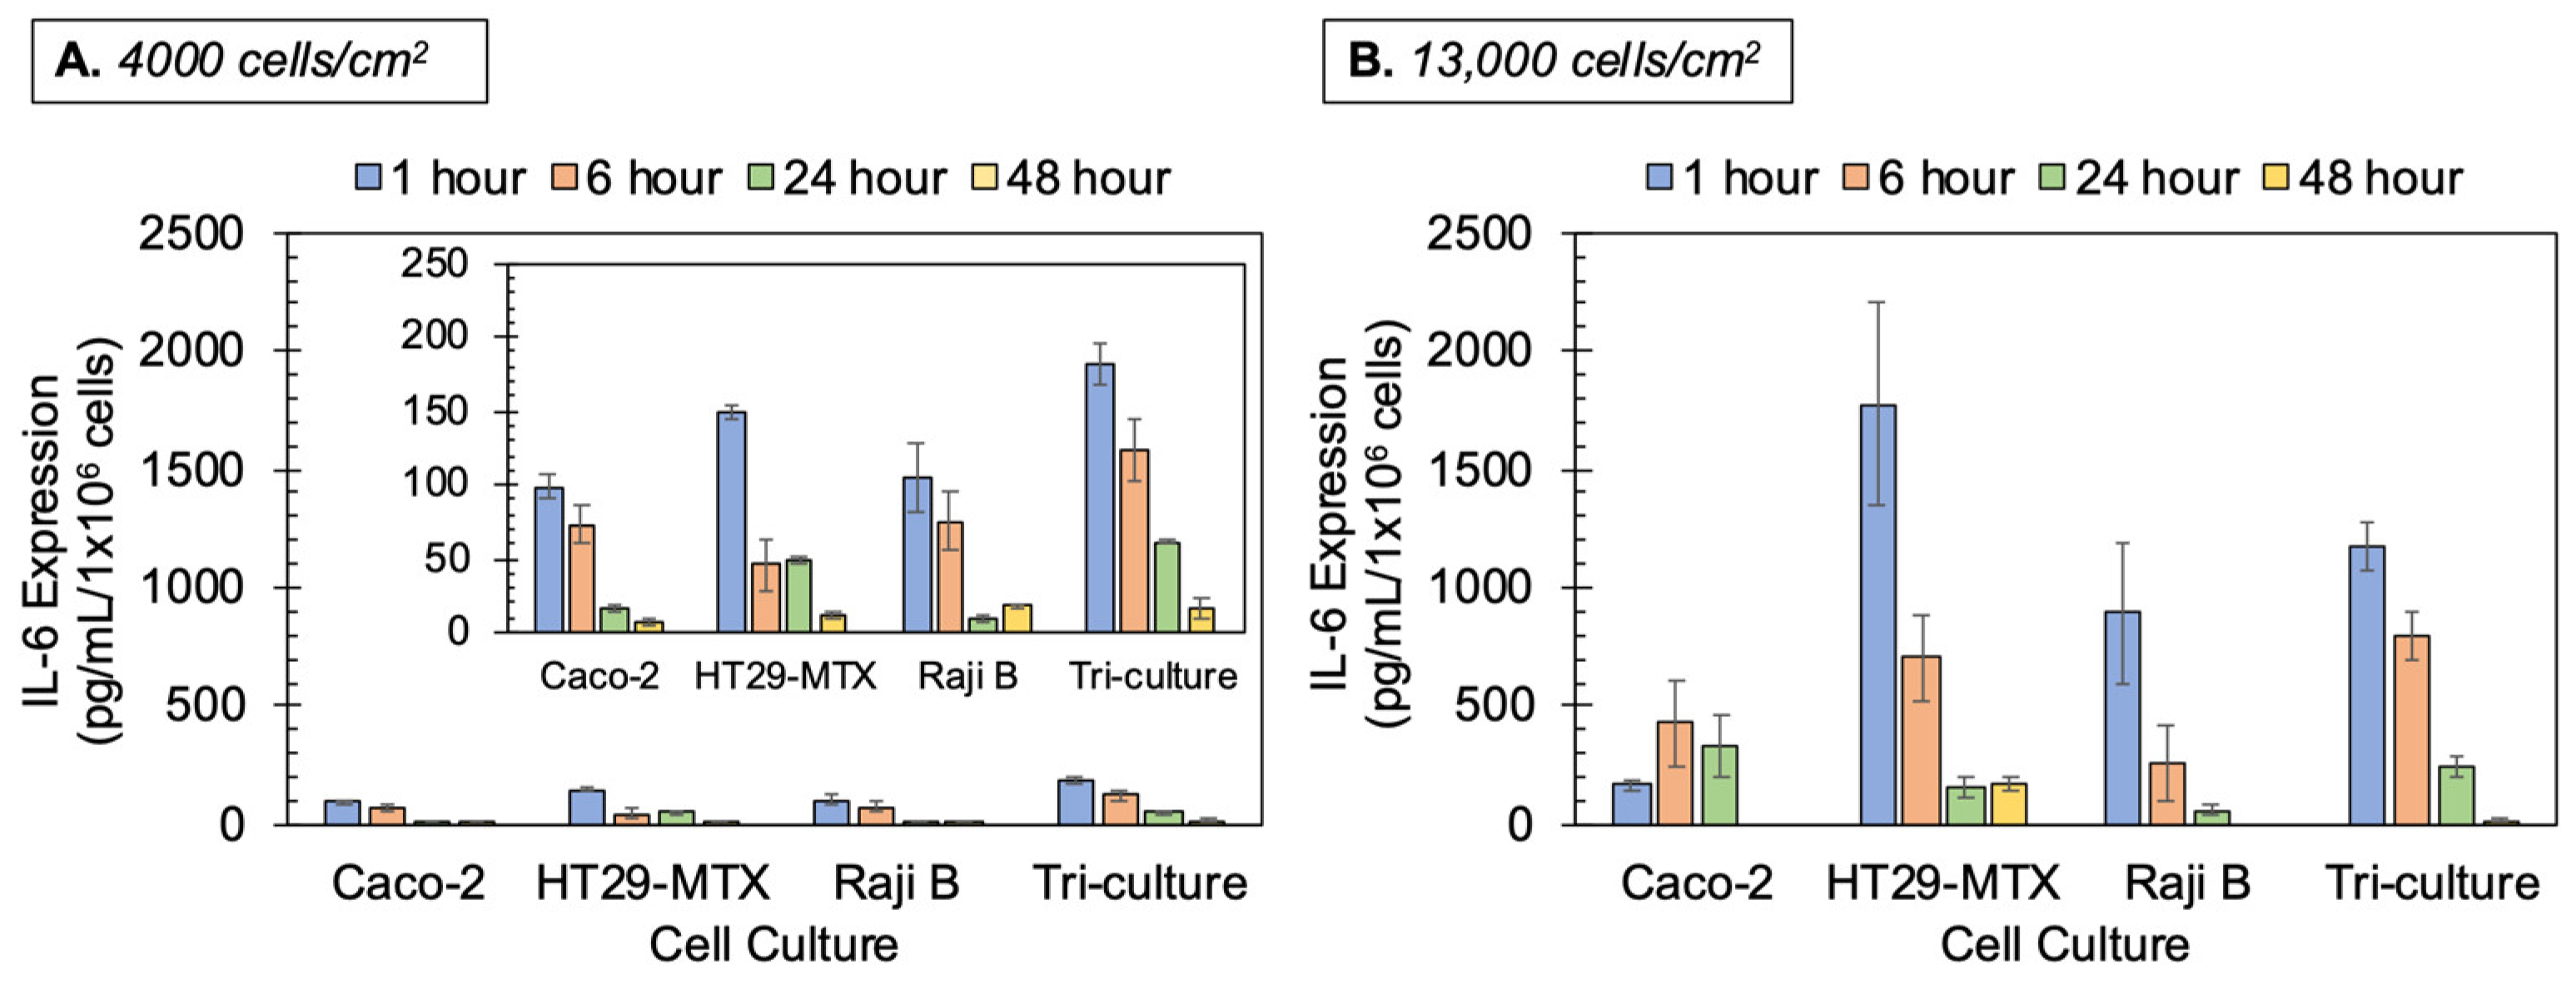
3.4. Cytokine/Chemokine Production

IL-6 concentration was measured as an indicator of pro-inflammatory response (Figure 4). The individual monocultures, as well as the triple cell culture, used in the study were measured at two different seeding densities (4000 cells/cm2 and 13,000 cells/cm2). IL-6 is an early-stage marker for inflammatory response, with Caco-2 and Raji B cells not expressing similar levels of IL-6 as HT29-MTX cells until later timepoints (i.e., 24 and 48 h). This trend is not apparent at lower seeding densities where IL-6 production is minimal across all models and timepoints (183 pg/mL). Interestingly, at the highest density tested, the triple cell culture model depicts a median response between the three cells rather than a synergistic output. At higher densities, the HT29-MTX cells showed high expression of IL-6 at 1-h timepoint (1776 pg/mL) and shows progressively lower expression until 24 h (158 pg/mL) where IL-6 secretion levels off, suggesting early-stage inflammatory markers involved in mucus producing goblet cells (Figure 4B). While Raji B cells followed the same trend of decreasing IL-6 production over time, Caco-2 cells showed increased levels of IL-6 at 6- and 24-h timepoints (428 and 334 pg/mL, respectively) compared to the 1-h timepoint (166 pg/mL). The triple cell culture model shows decreasing IL-6 production as time progresses (1176 pg/mL at 1 h and 17.3 at 48 h pg/mL, respectively). This result is a similar trend to that observed in the Raji B monoculture and the HT29-MTX monoculture.

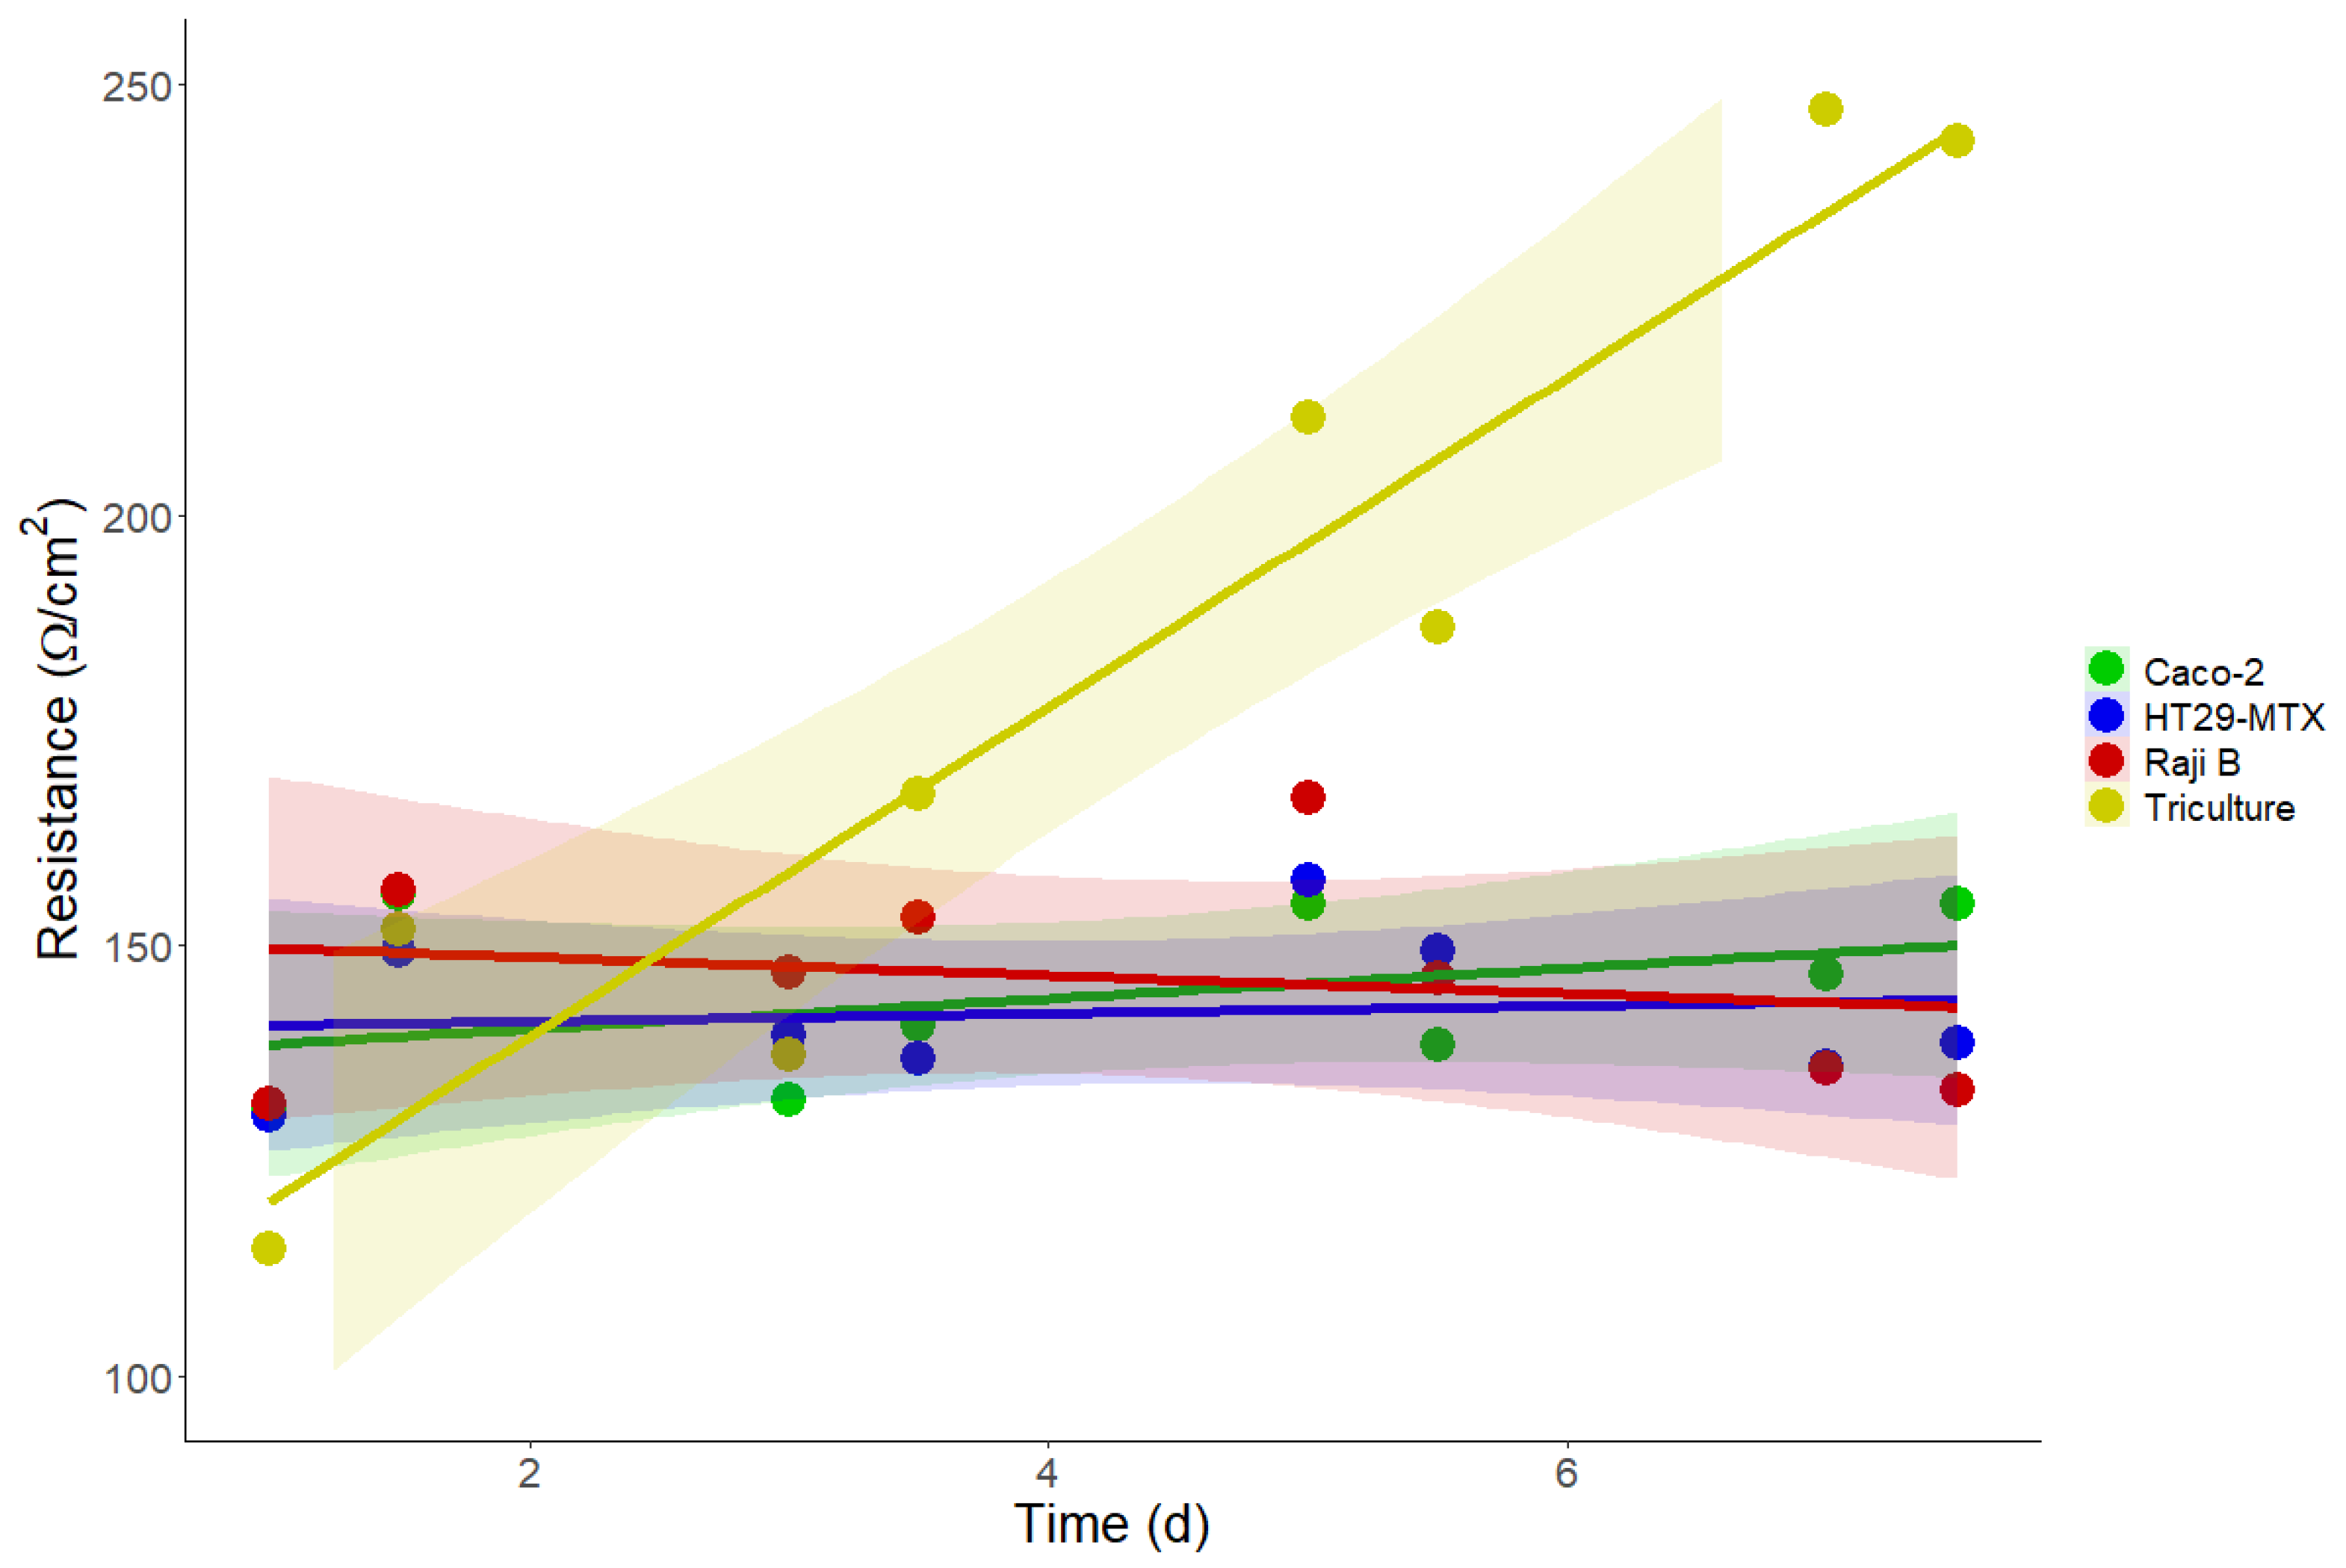
3.5. Barrier Integrity

Figure 5 shows monolayer integrity, as measured by TEER. Electrical resistance increased with the triple cell culture model, while monocultures stayed relatively consistent throughout the 7 days of readings. The increase in the triple cell culture model was measured on day 3 of readings and showed a sustained increase throughout the remaining measurements. TEER, as a measure of barrier integrity, showed that electrical resistance of the monolayers is statistically insignificant between Caco-2 and HT29-MTX cells over the 7-day study, suggesting that the monolayer cellular communication did not increase over the time of 7 days after confluency (Figure 5). Conversely, resistance in the triple cell culture increased over the same time period compared to monolayers, demonstrating better cellular communication in the differentiated model [48].

4. Discussion

Globally, reducing animals used in pharmacological and toxicological testing is a priority. Alternative methods, such as in vitro co-culture models, are fundamental in addressing this reduction and for expediting the process of testing, validating, and mass-producing novel therapeutics. The United States EPA has vowed to reduce requests and funding of mammal studies by 30% by 2025; the agency plans to eliminate all mammal study requests by 2035. Utilizing alternative methods, such as AOP development or in silico approaches as well as in vitro culture models not only allows for a better recapitulation of in vivo readouts but can aid in the immediate need to improve testing methods for the ever-increasing amount of chemicals in production and use.
The use of monolayers is still dominant today despite poorly imitating in vivo conditions. Monocultures do not properly represent an in vivo model system in terms of tissue architectures or biochemical signaling [49,50,51]. While current literature acknowledges the former (i.e., tissue architecture), only a few in vitro based papers discuss the shortcomings of the latter (i.e., biochemical signaling) [52,53]. Correlations among in vitro to in vivo model systems are largely dependent upon the cell-type, organ system, and animal selected for the study. Due to the diversity of the intestinal tract, it is apparent that single monolayers of gut epithelial cells are not sophisticated enough to assess biological responses accurately. The triple cell culture model can better assess immunomodulatory effects after ingestion of nanomaterials [54].
To get a better understanding of inflammation and subsequent biochemical responses, this study focused on the proinflammatory cytokine interleukin-6 (IL-6) [55]. It has been shown that IL-6 activates STAT 3, a transcription factor which leads to tissue repair, differentiation, cell survival, migration, and cell death [56,57]. Importantly, IL-6 is necessary for the differentiation of Caco-2 cells to enterocyte-like phenotype as well as to inflammation after tissue injury [58,59]. In the case of pathophysiology, IL-6 plays an important role in the ability of intestinal cancers to progress and should be considered a fundamental cytokine when testing for initial inflammatory responses [56]. Inflammatory response measured by IL-6 concentration shows that there are differential measurements in biochemical signaling among monocultures versus triple cell cultures of the same cell-types. The monocultures consistently produce different baseline expression, by either up- or down-regulating depending on the cell-type, of key signature biomarkers relative to the triple cell culture system.
When comparing results measured from in vitro model systems to those collected from in vivo models, there are considerable differences. In vivo models have clearance mechanisms, innate and adaptive immune systems, and three-dimensionality. While in vitro systems do not have these features, they can recapitulate relevant aspects of in vivo models using specialized cell culture scaffolds and multiple human cell-types. Human cells can express cytokines and chemokines at a level concordant with humans if cell seeding density and cell-type ratios are purposefully applied and proper cell differentiation has occurred [60]. For this study, scanning electron microscopy proved to be useful in observing how cells interact with each other as well as qualifying individual cell-type differentiation and effects of seeding densities. SEM was able to validate Caco-2 enterocyte differentiation to Caco-2 M-cell phenotype [11]. As previously demonstrated by Araujo et al., utilizing SEM to observe loss of microvilli and cell invagination is sufficient to identify M-cell differentiated cells [28].
Along with cytokines and chemokines, other immunoregulatory factors, such as reactive oxygen species (ROS), are important indicators of cell stress and potential intestinal pathologies (e.g., irritable bowel disease). Importantly, ROS is strongly associated with tumorigenesis via increased survivability, genetic instability and damage, and loss of tumor-suppressor gene functionality [61]. Therefore, quantifying basal rates of ROS production prior to incorporating any exposure is paramount to fully understanding in vitro intestinal models and their ability to recognize perturbations in ROS levels [62]. We demonstrate that seeding density affects the ROS production. Lower densities showed elevated levels of ROS when compared to higher densities. This result indicates that on a per-cell basis, cells showed higher quantities of ROS. In other words, lower seeding densities induce high cell stress.
HT29-MTX cells express higher basal levels of IL-6 at early timepoints compared to Caco-2 or Raji B cells. Previous work has shown HT29 cells have increased sensitivity to local stimulation, which could account for the marked increase in early timepoint secretion of IL-6 [63]. Activation, maturation, survival, and proliferation of B cells requires binding to the B cell receptor (BCR) [64]. As such, Raji B cells are inactive in the described model system translating to an insignificant amount of secreted cytokines. If Raji B cells are activated, then a significant amount of cytokines would be readily produced [65,66]. As B cells showed no increase in cytokine expression in this study, the triple cell culture proved to be a suitable model as it considers the expressions of multiple cell-types simultaneously. Cellular communication is related to increased formation of tight junctions which in turn increases resistance over time. Studies using Caco-2 and HT29-MTX co-cultures, without incorporating Raji B cells, are unable to show the significance of M-cell differentiation from Caco-2 [10,67,68]. M-cells allow for better representation of intestinal barrier integrity while simultaneously incorporating a crucial cell-type associated with absorption and antigen retrieval and subsequent contact with immune cells. It is the interaction among a triple cell culture that can serve as a representative model for in vivo systems. These results are in concordance with Susewind et al. which showed that the monocultures and triple cell culture increased in confluency over time; however, the triple cell culture increased in resistance at a faster rate when compared to the individual monocultures [69]. Further research in TEER endpoint analyses and subsequent data interpretation is needed to fully exploit the utility of this functional parameter [28,34].
Hilgendorf et al. showed that the co-culture of Caco-2 and HT29-MTX offers a suitable option for testing drug permeability properties over traditional in vivo testing regimes [34]. Co-cultures are more robust in terms of barrier integrity as compared to simple monocultures of either cell-type cultured by itself. The authors state that while the co-culture model can give a preliminary qualitative indication of permeability, it falls short of quantifying the amount or rate of material transfer. Because the model lacks immune cells, probing for pro-inflammatory biomarkers is not a suitable auxiliary to measuring barrier integrity.
As no mammalian system consists of a single cell-type, it is becoming increasing evident that to properly mimic the complexity of in vivo cellular interactions, in vitro models must include multiple cell types and proper cellular architecture in order to better translate from in vitro to in vivo outcomes. Models for the varying compartments of the lungs [70,71], brain [72], liver [73], bone [74], and heart [75] have already been investigated and determined to be better mimics of in vivo responses. Importantly, these models all highlight the need to recapitulate not only the anatomical cell-types but also their architecture to provide optimal biochemical (i.e., gene, protein, etc.) interactions between and amongst cells within the system. By furthering the understanding of how these model systems function at baseline (prior to exposure), the ability to interpret and translate results from in vitro to in vivo systems improves.

5. Conclusions

There is a need to improve the sophistication of in vitro models for safety testing in the drug discovery pipeline. In parallel, there is also a need to better characterize multi-culture systems and how density can translate into better biomimicry to a human response. We show that oxidative stress (ROS), inflammation (IL-6), and mitochondrial activity (MitoTracker™ Red CMXRos) are increased on a per cell basis at lower seeding densities whereas metabolic activity is decreased at lower densities. In vitro models ought to be predictive of both biochemical endpoints as well as physiological outcomes. While difficult, if not impossible, to recapitulate in vivo responses using in vitro models, utilizing three dimensional models, allows for assessments of critical outcomes and endpoints when the culture system is optimized to mimic the target organ system. This type of design can aid in assessing nanomaterial-enabled cancer theranostics after ingestion through the modulation of certain biochemical and immunological functions. International consensus to reduce and replace animal models has required in vitro systems to become more complex (i.e., at least two cell types). This increased complexity better reproduces in vivo biological responses across organ systems and allows for more accurate in vitro to in vivo correlations than the traditional monoculture model.

Author Contributions

Conceptualization, C.M.S., J.D.E., J.L. and J.A.S.; methodology, M.G., S.H.P., M.R.M., and H.L.; software, M.G., S.H.P., M.R.M., and H.L.; validation, M.G. and S.H.P.; formal analysis, M.G., S.H.P., M.R.M., H.L., and C.M.S.; investigation, M.G., S.H.P., M.R.M., and H.L.; resources, C.M.S., J.D.E., and J.A.S.; writing—original draft preparation, M.G., S.H.P., M.R.M., H.L., and C.M.S.; writing—review and editing, M.G., S.H.P., J.D.E., J.A.S., and C.M.S.; project administration, C.M.S.; funding acquisition, C.M.S. and J.A.S. All authors have read and agreed to the published version of the manuscript.

Funding

This research was funded by Vireo Advisors, LLC and P3 Nano, grant number 32370206.

Institutional Review Board Statement

Not applicable.

Informed Consent Statement

Not Applicable.

Data Availability Statement

The data presented in this study are available on request from the corresponding author. The data are not publicly available due to there being no appropriate database.

Acknowledgments

The authors also thank Erica Bruce (BU) for access to EVOM equipment and Bernd Zechmann (BU) for access to microscopes in the Center for Microscopy and Imaging.

Conflicts of Interest

The authors declare no conflict of interest.

References

  1. Vandamme, T.F. Use of rodents as models of human diseases. J. Pharm. Bioallied Sci. 2014, 6, 2–9. [Google Scholar] [CrossRef] [PubMed]
  2. Hugenholtz, F.; de Vos, W.M. Mouse models for human intestinal microbiota research: A critical evaluation. Cell. Mol. Life Sci. 2018, 75, 149–160. [Google Scholar] [CrossRef] [Green Version]
  3. Nguyen, T.L.A.; Vieira-Silva, S.; Liston, A.; Raes, J. How informative is the mouse for human gut microbiota research? Dis. Model. Mech. 2015, 8, 1–16. [Google Scholar] [CrossRef] [PubMed] [Green Version]
  4. Treuting, P.M.; Dintzis, S.M.; Montine, K.S. Comparative Anatomy and Histology: A Mouse, Rat, and Human Atlas; Trueting, P.M., Montine, K.S., Dintzis, S.M., Eds.; Elsevier: London, UK, 2017. [Google Scholar]
  5. Hudu, S.A.; Alshrari, A.S.; Syahida, A.; Sekawi, Z. Cell Culture, Technology: Enhancing the Culture of Diagnosing Human Diseases. J. Clin. Diagn. Res. 2016, 10, DE01–DE05. [Google Scholar] [CrossRef]
  6. Pamies, D.; Hartung, T. 21st Century Cell Culture for 21st Century Toxicology. Chem. Res. Toxicol. 2017, 30, 43–52. [Google Scholar] [CrossRef] [Green Version]
  7. Ballard, S.T.; Hunter, J.H.; Taylor, A.E. Regulation of Tight-Junction Permeability during Nutrient Absorption Across the Intestinal Epithelium. Annu. Rev. Nutr. 1995, 15, 35–55. [Google Scholar] [CrossRef] [PubMed]
  8. Nusrat, A.; Turner, J.R.; Madara, J.L., IV. Regulation of tight junctions by extracellular stimuli: Nutrients, cytokines, and immune cells. Am. J. Physiol. Liver Physiol. 2000, 279, G851–G857. [Google Scholar] [CrossRef] [PubMed] [Green Version]
  9. Odenwald, M.A.; Turner, J.R. The intestinal epithelial barrier: A therapeutic target? Nat. Rev. Gastroenterol. Hepatol. 2017, 14, 9. [Google Scholar] [CrossRef] [PubMed]
  10. Dillon, A.; Lo, D.D. M Cells: Intelligent Engineering of Mucosal Immune Surveillance. Front. Immunol. 2019, 10, 1499. [Google Scholar] [CrossRef]
  11. García-Rodríguez, A.; Vila, L.; Cortés, C.; Hernández, A.; Marcos, R. Exploring the usefulness of the complex in vitro intestinal epithelial model Caco-2/HT29/Raji-B in nanotoxicology. Food Chem. Toxicol. 2018, 113, 162–170. [Google Scholar] [CrossRef]
  12. Berg, J.M.; Ho, S.; Hwang, W.; Zebda, R.; Cummins, K.; Soriaga, M.P.; Taylor, R.; Guo, B.; Sayes, C.M. Internalization of carbon black and maghemite iron oxide nanoparticle mixtures leads to oxidant production. Chem. Res. Toxicol. 2010, 23, 1874–1882. [Google Scholar] [CrossRef]
  13. Doherty, G.J.; McMahon, H.T. Mechanisms of Endocytosis. Annu. Rev. Biochem. 2009, 78, 857–902. [Google Scholar] [CrossRef] [Green Version]
  14. Sahay, G.; Alakhova, D.Y.; Kabanov, A.V. Endocytosis of nanomedicines. J. Control. Release 2010, 145, 182–195. [Google Scholar] [CrossRef] [Green Version]
  15. Brombacher, F. The role of interleukin-13 in infectious diseases and allergy. Bioessays 2000, 22, 646–656. [Google Scholar] [CrossRef]
  16. Ferrick, D.A.; Schrenzel, M.D.; Mulvania, T.; Hsieh, B.; Ferlin, W.G.; Lepper, H. Differential production of interferon-γ and interleukin-4 in response to Th1-and Th2-stimulating pathogens by γδ T cells in vivo. Nature 1995, 373, 255–257. [Google Scholar] [CrossRef] [PubMed]
  17. Diamond, M.S.; Edgil, D.; Roberts, T.G.; Lu, B.; Harris, E. Infection of Human Cells by Dengue Virus Is Modulated by Different Cell Types and Viral Strains. J. Virol. 2000, 74, 7814–7823. [Google Scholar] [CrossRef] [Green Version]
  18. Rosser, E.C.; Mauri, C. Regulatory B Cells: Origin, Phenotype, and Function. Immunity 2015, 42, 607–612. [Google Scholar] [CrossRef] [PubMed] [Green Version]
  19. Dethlefsen, L.; Eckburg, P.B.; Bik, E.M.; Relman, D.A. Assembly of the human intestinal microbiota. Trends Ecol. Evol. 2006, 21, 517–523. [Google Scholar] [CrossRef]
  20. Kau, A.L.; Ahern, P.P.; Griffin, N.W.; Goodman, A.L.; Gordon, J.I. Human nutrition, the gut microbiome and the immune system. Nat. Cell Biol. 2011, 474, 327–336. [Google Scholar] [CrossRef] [Green Version]
  21. Barbara, P.D.S.; Brink, G.R.V.D.; Roberts, D.J. Development and differentiation of the intestinal epithelium. Cell. Mol. Life Sci. 2003, 60, 1322–1332. [Google Scholar] [CrossRef] [PubMed]
  22. Behrens, I.; Stenberg, P.; Artursson, P.; Kissel, T. Transport of Lipophilic Drug Molecules in a New Mucus-Secreting Cell Culture Model Based on HT29-MTX Cells. Pharm. Res. 2001, 18, 1138–1145. [Google Scholar] [CrossRef]
  23. Li, L.; Nadanaciva, S.; Berger, Z.; Shen, W.; Paumier, K.; Schwartz, J.; Mou, K.; Loos, P.; Milici, A.J.; Dunlop, J.; et al. Human A53T α-Synuclein Causes Reversible Deficits in Mitochondrial Function and Dynamics in Primary Mouse Cortical Neurons. PLoS ONE 2013, 8, e85815. [Google Scholar] [CrossRef]
  24. Mahler, G.J.; Shuler, M.L.; Glahn, R.P. Characterization of Caco-2 and HT29-MTX cocultures in an in vitro digestion/cell culture model used to predict iron bioavailability. J. Nutr. Biochem. 2009, 20, 494–502. [Google Scholar] [CrossRef]
  25. Bhatia, S.N.; Balis, U.J.; Yarmush, M.L.; Toner, M. Effect of cell–cell interactions in preservation of cellular phenotype: Cocultivation of hepatocytes and nonpa-renchymal cells. FASEB J. 1999, 13, 1883–1900. [Google Scholar] [CrossRef] [Green Version]
  26. Hammoudi, T.M.; Rivet, C.A.; Kemp, M.L.; Lu, H.; Temenoff, J.S. Three-Dimensional In Vitro Tri-Culture Platform to Investigate Effects of Crosstalk Between Mesenchymal Stem Cells, Osteoblasts, and Adipocytes. Tissue Eng. Part A 2012, 18, 1686–1697. [Google Scholar] [CrossRef] [Green Version]
  27. Schmeichel, K.L.; Bissell, M.J. Modeling tissue-specific signaling and organ function in three dimensions. J. Cell Sci. 2003, 116, 2377–2388. [Google Scholar] [CrossRef] [PubMed] [Green Version]
  28. Antunes, F.; Andrade, F.; Araújo, F.; Ferreira, D.; Sarmento, B. Establishment of a triple co-culture in vitro cell models to study intestinal absorption of peptide drugs. Eur. J. Pharm. Biopharm. 2013, 83, 427–435. [Google Scholar] [CrossRef] [PubMed]
  29. Boland, C.R.; Montgomery, C.K.; Kim, Y.S. Alterations in human colonic mucin occurring with cellular differentiation and malignant transformation. Proc. Natl. Acad. Sci. USA 1982, 79, 2051–2055. [Google Scholar] [CrossRef] [Green Version]
  30. Gossett, D.R.; Tse, H.T.K.; Lee, S.A.; Ying, Y.; Lindgren, A.G.; Yang, O.O.; Rao, J.; Clark, A.T.; Di Carlo, D. Hydrodynamic stretching of single cells for large population mechanical phenotyping. Proc. Natl. Acad. Sci. USA 2012, 109, 7630–7635. [Google Scholar] [CrossRef] [PubMed] [Green Version]
  31. Tourovskaia, A.; Figueroa-Masot, X.; Folch, A. Differentiation-on-a-chip: A microfluidic platform for long-term cell culture studies. Lab Chip 2005, 5, 14–19. [Google Scholar] [CrossRef] [PubMed]
  32. Song, W.; Musetti, S.N.; Huang, L. Nanomaterials for cancer immunotherapy. Biomaterials 2017, 148, 16–30. [Google Scholar] [CrossRef]
  33. Arranja, A.G.; Pathak, V.; Lammers, T.; Shi, Y. Tumor-targeted nanomedicines for cancer theranostics. Pharmacol. Res. 2017, 115, 87–95. [Google Scholar] [CrossRef] [Green Version]
  34. Hilgendorf, C.; Spahn-Langguth, H.; Regårdh, C.G.; Lipka, E.; Amidon, G.L.; Langguth, P. Caco-2 versus Caco-2/HT29-MTX co-cultured cell lines: Permeabilities via diffusion, inside- and out-side-directed carrier-mediated transport. J. Pharm. Sci. 2000, 89, 63–75. [Google Scholar] [CrossRef]
  35. Srinivasan, B.; Kolli, A.R.; Esch, M.B.; Abaci, H.E.; Shuler, M.L.; Hickman, J.J. TEER Measurement Techniques for In Vitro Barrier Model Systems. J. Lab. Autom. 2015, 20, 107–126. [Google Scholar] [CrossRef] [PubMed] [Green Version]
  36. Epstein, M.A.; Barr, Y.M. Characteristics and mode of growth of a tissue culture strain (EB1) of human lymphoblasts from Burkitt’s lymphoma. J. Natl. Cancer Inst. 1965, 34, 231–240. [Google Scholar] [CrossRef]
  37. Peterson, L.W.; Artis, D. Intestinal epithelial cells: Regulators of barrier function and immune homeostasis. Nat. Rev. Immunol. 2014, 14, 141–153. [Google Scholar] [CrossRef] [PubMed]
  38. Mayo, J.J.; Kohlhepp, P.; Zhang, D.; Winzerling, J.J. Effects of sham air and cigarette smoke on A549 lung cells: Implications for iron-mediated oxidative damage. Am. J. Physiol. Lung Cell. Mol. Physiol. 2004, 286, L866–L876. [Google Scholar] [CrossRef] [Green Version]
  39. Mosmann, T. Rapid colorimetric assay for cellular growth and survival: Application to proliferation and cytotoxicity assays. J. Immunol. Methods 1983, 65, 55–63. [Google Scholar] [CrossRef]
  40. Sayes, C.M.; Reed, K.L.; Warheit, D.B. Assessing Toxicity of Fine and Nanoparticles: Comparing In Vitro Measurements to In Vivo Pulmonary Toxicity Profiles. Toxicol. Sci. 2007, 97, 163–180. [Google Scholar] [CrossRef] [Green Version]
  41. Walzog, B.; Weinmann, P.; Jeblonski, F.; Scharffetter-Kochanek, K.; Bommert, K.; Gaehtgens, P. A role for beta(2) integrins (CD11/CD18) in the regulation of cytokine gene expression of polymorphonuclear neutrophils during the inflammatory response. FASEB J. 1999, 13, 1855–1865. [Google Scholar] [CrossRef] [PubMed]
  42. González-Arias, C.A.; Marín, S.; Rojas-García, A.E.; Sanchis, V.; Ramos, A.J. UPLC-MS/MS analysis of ochratoxin A metabolites produced by Caco-2 and HepG2 cells in a co-culture system. Food Chem. Toxicol. 2017, 109, 333–340. [Google Scholar] [CrossRef] [PubMed] [Green Version]
  43. Shao, Y.; Wolf, P.G.; Guo, S.; Guo, Y.; Gaskins, H.R.; Zhang, B. Zinc enhances intestinal epithelial barrier function through the PI3K/AKT/mTOR signaling pathway in Caco-2 cells. J. Nutr. Biochem. 2017, 43, 18–26. [Google Scholar] [CrossRef] [PubMed]
  44. Lujan, H.; Criscitiello, M.F.; Hering, A.S.; Sayes, C.M. Refining In Vitro Toxicity Models: Comparing Baseline Characteristics of Lung Cell Types. Toxicol. Sci. 2019, 168, 302–314. [Google Scholar] [CrossRef]
  45. Hochella, M.F.; Mogk, D.W.; Ranville, J.; Allen, I.C.; Luther, G.W.; Marr, L.C.; McGrail, B.P.; Murayama, M.; Qafoku, N.P.; Rosso, K.M.; et al. Natural, incidental, and engineered nanomaterials and their impacts on the Earth system. Science 2019, 363, 1–10. [Google Scholar] [CrossRef] [Green Version]
  46. Piperigkou, Z.; Karamanou, K.; Engin, A.B.; Gialeli, C.; Docea, A.O.; Vynios, D.H.; Pavão, M.S.; Golokhvast, K.S.; Shtilman, M.I.; Argiris, A.; et al. Emerging aspects of nanotoxicology in health and disease: From agriculture and food sector to cancer therapeutics. Food Chem. Toxicol. 2016, 91, 42–57. [Google Scholar] [CrossRef] [Green Version]
  47. Carpenter, C.L. Actin cytoskeleton and cell signaling. Crit. Care Med. 2000, 28, N94–N99. [Google Scholar] [CrossRef]
  48. Chen, S.; Einspanier, R.; Schoen, J. Transepithelial electrical resistance (TEER): A functional parameter to monitor the quality of oviduct epithelial cells cultured on filter supports. Histochem. Cell Biol. 2015, 144, 509–515. [Google Scholar] [CrossRef] [PubMed] [Green Version]
  49. Mazzoleni, G.; Di Lorenzo, D.; Steimberg, N. Modelling tissues in 3D: The next future of pharmaco-toxicology and food research? Genes Nutr. 2008, 4, 13–22. [Google Scholar] [CrossRef] [PubMed] [Green Version]
  50. Page, H.; Flood, P.; Reynaud, E.G. Three-dimensional tissue cultures: Current trends and beyond. Cell Tissue Res. 2012, 352, 123–131. [Google Scholar] [CrossRef] [PubMed]
  51. Yamada, K.M.; Cukierman, E. Modeling Tissue Morphogenesis and Cancer in 3D. Cell 2007, 130, 601–610. [Google Scholar] [CrossRef] [PubMed] [Green Version]
  52. Fatehullah, A.; Tan, S.H.; Barker, N. Organoids as an in vitro model of human development and disease. Nat. Cell Biol. 2016, 18, 246–254. [Google Scholar] [CrossRef] [PubMed] [Green Version]
  53. Katt, M.E.; Placone, A.L.; Wong, A.D.; Xu, Z.S.; Searson, P.C. In Vitro Tumor Models: Advantages, Disadvantages, Variables, and Selecting the Right Platform. Front. Bioeng. Biotechnol. 2016, 4, 12. [Google Scholar] [CrossRef] [PubMed]
  54. Pradhan, S.H.; Mulenos, M.R.; Steele, L.R.; Gibb, M.; Ede, J.D.; Ong, K.J.; Shatkin, J.A.; Sayes, C.M. Physical, chemical, and toxicological characterization of fibrillated forms of cellulose using an in vitro gas-trointestinal digestion and co-culture model. Toxicol. Res. 2020, 1, 12. [Google Scholar]
  55. Keshavan, S.; Calligari, P.; Stella, L.; Fusco, L.; Delogu, L.G.; Fadeel, B. Nano-bio interactions: A neutrophil-centric view. Cell Death Dis. 2019, 10, 1–11. [Google Scholar] [CrossRef] [PubMed] [Green Version]
  56. Serrano, C.; Galán, S.; Rubio, J.F.; Candelario-Martínez, A.; Montes-Gómez, A.E.; Chánez-Paredes, S.; Cedillo-Barrón, L.; Schnoor, M.; Meraz-Ríos, M.A.; Villegas-Sepúlveda, N.; et al. Compartmentalized Response of IL-6/STAT3 Signaling in the Colonic Mucosa Mediates Colitis Development. J. Immunol. 2019, 202, 1239–1249. [Google Scholar] [CrossRef]
  57. Bollrath, J.; Phesse, T.J.; von Burstin, V.A.; Putoczki, T.; Bennecke, M.; Bateman, T.; Nebelsiek, T.; Lundgren-May, T.; Canli, Ö.; Schwitalla, S. gp130-mediated Stat3 activation in enterocytes regulates cell survival and cell-cycle progression during coli-tis-associated tumorigenesis. Cancer Cell 2009, 15, 91–102. [Google Scholar] [CrossRef] [Green Version]
  58. Molmenti, E.; Ziambaras, T.; Perlmutter, D. Evidence for an acute phase response in human intestinal epithelial cells. J. Biol. Chem. 1993, 268, 14116–14124. [Google Scholar] [CrossRef]
  59. Kuhn, K.A.; Manieri, N.A.; Liu, T.-C.; Stappenbeck, T.S. IL-6 Stimulates Intestinal Epithelial Proliferation and Repair after Injury. PLoS ONE 2014, 9, e114195. [Google Scholar] [CrossRef] [PubMed] [Green Version]
  60. Wu, Y.-K.; Tu, Y.-K.; Yu, J.; Cheng, N.-C. The Influence of Cell Culture Density on the Cytotoxicity of Adipose-Derived Stem Cells Induced by L-Ascorbic Acid-2-Phosphate. Sci. Rep. 2020, 10, 1–11. [Google Scholar] [CrossRef]
  61. Moloney, J.N.; Cotter, T.G. ROS signalling in the biology of cancer. Semin. Cell Dev. Biol. 2018, 80, 50–64. [Google Scholar] [CrossRef]
  62. Rezaie, A.; Parker, R.D.; Abdollahi, M. Oxidative stress and pathogenesis of inflammatory bowel disease: An epiphenome-non or the cause? Dig. Dis. Sci. 2007, 52, 2015–2021. [Google Scholar] [CrossRef]
  63. Deplancke, B.; Gaskins, H.R. Microbial modulation of innate defense: Goblet cells and the intestinal mucus layer. Am. J. Clin. Nutr. 2001, 73, 1131S–1141S. [Google Scholar] [CrossRef] [Green Version]
  64. Porto, J.M.D. B cell antigen receptor signaling 101. Mol. Immunol. 2004, 41, 599–613. [Google Scholar] [CrossRef]
  65. Dixon, F.J. Immune Complex Diseases. J. Investig. Dermatol. 1972, 59, 413–415. [Google Scholar] [CrossRef] [PubMed] [Green Version]
  66. Moreland, L.W. Rheumatology and Immunology Therapy: A to Z Essentials; Moreland, L.W., Ed.; Springer: Berlin, Germany, 2004. [Google Scholar]
  67. Chen, X.-M.; Elisia, I.; Kitts, D.D. Defining conditions for the co-culture of Caco-2 and HT29-MTX cells using Taguchi design. J. Pharmacol. Toxicol. Methods 2010, 61, 334–342. [Google Scholar] [CrossRef] [PubMed]
  68. Ferraretto, A.; Bottani, M.; De Luca, P.; Cornaghi, L.; Arnaboldi, F.; Maggioni, M.; Fiorilli, A.; Donetti, E. Morphofunctional properties of a differentiated Caco2/HT-29 co-culture as an in vitro model of human in-testinal epithelium. Biosci. Rep. 2018, 38, 1–16. [Google Scholar] [CrossRef] [PubMed] [Green Version]
  69. Susewind, J.; de Souza Carvalho-Wodarz, C.; Repnik, U.; Collnot, E.M.; Schneider-Daum, N.; Griffiths, G.W.; Lehr, C.M. A 3D co-culture of three human cell lines to model the inflamed intestinal mucosa for safety testing of nano-materials. Nanotoxicology 2016, 10, 53–62. [Google Scholar]
  70. Ehrmann, S.; Schmid, O.; Darquenne, C.; Rothen-Rutishauser, B.; Sznitman, J.; Yang, L.; Barosova, H.; Vecellio, L.; Mitchell, J.; Heuze-Vourc’H, N. Innovative preclinical models for pulmonary drug delivery research. Expert Opin. Drug Deliv. 2020, 17, 463–478. [Google Scholar] [CrossRef]
  71. Rothen-Rutishauser, B.M.; Kiama, S.G.; Gehr, P. A Three-Dimensional Cellular Model of the Human Respiratory Tract to Study the Interaction with Particles. Am. J. Respir. Cell Mol. Biol. 2005, 32, 281–289. [Google Scholar] [CrossRef] [PubMed]
  72. Andjelkovic, A.V.; Stamatovic, S.M.; Phillips, C.M.; Martinez-Revollar, G.; Keep, R.F. Modeling blood–brain barrier pathology in cerebrovascular disease in vitro: Current and future para-digms. Fluids Barriers CNS 2020, 17, 1–21. [Google Scholar] [CrossRef] [PubMed]
  73. Lee, S.W.; Jung, D.J.; Jeong, G.S. Gaining New Biological and Therapeutic Applications into the Liver with 3D In Vitro Liver Models. Tissue Eng. Regen. Med. 2020, 17, 731–745. [Google Scholar] [CrossRef] [PubMed]
  74. Rao, S.R.; Edwards, C.M.; Edwards, J.R. Modeling the human bone–tumor niche: Reducing and replacing the need for animal data. JBMR Plus 2020, 4, e10356. [Google Scholar] [CrossRef] [PubMed] [Green Version]
  75. Zhao, Z.; Vizetto-Duarte, C.; Moay, Z.K.; Setyawati, M.I.; Rakshit, M.; Kathawala, M.H.; Ng, K.W. Composite Hydrogels in Three-Dimensional in vitro Models. Front. Bioeng. Biotechnol. 2020, 8, 611. [Google Scholar] [CrossRef] [PubMed]
Figure 1. (A) Scanning electron micrographs of the triple cell culture. C(M) is identified as an M-cell, C(E) is identified as a Caco-2 cell, H is identified as an HT29-MTX cell, and R is identified as a Raji B cell. (BE) SEMs focused on HT29-MTX goblet cell (B), Caco-2 enterocyte (C), Caco-2 M-cell (D), and Raji B (B-cell) (E). Scale bars represent 30 µm.
Applsci 11 02113 g001
Figure 2. Confocal microscopy of (A) Caco-2, (B) HT29-MTX, and (C) Raji B monolayers and of the (D) triple cell culture. Population densities can be seen in (AD) at 20x, while ultrastructure of the (E) Caco-2, (F) HT29-MTX, (G) Raji B, and (H) triple cell cultures can be seen at 60x. Higher basal rates of mitochondrial activity (MitoTracker™ Red CMXRos), f-actin (ActinGreenTM), and DNA (NucBlueTM) can be seen in monolayers of Raji B and HT29 vs. triple cell cultures. Differences in fluorescence of Caco monolayers and triple cell culture are insignificant. In the triple cell culture, Caco-2 can be identified with a white arrow, HT29-MTX with a yellow arrowhead, and Raji B cells with a white arrowhead. Scale bars represent 30 µm.
Applsci 11 02113 g002
Figure 3. The expression of mitochondrial oxidative stress (as measured by MitoTracker™ Red CMXRos) decreases in Caco-2 cells as seeding density increases. Seeding densities include (A) 4000 cells/cm2, (B) 7000 cells/cm2, (C) 10,000 cells/cm2, and (D) 13,000 cells/cm2. Blue (DAPI) indicates nucleus. Green (F-actin) indicates cytoskeletal structure. (E,F) Metabolic activity, as measured by MTS concentration, of the three individual cell types, as well as the triple cell culture, when seeded at 4000 cells/cm2 versus 13,000 cells/cm2, respectively. (G,H) Reactive oxygen species (ROS) production, as measured by ROS Glo-H2O2, of the three individual cell types, as well as the triple cell culture, when seeded at 4000 cells/cm2 versus 13,000 cells/cm2, respectively. All cells were maintained in standard cell culture conditions (5% CO2, 10% humidity) for 2 days. Experiments were conducted with n = 3 in triplicate (n = 9). Scale bar represents 100 µm.
Applsci 11 02113 g003
Figure 4. Inflammatory response, as measured by IL-6 concentration, of the three individual cell types, as well as the triple cell culture, used in the study. (A) IL-6 concentration of cells seeded at 4000 cells/cm2 normalized per 1 × 10⁶ cells. (B) IL-6 concentration of cells seeded at 13,000 cells/cm2 normalized per 1 × 10⁶ cells. All cells were maintained in standard cell culture conditions (5% CO2, 10% humidity) for 2 days. Experiments were conducted with n = 3 in triplicate (n = 9).
Applsci 11 02113 g004
Figure 5. Monolayer integrity, as measured by transendothelial electrical resistance (TEER), of the three individual cell types, as well as the tri-culture, used in the study. All cells were seeded at the same density (13,000 cells/cm2) and were maintained in standard cell culture conditions (5% CO2, 10% humidity) for 8 days. Experiments were conducted with n = 3 in triplicate (n = 9).
Applsci 11 02113 g005
Publisher’s Note: MDPI stays neutral with regard to jurisdictional claims in published maps and institutional affiliations.

