Abstract
Field monitoring of methane emissions from landfills is of great importance for both environmental concern and economic benefit. This study presents a highly effective method to measure methane emissions from landfills based on tunable diode laser absorption spectroscopy (TDLAS). Methane concentration is obtained by analyzing the absorption spectrum of the laser after passing through the landfill gas. The relationship between methane concentration and the optical signal was calibrated in the laboratory. As the methane concentration increased from 400 ppm to 5000 ppm, the absorption spectrum amplitude increased linearly from 0.0005 to 0.0046. In situ testing of methane emissions at a large-scale landfill in China demonstrated the accuracy of the TDLAS method. The methane concentrations in the well-covered areas were generally below 100 ppm. In the working area or the coverage area with holes, the methane concentration was about 700 ppm. The methane concentration was up to 1900 ppm, where the gas collection pipe is disconnected. Due to to the accuracy and simplicity, the TDLAS method is suitable to detect methane emissions on a large-scale from landfills.
1. Introduction
The world generates 2.01 billion tons of municipal solid waste (MSW) annually with a per capita rate of 0.74 kg/day [1]. By 2030 and 2050, the world is expected to generate 2.59 billion and 3.40 tons of MSW annually, respectively. Around the world, almost 40 percent of MSW is disposed of in landfills. Landfilled MSW contains large amounts of organic matter, which will biodegrade in anaerobic and aerobic conditions to produce large amounts of landfill gas (LFG) [2,3,4,5]. The main components of LFG are methane (volume ratio of 55–60%) and carbon dioxide (volume ratio of 40–45%) [6,7,8,9]. The annual production of LFG in China is about 13.2 billion m3 [10]. Landfill is ranked as the third-largest resource of anthropogenic methane emissions. It has been reported that the annual methane emission from landfills accounted for 22% of the total anthropogenic methane emissions during 2000–2009 [11]. Landfill methane is not only a greenhouse gas, but it also could be reused as a clean fuel for power generation [12,13].
To reduce methane emissions, the surface of landfills is generally covered with a final cover system (i.e., soil layers) or a temporary cover system (i.e., geomembrane). When the landfill is covered well, the gas collection efficiency, which is defined as the ratio of the collected amount of gas to the amount generated, can reach 90% [14]. However, methane emissions from many landfills remain high due to a number of factors, including improper cover structure, holes in geomembrane, uncovered working area, etc. [15,16]. Field monitoring of methane emissions from landfills is of great importance for both environmental concern and economic benefit. The static chamber method (SCM) is most widely used to monitor methane emission flux in landfills due to its simple approach and low-cost [17,18,19]. The principle of SCM is to seal a known volume chamber above a gas-emitting surface such that the emitted gas cannot escape and its accumulated concentration in the chamber can be tested. Haro et al. [20] measured the methane and carbon dioxide surface emissions from a landfill in Burkina Faso using the static chamber method. The flux rate of methane was in a range of 657–1210 mg/m2/h at the fully covered area, which was higher than the tolerable value. Bian et al. [21] investigated the methane emission fluxes from two landfills with different surface cover conditions in China by SCM. The influence of vegetation and climatic conditions on methane emission was discussed. Zhan et al. [22] developed a static chamber method to measure the emissions of CH4 and CO2 from landfill covers constructed with loess and gravel. The in situ testing results were consistent with those of the laboratory calibration.
Although the static chamber method is proved to be feasible in methane emission monitoring, there are still some disadvantages. For the whole landfill site monitoring, a large number of points are needed to quantify the representative flux of the whole site [23]. In this case, the chamber method is time and labor-intensive [24]. Meanwhile, the sampling chamber closure may create some overpressures, which can lead to overestimation of methane concentration. To overcome the disadvantages of SCM, optical sensing techniques based on infrared absorption spectroscopy are recently developed [25]. Shen et al. [26] adopted a portable laser measurement detector (LMD) to monitor the methane concentration at a large-scale landfill in China. The average methane concentration above the temporary cover (geomembrane) was higher than that observed on the final cover (loess layer). LMD measured the methane concentration of landfill gas in a range of 1 m.
In this study, a device for measuring methane concentration is designed based on tunable diode laser absorption spectroscopy (TDLAS). Compared with SCM and LMD, the TDLAS method has higher test efficiency. It can measure the methane concentration of landfill gas within a range of 10 m and a time less than 25 s. After assembling the apparatus, the relationship between methane concentration and the optical signal was calibrated in the laboratory-based on Beer–Lambert law. After this, the in situ testing of methane emissions was performed at a large-scale landfill in China to demonstrate the accuracy of the TDLAS method.
2. Methodology
2.1. Principle of TDLAS
TDLAS is one of the most common techniques to analyze the properties and constituents of gases, such as concentration, temperature, pressure, and flow velocity [27]. TDLAS measures the wavelength-dependent absorption of light through a gas medium. Figure 1 shows the principle of TDLAS. The technique usually employs a tunable-wavelength diode laser as the light source. The wavelength of the diode laser emission is scanned over the absorption peak of the target gas; then, the photodiode is used to detect the light signal absorbed by the target gas to get the absorption spectrum. The gas concentration can be obtained by analyzing the absorption spectrum of the laser after passing through the gas. The laser is eye-safe.
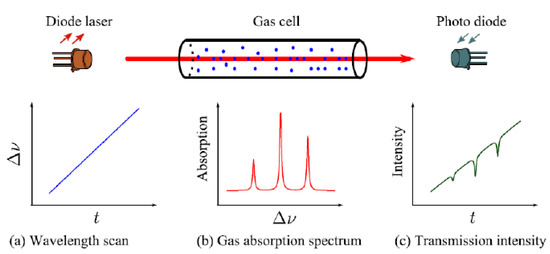
Figure 1.
Schematic diagram of tunable diode laser absorption spectroscopy (TDLAS).
Beer–Lambert law is used to describe the attenuation of laser intensity after passing through the gas:
where v is the photon frequency (Hz); I(v) is the light intensity after passing through the gas (candela, cd); I0(v) is the light intensity before passing through the gas (cd); α(v) is the absorption coefficient (m−1); σ(v) is the attenuation cross-section of a gas molecule (m2/molecule); N is the number density of gas molecular (molecule/m3); L is the effective absorption path (m).
The attenuation cross-section in Equation (1) consists of absorption cross-section and scattering cross-section:
where σabs(v) is the absorption cross-section of a gas molecule (m2/molecule); σsca(v) is the scattering cross-section of a gas molecule (m2/molecule).
During the testing of methane emissions, pure gas is generally detected. There is no scattering effect caused by solid particles, and thus the scattering cross-section is ignored.
Gas absorption cross-section can be further expressed as:
where S(T) represents the absorption line strength of a gas molecule (m/molecule); φ(v) represents the normalized linear function (m).
The absorption line strength of gas molecules depends on the population number of the low-state molecules and their transition probability. The population number of the low-energy molecules follows the Boltzmann distribution. The absorption line strength S(T) at a certain temperature T can be expressed as:
where T0 is a given temperature (K); S(T0) is the absorption line strength under the given temperature T0 (m/molecule); Q(T) is the overall partition function of gas molecules; Q(T0) is the overall partition function under the given temperature T0; h is the Planck constant (J·s); c is the light speed (m/s); E is the energy of the low-state molecules (J); KB is the Boltzmann constant (J/K); v0 is the line center frequency of molecular transition (Hz).
The absorption spectrum of gas is generated by the transition between energy levels of gas molecules after absorbing photon energy. Since the energy level has a certain width, the resulting absorption spectrum also has a width. When the pressure is equal or greater than the standard atmospheric pressure, the collision broadening is much greater than the Doppler broadening in the absorption spectrum. In this study, the gas concentration is measured under the standard atmospheric pressure. Thus, the Doppler broadening can be ignored in the absorption spectrum, and the width of the absorption spectrum can be described using the normalized linear function, which is expressed as:
where ΔvL is the collision broadening (Hz), which represents the difference between two frequencies corresponding to half of the maximum intensity of a spectral curve.
After S(T) and φ(v) are determined, the gas concentration is obtained as follows:
where C is the gas concentration (ppm).
2.2. Testing Apparatus
Figure 2 shows the framework of the gas concentration testing system based on TDLAS. The system mainly consists of the laser transmitting unit, the operation control unit, and the signal receiving unit. First of all, the system program is used to input a triangular wave signal into the laser driver. The wavelength of the diode laser emission is scanned over the absorption peak of the target gas. According to the background temperature, the current, the drift coefficient of wavelength change with current, and the transmission coefficient of voltage change with current, the output wavelength range of the laser can be calculated. The output wavelength range should cover the absorption wavelength of the target gas. On this basis, a sinusoidal signal is added to modulate the wavelength signal. The tail fiber of a diode laser emits a laser, which passes through a collimator. The direct light passes through the target gas and scatters over a block at a certain distance. Then the scattered signal is input into the photoelectric detector with a lens. The signal captured by the detector is transmitted to the lock-in amplifier. Finally, the processed signal is transmitted to the LabVIEW program through the data acquisition card so as to realize the demodulation of the signal and the calculation of the gas concentration. The distance between the collimator and the block was 10 m, which meant 10 m long gas samples were measured.
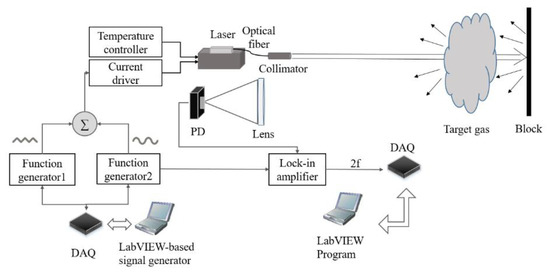
Figure 2.
The framework of the gas concentration testing system.
Figure 3 shows the structure and photographs of the self-designed testing apparatus. It mainly includes a laser emitter, photoelectric detector, focusing lens, collimator, controller, data acquisition card and power. The choice of the laser emitter depends on the absorption wavelength of the target gas (i.e., CH4 in this study). Based on the HITRAN database [28], the absorption spectrum of CH4 is least disturbed by other gases (e.g., N2, CO2, NH3, H2S) in the wavelength ranges of 1640–1770 nm 1320–1410 nm, and 1150–1168 nm. Among the three wavelength ranges, the absorption of CH4 at the wavelength range of 1640–1770 nm is greater than that of the other two wavelength ranges. Referring to the common laser emitter types, the absorption wavelength of CH4 in this experiment is chosen as 1653 nm. The DFB laser device (produced by Sichuan Tengguang Technology Co. Ltd, Mianyang, Sichuan) is used with a central output wavelength of 1653 nm and a line width of 2 MHz. The mode-hop free tuning range of the diode laser was over 50 GHz. The laser emitter is equipped with a TED200C temperature control device and an LDC205C current drive device (both produced by Thorlabs Company, Newton, NJ, USA). It has a limit operating current of 120 mA and an operating temperature range of −20 °C–+70 °C. During the test, the signals with wavelengths of around 1653 nm are detected, and the PDA50B-EC photoelectric detector (produced by Thorlabs Company) is selected for this experiment. The detector is a germanium detector with an adjustable gain (0–70 dB), and the appropriate detector gain is chosen according to the strength of the signal. Using the focusing lens as the receiving unit of the system, the axes of the focusing lens and the output beam of the laser are controlled at the same height to facilitate the feedback of the optical signal to the photoelectric detector.
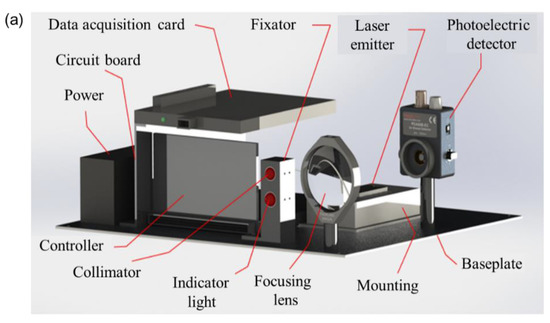
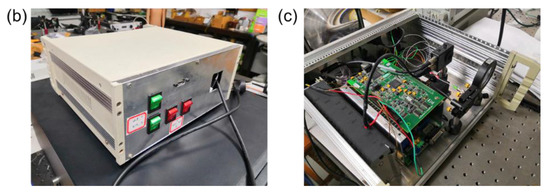
Figure 3.
Pictures of the testing apparatus: (a) schematic view, (b) outside view, and (c) inside view.
3. Gas Concentration Calibration
Before the in situ testing, the relationship between methane concentration and the optical signal was calibrated in the laboratory. The testing apparatus emitted a laser to pass through a gas sample with a methane mass concentration of 500 parts per million (ppm). Figure 4 shows the received signal amplitude. There was an obvious dent in data points between 11,000 and 13,000. This was because that when the laser-scanned to CH4 absorption peak, part of the laser was absorbed by the CH4 molecular. It led to the detected intensity being weaker than that without the absorption.
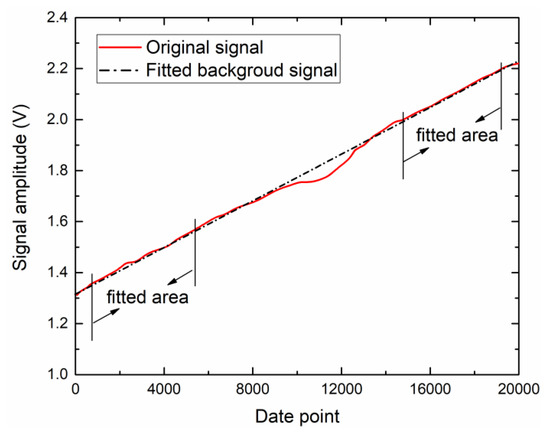
Figure 4.
Received signal amplitude after laser passing through the gas sample with methane concentration of 500 ppm.
After the absorption data of CH4 gas was measured, the absorption spectrum could be obtained through these data by two methods. One method was to measure a set of background signals (i.e., the signals without CH4 gas) and then subtracted the measured background signals from the absorption signals so as to obtain the absorption spectrum of CH4. Another method was to directly use the non-absorbed part of the CH4 absorption signal to fit the background signal and then subtract the fitted background signal to obtain the absorption spectrum of CH4. The accuracy of the absorption spectrum obtained by the first method was high, but it needed to collect a background signal for each measurement, which was time-consuming. The second method was to directly use the algorithm to fit the background signal, which was high-efficiency and suitable for practical application. Therefore, the second method was adopted in this study to obtain the absorption spectrum. The background signal was fitted using a linear function, and the results are shown in Figure 4 (with correlation coefficient R2 = 0.98). According to the fitted curve, the accuracy of the method is the CH4 concentration corresponding to the detected signal without CH4 absorption.
The laser wavelength was determined according to the input current. The relationship between the laser wavelength and current was calibrated in the laboratory, and the result is shown in Figure 5. When the current increased from 40 mA to 80 mA under the temperature of 16.2 °C, the laser wavelength increased from 1653.54 nm to 1654.22 nm. The drift coefficient of wavelength with the current was 0.017 nm/mA. When the laser current was constant at 60 mA, as the temperature increased from 14.8 °C to 17.7 °C, the laser wavelength increased from 1653.68 nm to 1654 nm. The drift coefficient of wavelength with temperature was 0.11 nm/°C. For a given current and temperature, the wavelength was determined based on the calibration relationship.
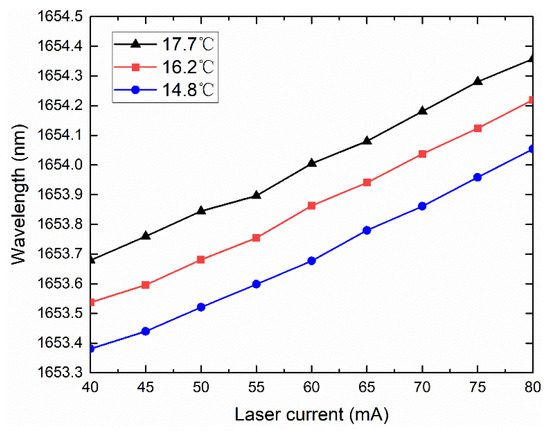
Figure 5.
Calibration of laser wavelength and current under different temperatures.
Figure 6 shows the absorption spectrum of CH4 after subtracting the fitted background signal. Thirteen CH4 samples were tested with mass concentrations ranged from 400 ppm to 5000 ppm. The absorption spectrum amplitude (at a wavelength of 1653.7 nm) showed an increasing trend with the increasing CH4 concentration. Under different CH4 concentrations, the absorption spectrum in the non-absorbed part (i.e., wavelength < 1653.6 nm and wavelength >1653.8 nm) was very close.
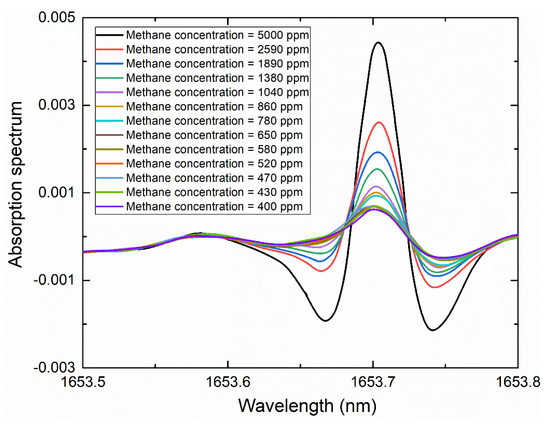
Figure 6.
Absorption spectrum of CH4 with different mass concentrations.
The absorption spectrum amplitudes (which are the peak values of the absorption spectrum in Figure 6) of CH4 samples at 13 mass concentrations of 5000 ppm, 2590 ppm, 1890 ppm, 1380 ppm, 1040 ppm, 860 ppm, 780 ppm, 650 ppm, 580 ppm, 520 ppm, 470 ppm, 430 ppm and 400 ppm were obtained. Each group of data was collected 5 times, and an average value was calculated. The standard deviation of the five data was less than 5 ppm. Figure 7 shows the variation of absorption spectrum amplitude with CH4 mass concentration. As the CH4 mass concentration increased from 400 ppm to 5000 ppm, the absorption spectrum amplitude increased linearly from 0.0005 to 0.0046. This relationship was fitted as y = 9.05 × 10⁻⁷x + 1.36 × 10⁻⁴ (R2 = 0.995), where y represents the absorption spectrum amplitude and x represents the CH4 mass concentration. This equation was used to determine the CH4 mass concentration during the in situ testing.
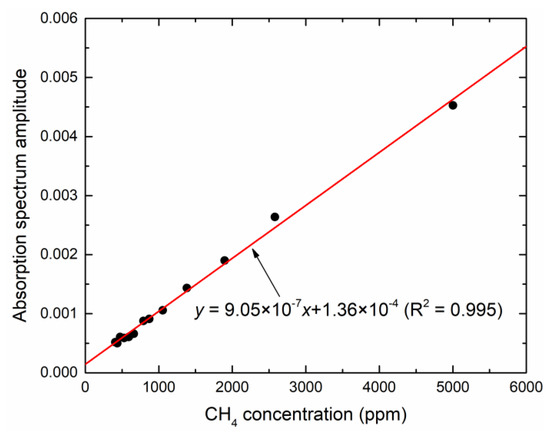
Figure 7.
Relationship between CH4 mass concentration and absorption spectrum amplitude.
Figure 8 shows the absorption spectrum of the gas sample with a methane concentration of 5000 ppm at a distance of 2 m. The signal amplitude and noise amplitudes were 0.0045 and 5.4 × 10⁻⁵, respectively. The signal-to-noise ratio (SNR) was calculated to be 83.33. The signal is taken as the detection limit of the apparatus when SNR = 1. Thus, the detection limit at the distance of 2 m was 5000/83.33 = 60 ppm. For the testing distance of 10 m, the detection limit was 60 × 2/10 = 12 ppm.
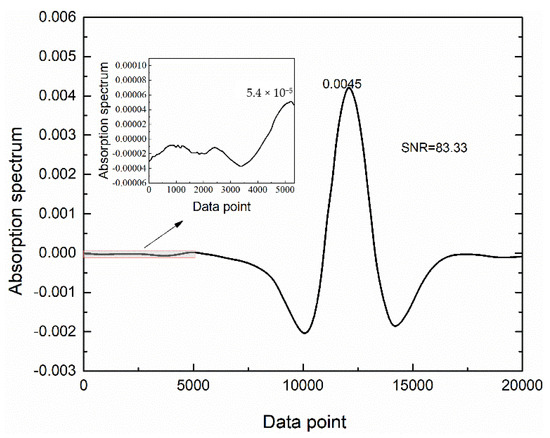
Figure 8.
SNR for the gas sample with methane concentration of 5000 ppm.
4. In Situ Testing at Xiaping Landfill
4.1. Site Description
The in situ testing of methane emissions was carried out at Xiaping landfill. Xiaping landfill is located in Shenzhen City, southeastern China. It was designed and constructed in the manner of modern sanitary landfills. It is a valley-type landfill, high in the west and low in the east. The elevations of the west and east were +230 m and +140 m (coordinate system of WGS 84/UTM zone 55 N). The elevations of the surrounding mountains are approximately in a range from +286 m to +314 m. As shown in Figure 9, this landfill was divided into two parts. The first part covers an area of 23.4 ha and was put into operation in 1997. It has a designed capacity of 14.93 million m3 and a service life of 12 years. The average mass of landfilled MSW was nearly 3000 tons per day. By the end of May 2012, the first part was closed with a total landfilled MSW of 15 million tons. The second part lies on the west of the first part, which covers an area of 55.8 ha. It has a design capacity of 12 million m3 and a service life of 10 years. With the continuous increase of MSW production in Shenzhen City, the daily amount of the landfilled MSW in the second part was much larger than that of the first part. At present, the second part received approximately 5700 tons of MSW per day. The accumulated landfilled MSW was about 5.67 million tons in the second part. The maximum thickness of the waste body waste was about 60 m.
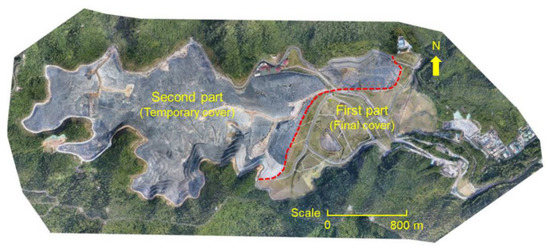
Figure 9.
Plan view of the Xiaping municipal solid waste (MSW) landfill.
The surface of the landfill was covered to avoid methane emissions and rainfall infiltration. As the first part was closed, it was covered with soil. From bottom to top, the final cover of the first part was composed of 0.7 m thick clayey soil, 0.5 mm thick linear low-density polyethylene (LLDPE) geomembrane, 1.3 m thick clayey soil, and plants. The surface of the second part was temporarily covered using a 1.5 mm thick high-density polyethylene (HDPE) geomembrane. Below the temporary cover, the gas produced by waste biodegradation was collected using pipes for power generation. The gas collection volume was about 41,000 m3/h for the whole landfill. The gas collection efficiency, which is defined as the ratio of the collected amount of gas to the amount generated, was calculated to be approximately 90% for this landfill.
4.2. Results and Discussions
Figure 10 shows the field testing of methane concentration using TDLAS. By placing six mirrors around a point, the methane concentration in six different directions can be measured. The flat mirror was made of glass coated with Al film and had a diameter of 15 cm. The mirror was placed to be perpendicular to the emitted laser. The testing distance was up to 10 m by this method. For a point, the measured methane concentration in six different directions is shown in Figure 11. Within 40 seconds of the testing time, there were some fluctuations in methane concentration due to the change of wind direction. However, the percentage change of methane concentration within testing time was basically less than 20%, which indicated the stability of the test data. The average methane concentration in six different directions was 56 ppm, 57 ppm, 59 ppm, 59 ppm, 46 ppm, and 40 ppm. The close values in different directions show the accuracy of the testing method.
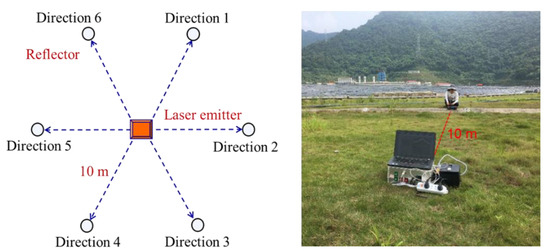
Figure 10.
Field testing of methane concentration in six different directions using TDLAS.
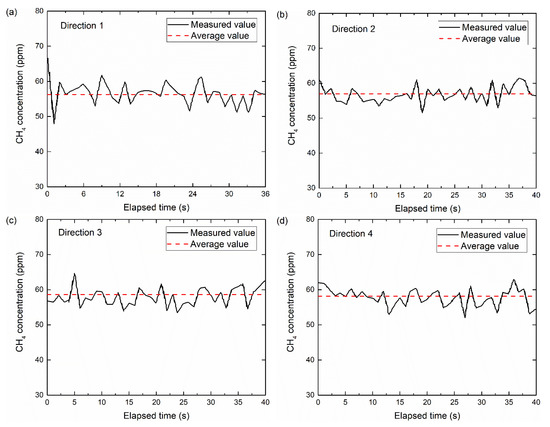
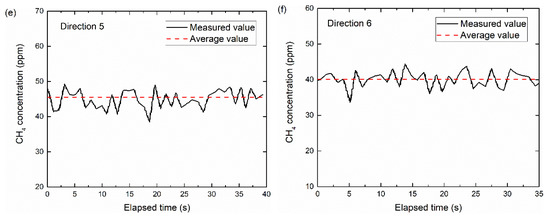
Figure 11.
Measured methane concentrations in six different directions: (a) direction 1, (b) direction 2, (c) direction 3, (d) direction 4, (e) direction 5, and (f) direction 6.
Figure 12 shows the methane concentration distribution above the surface of the Xiaping landfill. There were about 170 measured points in total. All the tests were carried out in one day. The measurements were conducted from 8 a.m. to 6 p.m. There was no rain, and the wind speed was lower than 3 m/s during the testing. According to the data of the local environmental protection bureau, the background methane concentration at 2 km away from the landfill was 3.7 ppm. The methane concentrations in most areas were below 100 ppm. This showed that the air-tightness of the final cover and temporary cover was good. However, the local methane concentrations were too high in three areas. The methane concentration was 617 ppm in the working area (i.e., uncovered area). The methane concentration was 701 ppm, where there were holes in the geomembrane. The methane concentration was 1959 ppm, where the gas collection pipe is disconnected. The testing results of methane concentration were consistent with the field observations. The TDLAS method can be used to accurately detect the spatial distribution of methane emissions in landfills.
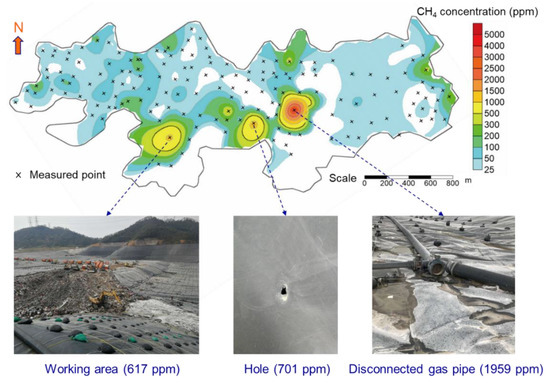
Figure 12.
Methane concentration distribution above the surface of the Xiaping landfill.
5. Conclusions
This study presents a method to measure methane concentration using tunable diode laser absorption spectroscopy (TDLAS). Beer–Lambert law is adopted to analyze the wavelength-dependent absorption behavior of light through a gas medium. Based on TDLAS, the testing apparatus is designed and assembled for in situ testing.
The relationship between methane concentration and the optical signal was calibrated in the laboratory. When the laser-scanned to CH4 absorption peak, part of the laser was absorbed by the CH4 molecular, causing the detected light intensity to decrease. As the CH4 concentration increased from 400 ppm to 5000 ppm, the absorption spectrum amplitude increased linearly from 0.0005 to 0.0046. This linear relationship was used to determine the CH4 mass concentration during the in situ testing.
The in situ testing of methane emissions at the Xiaping landfill demonstrated the accuracy of the TDLAS method. The methane concentrations in the well-covered areas were generally below 100 ppm. In the working area or the coverage area with holes, the methane concentration was about 700 ppm. The methane concentration was up to 1900 ppm, where the gas collection pipe is disconnected. Owing to the accuracy and simplicity, the TDLAS method is suitable to detect methane emissions on a large-scale from landfills.
Although the TDLAS method showed good performance in quick testing of methane emission from landfills, this method also has some weaknesses. During the field test, the laser signal is easily disturbed by aerosol scattering, humidity and other environmental factors, which will affect the testing accuracy. For example, the scattering phenomenon is serious in foggy weather, and the accuracy of the long-distance measurement by TDLAS will be significantly reduced. In bad weather, such as heavy fog, heavy rain and strong wind, the static chamber method is less disturbed and has higher accuracy.
Author Contributions
Conceptualization, H.H. and S.H.; methodology, H.H., S.H. and J.H.; validation, H.H., Y.S. and T.Z.; formal analysis, H.H.; investigation, S.G. and T.W.; resources, H.H., S.H., C.Z. and T.Z.; writing—original draft preparation, H.H.; writing—review and editing, Y.S., S.H. and J.H.; supervision, Z.Q.; project administration, H.H. and Y.S.; funding acquisition, H.H. All authors have read and agreed to the published version of the manuscript.
Funding
This research was funded by the Zhejiang Provincial Key Research and Development Program (2021C03178), Key projects of the Natural Science Foundation of Zhejiang Province (LCZ19E080001), Science and technology project of the Ministry of Housing and Urban-Rural Development (2020-K-026), Exploration project of Natural Science Foundation of Zhejiang Province (LQ21E080003), Taizhou science and technology project (1902gy18), and Science and technology project of Department of housing and urban–rural development of Zhejiang Province (2020-K-164).
Institutional Review Board Statement
Not applicable.
Informed Consent Statement
Not applicable.
Data Availability Statement
The data that support the findings of this study are available from the corresponding author upon reasonable request.
Acknowledgments
The authors acknowledge financial supports from the Zhejiang Provincial Key Research and Development Program (2021C03178), Key projects of the Natural Science Foundation of Zhejiang Province (LCZ19E080001), Science and technology project of the Ministry of Housing and Urban-Rural Development (2020-K-026), Exploration project of Natural Science Foundation of Zhejiang Province (LQ21E080003), Taizhou science and technology project (1902gy18), and Science and technology project of Department of housing and urban–rural development of Zhejiang Province (2020-K-164). The TDLAS equipment was developed in the laser spectroscopy lab of the Center for Optical and Electromagnetic Research, Zhejiang University.
Conflicts of Interest
The authors declare no conflict of interest.
References
- Kaza, S.; Yao, L.; Bhada-Tata, P.; Van Woerden, F. What a Waste 2.0: A Global Snapshot of Solid Waste Management to 2050; World Bank Publications: Herndon, America, 2018. [Google Scholar]
- McDougall, J. A hydro-bio-mechanical model for settlement and other behavior in landfilled waste. Comput. Geotech. 2007, 34, 229–246. [Google Scholar] [CrossRef]
- Huber-Humer, M.; Gebert, J.; Hilger, H. Biotic systems to mitigate landfill methane emissions. Waste Manag. Res. 2008, 26, 33–46. [Google Scholar] [CrossRef]
- Chen, Y.M.; Guo, R.Y.; Li, Y.C.; Liu, H.L.; Zhan, L.T. A degradation model for high kitchen waste content municipal solid waste. Waste Manag. 2016, 58, 376–385. [Google Scholar] [CrossRef]
- Hu, J.; Ke, H.; Lan, J.W.; Chen, Y.M.; Meng, M. A dual-porosity model for coupled leachate and gas flow to vertical wells in municipal solid waste landfills. Géotechnique 2020, 70, 406–420. [Google Scholar] [CrossRef]
- Barlaz, M.A.; Ham, R.K.; Schaefer, D.M. Mass balance analysis of anaerobically decomposed refuse. J. Environ. Eng. 1989, 115, 1088–1102. [Google Scholar] [CrossRef]
- Beaven, R.P.; Ivanova, L.K.; Richards, D.J. Setting a challenge to landfill modellers. In Institution of Civil Engineers—Waste and Resources Management; ICE Publishing: London, UK, 2008; Volume 161, pp. 91–98. [Google Scholar]
- Zhan, L.T.; Xu, H.; Chen, Y.M.; Lü, F.; Lan, J.W.; Shao, L.M.; Lin, W.A.; He, P.J. Biochemical, hydrological and mechanical behaviors of high food waste content MSW landfill: Preliminary findings from a large-scale experiment. Waste Manag. 2017, 63, 27–40. [Google Scholar] [CrossRef] [PubMed]
- Fei, X.; Zekkos, D. Coupled experimental assessment of physico-biochemical characteristics of municipal solid waste undergoing enhanced biodegradation. Géotechnique 2018, 68, 1031–1043. [Google Scholar] [CrossRef]
- Shen, S. Monitoring Method and Emission Mechanisms of Landfill Gas in Municipal Solid Waste Landfill. Ph.D. Thesis, Zhejiang University, Zhejiang, China, 2020. [Google Scholar]
- IPCC (Intergovernmental Panel on Climate Change). Technical Summary. In Climate Change 2013: The Physical Science Basis; Contribution of Working Group I to the Fifth Assessment Report of the IPCC: Geneva, Switzerland, 2013. [Google Scholar]
- Townsend, T.G.; Wise, W.R.; Jain, P. One-dimensional gas flow model for horizontal gas collection systems at municipal solid waste landfills. J. Environ. Eng. 2005, 131, 1716–1723. [Google Scholar] [CrossRef]
- Powell, J.T.; Townsend, T.G.; Zimmerman, J.B. Estimates of solid waste disposal rates and reduction targets for landfill gas emissions. Nat. Clim. Chang. 2016, 6, 162–165. [Google Scholar] [CrossRef]
- Zhan, T.L.T.; Xu, X.B.; Chen, Y.M.; Ma, X.F.; Lan, J.W. Dependence of gas collection efficiency on leachate level at wet landfills of municipal solid wastes and its improvement methods in China. J. Geotech. Geoenvironmental Eng. 2015, 141. [Google Scholar] [CrossRef]
- Goldsmith, C.; Chanton, J.; Abichou, T.; Swan, N.; Green, R.; Haters, G. Methane emissions from 20 landfills across the United States using vertical radial plume mapping. J. Air Waste Manag. Assoc. 2012, 62, 183–197. [Google Scholar] [CrossRef] [PubMed]
- De la Cruz, F.B.; Green, R.B.; Hater, G.R.; Chanton, J.P.; Thoma, E.D.; Harvey, T.A.; Barlaz, M.A. Comparison of field measurements to methane emissions models at a new landfill. Environ. Sci. Technol. 2016, 50, 9432–9441. [Google Scholar] [CrossRef]
- Levy, P.; Gray, A.; Leeson, S.; Gaiawyn, J.; Kelly, M.; Cooper, M.; Dinsmore, K.; Jones, S.; Sheppard, L. Quantification of uncertainty in trace gas fluxes measured by the static chamber method. Eur. J. Soil Sci. 2011, 62, 811–821. [Google Scholar] [CrossRef]
- Capaccioni, B.; Caramiello, C.; Tatano, F.; Viscione, A. Effects of a temporary HDPE cover on landfill gas emissions: Multiyear evaluation with the static chamber approach at an Italian landfill. Waste Manag. 2011, 31, 956–965. [Google Scholar] [CrossRef]
- Winton, R.S.; Richardson, C.J. A cost-effective method for reducing soil disturbance-induced errors in static chamber measurement of wetland methane emissions. Wetl. Ecol. Manag. 2016, 24, 419–425. [Google Scholar] [CrossRef]
- Haro, K.; Ouarma, I.; Nana, B.; Bere, A.; Tubreoumya, G.C.; Kam, S.Z.; Laville, P.; Loubet, B.; Koulidiat, J. Assessment of CH4 and CO2 surface emissions from Polesgo’s landfill (Ouagadougou, Burkina Faso) based on static chamber method. Adv. Clim. Chang. Res. 2019, 10, 181–191. [Google Scholar] [CrossRef]
- Bian, R.; Xin, D.; Chai, X. Methane emissions from landfill: Influence of vegetation and weather conditions. Environ. Technol. 2019, 40, 2173–2181. [Google Scholar] [CrossRef]
- Zhan, L.T.; Wu, T.; Feng, S.; Lan, J.W.; Chen, Y.M. A simple and rapid in situ method for measuring landfill gas emissions and methane oxidation rates in landfill covers. Waste Manag. Res. 2020, 38, 588–593. [Google Scholar] [CrossRef] [PubMed]
- Gonzalez-Valencia, R.; Magana-Rodriguez, F.; Cristóbal, J.; Thalasso, F. Hotspot detection and spatial distribution of methane emissions from landfills by a surface probe method. Waste Manag. 2016, 55, 299–305. [Google Scholar] [CrossRef]
- Scheutz, C.; Samuelsson, J.; Fredenslund, A.M.; Kjeldsen, P. Quantification of multiple methane emission sources at landfills using a double tracer technique. Waste Manag. 2011, 31, 1009–1017. [Google Scholar] [CrossRef] [PubMed]
- Tanikawa, N.; Furichi, T.; Ishii, K.; Matsuo, K.; Iseki, T. Development of a convenient method for monitoring of methane in ambient air at landfill sites using a portable open path analyzer. In Proceedings of the Third Asia-Pacific Landfill Symposium, Kitakyushu, Japan; 2004. [Google Scholar]
- Shen, S.; Chen, Y.; Zhan, L.; Xie, H.; Bouazza, A.; He, F.; Zuo, X. Methane hotspot localization and visualization at a large-scale Xi’an landfill in China: Effective tool for landfill gas management. J. Environ. Manag. 2018, 225, 232–241. [Google Scholar] [CrossRef] [PubMed]
- Wagner, S.; Fisher, B.T.; Fleming, J.W.; Ebert, V. TDLAS-based in situ measurement of absolute acetylene concentrations in laminar 2D diffusion flames. In Combustion Institute; Elsevier: Amsterdam, The Netherlands, 2009; Volume 32, pp. 839–846. [Google Scholar]
- Rothman, L.S.; Jacquemart, D.; Barbe, A.; Benner, D.C.; Birk, M.; Brown, L.R.; Carleer, M.; Chackerian, C.; Chance, K.; Coudert, L.; et al. The HITRAN 2004 molecular spectroscopic database. J. Quant. Spectrosc. Radiat. Transf. 2005, 96, 139–204. [Google Scholar] [CrossRef]


Publisher’s Note: MDPI stays neutral with regard to jurisdictional claims in published maps and institutional affiliations. |
© 2021 by the authors. Licensee MDPI, Basel, Switzerland. This article is an open access article distributed under the terms and conditions of the Creative Commons Attribution (CC BY) license (http://creativecommons.org/licenses/by/4.0/).