1. Introduction
In recent years, the use of Unmanned Aerial Vehicles (UAV) has continued to rise due to increased applications in security, transportation, package delivery, geographic mapping, photography, and more [
1]. While demand for UAVs has increased, the ability to efficiently test these UAVs repeatedly has remained an obstacle. Currently, UAVs are tested with in-person flight demos or 3D simulations. However, in-person flight demos can often be expensive and time-consuming, as testers may have to locate and arrive at a large area that is safe to test. Current 3D simulations allow for effective ways to test drone mobility and function but lack capacity for efficient environmental variance. Current simulations also require testers to manually place 3D models in the simulator, resulting in a increased downtime in repetitive testing cycles.
This paper proposes a testbed that would address this 3D simulation problem. This platform directly uses satellite images to procedurally generate the entire 3D environment for the user, using image processing algorithms. With a single click, real-life streets and neighborhoods can become replicated entirely in the 3D simulation, resulting in a limitless variety of simulated environments. This will allow users to not only generate more accurate environments faster, but they will also be able to test their UAVs in specific real-world locations to more accurately replicate conditions for UAVs after the testing process. This combination of components (online platform, machine learning, satellite images, robotics) has never been done before and offers novel levels of automation and environmental freedom.
The organization of this paper is as follows. After this introduction, related works on this topic are presented. Following, the experimental setup and results are presented along with specific platform implementation details. Finally, the simulation results are presented, and the resulting data is analyzed.
2. Related Works
For related works, other projects involving simulator-based testbeds that allow for environmental models will be directly compared with our project. While several projects exist in such a context, there are many significant differences that need to be addressed. These related testbeds include:
OpenUAV: This testbed allows for testing of “swarms” of UAVs using integration with the Gazebo simulation system. OpenUAV also supports a containerized desktop environment and mission planning software [
2]. OpenUAV also features remote desktop accessibility. However, the OpenUAV simulation environment lacks a level of realism, due to relatively-empty and generic environments. Our project’s software allows for generation of real-life, specific locations with auto-placed and scaled models.
Autonomous Airship Sim: This platform also combines the testing of UAVs with the Gazebo simulation system [
3]. However, this project focused on the benefits and powerful capabilities of Gazebo and lacks integration with broader UAV applications, like drones, due to a concentration on airship testing. There is also no integration of any image processing abilities, as the airships would be used independently of collected satellite data. Very little was shown about the Gazebo environment themselves, as well. Our project allows for more dynamic environments, as well as simulation support, for a wide variety of UAVs.
AirSim: This platform from Microsoft allows for a wide variety of UAV testing using the Unreal Engine. AirSim also supports the integration of other machine learning frameworks, combined with high-rendered environments [
4]. However, the biggest drawback is the environment creation itself. Not only are AirSim’s environments not based on real locations, but creating custom ones involves directly editing several Unreal Engine files and restarting your computer. Our platform solves this issue by making custom environment generation intuitive for users with a single click. Due to our machine learning integration, users will not have to edit any files to create a unique simulation of a real-life location.
UAS Collision Avoidance Sim: This platform utilizes the FlightGear simulation program to test aircraft collision with a virtual control station [
5]. While this project had certain success comparing simulated collisions, this platform’s testing environment lacks several features. Although there appears to be some satellite image integration in the FlightGear sim, the entire world is 2D, with no spawned 3D models. This lack of realism, combined with a lack of machine learning integration, leaves more to be desired.
Lincoln Lab Sim: This UAV simulation was developed by the Massachusetts Institute of Technology, and includes realistic, 3D environments. The Lincoln Lab sim can also test a large variety of UAVs and collect varying sensor data. This sim also features control and collision avoidance algorithm testing [
6]. However, the largest problem with this design is the requirement of using their specified 17,000 square-foot indoor testing facility. A drone must physically be flying within this facility, and then cameras and detectors can show the drone in the simulation. This drawback is very limiting for practical future testing.
Vision-Based UAV Platform: This platform tests UAVs using the Gazebo simulator, specifically to test the vision capabilities of such UAVs [
7]. However, once again, a problem arises due to less-than-realistic Gazebo simulations. The environments used in these simulations have generic models that must be manually placed and scaled. This Vision-Based UAV Platform also admittedly has a limited variety of testable UAV models, making this platform less than ideal.
3. Experimental Setup
3.1. Proposed System Architecture
The proposed system pipeline, for real word representation, is presented in
Figure 1.
3.2. Frontend (Angular)
The frontend portion of the process pipeline implements the Angular open-source framework to allow client-side web applications. This project expands upon the cloud platform built by PDMFC [
8] that allows for remote control of UAVs on maps of satellite images. The decision to continue using the Angular framework allows for overall consistency with components and models, as well as Angular’s ability to handle asynchronous data for decreased latency between the backend and the UAV [
9].
Angular was used instead of other popular frameworks, like Vue.js and React, for data-rending purposes and overall framework support. The Vue’s reactivity system would not be ideal for this project, as data is rerendered in chunks which could be problematic for efficient data transfer [
10]. Furthermore, while React requires further libraries for model and controller properties, Angular has these functionalities built-in. Angular’s support of dependency injections, as well as a TypeScript language consistency with our chosen backend, made Angular our ideal frontend choice.
For this project, the ability to screenshot the current satellite image map was implemented through the EasyPrint plugin [
11] through Leaflet, a JavaScript library for interactive maps [
12]. This plugin allows the user to click on a button to take a screenshot of the current satellite map view and send it to the backend for further processing. The latitude and longitude of the corners of the satellite image are forwarded to the backend for use in future simulations. Running on a laptop with an i7-8550U Intel CPU with 4 cores, the maximum scale that the simulation can accurately handle without crashing is approximately 1000 square meters, with a density of 9 objects per 100 square meters (900 total objects).
Figure 2 is a screenshot from the said user interface and button.
3.3. Backend (NodeJs)
The backend acts as a server to receive and manage remote connections. The backend for this project was built with NodeJS, an open-source Javascript runtime environment. NodeJS was chosen due to its non-blocking single-thread ability, allowing many server requests simultaneously [
13]. Our project especially relies on quick data transfer, and NodeJS is known to be one of, if not the fastest, backends for processing requests [
14]. NodeJS also supports TypeScript, allowing for a consistent front and backend language for our project.
This particular use case manages user authentication, restricting platform access from users outside trusted organizations. The backend additionally receives the satellite image and its latitude and longitude from the front end. The image and its respective coordinates are then stored in a MySQL database for later retrieval, if necessary.
3.4. YOLO v4 (Python)
The image and coordinate data get sent to our custom python script for YOLO v4 processing. The purpose of using YOLO v4 was to locate particular items in the given satellite image stored in the backend. Our YOLO v4 algorithm was specifically trained to detect buildings, roundabouts, and trees to create the basic models of the world in simulation (see
Figure 3). Once YOLO v4 detects these objects, they can be properly generated in their appropriate world position and scale in the Gazebo simulator. A more detailed description of YOLO v4 and the following Mask R-CNN description will be provided later.
3.5. Mask R-CNN
The bounding box nature of the YOLO v4 algorithm did not scale as nicely when detecting roads, especially diagonal or curved roads. As such, the Mask R-CNN algorithm was implemented with the purpose of identifying roads. These road locations were then used as a pivot point for rotating houses and other models for a more accurate simulation.
Using a variation on breadth-first search [
15], each placed building will rotate towards the closest road pixel in the Gazebo simulation. This is represented in
Figure 4.
The Mask R-CNN output results in a large 2D array of 0 s and 1 s, with the 1 s representing pixels of located roads. The 1 s has been additionally marked with a red border for clarity. The “X”s represent a single building, marked by the green border. The inner yellow box represents the center pixel of the building, which is utilized to calculate the distance consistently for each model. Our algorithm will scan the surrounding search range, represented by the bright pink box. This will result in the closest “1”/ road pixel location, and our simulation will rotate the building to face that direction.
Figure 5 shows an output example with rotated houses in Gazebo.
3.6. Simulation (Gazebo)
The open-source Gazebo 3D robotics simulator was chosen for its realistic environment renderings and its high-performance physics engine [
16]. Initially, the image stored in the backend is scaled to its estimated size and placed as a ground plane in the Gazebo simulator. Using the output from YOLO detection and the original map image’s known satellite coordinates, the detected objects can be spawned in their relative locations at their relative sizes. Three-dimensional models of houses and trees are then created and placed in their appropriate locations in Gazebo.
3.7. UAV Operation (Robot Operating System (ROS))
The modularity of ROS allows for easy integration of a variety of UAVs for real time simulation control. Our simulations have utilized the Hexa Exterior Intelligent Flying Unit (HEIFU) UAV provided by Beyond Vision [
17]. At this point, the drones can be manually controlled (by Xbox 360 controllers or keyboard) to fly around in the 3D world and interact with the objects spawned algorithmically (see
Figure 6).
3.8. UAV Design
This section will describe the HEIFU hardware used in this paper to represent the real UAV in the Gazebo simulation. HEIFU is a custom-made solution aimed at the surveillance sector. The HEIFU is equipped with an onboard computer running Ubuntu and Robot Operating System (ROS). This is an open platform that allows the integration of different inputs and runs multiple tasks, such as image processing, data relaying, and remote control of a drone. HEIFU can be used with different communication systems, such as a mobile network or Wi-Fi connection. HEIFU is a Hexacopter, as can be seen in
Figure 7, with a diagonal wheelbase of 1.4 m. The drone weight is around 6.2 kg, including battery, and the hovering time is about 30 min with a battery of 22 Ah.
The following describes additional HEIFU specifications:
Pixhawk hardware (running ArduCopter) is used to control low-level operation; this hardware contains the IMU and GPS to provide the UAV’s position and orientation; the Pixhawk connects to the Jetson Nano embedded system via a MAVlink protocol and the UAV’s battery; lastly, to control the UAV’s motors it is connected to a UHF receiver;
a Jetson Nano is used to control the high-level operation; it receives data from the distance sensor (depth cameras), the RGB camera, and communicates with external devices via a Wi-Fi or 4G link;
an RGB camera with a gimbal stabilizer is installed capturing onboard images at a resolution of 1920 × 1080 pixels; and
the camera and lens specifications are known, allowing the field of view (FOV) and the pixel size in meters to be computed.
3.9. Communication Protocol
Since the platform will handle real-time information coming from the frontend, backend, and UAV, it was necessary to address this issue. A common technique used in many web-platforms is long-polling, where the client continually checks the server for new data. Until a decade ago, this way of getting real-time data was as effective. However, as more client requests reached the server, a problem became more apparent. The latency between client and server increased since each connection is kept open for as long as possible. When the connection times out, the client is notified, and a new request is made repeatedly. Thus the idea of a new protocol, identified as WebSocket, was born. As I. Fette and A. Melnikov described [
18], WebSocket allows a long-held, bi-directional and full-duplex TCP socket connection established between client and server. This procedure starts with the client sending an HTTP request to the server asking to connect to a WebSocket. This process is known as a WebSocket handshake. After the server accepts this request, it replaces the HTTP connection by a WebSocket connection. The server maintains this connection for each client, using it to push data in real-time. Our platform utilizes this protocol to efficiently send and process the satellite image, as well as manually control the UAV.
4. Artificial Intelligence Algorithms
As previously mentioned, two artificial intelligence algorithms were used to segment objects that are identifiable in aerial imagery. The first relies strictly on detecting objects that are easily identified within a bounding box. The second provides more flexibility in detecting objects as it provides a semantic segmentation mask of the object over the entire image.
YOLO v4 was selected for its superior speed in comparison to single stage detectors, such as RetinaNet or GHM [
19]. While these other detectors utilize Focal Loss to mitigate foreground-background class imbalances, their optimizations are too costly for the additional time they require. Mask R-CNN is our two-stage detector of choice because its RoI Align method filters close false positives more so than counterparts, such as Grid R-CNN or Double-Head R-CNN. Mask is additionally an improvement on Faster R-CNN models, making it a natural choice as the latest state-of-the-art performing detector.
4.1. YOLO v4
The YOLO v4 algorithm was incorporated to identify buildings, trees, and roundabouts from various aerial images [
20]. YOLO v4 is backed by CUDA, OpenCV, and the custom Darknet framework built specifically for YOLO v4 [
21,
22]. Its capabilities as a single Convolutional Neural Network (CNN) allow it to divide an image into regions and predict bounding boxes with associated probabilities for each region. YOLO v4 incorporates a ResNet backbone combined with a feature pyramid net to handle object detection (see
Figure 8).
4.1.1. Dataset
The YOLO v4 model was trained on a dataset provided by DOTA, a large-scale dataset for object detection in aerial images [
23]. Our subset of preprocessed images range from 800 × 800 pixels to 4000 × 4000 pixels, featuring abundant annotations of cars, trucks, buildings, and more. However, for this project, the main four classes of interest were (1) buildings, (2) trees, (3) roundabouts, and (4) roads, with additional classes to be added in the future.
4.1.2. Training and Results
Because of the varying size of the aerial training images, we valued a higher network resolution over slow training time for better quality results. We trained our images with a network resolution of 832 × 832, which is double squared the standard 416 × 416. We additionally increased the amount of subdivisions from 16 to 64 to be memory efficient on our singular GPU. Each of the three convolutional layers parses 8 filters over the three classes before the final YOLO v4 layer identifies the bounding boxes. In total, over 2k images were trained over 3k iterations, starting from pre-trained weights on MS COCO dataset [
24], provided by YOLO v4 for custom object detection.
After completing training and testing on the validation set, our model achieved a mean Average Precision (mAP) value of 37.99%, which is about half the accuracy obtained by most YOLO v4 detection models. However, the drop in accuracy can be attributed to both the complexity of our high-res satellite images and the insufficient structure of identifying roads with bounding boxes. To address our training set’s complexity, some of our larger images had over 100 instances of objects to track between our three classes. For comparison, models that achieve greater than 75% mAP typically have a single class with no more than 10 to 20 instances per image [
25]. The advantage of this is that our model can predict a large amount of instances at the expense of somewhat low confidence values in these predictions.
The second obstacle was the slanted, curvy nature of most roads in satellite imagery. YOLO v4 does not segment the road from its nearby surroundings, instead opting for a unitary bounding box as a means of identification. This presented some problems, as highlighted by the low accuracy of roads (26.00%) in our presented graphic in
Figure 9. For road identification specifically, our solution was to abandon YOLO v4 for a more accurate model—resulting in YOLO usage on only three classes: (1) buildings, (2) trees, and (3) roundabouts (see
Figure 10). The segmentation of roads will be done using a separate algorithm, namely Mask R-CNN, which will be detailed in the next section.
4.2. Mask R-CNN
To detect features, such as roads that are not as easily encapsulated by a bounding box, Mask R-CNN was implemented into the architecture [
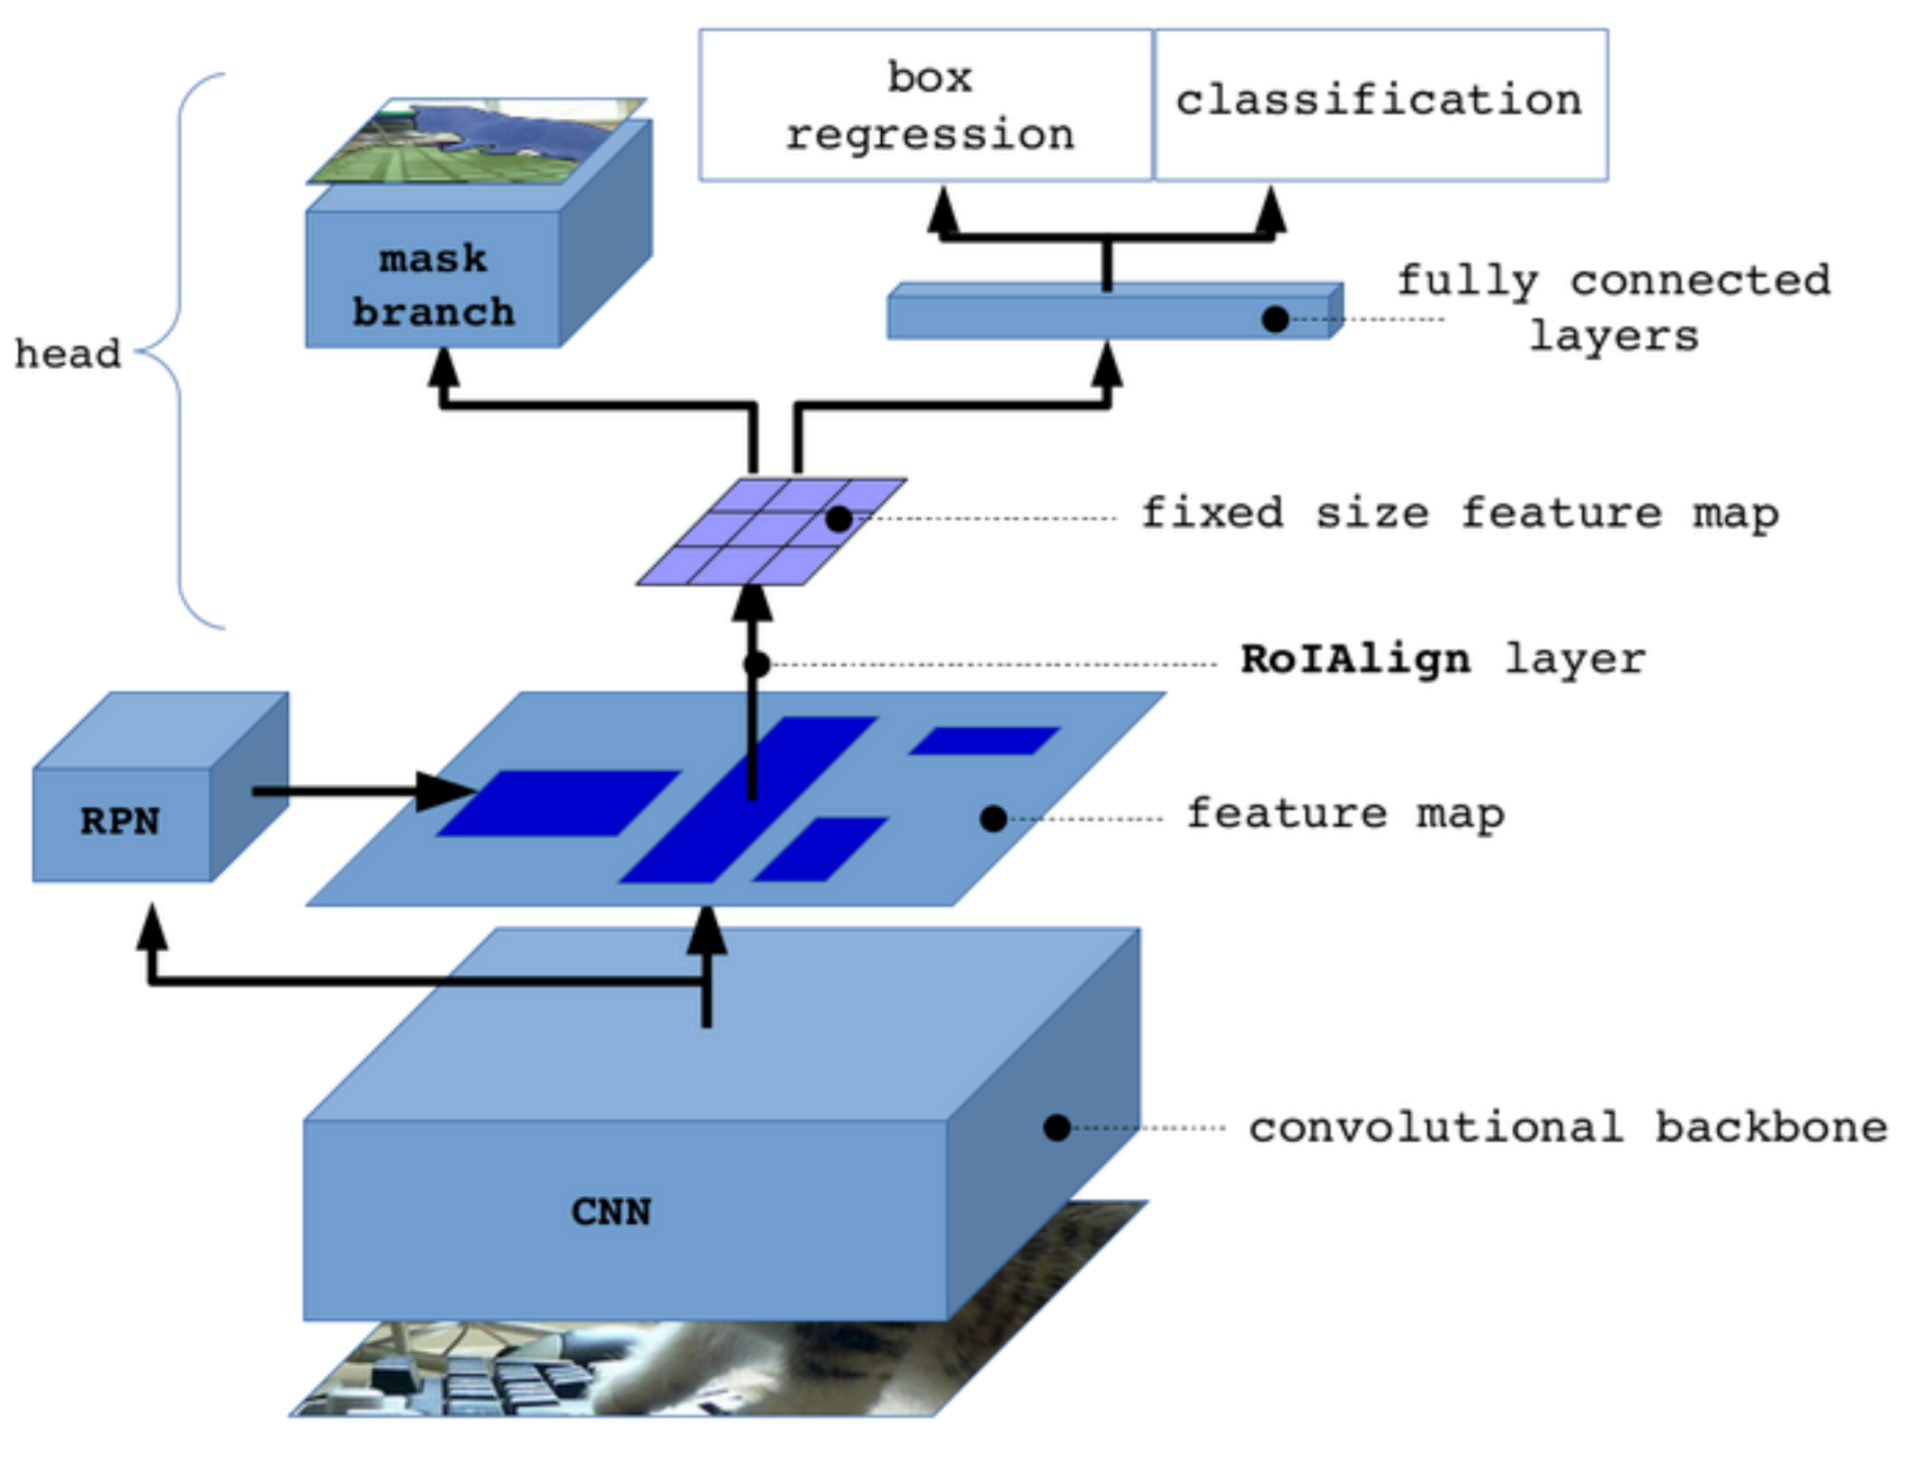
26]. Mask R-CNN is two-stage regional convolutional neural network designed for object detection and instance segmentation in various images (see
Figure 11). This version implemented Python 3, Keras, and Tensorflow for training on our images of interest [
27,
28]. The first stage consists of two networks: the backbone and region proposal network. These networks run once per image to give a set of region proposals or regions in the feature map which contain the object. Stage 2 of Mask R-CNN then predicts bounding boxes and object class for each proposed region obtained in Stage 1. These regions can be of different sizes, which is problematic for fully connected layers. The RoI Align method fixes the size of these vectors to make more accurate predictions [
29].
4.2.1. Dataset
The dataset used for our implementation comes from the Spacenet Road Network Detection Challenge [
30]. The data we used includes satellite imagery from the WorldView-3 Satellite Sensor over various parts of Vegas and Shanghai. These regions were chosen for their variety in road type/layout and scalability. The raw source geotiffs of RGB raster data are converted to 8-bit JPEGs using the Geospacial Data Abstraction Library that can then be processed by Mask-R-CNN [
31]. Additionally, the image annotations are also parsed into JSON files that include the relevant information for segmenting roads. This is because the original annotations differentiate between various types of roads, lane numbers, and whether or not is paved, which are too specific for our current implementation. One final consideration is the fact that only road center lines are given in the unaltered annotations. The entirety of the road is captured in the formatted JSON annotation files by applying the OpenCV flood fill algorithm to each image instance [
32]. Our result is nearly 1.6k road images that pair favorably with the Mask R-CNN training model.
4.2.2. Training and Results
It is not advantageous to distinguish between separate instances of roads in aerial images. As a result, we stop at the semantic segmentation layer to create an image-wide mask of the road, as shown in
Figure 12. To do so, we freeze the layers below segmentation during the first stage of training. The final stage unfreezes all layers and fine-tunes each of the layers before and including the segmentation layer for increasingly accurate results. Our approach utilized transfer learning to leverage common features and patterns found in pre-trained weights provided by ImageNet and MS COCO [
24,
33], so some adjustments are required to specify roads as our unique class of interest. We trained our model twice, starting with ImageNet weights for one iteration and MS COCO weights for the next. The model trained over 16 epochs, with 1k steps per epoch (see
Figure 13).
The model performed better with the MS COCO weights, which are shown below in the table. After fine-tuning (see
Table 1), the final training accuracy was 86.04% on the training set and 78.51% on the validation set (as shown in
Table 2), which is respectable given the use case of our architecture. It is likely that the COCO dataset performed considerably better over both the training and validation sets because it is an order of magnitude smaller than the ImageNet dataset. However, because the COCO dataset is smaller, it is more likely to overfit, which results in diminishing returns. A smaller step size combined with more epochs could increase validation accuracy, but this hypothesis will have to be more thoroughly tested in the future.
5. Experimental Results and Discussion
This section aims to showcase a complete sample simulation and compare its results against those of the platforms described in the related works. We used six different features as indicators for this comparison, as highlighted in
Table 3.
The entire image-to-simulation process is demonstrated in the following figures.
Figure 14a represents the unaltered image of a Las Vegas city block.
Figure 14b demonstrates our Mask R-CNN being applied to that same image.
Figure 14c shows the YOLO algorithm on the same image, as well. And, finally,
Figure 15a–c show the complete Gazebo result.
Firstly, the raw satellite image is laid as a ground plane, respecting the relative physical scale of objects in the image. The machine learning algorithms then spawn the relevant objects within Gazebo with their appropriate dimensions and rotation, as illustrated in
Figure 15a–c.
The environment is ready for testing under the deployment of UAVs. At present, the simulation is minimalist; all buildings are abstracted to a single house, and all trees to a single oak tree. Though aesthetically boring, this provides everything necessary for UAV interaction, as emphasized by
Figure 16a,b.
Our efficient simulation algorithm provides an outlet for UAV companies to test their products in a zero stakes environment, without expensive resources. UAVs can collide with the obstacles, and the physics engine provided by Gazebo offers an accurate prediction of the outcome in physical space. In future iterations, the model type and altitude will be varied to get a better sense of the environment, as inspired by another proof of concept implementing LiDAR for environment generation [
35].
Table 3 collects and compactly compares information about the aforementioned related works in relation to our platform.
Table 4 provides a quantitative measurement of our framework’s building placement accuracy. The Gazebo buildings were outlined and overlaid on an annotated satellite image, as described by
Figure 17a–c. An additional example procedure is shown through
Figure 18a–c. A pixel-by-pixel comparison of the real-life building locations to our simulated building placement was performed on a limited, randomized selection. The two painted images were overlaid, and the difference was recorded as “Building Placement Error”. During our validation process, we noticed certain distinct building varieties resulting in a range of error, giving us insight on future improvements.
While our platform is presently not fit with the complete models that make OpenUAV and AirSim advantageous, it adds the feature of simulating a real geographic location. This feature is crucial for a quality testbed, as users obtain a more complete illustration of how UAVs will perform upon deployment. Our simulation additionally allows for a variety of UAVs and automatic generation, which offers more scalability and ease of use than the Autonomous Airship and Vision-Based UAV Platforms. Finally, our platform removes the physical location restriction, making it much more practical than the Lincoln Lab Sim and the 2D UAS Collision Avoidance Sim. While there is still much to be added, our platform includes features necessary to create a quality UAV testing environment that other platforms lack.
6. Conclusions and Future Work
In this paper, a UAV testbed that can procedurally generate simulated environments was proposed. This testbed can quickly transform a satellite image of any physical location into a 3D testing environment using image recognition algorithms and neural networks. While our simulation currently lacks certain graphical detail, our product proves the novel concept of an automated and time-efficient way to generate real-life locations. Standard testing protocols, such as flight demos or manual simulations, are now replaced by a much less expensive and more exhaustive process. With this platform, users will be able to perform repeated simulations with their UAV in real-world scenarios with minimized risk and cost. Our model bases every output on publicly available and regularly updated satellite data, eliminating the need for environmental sensors or cameras. Therefore, its application is straightforward and accessible to every user, while maintaining the accuracy and fidelity in the simulation model.
Two machine learning algorithms, YOLO v4 and Mask R-CNN, were utilized and tested in isolation before integration with the Gazebo simulator. The use of these two algorithms balance efficiency in identifying distinct objects with the precision required to encapsulate objects of varying shape.
The results prove that a testbed framework backed by image processing is possible and efficient for UAV simulations. Further, testing sensitive equipment via UAVs is safe and allows for efficient, synchronous control. Though a reputable final product was achieved, there is much more to be done in creating a robust testbed for all users and use cases. In the future, this work will be enhanced with the following additions:
Increased classes and model accuracy. Road segmentations occasionally bleed past their boundaries or get split by excessive shading or foliage. YOLO v4 bounding boxes are not as tight as they can be on certain buildings or trees. A more expansive training set can help mitigate these shortcomings over future iterations [
36]. Our image processing algorithms additionally identify a limited set of objects, namely those necessary for testing. More classes and models will be added to vary the situations users may face on a case by case basis.
Decrease load time. Loading an average-sized neighborhood or a couple urban blocks is on the order of a couple of minutes due to running our machine learning algorithms one after the other. Multiprocessing can be implemented to effectively half the loading time for any given world.
Reload saved image. While our satellite data is being saved to our backend database, future work would entail an efficient way to recreate previously generated locations. In this fashion, the ability to combine several past locations together into one larger simulation is also an idea to implement in the future.
Author Contributions
Conceptualization, J.N., R.P., and J.P.M.-C.; Funding acquisition, L.C.; Investigation, J.N., R.P., J.P.M.-C., F.A., and D.P.; Resources, L.C.; Software, J.N., R.P., J.P.M.-C., F.A., and D.P.; Supervision, L.C.; Validation, J.N., R.P., and J.P.M.-C.; Writing—original draft, J.N., R.P., and J.P.M.-C.; Writing—review & editing, J.N., R.P., F.A., D.P., and L.C. All authors have read and agreed to the published version of the manuscript.
Funding
This project has received funding from the ECSEL Joint Undertaking (JU) under grant agreement No 783119. The JU receives support from the European Union’s Horizon 2020 research and innovation programme and Austria, Belgium, Czech Republic, Finland, Germany, Greece, Italy, Latvia, Norway, Poland, Portugal, Spain, Sweden.
Data Availability Statement
Acknowledgments
The authors would like to thank the Beyond Vision Research Group and PDMFC Research and Development Team.
Conflicts of Interest
The authors declare no conflict of interest.
References
- Joshin, N. 10 Stunning Applications of Drone Technology. 2013. Available online: https://www.allerin.com/blog/10-stunning-applications-of-drone-technology (accessed on 3 May 2020).
- Anand, H.; Chen, Z.; Das, J. The OpenUAV Swarm Simulation Testbed: A Collaborative Design Studio for Field Robotics. arXiv 2019, arXiv:1910.00739. [Google Scholar]
- Suvarna, S.; Sengupta, D.; Koratikere, P.; Pant, R.S. Simulation of Autonomous Airship on ROS-Gazebo Framework. In Proceedings of the 2019 Fifth Indian Control Conference (ICC), New Delhi, India, 9–11 January 2019; pp. 237–241. [Google Scholar] [CrossRef]
- Aerial Informatics and Robotics Platform. 2020. Available online: https://www.microsoft.com/en-us/research/project/aerial-informatics-robotics-platform/ (accessed on 20 May 2020).
- Bhandari, S.; Gomez, E.; Garcia, D.; Piana, M.; Ritterbush, M. Simulation Enviroment for Testing UAS Collision Avoidance System. In Proceedings of the AIAA Modeling and Simulation Technologies Conference, San Diego, CA, USA, 4–8 January 2016. [Google Scholar] [CrossRef]
- Virtual Test Environments for UAVs. Available online: https://www.ll.mit.edu/r-d/projects/virtual-test-environments-uavs (accessed on 10 May 2020).
- Bu, Q.; Wan, F.; Xie, Z.; Ren, Q.; Zhang, J.; Liu, S. General simulation platform for vision based UAV testing. In Proceedings of the 2015 IEEE International Conference on Information and Automation, Lijiang, China, 8–10 August 2015; pp. 2512–2516. [Google Scholar] [CrossRef]
- Pedro, D.; Matos-Carvalho, J.P.; Azevedo, F.; Sacoto-Martins, R.; Bernardo, L.; Campos, L.; Fonseca, J.M.; Mora, A. FFAU—Framework for Fully Autonomous UAVs. Remote Sens. 2020, 12, 3533. [Google Scholar] [CrossRef]
- Angular Guide. Available online: https://angular.io/guide/ (accessed on 29 October 2020).
- The Good and the Bad of Vue.js Framework Programming. Available online: https://ddi-dev.com/blog/programming/the-good-and-the-bad-of-vue-js-framework-programming/ (accessed on 29 October 2020).
- Winsemius, R. Leaflet-Easyprint. Available online: https://www.npmjs.com/package/leaflet-easyprint (accessed on 15 May 2020).
- Agafonkin, V. An Open-Source JavaScript Library for Interactive Maps. Available online: https://leafletjs.com/ (accessed on 10 May 2020).
- Node.js. Overview of Blocking vs. Non-Blocking. Available online: https://nodejs.org/en/docs/guides/blocking-vs-non-blocking/ (accessed on 21 May 2020).
- Pisuwala, U. What makes Node.js so fast? Top 5 best use cases for Node.js. Peerbits 2020, 170, 385–408. [Google Scholar]
- Zhou, R.; Hansen, E.A. Breadth-first heuristic search. Artif. Intell. 2006. [Google Scholar] [CrossRef] [Green Version]
- Koenig, N.; Howard, A. Design and use paradigms for Gazebo, an open-source multi-robot simulator. In Proceedings of the 2004 IEEE/RSJ International Conference on Intelligent Robots and Systems (IROS) (IEEE Cat. No.04CH37566), Sendai, Japan, 28 September–2 October 2004; Volume 3, pp. 2149–2154. [Google Scholar] [CrossRef] [Green Version]
- HEIFU Drone. 2020. Available online: https://www.beyond-vision.pt/en/product/heifu-drone/ (accessed on 10 October 2020).
- Fette, I.; Melnikov, A. The Websocket Protocol; Internet Engineering Task Force: Fremont, CA, USA, 2011. [Google Scholar]
- Groener, A.; Chern, G.; Pritt, M. A Comparison of Deep Learning Object Detection Models for Satellite Imagery. arXiv 2020, arXiv:2009.04857. [Google Scholar]
- Bochkovskiy, A.; Wang, C.Y.; Liao, H.Y.M. YOLOv4: Optimal Speed and Accuracy of Object Detection. arXiv 2020, arXiv:2004.10934. [Google Scholar]
- Vingelmann, P.; Fitzek, F.H.; NVIDIA. CUDA, Release: 10.2.89. 2020. Available online: https://developer.nvidia.com/cuda-toolkit (accessed on 10 March 2020).
- Redmon, J. Darknet: Open Source Neural Networks in C. 2013–2016. Available online: http://pjreddie.com/darknet/ (accessed on 10 March 2020).
- Xia, G.S.; Bai, X.; Ding, J.; Zhu, Z.; Belongie, S.; Luo, J.; Datcu, M.; Pelillo, M.; Zhang, L. DOTA: A Large-Scale Dataset for Object Detection in Aerial Images. In Proceedings of the IEEE Conference on Computer Vision and Pattern Recognition (CVPR), Salt Lake City, UT, USA, 18–23 June 2018. [Google Scholar]
- Lin, T.Y.; Maire, M.; Belongie, S.; Bourdev, L.; Girshick, R.; Hays, J.; Perona, P.; Ramanan, D.; Zitnick, C.L.; Dollár, P. Microsoft COCO: Common Objects in Context. arXiv 2014, arXiv:1405.0312. [Google Scholar]
- Mahto, P.; Garg, P.; Seth, P.; Panda, J. Refining Yolov4 for Vehicle Detection. Int. J. Adv. Res. Eng. Technol. 2020, 11, 409–419. [Google Scholar]
- Abdulla, W. Mask R-CNN for Object Detection and Instance Segmentation on Keras and TensorFlow. 2017. Available online: https://github.com/matterport/Mask_RCNN (accessed on 15 March 2020).
- Chollet, F. Keras. 2015. Available online: https://angular.io/guide/rx-library (accessed on 12 February 2020).
- Abadi, M.; Barham, P.; Chen, J.; Chen, Z.; Davis, A.; Dean, J.; Devin, M.; Ghemawat, S.; Irving, G.; Isard, M.; et al. TensorFlow: A system for large-scale machine learning. In Proceedings of the 12th USENIX Symposium on Operating Systems Design and Implementation (OSDI 16), Savannah, GA, USA, 2–4 November 2016; pp. 265–283. [Google Scholar]
- Girshick, R. Fast R-CNN. arXiv 2015, arXiv:1504.08083. [Google Scholar]
- Etten, A.V.; Lindenbaum, D.; Bacastow, T.M. SpaceNet: A Remote Sensing Dataset and Challenge Series. arXiv 2018, arXiv:1807.01232. [Google Scholar]
- GDAL/OGR Contributors. GDAL/OGR Geospatial Data Abstraction Software Library; Open Source Geospatial Foundation: Chicago, IL, USA, 2020. [Google Scholar]
- Bradski, G. The OpenCV Library. Dr. Dobb’s J. Softw. Tools 2000, 25, 120–125. [Google Scholar]
- Deng, J.; Dong, W.; Socher, R.; Li, L.J.; Li, K.; Fei-Fei, L. ImageNet: A Large-Scale Hierarchical Image Database. In Proceedings of the CVPR09, Miami, FL, USA, 20–25 June 2009. [Google Scholar]
- Misra, D. Mish: A Self Regularized Non-Monotonic Activation Function. arXiv 2019, arXiv:1908.08681. [Google Scholar]
- Kudinov, D. Reconstructing 3D Buildings from Aerial LiDAR with AI: Details. 2019. Available online: https://medium.com/geoai/reconstructing-3d-buildings-from-aerial-lidar-with-ai-details-6a81cb3079c0 (accessed on 10 March 2020).
- Yuan, J.; Cheriyadat, A.M. Road Segmentation in Aerial Images by Exploiting Road Vector Data. In Proceedings of the 2013 Fourth International Conference on Computing for Geospatial Research and Application, San Jose, CA, USA, 22–24 July 2013. [Google Scholar] [CrossRef]
Figure 1.
Leaflet to Gazebo Pipeline Fluxogram.
Figure 1.
Leaflet to Gazebo Pipeline Fluxogram.
Figure 2.
The Beyond Skyline Cloud Platform, including the satellite view of the map and the EasyPrint button in the top left corner.
Figure 2.
The Beyond Skyline Cloud Platform, including the satellite view of the map and the EasyPrint button in the top left corner.
Figure 3.
Sample YOLO v4 detection in location provided by China Center for Resources Satellite Data and Application (CRESDA). Showcases ability to segment buildings in a monochromatic image.
Figure 3.
Sample YOLO v4 detection in location provided by China Center for Resources Satellite Data and Application (CRESDA). Showcases ability to segment buildings in a monochromatic image.
Figure 4.
Road-finding algorithm on example Mask R-CNN output.
Figure 4.
Road-finding algorithm on example Mask R-CNN output.
Figure 5.
Gazebo image of simulation with rotated houses. Notice houses bordering roads face towards them for a more realistic effect.
Figure 5.
Gazebo image of simulation with rotated houses. Notice houses bordering roads face towards them for a more realistic effect.
Figure 6.
Close-up of drone simulation over Las Vegas, Nevada.
Figure 6.
Close-up of drone simulation over Las Vegas, Nevada.
Figure 7.
Unmanned Aerial Vehicle (UAV) used in this paper: Hexa Exterior Intelligent Flying Unit (HEIFU).
Figure 7.
Unmanned Aerial Vehicle (UAV) used in this paper: Hexa Exterior Intelligent Flying Unit (HEIFU).
Figure 8.
YOLO v4 architecture pipeline.
Figure 8.
YOLO v4 architecture pipeline.
Figure 9.
Average precision of various objects using YOLO v4.
Figure 9.
Average precision of various objects using YOLO v4.
Figure 10.
Sample of YOLO v4 results over Lisbon, Portugal, showcasing detection of multiple classes.
Figure 10.
Sample of YOLO v4 results over Lisbon, Portugal, showcasing detection of multiple classes.
Figure 11.
Mask R-CNN architecture pipeline.
Figure 11.
Mask R-CNN architecture pipeline.
Figure 12.
Mask R-CNN results: (a) Unaltered residential satellite image over streets of Las Vegas, Nevada; (b) sample of Mask R-CNN results over (a) Las Vegas image.
Figure 12.
Mask R-CNN results: (a) Unaltered residential satellite image over streets of Las Vegas, Nevada; (b) sample of Mask R-CNN results over (a) Las Vegas image.
Figure 13.
Mask R-CNN training model using COCO weights. During the first 8 epochs, only the semantic layer was trained. During the final 8 epochs, the entire model is fine-tuned.
Figure 13.
Mask R-CNN training model using COCO weights. During the first 8 epochs, only the semantic layer was trained. During the final 8 epochs, the entire model is fine-tuned.
Figure 14.
The entire image-to-simulation process: (a) Unaltered satellite image of urban intersection in Las Vegas, Nevada; (b) Las Vegas satellite image decorated with road mask; and (c) Las Vegas satellite image decorated with YOLO v4 results.
Figure 14.
The entire image-to-simulation process: (a) Unaltered satellite image of urban intersection in Las Vegas, Nevada; (b) Las Vegas satellite image decorated with road mask; and (c) Las Vegas satellite image decorated with YOLO v4 results.
Figure 15.
Gazebo results: (a) resulting Las Vegas satellite image modeled in Gazebo (angled view); (b) resulting Las Vegas satellite image modeled in Gazebo (mid view); and (c) resulting Las Vegas satellite image modeled in Gazebo (top view).
Figure 15.
Gazebo results: (a) resulting Las Vegas satellite image modeled in Gazebo (angled view); (b) resulting Las Vegas satellite image modeled in Gazebo (mid view); and (c) resulting Las Vegas satellite image modeled in Gazebo (top view).
Figure 16.
Unmanned Aerial Vehicles (UAV) interaction in Gazebo world: (a) scale view of drone in Las Vegas simulation relative to spawned elements; and (b) close-up of drone in Las Vegas simulation landing on building in Gazebo.
Figure 16.
Unmanned Aerial Vehicles (UAV) interaction in Gazebo world: (a) scale view of drone in Las Vegas simulation relative to spawned elements; and (b) close-up of drone in Las Vegas simulation landing on building in Gazebo.
Figure 17.
Validation process: (a) an original satellite image, unmarked for comparison in validation process; (b) the same satellite image, but, this time, real-life buildings are annotated and outlined; and (c) the same satellite image, but Gazebo-placed models are outlined instead.
Figure 17.
Validation process: (a) an original satellite image, unmarked for comparison in validation process; (b) the same satellite image, but, this time, real-life buildings are annotated and outlined; and (c) the same satellite image, but Gazebo-placed models are outlined instead.
Figure 18.
Validation process: (a) an original satellite image, unmarked for comparison in validation process; (b) the same satellite image, but, this time, real-life buildings are annotated and outlined; and (c) the same satellite image, but Gazebo-placed models are outlined instead.
Figure 18.
Validation process: (a) an original satellite image, unmarked for comparison in validation process; (b) the same satellite image, but, this time, real-life buildings are annotated and outlined; and (c) the same satellite image, but Gazebo-placed models are outlined instead.
Table 1.
Fine-tuning: training accuracy.
Table 1.
Fine-tuning: training accuracy.
| Metrics | ImageNet | ImageNet
(Fine-Tuned) | COCO | COCO
(Fine-Tuned) |
|---|
| Training Accuracy | 56.40% | 79.19% | 65.34% | 86.04% |
| Validation Accuracy | 53.66% | 68.62% | 61.80% | 78.51% |
Table 2.
Final network architecture used: Layers up to CONV2 are provided by CSP Darknet-53 [
22]. Each convolutional layer is supported by the Mish activation function, which outperformed Leaky ReLU on the CSPDarknet-53 backbone [
34]. Notice the feature pyramid net concatenating to form a 26 × 26 × 2048 volume on the second upscaling.
| Layer | Output | Function |
|---|
| INPUT | 812 × 812 × 3 | |
| CONV1 | 812 × 812 × 64 | Darknet CONV1 |
| POOL1 | 406 × 406 × 64 | Darknet POOL1 |
| POOL2 | 406 × 406 × 32 | Darknet POOL2 |
| POOL3 | 406 × 406 × 64 | Darknet POOL3 |
| … | … | … |
| CONV2 | 203 × 203 × 128 | Convolution 1 × 1 of Darknet Block |
| UP1 | 26 × 26 × 1024 | Upsample 2 × 2 |
| CONCAT1 | 102 × 102 × 256 | Concatenate CONV1 |
| UP1-CONVA | 51 × 51 × 512 | Convolution 3 × 3 |
| UP1-CONVB | 51 × 51 × 512 | Convolution 3 × 3 |
| UP1-CONVC | 51 × 51 × 512 | Convolution 3 × 3 |
| UP2 | 26 × 26 × 2048 | Upsample 2 × 2 |
| CONCAT2 | 203 × 203 × 64 | Concatenate CONV2 |
| UP2-CONVA | 52 × 52 × 256 | Convolution 3 × 3 |
| UP2-CONVB | 52 × 52 × 256 | Convolution 3 × 3 |
| UP2-CONVC | 52 × 52 × 256 | Convolution 3 × 3 |
| CONV3 | 26 × 26 × 512 | Convolution 3 × 3 |
Table 3.
Comparison results.
Table 3.
Comparison results.
| Platform | Simulated
Geographic
Location (Y/N) | Testable Variety
of UAVs
(Wide/Limited) | Physical Location
Requirement
(Y/N) | 3D Environmental
Models
(Y/N) | 3D Model
Placement
(Manual/Automatic/ NA) | Integration of
Machine
Learning (Y/N) |
|---|
| OpenUAV [2] | N | Wide | N | Y | Manual | Y |
Autonomous [3]
Airship Sim | N | Limited | N | Y | Manual | N |
| AirSim [4] | N | Wide | N | Y | Automatic | Y |
UAS Collision [5]
Avoidance Sim | Y | Wide | N | N | NA | N |
| Lincoln Lab Sim [6] | Y | Wide | Y | Y | Manual | Y |
Vision-Based [7]
UAV Platform | N | Limited | N | Y | Manual | Y |
| Our Platform | Y | Wide | N | Y | Automatic | Y |
Table 4.
Quantitative validation framework. Validation summary for Gazebo model placement accuracy from a variety of satellite images.
Table 4.
Quantitative validation framework. Validation summary for Gazebo model placement accuracy from a variety of satellite images.
| Building Type Variety | Building Placement Error |
|---|
| Perpendicular, square | 9.7427% |
| Irregular, asymmetric | 17.7916% |
| Compound, jagged | 20.4725% |
| Publisher’s Note: MDPI stays neutral with regard to jurisdictional claims in published maps and institutional affiliations. |
© 2021 by the authors. Licensee MDPI, Basel, Switzerland. This article is an open access article distributed under the terms and conditions of the Creative Commons Attribution (CC BY) license (http://creativecommons.org/licenses/by/4.0/).

 ,
, 


