Article

Rheology-Based Classification of Foods for the Elderly by Machine Learning Analysis

Department of Food Science & Biotechnology and Carbohydrate Bioproduct Research Center, Sejong University, Seoul 05006, Korea
*
Author to whom correspondence should be addressed.
Appl. Sci. 2021, 11(5), 2262; https://doi.org/10.3390/app11052262
Submission received: 5 February 2021 / Revised: 24 February 2021 / Accepted: 1 March 2021 / Published: 4 March 2021
(This article belongs to the Section Food Science and Technology)

Abstract

:
A new research framework for the rheological measurements of foods for the elderly was proposed by combining experiments with machine learning. Universal design food (UDF), the conventional rheological test for foods for the elderly, was compared with three different rheological methods in terms of stress, clearly showing a great linear correlation (R2 = 0.9885) with the puncture test. A binary logistic classification with the tensorflow library was successfully applied to predict the elderly’s foods based on the rheological stress values from the UDF and puncture tests. The gradient descent algorithm demonstrated that the cost functions became minimized, and the model parameters were optimally estimated with an increasing number of machine learning iterations. From the testing dataset, the predictive model with a threshold value of 0.7 successfully classified the food samples into two groups (belong to the elderly’s foods or not) with an accuracy of 98%. The research framework proposed in this study can be applied to a wide variety of classification and estimation-related studies in the field of food science.

1. Introduction

The elderly population over 65 years of age has been rapidly increasing throughout the world. Based on the 2019 revision of World Population Prospects [1], 16.7% of the population in the world will be over the age of 65 by 2050, compared to 9.1% in 2019. Specifically, Korea is expected to have the greatest percentage of senior citizens at 46.5% in 2067 [2]. In this context, the demands for senior-friendly products are globally increasing, and the food industry is no exception.
From a food-scientific point of view, foods for the elderly are required to satisfy several requirements such as being nutritious, digestible, and easy to chew [3]. In particular, dysphagia is prevalent in the elderly [4], and the elderly with dysphagia are known to be at higher risk of malnutrition [5], indicating that the rheology of the elderly foods should be modified for older people who have difficulties in eating foods. Thereby, preceding studies have reported several methods to control the rheological properties of food products for older people by grinding or thickening according to the level of dysphagia [6,7]. Furthermore, the food industry has been actively researching food-softening or reconstitution technology using enzymes, high-pressure, and 3D-printing techniques while preserving the original form of the food [8]. However, there is limited information on the official methods to effectively and reliably deal with various foods with different rheological properties for the elderly. There are several guidelines to measure their rheological characteristics such as the National Dysphagia Diet guideline and the International Dysphagia Diet Standardization Initiative [9,10]. Although they provide valuable information to prepare foods for older adults with suitable rheological properties, most of the methods are mainly for nutritionists or dietitians to prepare diets for older adults mainly in convalescent hospitals. On the other hand, the universal design food (UDF) method is useful for the food industry as it provides objective guidelines to measure the rheological properties of the elderly’s diets. However, due to the limitation of sample geometry, the UDF method [9] may not be universally applied to a wider variety of food products with numerous shapes and sizes. It is therefore necessary to develop scientific and reliable universal measurements that can be favorably made to investigate the rheological properties of foods with various types and sizes for the elderly.
Machine learning is an application of artificial intelligence for enhancing the performance of a task directed by available data without relying on explicit programs [11]. It has gained more popularity in recent years with the increasing utilization of big data in a variety of industrial and scientific areas [12]. As state-of-the-art powerful technology, machine learning is as of now utilized to make predictions and suggestions based on mathematically calculated models [13]. Beyond the fields of computer science, a great deal of effort has been made to utilize machine learning in various scientific fields. Specifically, it has been popularly applied to biomedical areas for identifying diseases and improving diagnostic precision [14,15]. In addition, the applications of machine learning are becoming more diverse and complex by inferring weather forecast uncertainty [16], predicting occupational accidents [17], and discriminating seismic waves for early earthquake warnings [18]. In the field of food science, Bisgin et al. [19] applied machine learning methods to detect insect pests in food products, and Erban et al. [20] utilized machine learning technology to search for food identity markers by metabolomics. In addition, analytical evaluation of food quality and authenticity by machine learning was recently reviewed [21]. However, the exploration of machine learning in the domain of food application is quite new. It is thus time for food research communities to consider embracing this machine learning technology from the point of view of convergence.
This study aims to develop a universal rheological measurement of foods for the elderly that can be applied to a wider variety of food products and also applying these experimental data for establishing the binary classification model through machine learning. Specifically, different rheological methods were compared with the conventional UDF method, and machine learning was furthermore employed to estimate foods for the elderly based on experimentally obtained stress values.

2. Materials and Methods

2.1. Materials

Corn starch was provided from Samyang Co. Ltd. (Gyeong-gi, Korea). Mung-bean starch, tapioca starch, and agar powder were purchased from Naturalwell (Gyeong-gi, Korea), Heungyildang Food Hanbang Market (Seoul, Korea), and Myeongshin-agar (Gyeongsang, Korea), respectively. Radishes and carrots were purchased at the grocery stores. Furthermore, various types of commercial food samples listed in Table 1 were selected based on the Korean Food Code [22]. Specifically, (semi-) solid foods with homogeneous properties that can be measured by both UDF and puncture tests were selected.

2.2. Preparation of Starch/Hydrocolloid Gels and Blanched Radishes/Carrots

Starch and hydrocolloid gels were applied as model food samples with a wide range of hardness. Agar gel samples were prepared by mixing agar powder with distilled water at 0.5, 1, 3, and 5% (w/w) for 10 min, followed by heating on a hot plate with stirring for 10 min. The hot solution was poured into a square mold (width 16 cm, length 16 cm, height 1.5 cm) and cooled in a refrigerator for 30 min at 5 °C to prepare gels. In addition, corn (20, 30, 40, and 45% (w/w)), mung-bean (20, 25, 30, 35, and 40% (w/w)), and tapioca (20 and 30% (w/w)) starch gels were prepared based on the same procedure of agar gels except for steaming for 30 min. In addition, radishes and carrots with different degrees of hardness were prepared by blanching in hot water. They were cut into cylindrical samples (diameter 40 mm, height 15 mm) and blanched in boiling water (radishes—5, 6, 8, and 10 min; carrots—5, 6, 8, 10, 15, and 20 min), followed by cooling down in tap water for 5 min.

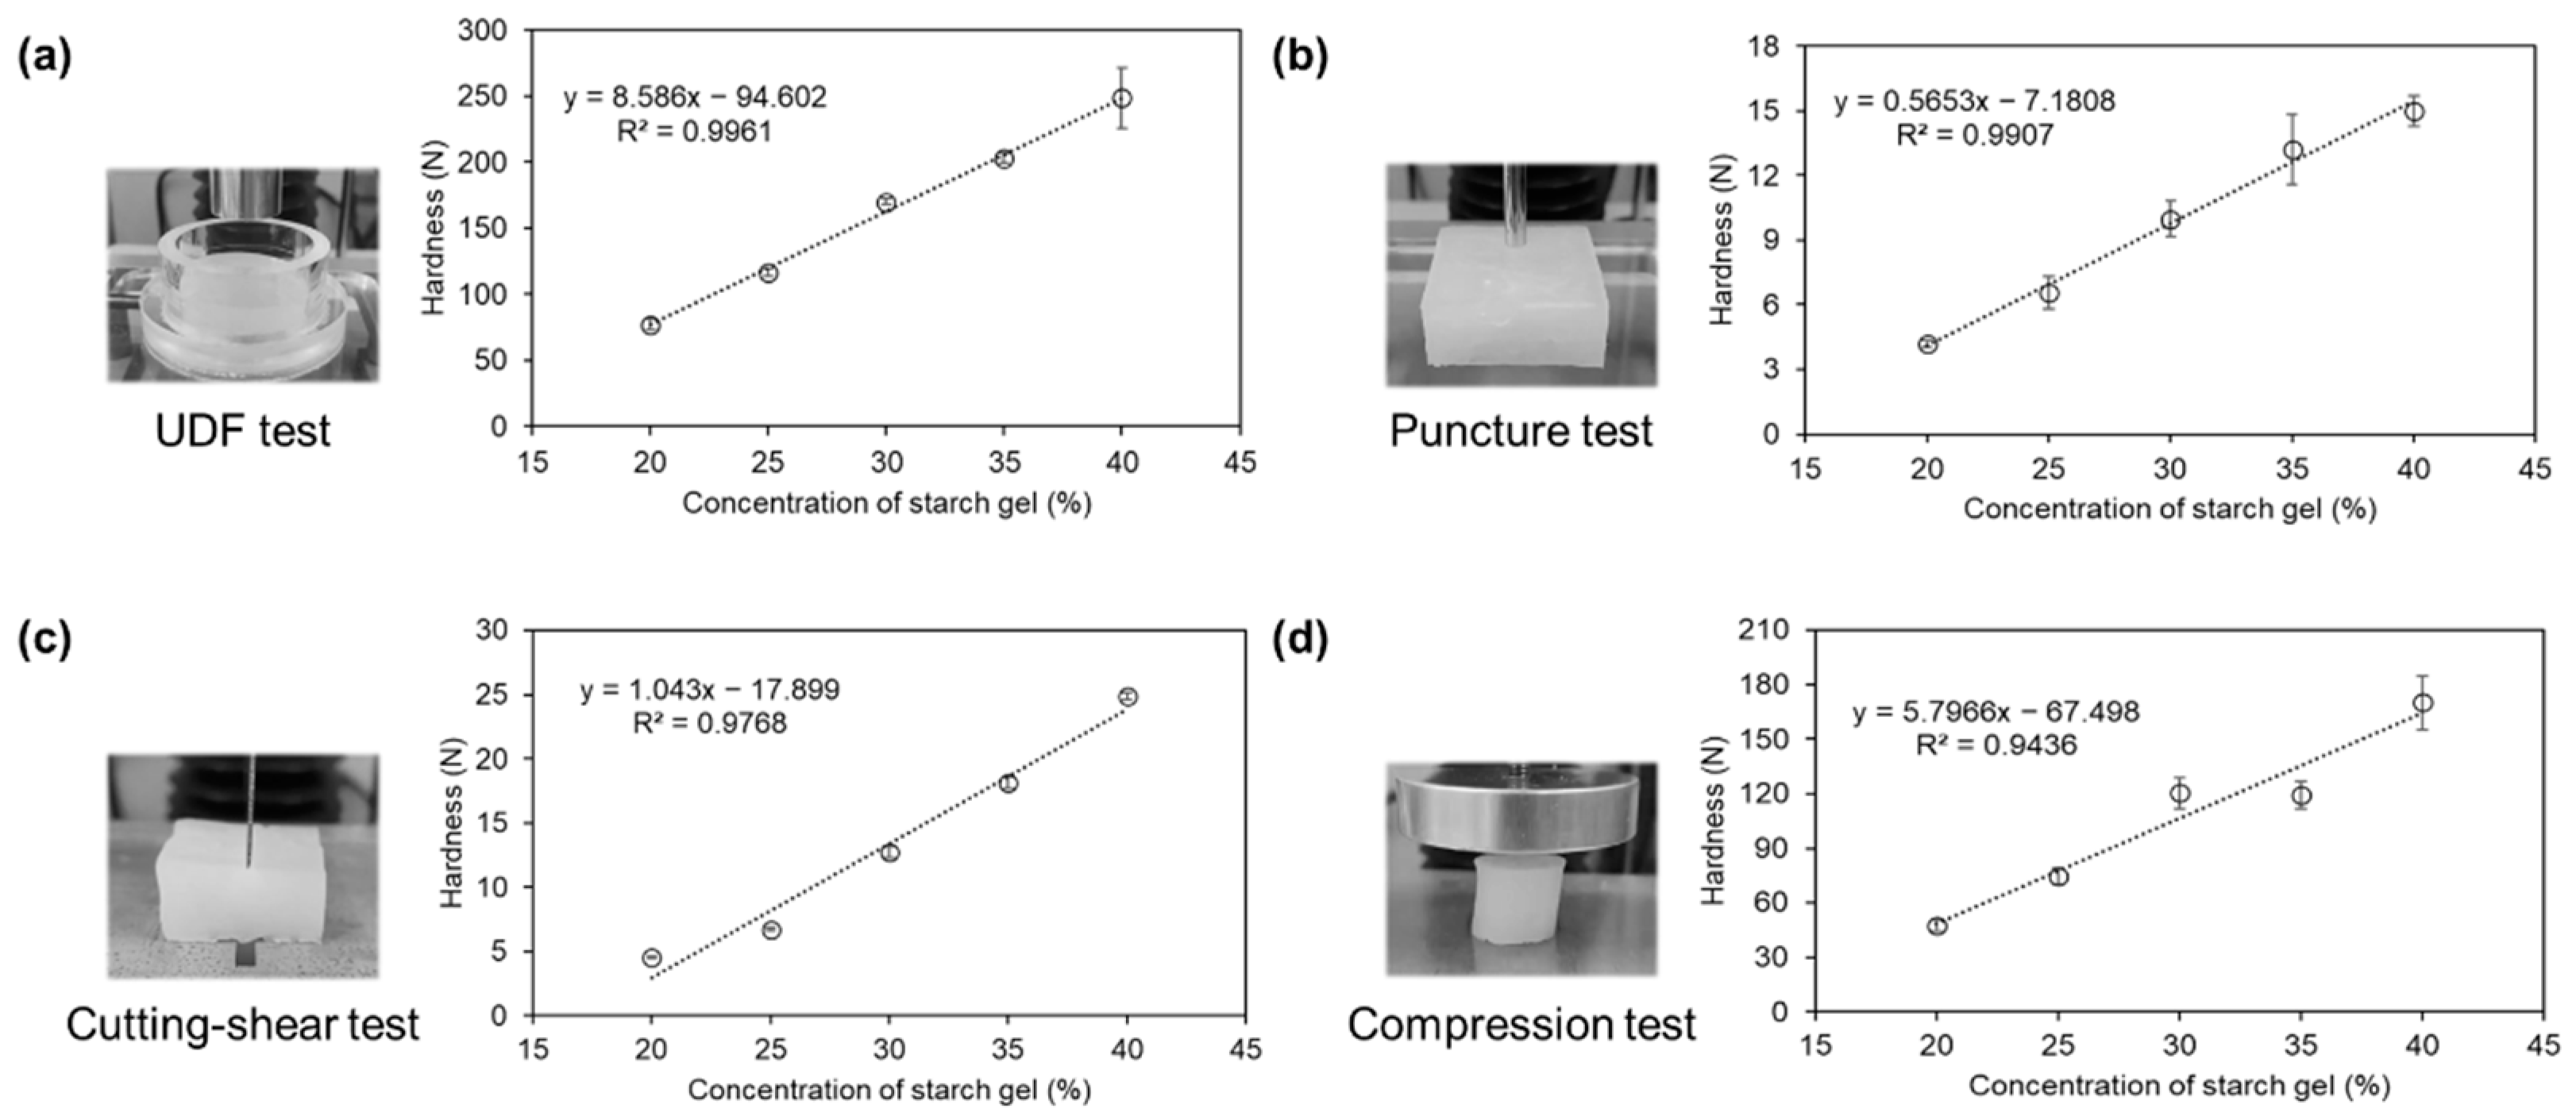
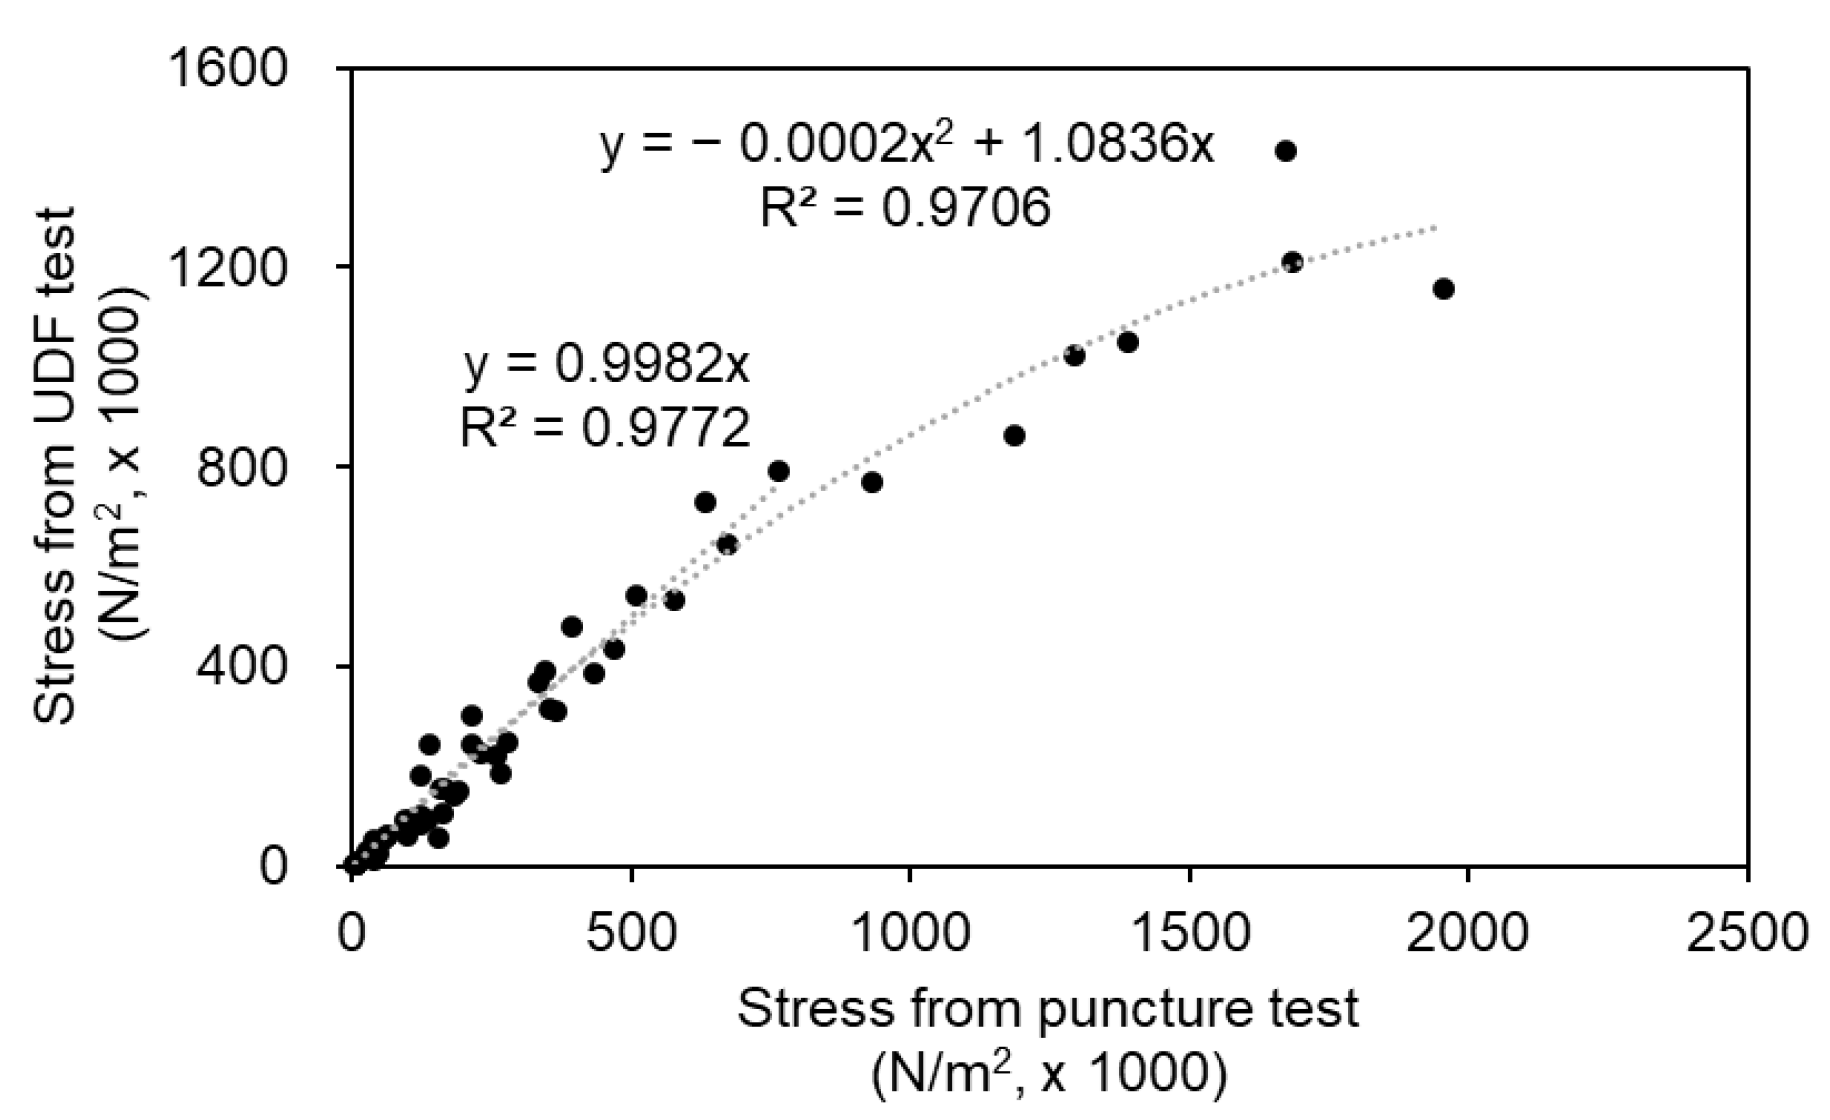
2.3. Rheological Measurements

Different instrumental rheology measurements were made using a texture analyzer (TA.XT plus, Stable Micro Systems, Surrey, UK) equipped with a 500 N load cell. First, mung-bean starch gels with different degrees of hardness were subjected to four different measurements, including UDF, cutting-shear, puncture, and compression tests, and the detailed experimental conditions were as follows. All of the texture measurements were made in triplicate, and the experimental results were expressed as mean ± standard deviation.
UDF test: based on the methods of Park et al. [23] and Japan Care Food Conference [9], the UDF test was carried out. First, a sample was loaded in a UDF container (40 mm in diameter and 25 mm in height) to have a height of 15 mm. Thereafter, a cylindrical probe (diameter 20 mm, height 35 mm) was compressed to a clearance of 5 mm from the bottom of the vessel at a crosshead speed of 600 mm/min.
Cutting-shear test: according to the method of Góral and Kluza [24], a sample was loaded on a plate with a central hole (width 55 mm, length 3 mm). Thereafter, a blade probe (width 50 mm, height 60 mm, thickness 0.5 mm) was lowered at a crosshead speed of 100 mm/min until it passed through the sample.
Puncture test: a sample was loaded on a plate with a central hole (10 mm), and a rod probe (diameter 5 mm) was lowered at a crosshead speed of 100 mm/min until it passed through the sample.
Compression test: a compression test was carried out based on the method of Kim et al. [25]. A sample (diameter 20 mm, height 15 mm) smaller than the probe size was loaded on a plate. Thereafter, a disk probe (diameter 50 mm, height 10 mm) was lowered at a crosshead speed of 100 mm/min at 66.7% strain.
For all of the instrumental methods, the plots of force versus time were obtained, and the maximum peak values were then recorded as hardness. After the four instrumental measurements were compared, the UDF and puncture tests were selected and further compared to each other. Specifically, a total of 59 food samples (25 gels + 34 commercial products in Table 1)s were subjected to both UDF and puncture tests under the conditions mentioned above, followed by the tensorflow-based machine learning analysis.

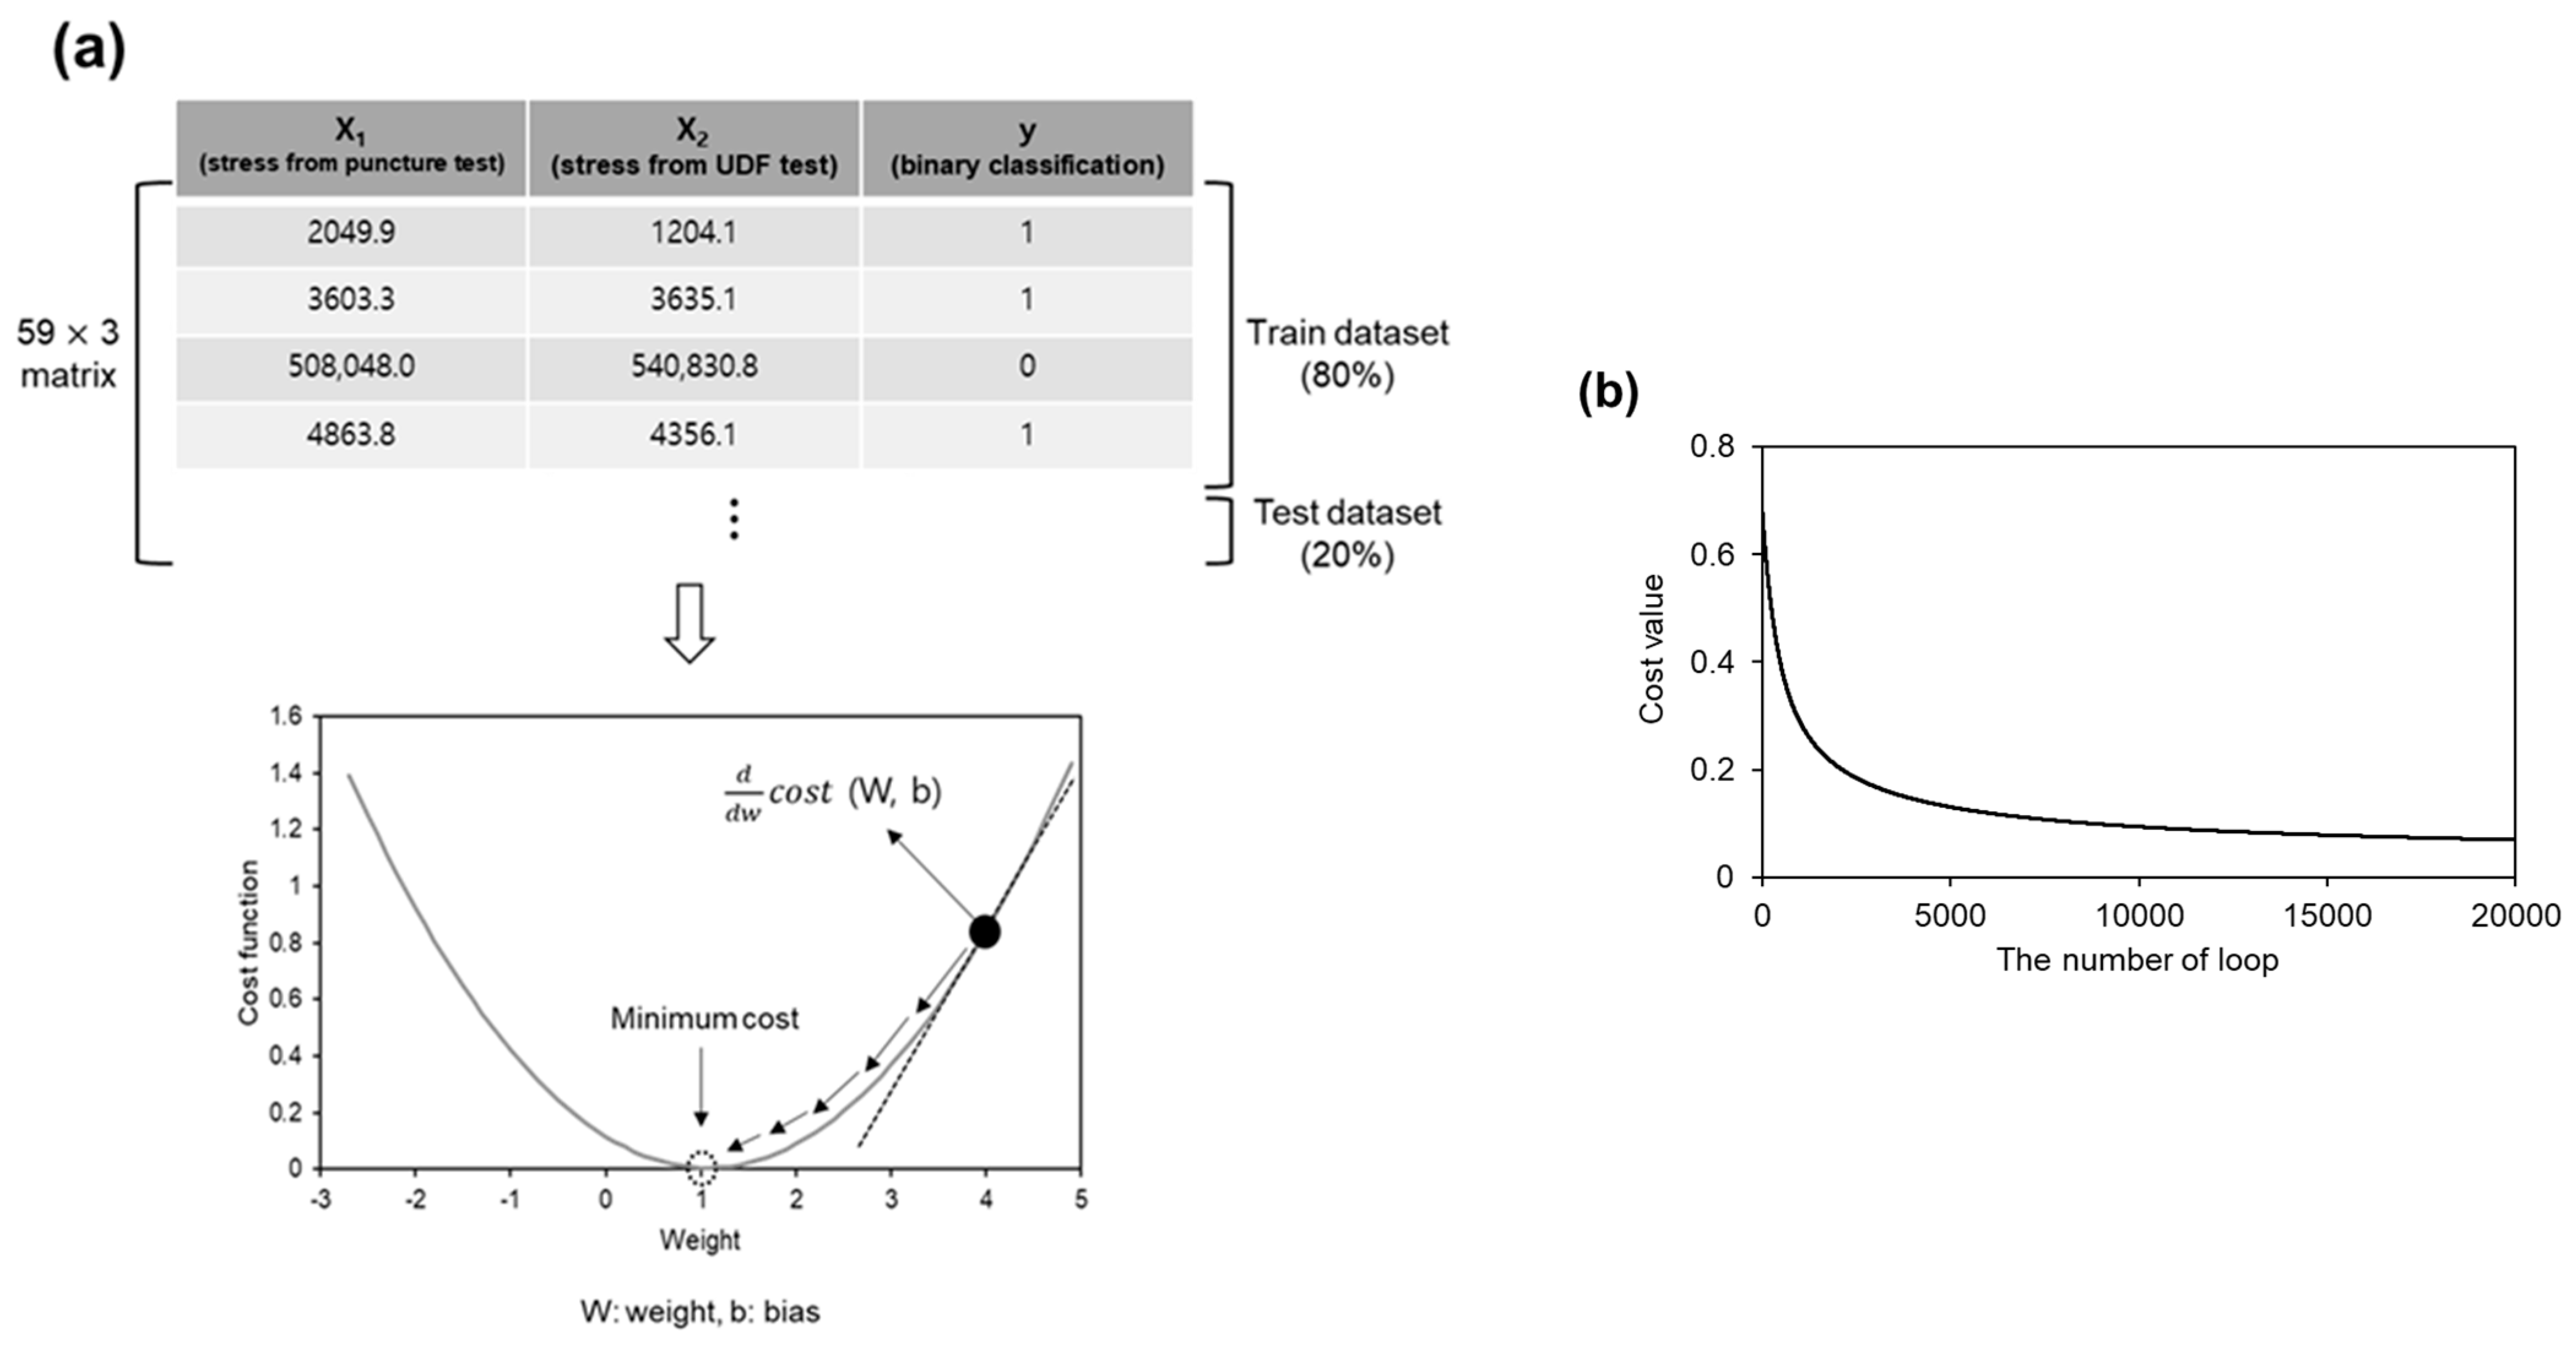
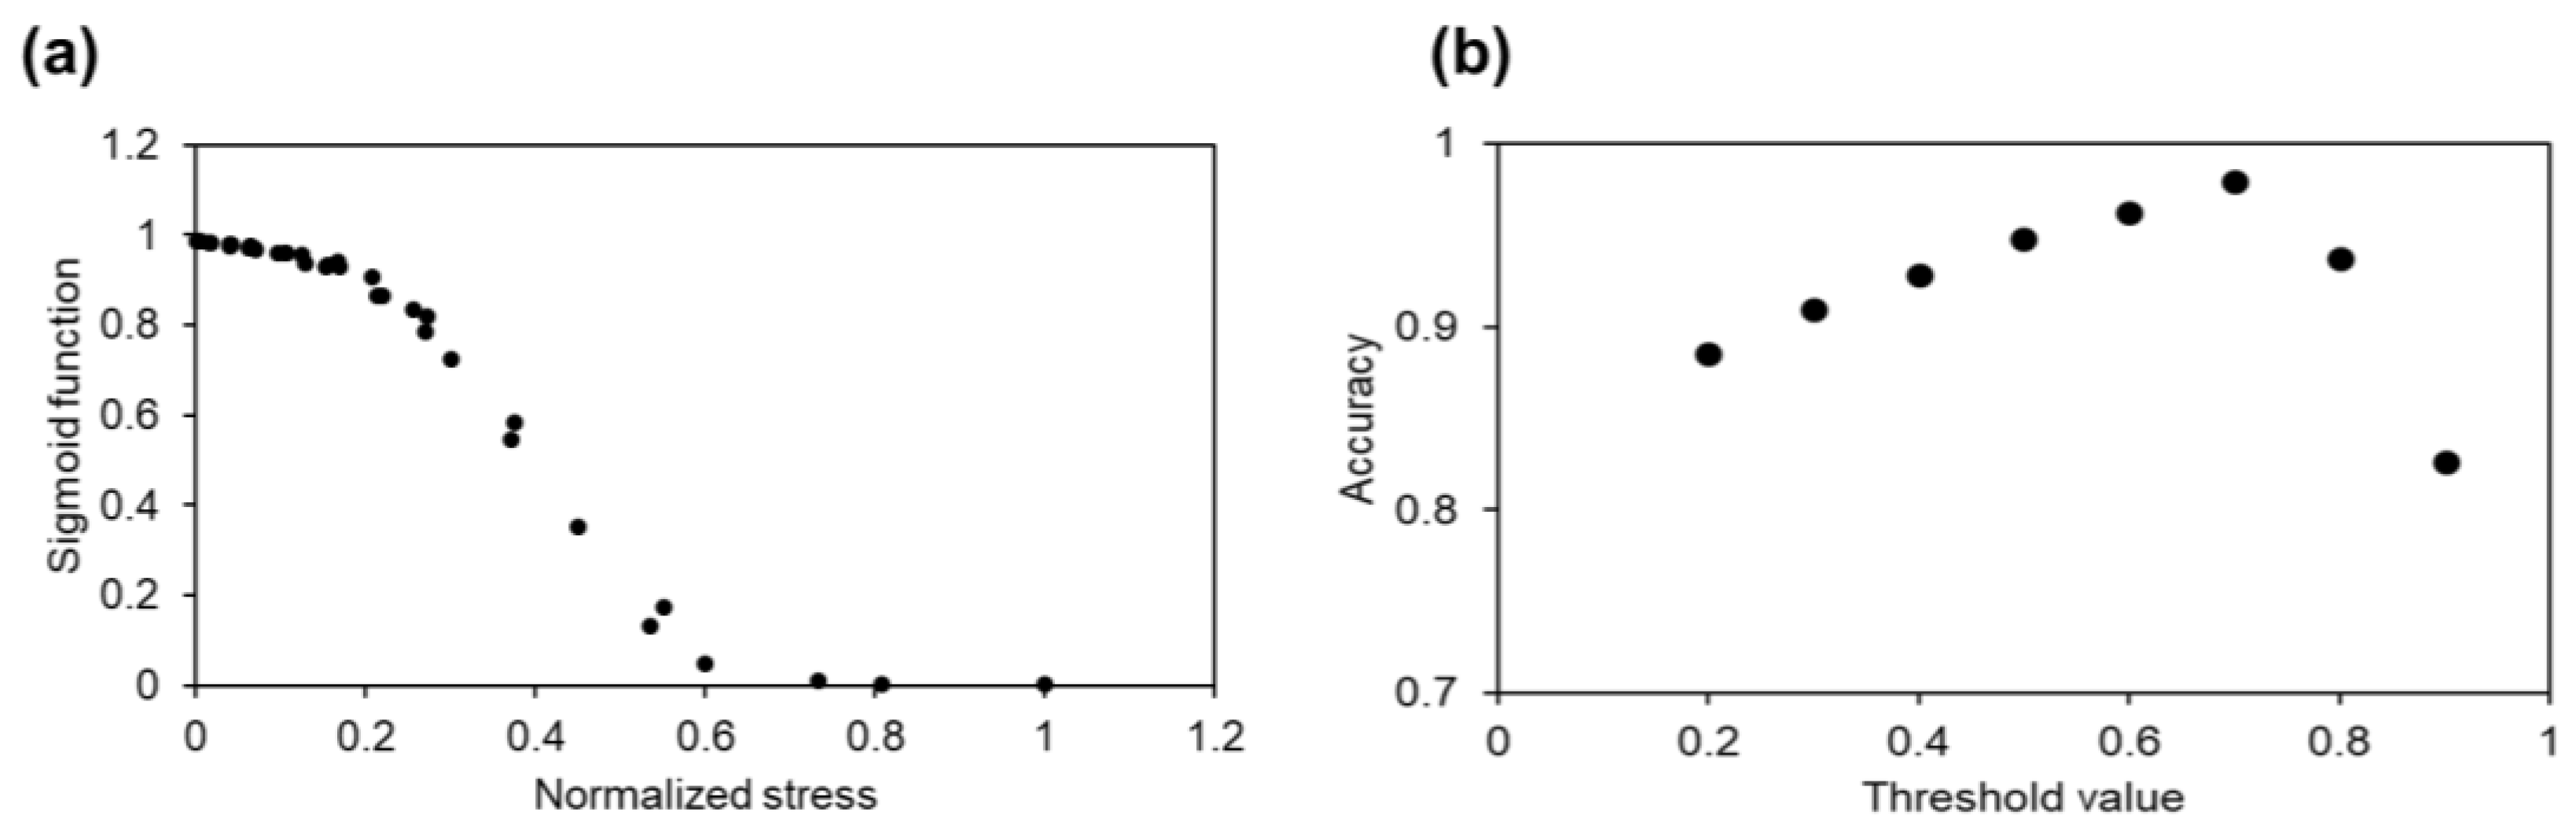
2.4. Machine Learning Analysis

Machine learning was employed in order to classify food samples for the elderly based on their rheological values experimentally measured. Python programming on the tensorflow (Google, Mountain View, CA, USA) was used for coding the machine learning algorithms. The datasets for machine learning consisted of a 59 × 3 matrix with hardness values measured from the UDF/puncture tests and binary values (0 or 1). Logistic regression using the sigmoid function was introduced to determine whether the food products satisfied the rheological criteria of foods for the elderly in terms of stress. The datasets were randomly divided into the training (80%) and testing (20%) sets based on the Python code developed in Anaconda. In this logistic regression, the cost function was minimized by the gradient descent algorithm, and the learning rate was 0.01. Over 20,000 iterations of the minimization step were carried out until the cost function became constant. After running the model, the accuracy of testing sets was evaluated depending on threshold values and was reported as the average values of 100 repetitions.
Cost   function   =   1 m [ i = 1 m y i log H ( x i ) + ( 1 y i ) log ( 1 H ( x i ) ) ]

3. Results and Discussion

Figure 1 shows the experimental setup for measuring the hardness of the gel samples prepared with different levels of mung bean starch. As can be seen in Figure 1a, the UDF test allowed a probe to extrude into a food sample that was squeezed out between the probe and the inside wall of the container. Figure 1b illustrates a puncture test where a rod-shaped probe penetrated into the food sample. In a puncture test, there is a general rule called “semi-infinite geometry” [26], according to which the sample needs to be larger in diameter than the probe used, since shear force and compressive force are simultaneously involved. Since the size of the probe in the puncture test is relatively small, this test has the advantage of being universally applied to a variety of foods regardless of their shape and dimension [27]. In the cutting-shear (Figure 1c) and compression (Figure 1d), the sample was cut into two pieces using a blade and compressed with a probe larger in diameter than the sample, respectively. As shown in Figure 1, the highest values of hardness were observed in the UDF test, followed by the compression, cutting-shear, and puncture tests. This order seemed to be related to the probe area in contact with the gel samples. In addition, for all the measurements, the hardness values increased with increasing levels of starch in a highly linear way (R2 > 0.94). This result was favorably compared with that reported by Kim, Oh, Yang, and Lee [27], which showed a highly positive correlation between the tests with rod and cylinder probes for measuring the rheological properties of cooked instant rice.
Figure 2a exhibits the relationships between the UDF and each texture method, showing fairly linear correlations. Specifically, the highest coefficient of determination (R2 = 0.9885) was observed between the UDF and puncture tests. As a fundamental rheological term, stress indicates the ratio of force to area [28]. As shown in Figure 2b, the relationships were investigated in terms of stress (N/m2) instead of force (N). The results obtained from the cutting-shear test were excluded in Figure 2b due to the unavailability of the contacting area of the cutting probe used. As can be seen in Figure 2b, the puncture test appeared to be highly inter-correlated with the UDF test. Thus, out of the three rheological methods, the puncture test was selected and further investigated as an alternative method to the UDF test.
A total of 59 commercial food samples were selected and then subjected to both UDF and puncture tests. Figure 3 presents the stress values of the food samples measured by the UDF and puncture tests. A fairly linear correlation (y = 0.9982x, R2 = 0.9772) was observed between the two tests for the samples with the stress values lower than that of the starch gels tested in this study (8 × 10⁵ N/m2). On the other hand, when the stress values became higher, the relationship between the UDF and puncture tests was well-fitted to the quadratic polynomial model (y = −2 × 10−4x2 + 1.0836x, R2 = 0.9706).
Several previous studies have classified foods for the elderly based on rheological measurements. The Japan Care Food Conference [9] and Korean Industrial Standards [29] reported that the upper stress limit of the foods for the elderly was 500,000 N/m2. In addition, Kim et al. [30] compared instrumental and sensory measurements of foods for the elderly, suggesting the stress range lower than 500,000 N/m2. Thus, machine learning analysis was applied for identifying foods for the elderly based on the stress values (500,000 N/m2). Figure 4a shows the overall procedure of gradient descent-based machine learning algorithm. The datasets consisted of a 59 × 3 matrix containing the stress values obtained from UDF/puncture tests and binary values where 1 (yes) and 0 (no) indicate that the sample satisfied and did not satisfy the rheological criteria of foods for the elderly, respectively. A matrix multiplication on the inputs (x) and weights (W) was performed, and a bias (b) was added to the weighted sum. A gradient descent algorithm was then used to minimize the cost function whose partial derivative was iteratively computed to obtain the most appropriate model [31]. By successive iterations, the gradient descent algorithm converged to a point where the derivative of the cost function, that is, a curve slope at a point was close to zero (Figure 4a). Consequently, it provided the optimal parameters for the models by approaching the minimum of the cost function. Figure 4b shows the plots of cost function versus the number of iterations. The cost function of the binary logistic model was reduced by successive iterations and became stable.
As one of various machine learning algorithms, the binary logistic regression model has been used to predict binary responses based on one or more predictor variables. Specifically, this algorithm has played a critical role in developing a spam email filter [32]. In the binary logistic model, a model is trained to make a binary decision about a new input observation. For doing so, the difference between predicted and experimental values is considered over the whole training dataset for training to validate the performance of the established model [33]. It is noted that the data in the binary logistic regression model are classified into two categories such as 1 (yes) and 0 (no) depending on the classification threshold. Thus, in this study, the binary classifications were applied in order to indicate whether food products belonged to the elderly’s foods (lower than 500,000 N/m2) or not (higher than 500,000 N/m2) [9,34]. As illustrated in Figure 5a, the binary logistic regression had a characteristic S-shaped curve through the sigmoid function. In the binary logistic model, the optimal value of the threshold needs to be decided during the training in order to maximize the model accuracy [35]. Thus, in this sigmoid curve, a classification threshold was defined in order to map the logistic regression values to a binary category. After training the logistic model with the training datasets, the predicted classifications of the testing datasets were compared with the experimental ones. Figure 5b shows the accuracy of the binary logistic algorithm depending on threshold values ranging from 0.2 to 0.9. When the threshold value was 0.2, the accuracy was determined to be 0.8855. The accuracy had a distinct tendency to increase with increasing threshold values and became 0.9781 at a threshold value of 0.7. The threshold value higher than 0.8 led to a decrease in the accuracy. This accuracy seemed to be much higher than those of several preceding studies that used binary logistic algorithms to predict diabetes diagnosis (0.69) [36] and to classify engine oil condition (0.89) [37]. Thus, the binary logistic model seemed to be the most effective in identifying whether foods belong to the elderly foods or not based on their rheological values.

4. Conclusions

The demand to modify food texture for seniors has been on the rise with the rapidly growing aging rate throughout the world, but there is limited information on the instrumental methods that can be universally applied to a wider variety of foods. Thus, in this study, different rheological methods for the elderly foods were correlated in terms of stress, and the puncture test showed a good correlation with the conventional UDF test. When the 59 food products were subjected to both UDF and puncture tests, the quadratic polynomial model showed better performance in predicting the correlation between the two tests. Furthermore, the binary logistic regression was successfully employed for rheologically identifying whether the food products were foods for the elderly with an accuracy of 98%. Although the machine learning model used in this study was relatively simple and fundamental, the results of this study may suggest a pioneering framework for identifying the rheological levels of foods for the elderly by combining experimental results with machine learning technology in the domain of food application. This new research framework can provide an opportunity for the food industry to move toward convergence technology and also to extend the utilization of machine learning to various food systems.

Author Contributions

Conceptualization, S.J. and H.K.; methodology, S.J. and H.K., and S.L.; investigation, S.J. and H.K.; data curation, S.J. and H.K., and S.L.; writing—original draft preparation, S.J., and S.L.; writing—review and editing, S.J., and S.L.; supervision, S.L.; project administration, H.K., and S.L.; funding acquisition, S.L.; All authors have read and agreed to the published version of the manuscript.

Funding

This research was supported by the research program from Ministry of Food and Drug Safety, Korea (19162MFDS027).

Institutional Review Board Statement

Not applicable.

Informed Consent Statement

Not applicable.

Data Availability Statement

Not applicable.

Conflicts of Interest

The authors declare no conflict of interest.

References

  1. World Population Prospects 2019: Highlights. Available online: https://www.un.org/development/desa/publications/world-population-prospects-2019-highlights.html#:~:text=The%20world’s%20population%20is%20expected,United%20Nations%20report%20launched%20today (accessed on 2 February 2021).
  2. Youn, H.M.; Lee, H.J.; Lee, D.W.; Park, E.-C. The impact of poverty transitions on frailty among older adults in South Korea: Findings from the Korean longitudinal study of ageing. BMC Geriatr. 2020, 20, 1–10. [Google Scholar] [CrossRef] [Green Version]
  3. Nyberg, M.; Olsson, V.; Pajalic, Z.; Örtman, G.; Andersson, H.S.; Blücher, A.; Wendin, K.; Westergren, A. Eating difficulties, nutrition, meal preferences and experiences among elderly: A literature overview from a Scandinavian context. J. Food Res. 2015, 4, 22–37. [Google Scholar] [CrossRef]
  4. Kawashima, K.; Motohashi, Y.; Fujishima, I. Prevalence of dysphagia among community-dwelling elderly individuals as estimated using a questionnaire for dysphagia screening. Dysphagia 2004, 19, 266–271. [Google Scholar] [CrossRef] [PubMed]
  5. Blanař, V.; Hödl, M.; Lohrmann, C.; Amir, Y.; Eglseer, D. Dysphagia and factors associated with malnutrition risk: A 5-year multicentre study. J. Adv. Nurs. 2019, 75, 3566–3576. [Google Scholar] [CrossRef]
  6. McCullough, G.; Pelletier, C.; Steele, C. National dysphagia diet: What to swallow? ASHA Lead. 2003, 8, 16–27. [Google Scholar] [CrossRef]
  7. Ashraf, H.H.; Palmer, J.; Dalton, H.R.; Waters, C.; Luff, T.; Strugnell, M.; Murray, I.A. Can patients determine the level of their dysphagia? World J. Gastroenterol. 2017, 23, 1038. [Google Scholar] [CrossRef]
  8. Aguilera, J.M.; Park, D.J. Texture-modified foods for the elderly: Status, technology and opportunities. Trends Food Sci. Technol. 2016, 57, 156–164. [Google Scholar] [CrossRef]
  9. Fujisaki, T. Universal Design Foods. J. Jpn. Soc. Food Sci. 2008, 55, 78. [Google Scholar]
  10. Cichero, J.A.; Lam, P.; Steele, C.M.; Hanson, B.; Chen, J.; Dantas, R.O.; Duivestein, J.; Kayashita, J.; Lecko, C.; Murray, J. Development of international terminology and definitions for texture-modified foods and thickened fluids used in dysphagia management: The IDDSI framework. Dysphagia. 2017, 32, 293–314. [Google Scholar] [CrossRef] [PubMed] [Green Version]
  11. Schleder, G.R.; Padilha, A.C.; Acosta, C.M.; Costa, M.; Fazzio, A. From DFT to machine learning: Recent approaches to materials science–A review. J. Phys. Mater. 2019, 2, 032001. [Google Scholar] [CrossRef]
  12. Jordan, M.I.; Mitchell, T.M. Machine learning: Trends, perspectives, and prospects. Science 2015, 349, 255–260. [Google Scholar] [CrossRef]
  13. Ongsulee, P. Artificial intelligence, machine learning and deep learning. In Proceedings of the 2017 15th International Conference on ICT and Knowledge Engineering (ICT&KE), Bangkok, Thailand, 22–24 November 2017; pp. 1–6. [Google Scholar]
  14. Nilashi, M.; bin Ibrahim, O.; Ahmadi, H.; Shahmoradi, L. An analytical method for diseases prediction using machine learning techniques. Comput. Chem. Eng. 2017, 106, 212–223. [Google Scholar] [CrossRef]
  15. Vayena, E.; Blasimme, A.; Cohen, I.G. Machine learning in medicine: Addressing ethical challenges. PLoS Med. 2018, 15, e1002689. [Google Scholar] [CrossRef] [PubMed]
  16. Scher, S.; Messori, G. Predicting weather forecast uncertainty with machine learning. Q. J. R. Meteorol. Soc. 2018, 144, 2830–2841. [Google Scholar] [CrossRef]
  17. Sarkar, S.; Vinay, S.; Raj, R.; Maiti, J.; Mitra, P. Application of optimized machine learning techniques for prediction of occupational accidents. Comput. Oper. Res. 2019, 106, 210–224. [Google Scholar] [CrossRef]
  18. Li, Z.; Meier, M.A.; Hauksson, E.; Zhan, Z.; Andrews, J. Machine learning seismic wave discrimination: Application to earthquake early warning. Geophys. Res. Lett. 2018, 45, 4773–4779. [Google Scholar] [CrossRef] [Green Version]
  19. Bisgin, H.; Bera, T.; Ding, H.; Semey, H.G.; Wu, L.; Liu, Z.; Barnes, A.E.; Langley, D.A.; Pava-Ripoll, M.; Vyas, H.J. Comparing SVM and ANN based machine learning methods for species identification of food contaminating beetles. Sci. Rep. 2018, 8, 1–12. [Google Scholar] [CrossRef]
  20. Erban, A.; Fehrle, I.; Martinez-Seidel, F.; Brigante, F.; Más, A.L.; Baroni, V.; Wunderlin, D.; Kopka, J. Discovery of food identity markers by metabolomics and machine learning technology. Sci. Rep. 2019, 9, 1–19. [Google Scholar] [CrossRef] [PubMed] [Green Version]
  21. Jiménez-Carvelo, A.M.; González-Casado, A.; Bagur-González, M.G.; Cuadros-Rodríguez, L. Alternative data mining/machine learning methods for the analytical evaluation of food quality and authenticity–A review. Food Res. Int. 2019, 122, 25–39. [Google Scholar] [CrossRef]
  22. Ministry of Food and Drugh Safety in South Korea, Food Code. Available online: https://www.foodsafetykorea.go.kr/foodcode/03_01.jsp (accessed on 21 February 2021).
  23. Park, J.D.; Cho, B.K.; Kum, J.S.; Lee, H.-Y. Quality properties of cooked germinated-brown rice. Korean J. Food Preserv. 2005, 12, 101–106. [Google Scholar]
  24. Góral, D.; Kluza, F. Cutting test application to general assessment of vegetable texture changes caused by freezing. J. Food Eng. 2009, 95, 346–351. [Google Scholar] [CrossRef]
  25. Kim, Y.; Kim, H.; Lee, S. Artificial saliva-induced structural breakdown of rice flour gels under simulated chewing conditions. Food Sci. Biotechnol. 2019, 28, 387–393. [Google Scholar] [CrossRef]
  26. Bourne, M. Food Texture and Viscosity: Concept and Measurement, 2nd ed.; Academic Press: Cambridge, MA, USA, 2002. [Google Scholar]
  27. Kim, H.; Oh, I.; Yang, S.; Lee, S. A comparison of rheological measurement methods of instant cooked rice by a texture analyzer. Food Eng. Prog. 2018, 22, 381–385. [Google Scholar] [CrossRef]
  28. Lee, S.; Kim, Y. Food Rheology: Principles and Applications; Soohaksa: Seoul, Korea, 2017; ISBN 978-89-7140-708-0. [Google Scholar]
  29. Korean Industrial Standards: Seniors Friendly Foods (KS H 4897). Available online: https://e-ks.kr/streamdocs/view/sd;streamdocsId=72059203773233835 (accessed on 21 February 2021).
  30. Kim, Y.; Kim, H.J.; Cho, W.; Ko, S.; Park, S.K.; Lee, S. Classification of starch gel texture for the elderly diets based on instrumental and sensory methodology. J. Texture Stud. 2017, 48, 357–361. [Google Scholar] [CrossRef]
  31. Ruder, S. An overview of gradient descent optimization algorithms. arXiv 2016, arXiv:1609.04747. [Google Scholar]
  32. Chang, M.-W.; Yih, W.-T.; Meek, C. Partitioned logistic regression for spam filtering. In Proceedings of the 14th ACM SIGKDD International Conference on Knowledge Discovery and Data Mining, Las Vegas, NV, USA, 24–27 August 2008; pp. 97–105. [Google Scholar]
  33. Sharma, A.S.; Prince, S.; Kapoor, S.; Kumar, K. PPS—Placement prediction system using logistic regression. In Proceedings of the 2014 IEEE International Conference on MOOC, Innovation and Technology in Education (MITE), Patiala, India, 19–20 December 2014; pp. 337–341. [Google Scholar]
  34. Park, H.; Um, K.H.; Lee, S. A hardness survey on crushed meat products in the Korean Market for the development of meat foods for seniors. Food Eng. Prog. 2019, 23, 139–145. [Google Scholar] [CrossRef]
  35. Pendharkar, P.C. A threshold-varying artificial neural network approach for classification and its application to bankruptcy prediction problem. Comput. Oper. Res. 2005, 32, 2561–2582. [Google Scholar] [CrossRef]
  36. Selvakumar, S.; Kannan, K.S.; GothaiNachiyar, S. Prediction of diabetes diagnosis using classification based data mining techniques. Int. J. Stat. Syst. 2017, 12, 183–188. [Google Scholar]
  37. Phillips, J.; Cripps, E.; Lau, J.W.; Hodkiewicz, M. Classifying machinery condition using oil samples and binary logistic regression. Mech. Syst. Signal Process. 2015, 60, 316–325. [Google Scholar] [CrossRef]
Figure 1. Experimental setup of rheological measurement of starch gels and their hardness values (Universal design food (UDF) test (a), puncture test (b), cutting-shear test (c), and compression test (d)).
Applsci 11 02262 g001
Figure 2. Correlations between UDF and other texture-measuring methods for starch gels (hardness (a) and stress (b)).
Applsci 11 02262 g002
Figure 3. Texture measurements of commercial products by UDF and puncture tests.
Applsci 11 02262 g003
Figure 4. Machine learning analysis for the binary classification of the elderly foods (dataset (a) and gradient descent (b)).
Applsci 11 02262 g004
Figure 5. Identification of the elderly foods by binary logistic regression depending on threshold values (sigmoid function (a) and accuracy (b)).
Applsci 11 02262 g005
Table 1. List of commercial products for rheological measurements.
Classification by Korean Food CodeSamples
Confectionery, Bread, or Rice CakesBrownie (Orion, Seoul, Korea), Butter roll bread (SPC, Gyeonggi-do, Korea), Plain bread (Lotte, Seoul, Korea), Sweet red bean jelly (Haitai, Seoul, Korea), Baekseolgi (Rice cake shop, Seoul, Korea), Garaetteok (Rice cake shop), Jeungpyeon (Rice cake shop), Injeolmi (Rice cake shop), Jeolpyeon (Rice cake shop), Sticky rice cake (Rice cake shop), Sirutteok (Rice cake shop), Pudding custard (CJ Cheiljedang, Gyeong-gi, Korea), Yakgwa (Hanul confectionery, Gyeong-gi, Korea), Chiffon cake (SPC), Pound cake (SPC)
JamsStrawberry jam (Ottogi, Gyeong-gi, Korea)
Tofu or Jellied FoodTofu (Pulmuone, Seoul, Korea)
Soybean SaucesGochujang (CJ Cheiljedang), SSamjang (CJ Cheiljedang)
Salted or Boiled FoodsPickled radish (Ilga, Sejong-si, Korea)
Processed Agricultural ProductsWhite mushroom (Moring Farm, Gyeongsang, Korea)
Processed Meat and Packaged MeatSmoked ham (Samhoham, Gyeong-gi, Korea), Sausage (Lotte), Frank sausage (Hansung, Gyeongsang, Korea), Chicken steak (Farmsco, Gyeong-gi, Korea), Brown rice chicken steak (Haetsal Food System, Gyeong-gi, Korea), Hamburg steak (CJ Cheiljedang), Hamburg steak (Ottogi)
Dairy ProductsMozzarella cheese (Saputo, Montreal, Canada), Monterey jack cheese (Great lakes cheese, Hiram, Georgia, USA), Cheddar cheese (Great lakes cheese)
Fishery ProductsFish cake bar (Sajo, Gyeong-gi, Korea)
Instant FoodsInstant rice (CJ Cheiljedang), Instant abalone porridge (CJ Cheiljedang)
Publisher’s Note: MDPI stays neutral with regard to jurisdictional claims in published maps and institutional affiliations.

