
Identification of the Relationship between Maritime Autonomous Surface Ships and the Operator’s Mental Workload


Abstract
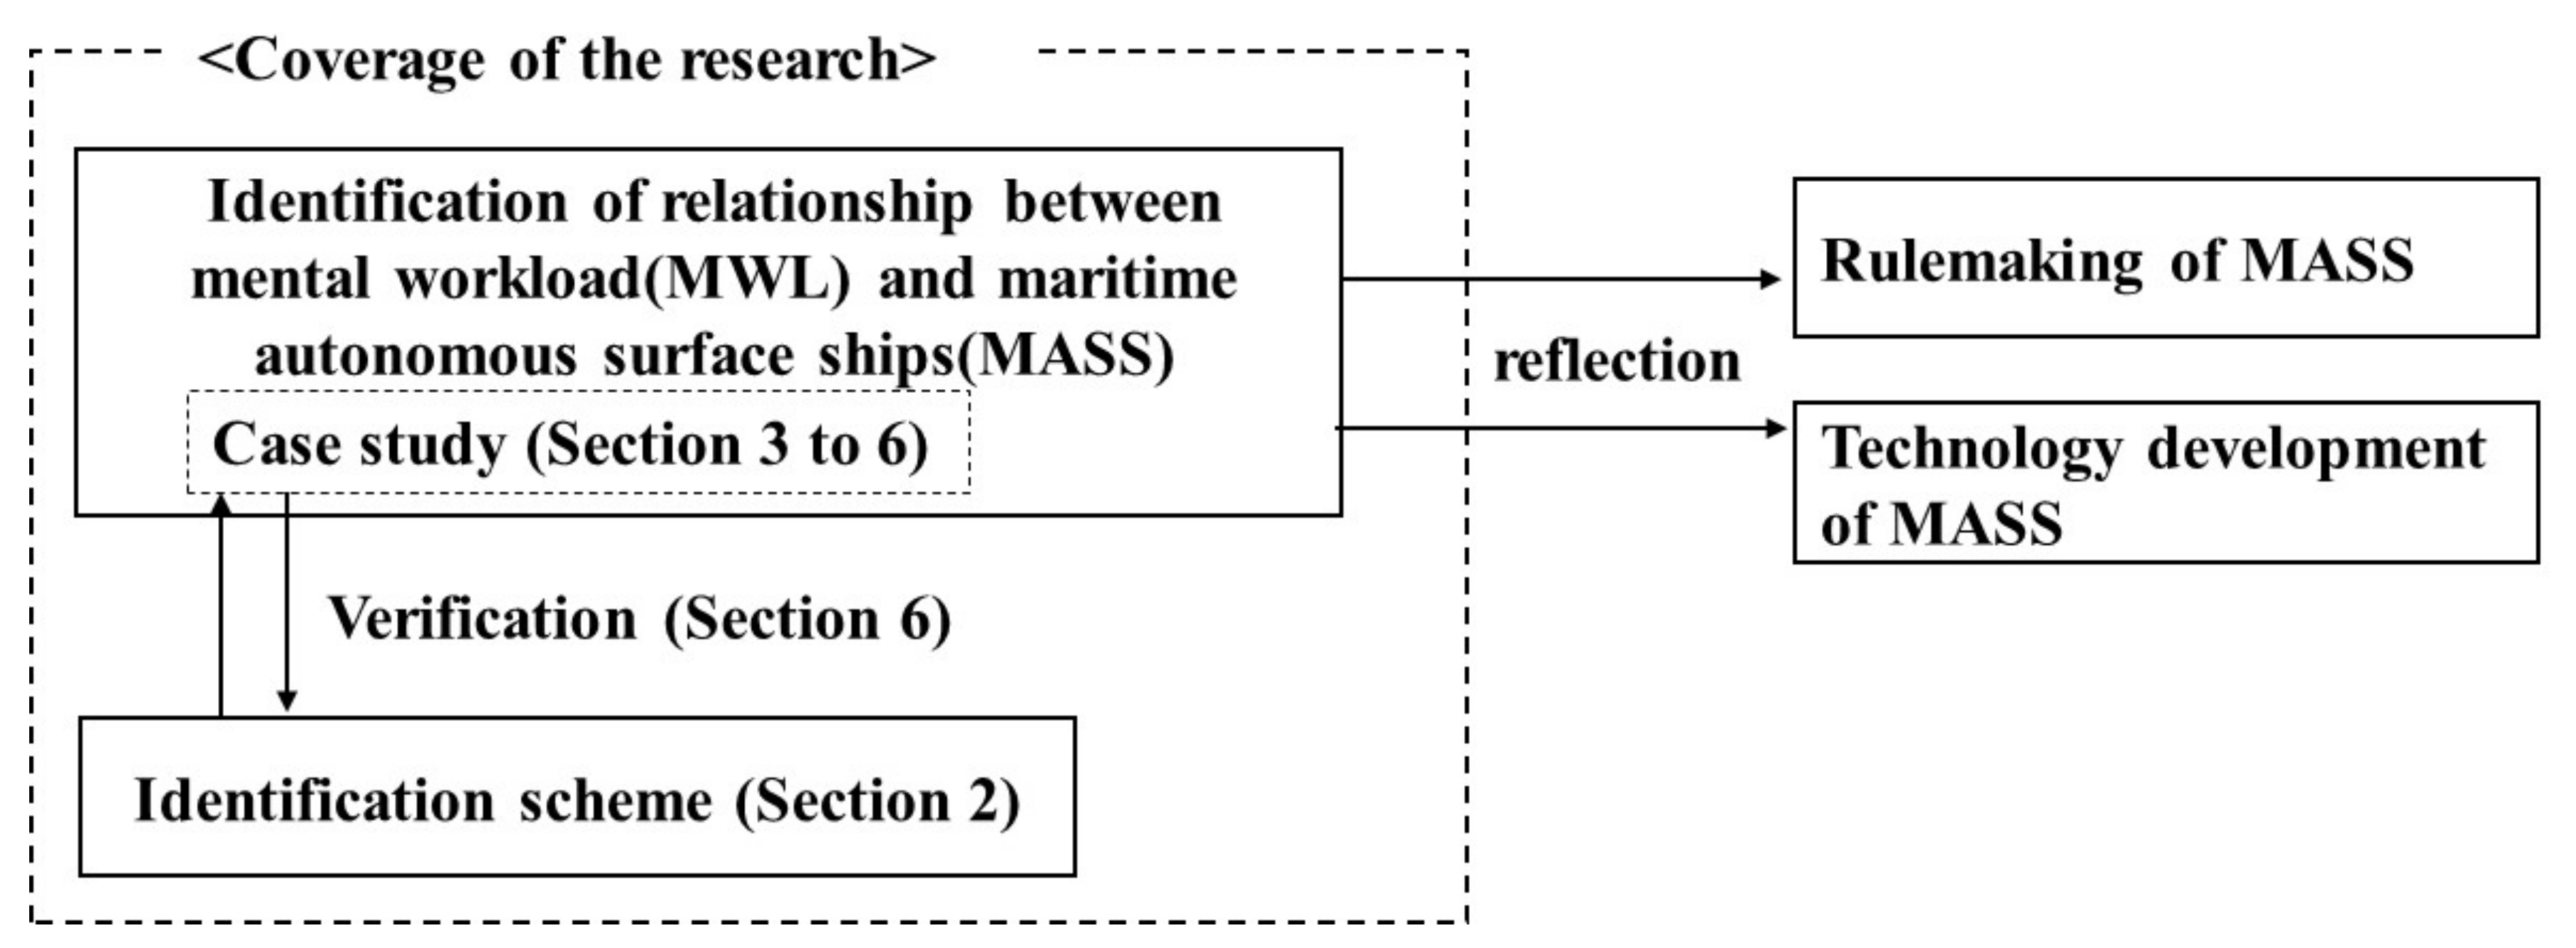
:1. Introduction
2. Relationship between MWL and MASS
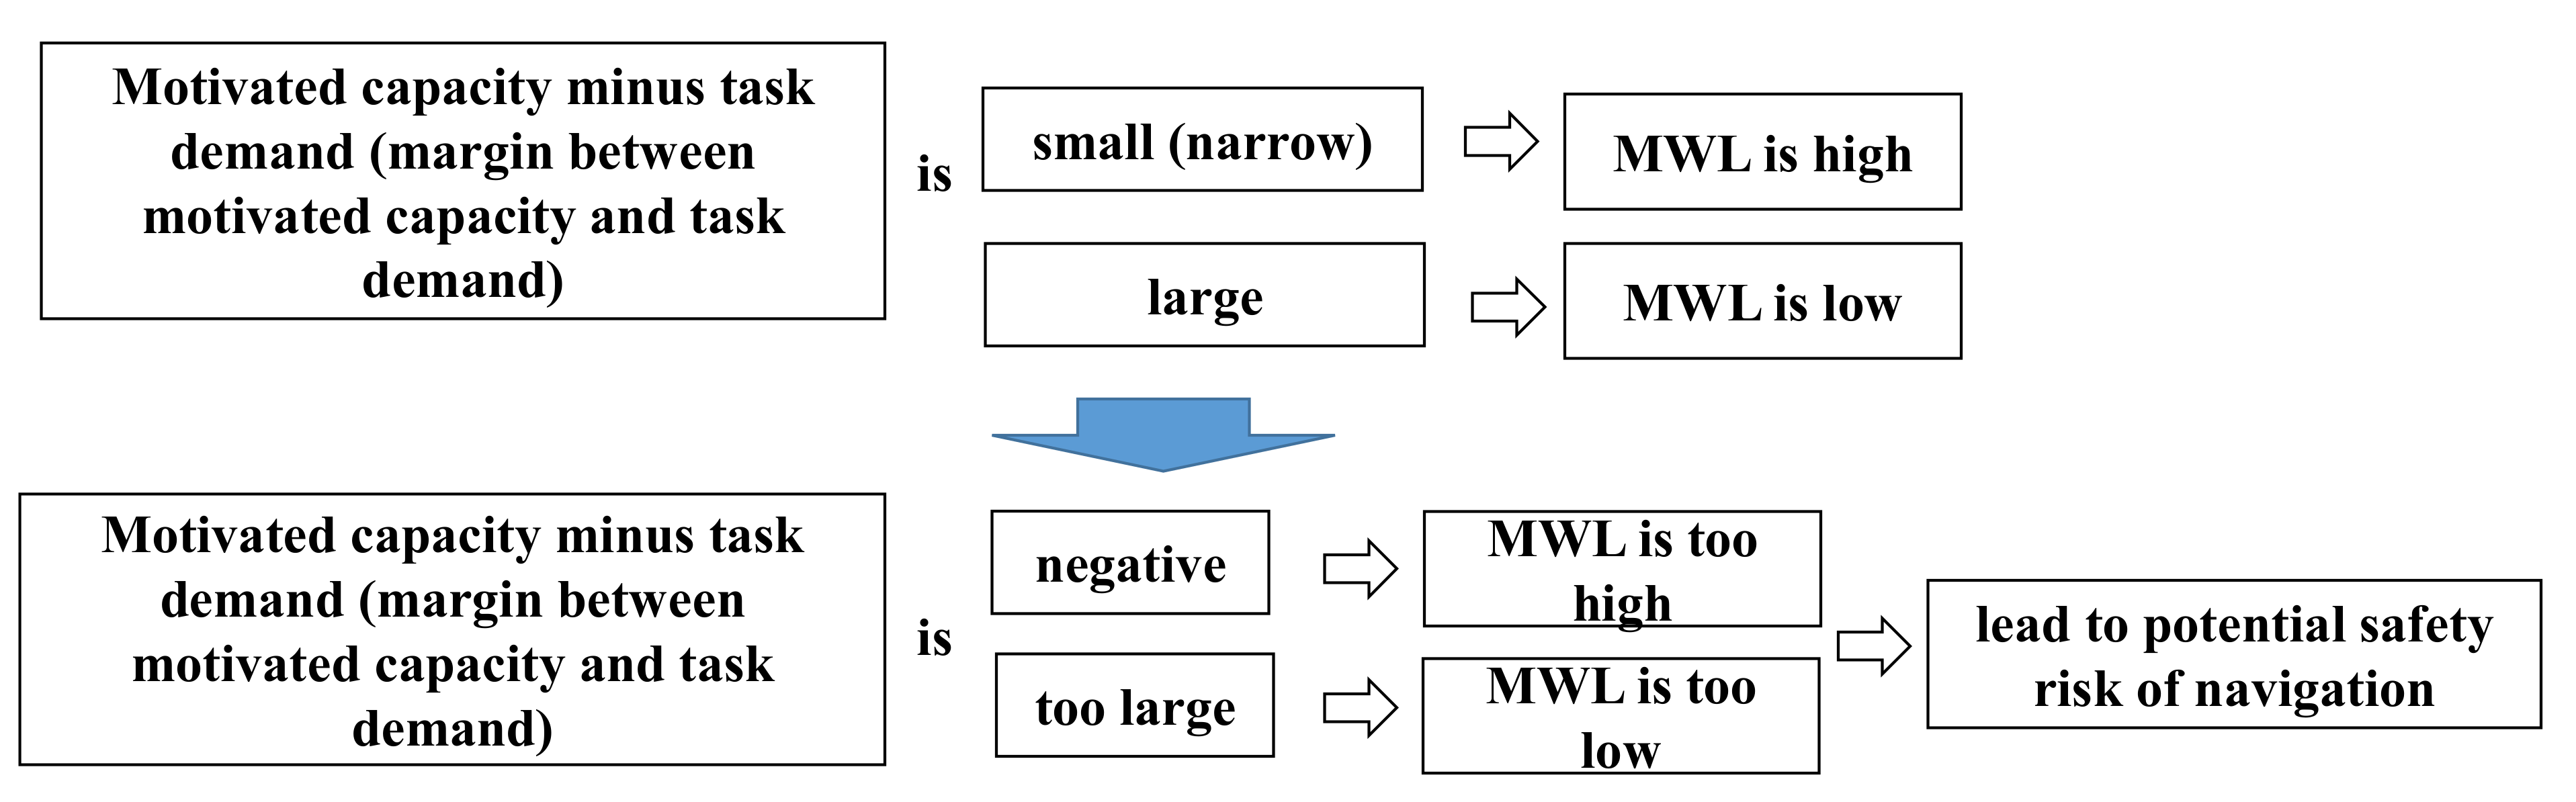
2.1. Mental Workload and Safety
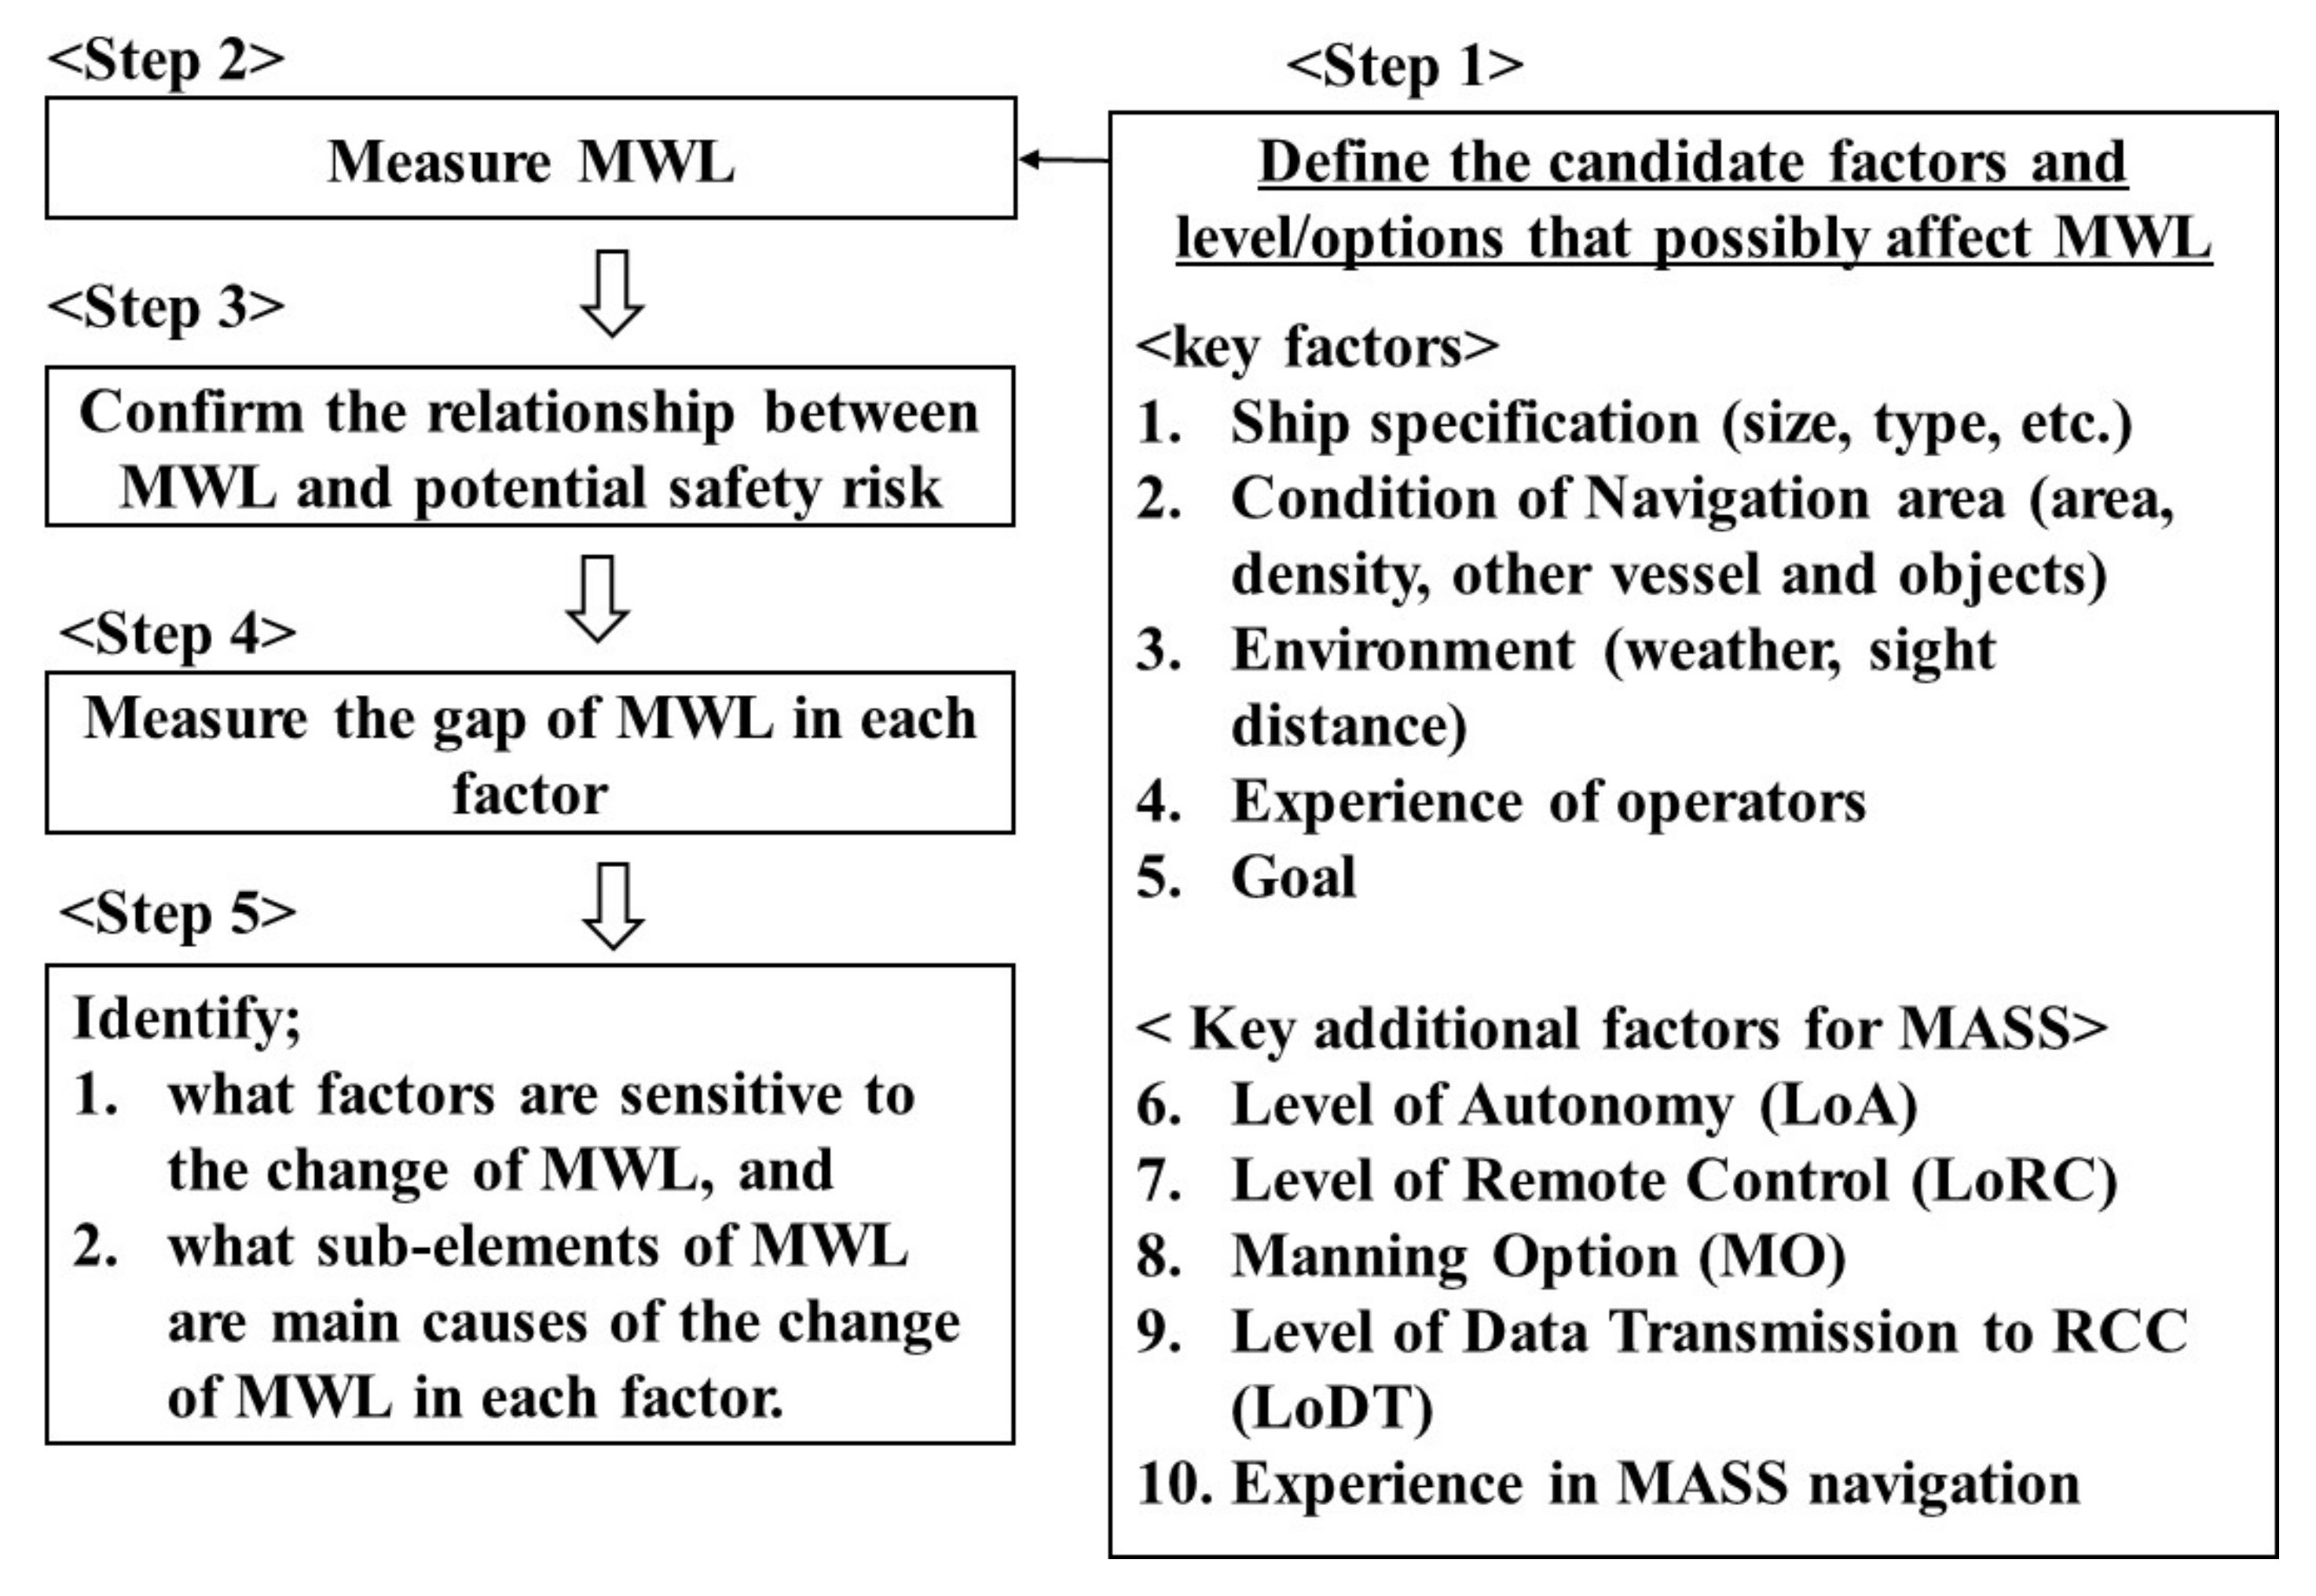
2.2. MWL–MASS Identification Scheme
2.3. Key Additional Factors for MASS
3. Case Study (Levels and Options of Factors (Step 1 in Figure 3))
3.1. Levels and Options of Candidate Factors That May Affect the MWL of Operators (Step 1 in Figure 3)
3.2. Factors on General Matters (1–5 of Step 1 in Figure 3)
3.2.1. Navigational Condition
3.3. Additional Factors for MASS (6–10 of Step 1 in Figure 3)
3.3.1. Level of Autonomy (LoA) and Level of Remote Control (LoRC)
- LoA-2: The system can identify non-AIS ships (e.g., small boats) and objects (e.g., driftwoods), make some warning on the existence of these objects, and advise on appropriate collision avoidance routes;
- LoA-3: The system can make autonomous collision avoidance in addition to LoA2. The system takes preventive action for collision avoidance before the target ships enter the obstacle zone by the target;
- Both systems are highly reliable, although there is a slight chance of failure.
3.3.2. Manning Option (MO)
- Group 1 (responsible officer: RO): remote operators, OOWs or captain and helmsperson (total of two persons) who have the responsibility for navigation;
- Group 2 (support operator: SO): lookout for supporting watchkeeping.
3.3.3. Level of Data Transmission to RCC (LoDT) (Visibility on Screen and Sound at RCC)
4. Case Study (Method)
4.1. Participants
- They were active seafarers, because they should accurately grasp the real situation from recorded video during the interview;
- They were qualified officers in charge of a navigational watch, chief mates (officers) or masters (captains) in accordance with regulation II/1 and II/2 of the STCW Convention, because they answered questions as a responsible officer (RO);
- They had an experience of international ocean-going service on a ship of more than 3000 GT; scenarios in the case study included the option of navigating this size of ships in the ocean;
- Participants should have a variation of ranks and experiences to acquire balanced results.
4.2. Scenario Setting
4.3. Methodology
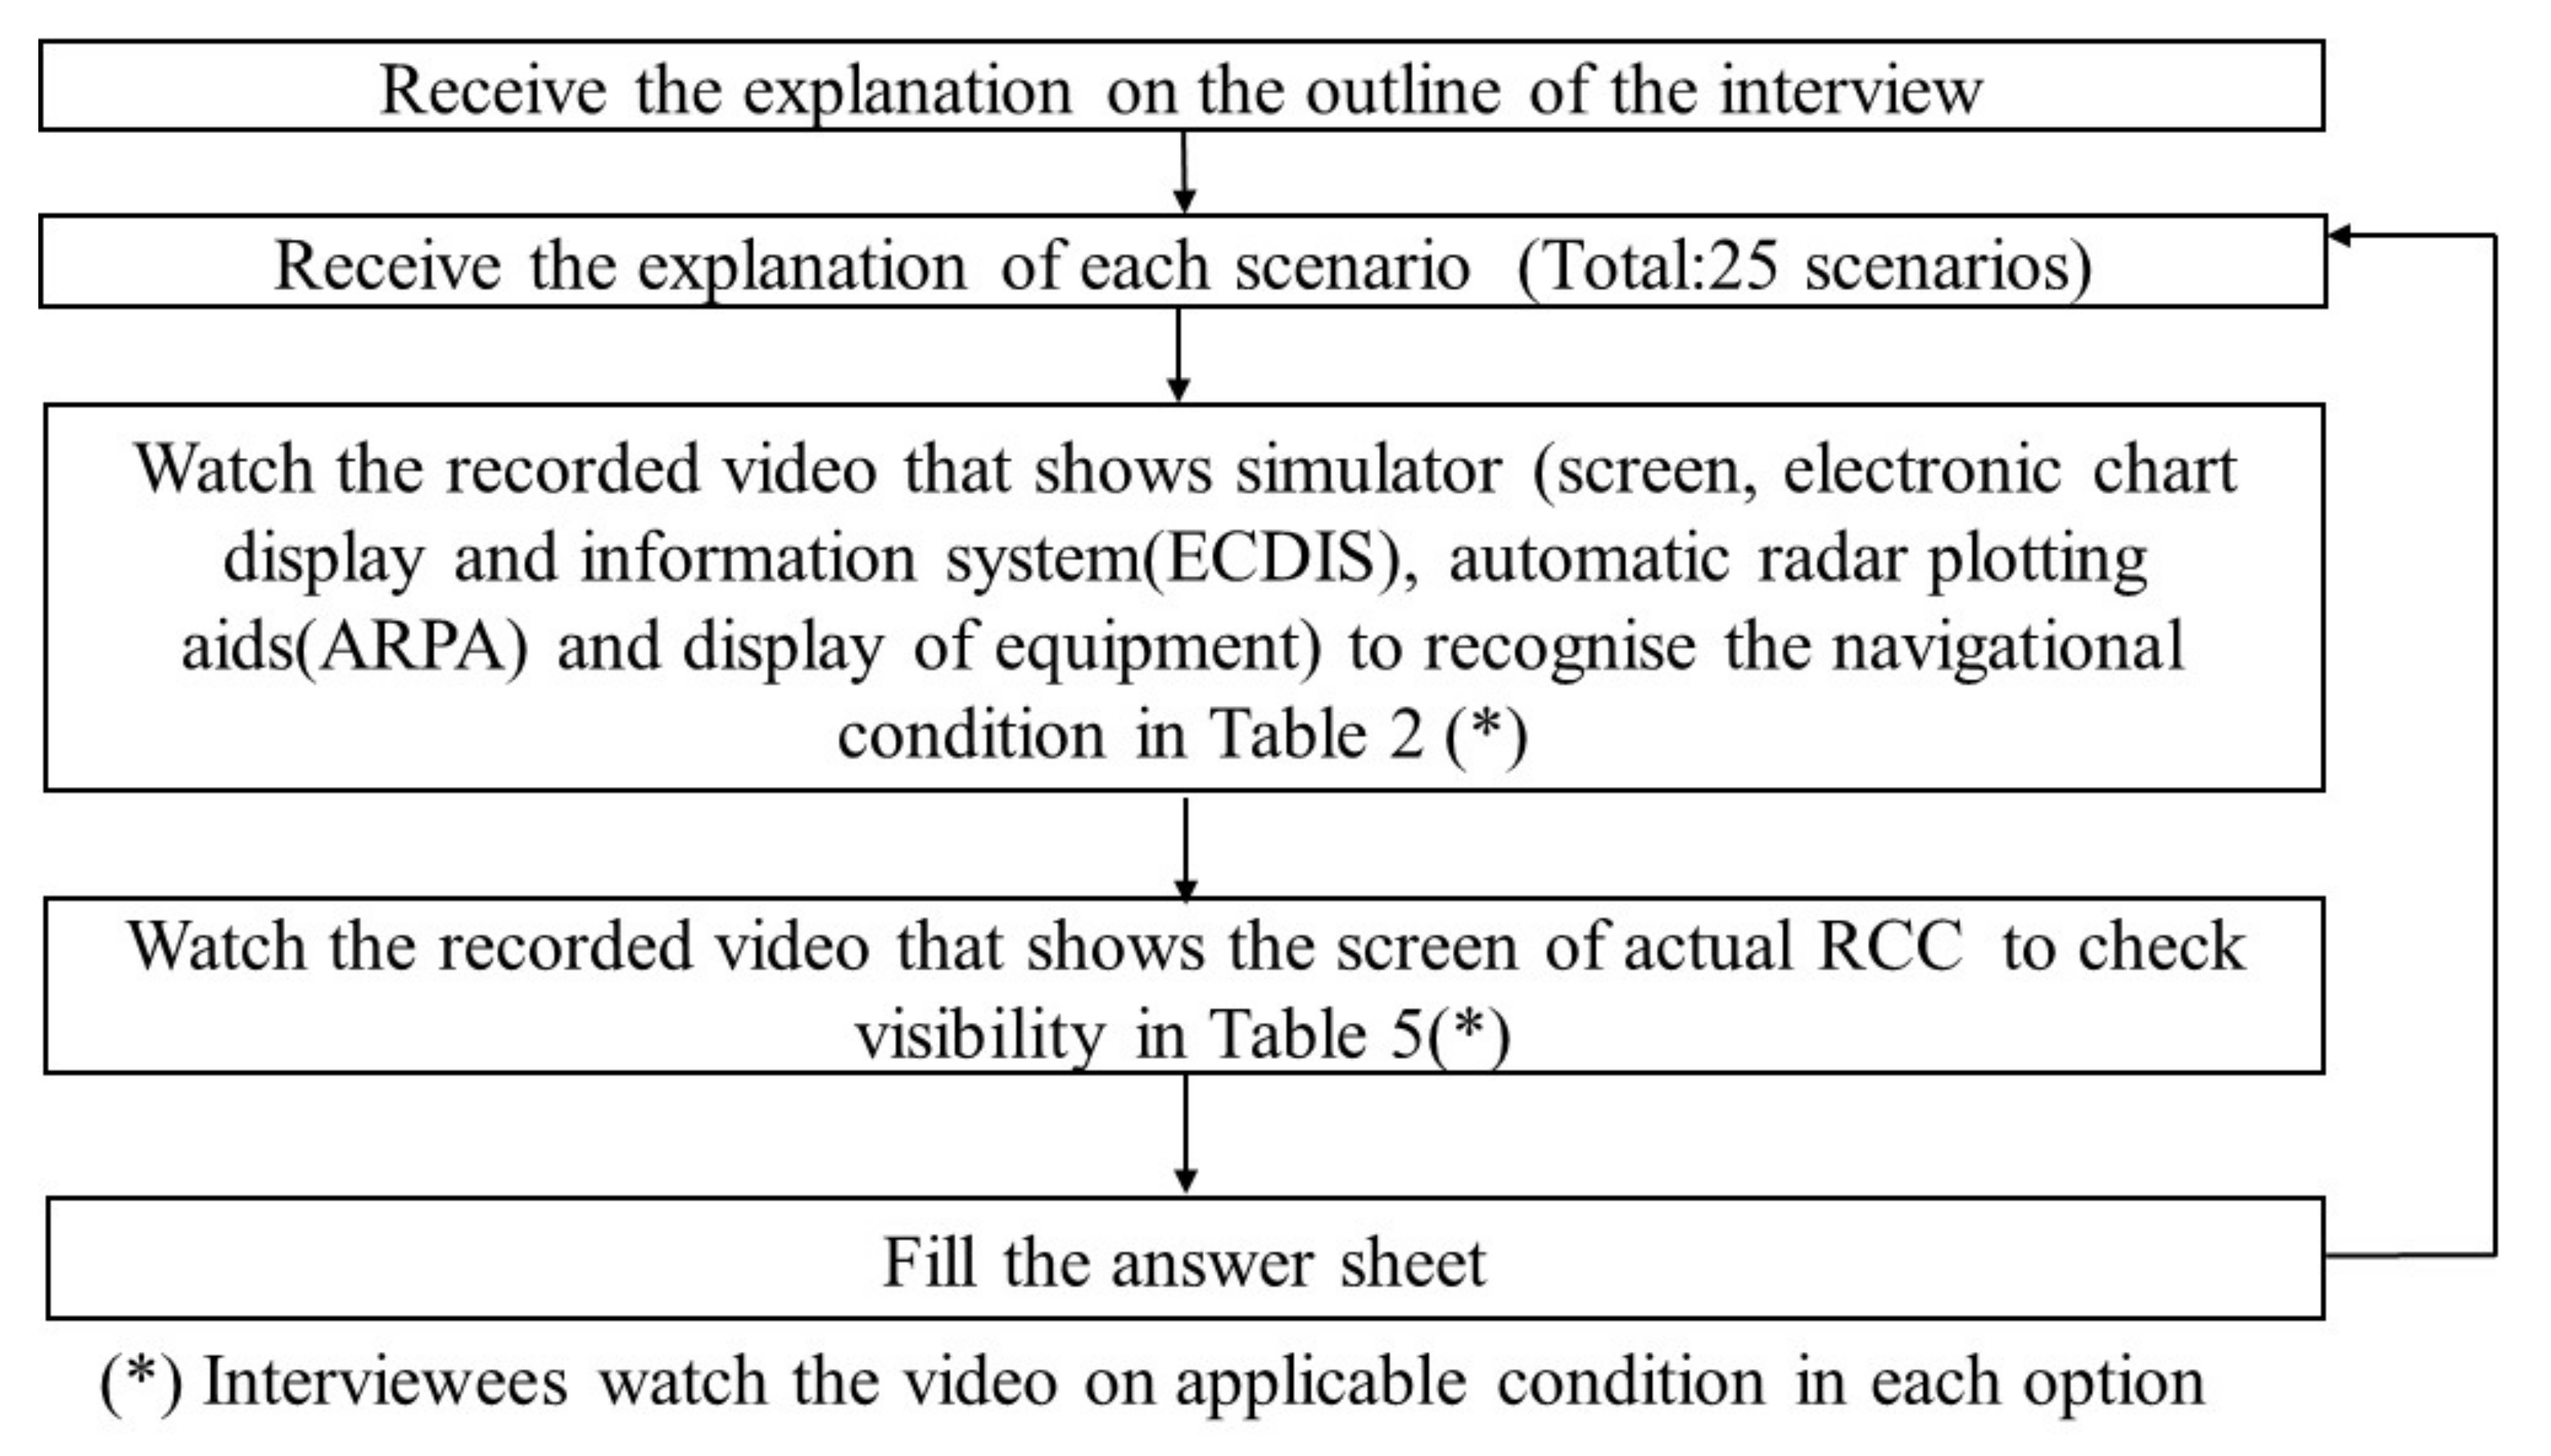
4.4. Process of Interview
5. Case Study (Results (Step 2 to 5 in Figure 3))
5.1. Relationship Between MWL and Potential Safety Risk (Step 3 in Figure 3)
5.2. Gap of MWL in Each Factor (Step 4 in Figure 3)
5.2.1. Ship Autonomy Level
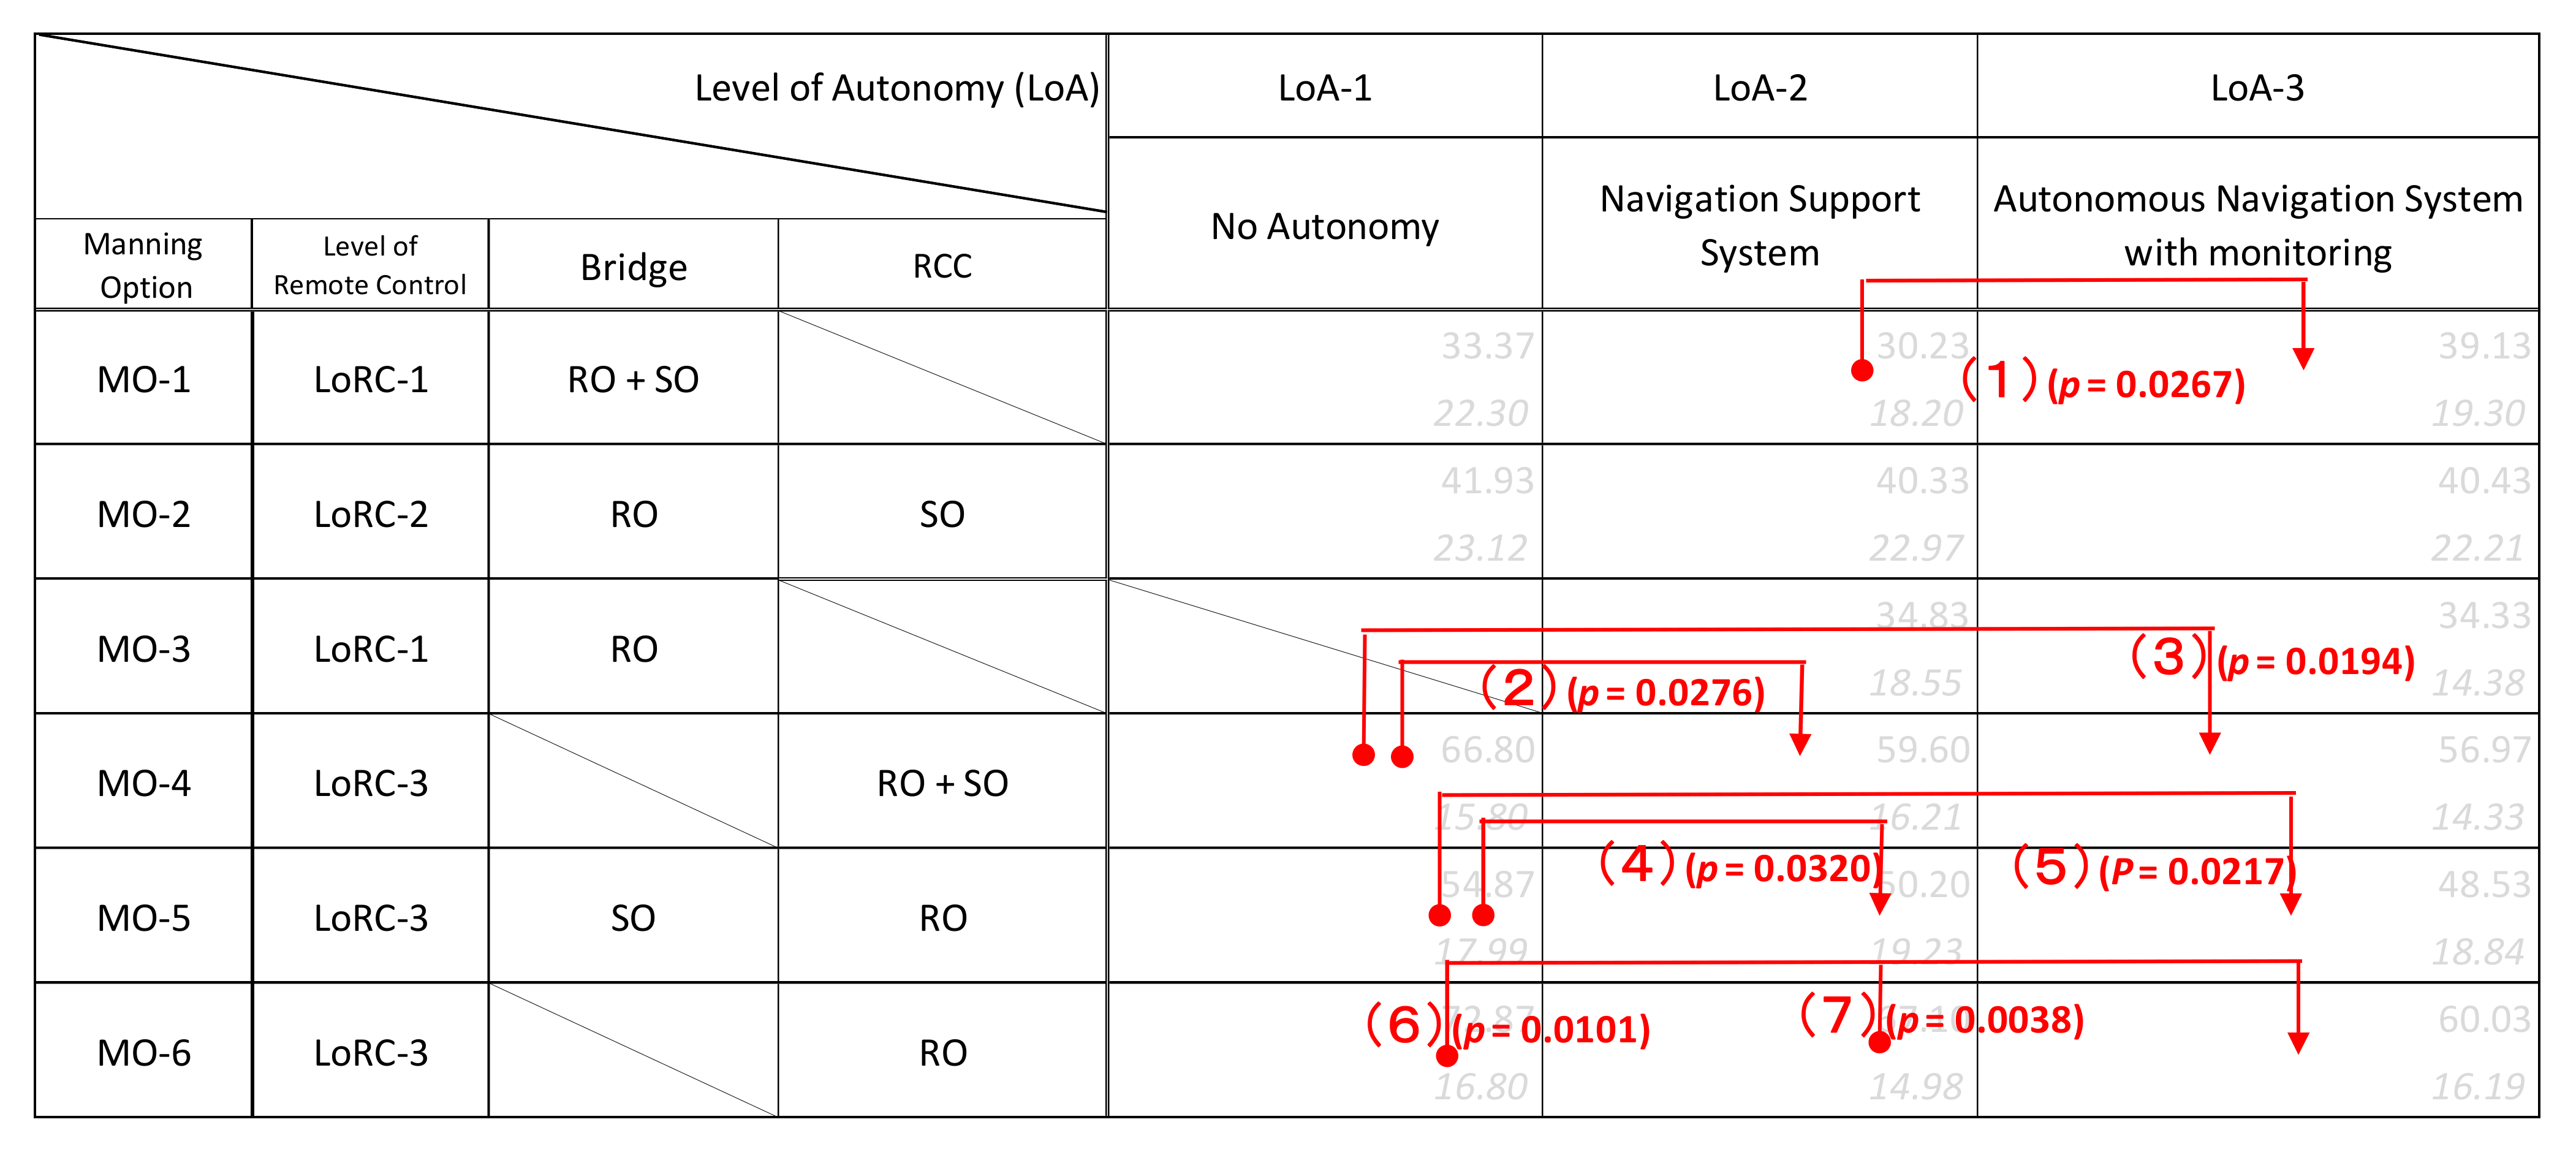
- Installation of navigation support systems (LoA-2) and autonomous navigation systems (LoA-3) do not show apparent positive effects on the MWL of responsible operators (ROs) when they are onboard a ship (MO-1, MO-2 and MO-3). The autonomous system rather negatively affected MWL in one case ((1) in Figure 6 and Table 9);
- Installation of navigation support systems (LoA-2) and autonomous navigation systems (LoA-3) show apparent positive effects on the MWL when ROs are at the RCC (MO-4, MO-5 and MO-6);
- Mental demands are the key sub-elements to decrease the MWL of ROs at RCC when autonomous navigation systems are installed in the case of (3), (5) and (6) in Figure 6 (Table 10). Mental demands were also the key sub-elements which increased the MWL of ROs on the bridge when autonomous navigation systems were installed in the case of (1) of Figure 6 (Table 10);
5.2.2. Manning Option
- Formation changes between the onboard bridge and RCC (MO-1 and MO-2) and the decrease in lookouts (MO-3) generally do not have apparent effects on MWL of the responsible operators (ROs), regardless of the level of autonomy when they are onboard a ship;
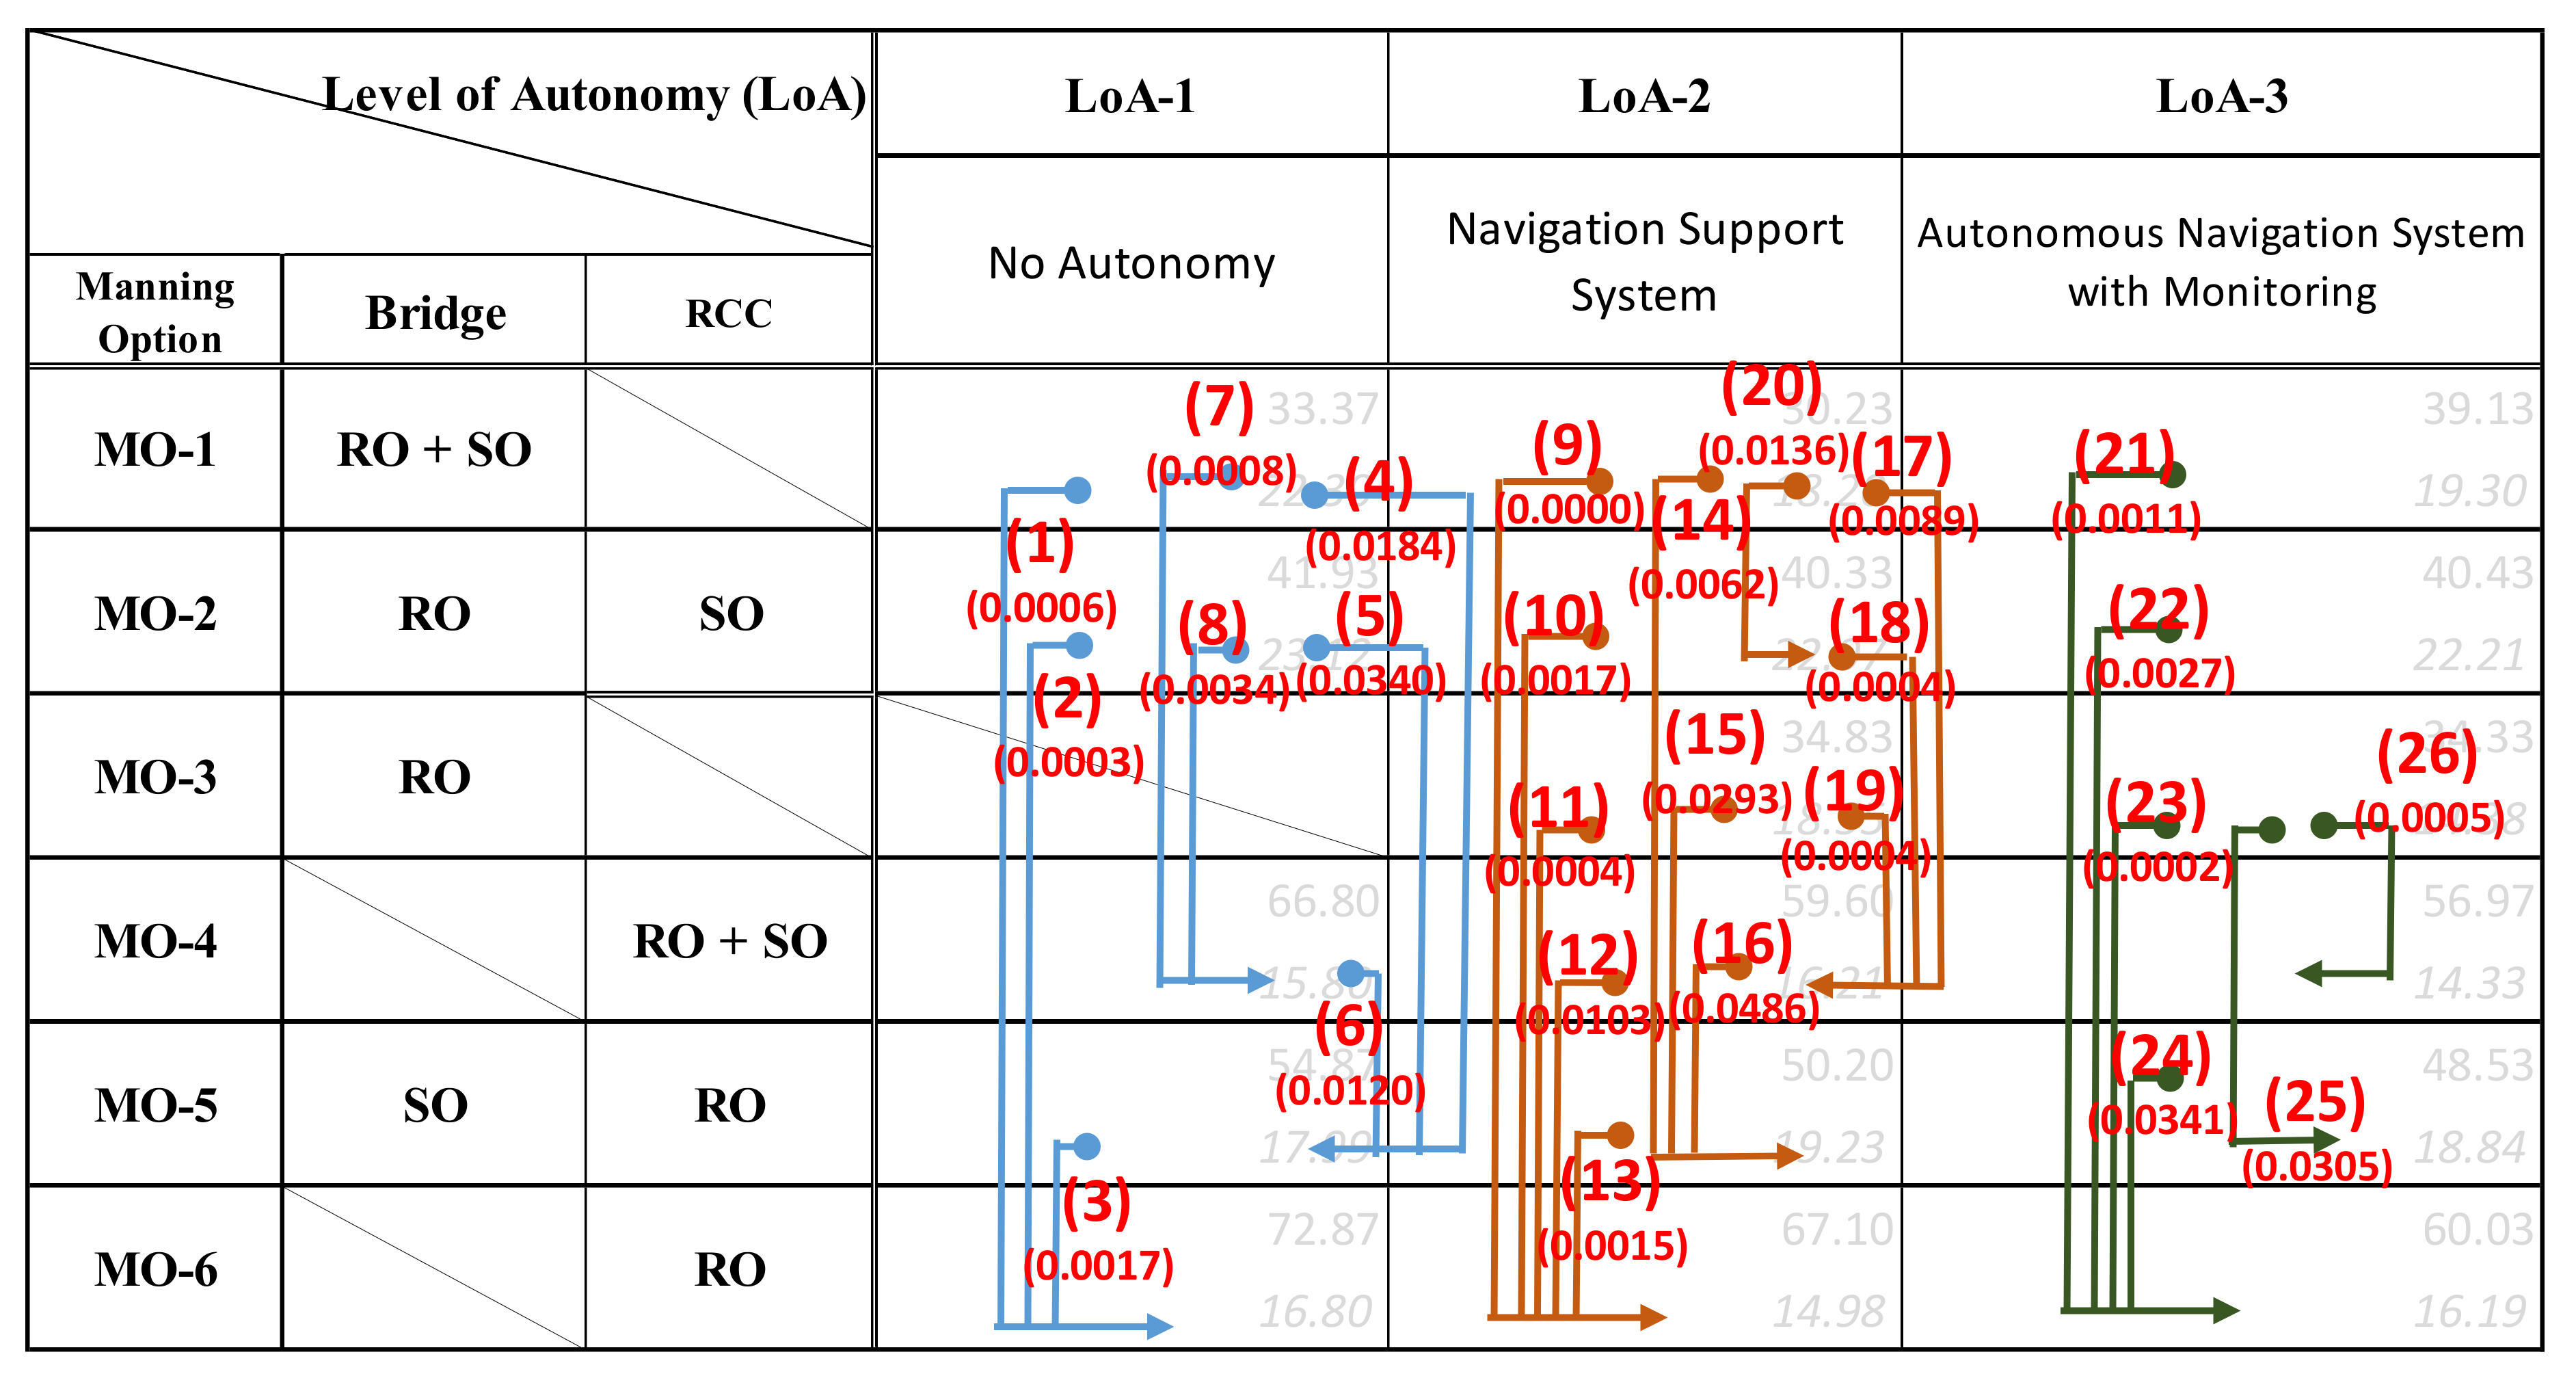
- MWL of the ROs significantly worsens when they are at RCC (MO-4, MO-5, and MO-6) compared to when they are on the bridge of a ship (MO-1, MO-2, and MO-3). The effects especially emerge when ROs operate alone at RCC (MO-6: (1), (2), (9)–(11), (21)–(23) in Figure 7 and Table 11). Negative effects on MWL are much smaller when an autonomous navigation system has been installed (LoA-3) compared to no autonomy (LoA-1) and navigation support (LoA-2). In other words, an autonomous navigation system works well to alleviate the mental stress of ROs at RCC (Figure 7);
- The set of mental demands and frustration are the overwhelming sub-elements that show the clear effects according to the change of navigation manning ((1), (2), (4), (7)–(11), (14), (15), (17)–(26) of Table 12);
- Time pressure, effort, and own performance emerged in two cases as significant sub-elements that increase MWL. Both cases are related to the situation where the lookout supports RO navigating at RCC ((6) and (13) in Table 12).
5.2.3. Navigational Condition
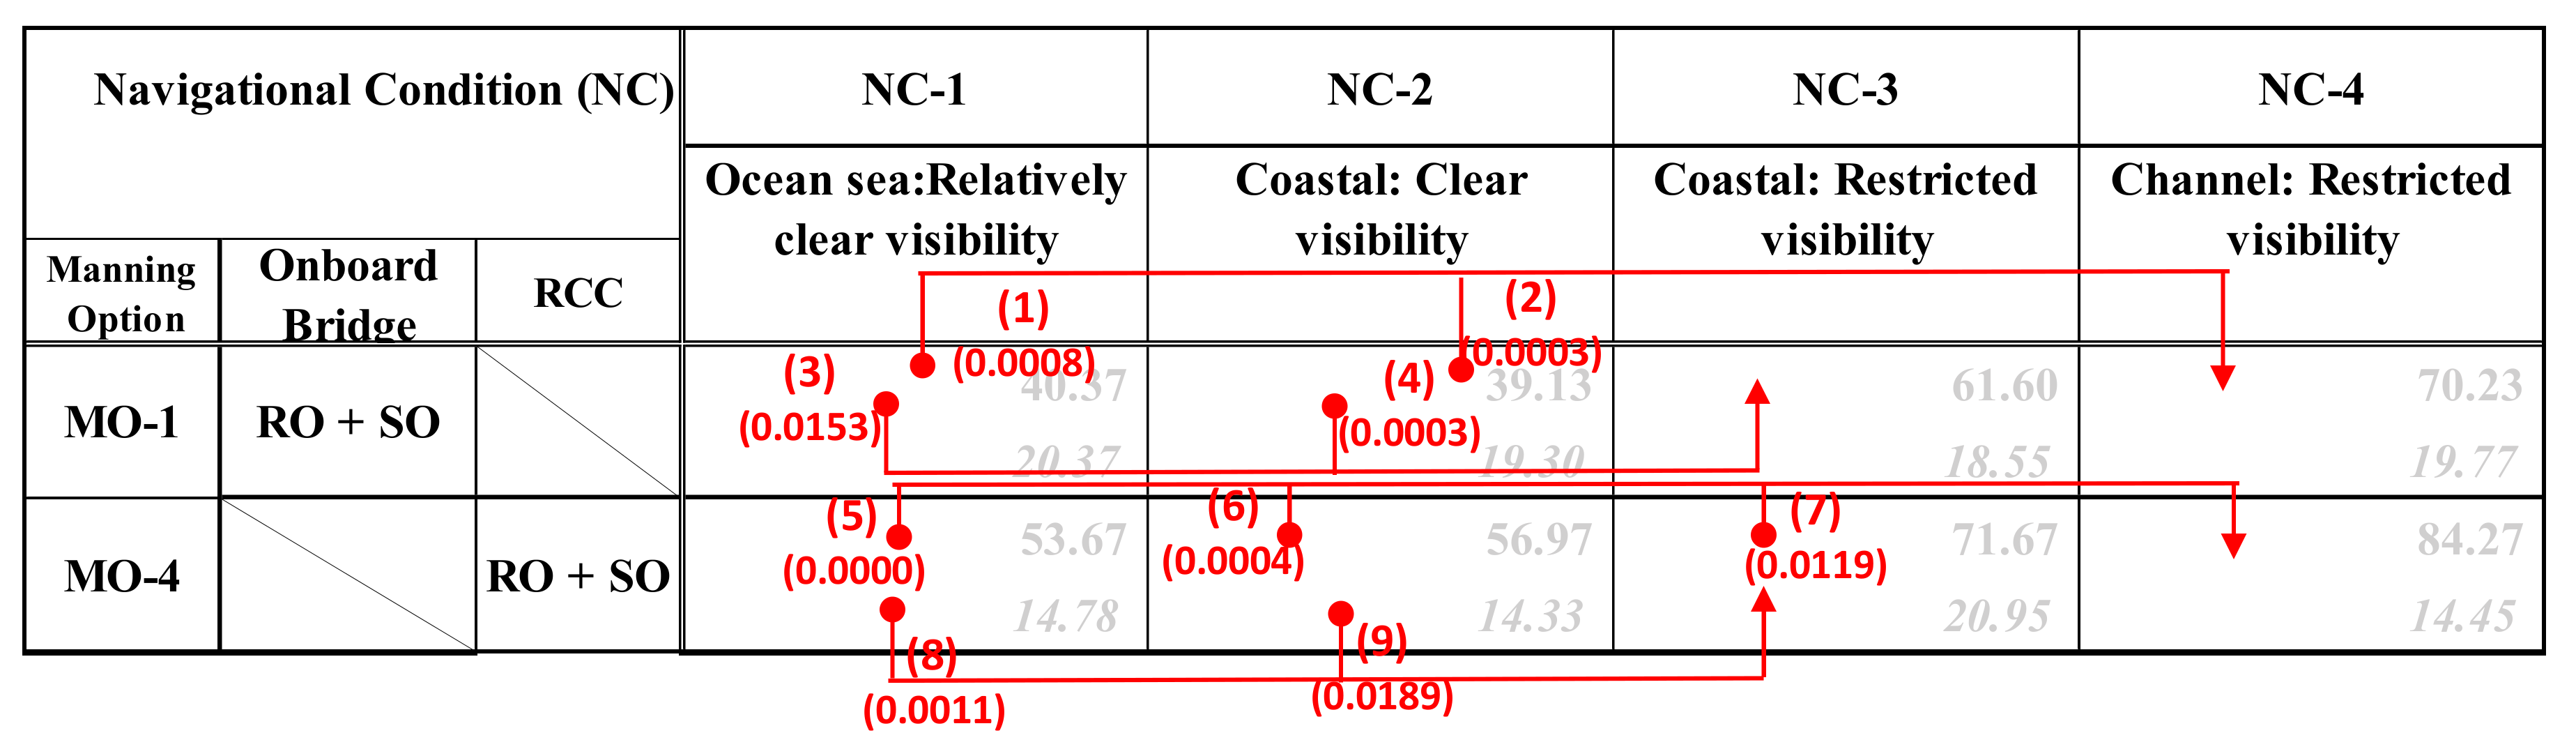
- MWL is quite high when traffic condition is severest in the channel in bad weather (NC-4). The responsible operators (ROs) especially feel the highest mental stress in all 25 scenarios of the study when they are at RCC (Table 13).
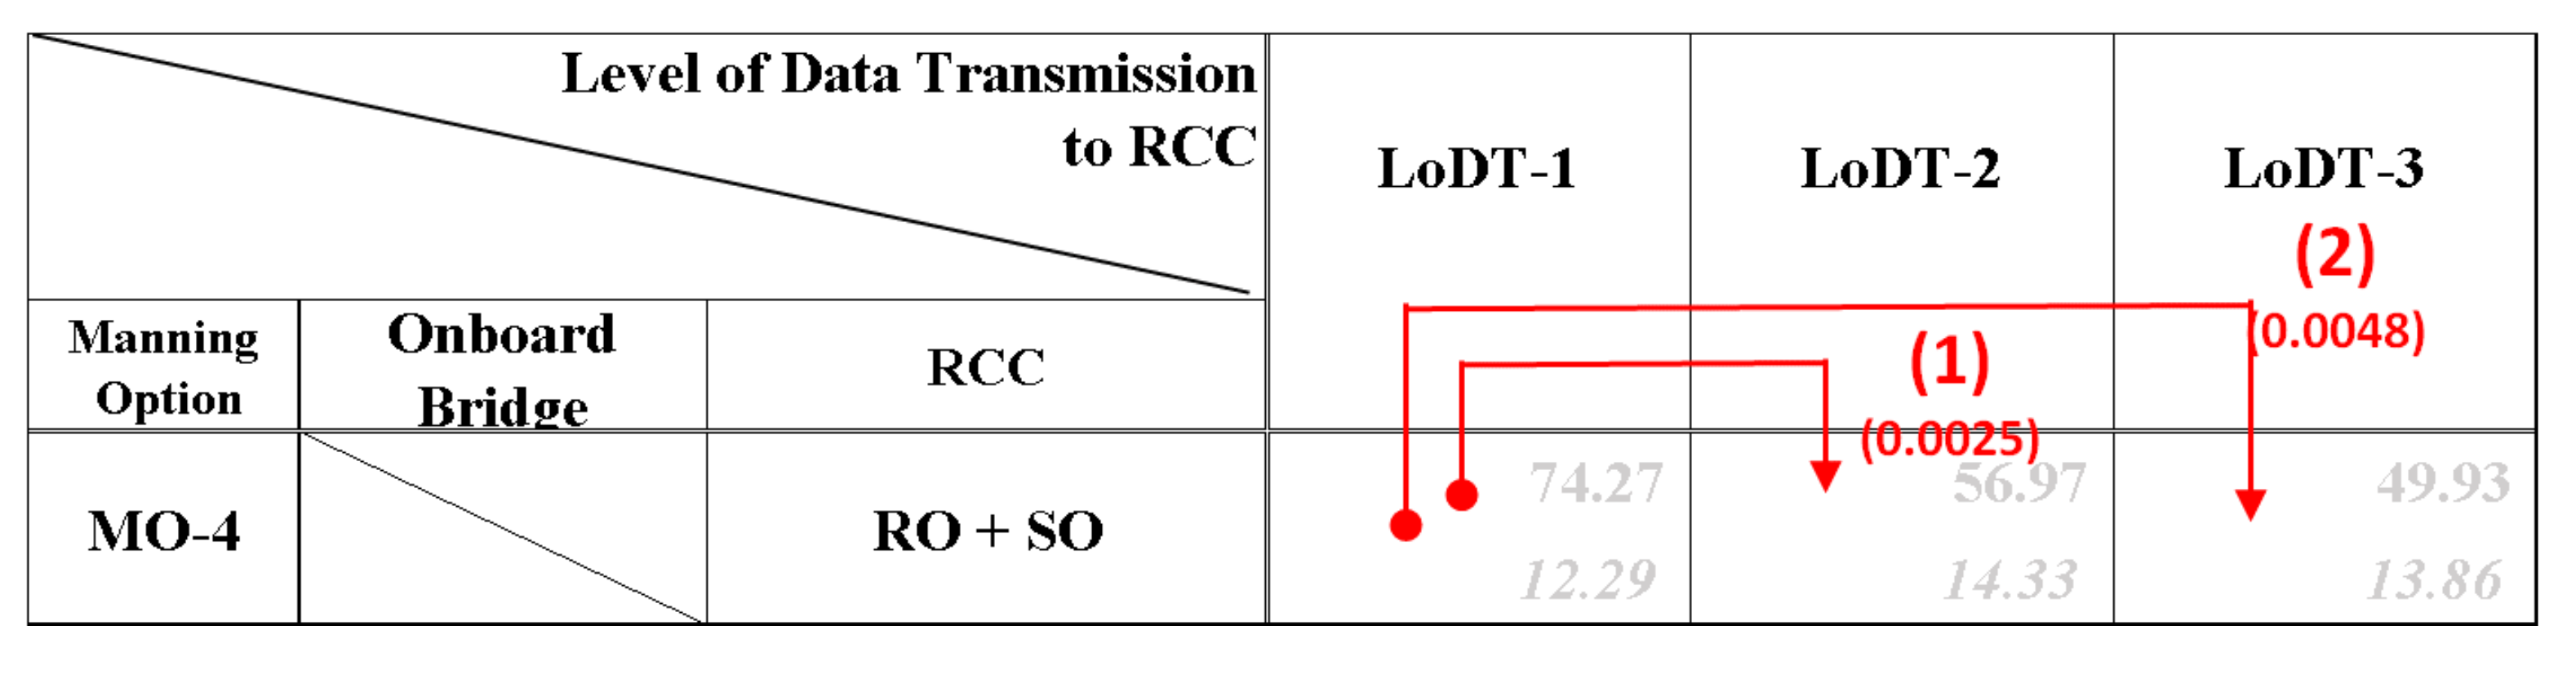
5.2.4. Level of Data Transmission to RCC (LoDT) (Visibility on the Screen)
- Time pressure and frustration were the main critical sub-elements in a significant change (Table 18).
5.3. Summary of the Results
6. Discussion
6.1. Imprecation of Results
6.1.1. Conflicted Situation
6.1.2. Physical Restriction
6.1.3. Human–Human and Human–Machine Communication
6.1.4. Reliability of the Autonomous System
6.1.5. Mechanical-Style Movement of the System
6.1.6. Visibility Constraint
6.2. Validity of the Identification Scheme and Limitation of the Case Study
7. Conclusions
Author Contributions
Funding
Informed Consent Statement
Data Availability Statement
Conflicts of Interest
References
- ICS Shipping Facts. Available online: https://www.ics-shipping.org/explaining/shipping-facts/ (accessed on 11 January 2021).
- IMO. Circular Letter No.4204/Add.6. 2020. Available online: https://wwwcdn.imo.org/localresources/en/MediaCentre/HotTopics/Documents/Circular%20Letter%20No.4204Add.6%20%20Coronavirus%20Covid-19%20Preliminary%20List%20Of%20Recommendations.pdf (accessed on 23 August 2020).
- Coraddu, A.; Oneto, L.; Navas de Maya, B.; Kurt, R. Determining the Most Influential Human Factors in Maritime Accidents: A Data-Driven Approach. Ocean Eng. 2020, 211, 107588. [Google Scholar] [CrossRef]
- Hogg, T.; Ghosh, S. Autonomous Merchant Vessels: Examination of Factors That Impact the Effective Implementation of Unmanned Ships. Aust. J. Marit. Ocean Aff. Abingdon 2016, 8, 206–222. [Google Scholar] [CrossRef]
- Arenius, M.; Athanassiou, G.; Sträter, O. Systemic Assessment of the Effect of Mental Stress and Strain on Performance in a Maritime Ship-Handling Simulator. IFAC Proc. Vol. 2010, 43, 43–46. [Google Scholar] [CrossRef]
- Wong, J.-T.; Huang, S.-H. Modeling Driver Mental Workload for Accident Causation and Prevention. Proc. East. Asia Soc. Transp. Stud. 2009, 2009, 365. [Google Scholar] [CrossRef]
- Johannsen, G. Workload and Workload Measurement. In Mental Workload: Its Theory and Measurement; Moray, N., Ed.; NATO Conference Series; Springer: Boston, MA, USA, 1979; pp. 3–11. ISBN 978-1-4757-0884-4. [Google Scholar]
- IMO. MSC.1/Circ.1598. 2019. Available online: https://www.imo.org/en/OurWork/HumanElement/Pages/Fatigue.aspx (accessed on 27 August 2020).
- Hetherington, C.; Flin, R.; Mearns, K. Safety in Shipping: The Human Element. J. Saf. Res. 2006, 37, 401–411. [Google Scholar] [CrossRef]
- NYK. NYK Conducts World’s First Maritime Autonomous Surface Ships Trial. Available online: https://www.nyk.com/english/news/2019/20190930_01.html (accessed on 15 July 2020).
- Rolls-Royce. Rolls-Royce and Finferries Demonstrate World’s First Fully Autonomous Ferry. Available online: https://www.rolls-royce.com/media/press-releases.aspx (accessed on 20 August 2020).
- Maritime Executive Construction of Yara Birkeland Paused. Available online: https://www.maritime-executive.com/article/construction-of-yara-birkeland-paused (accessed on 20 August 2020).
- Wahlström, M.; Hakulinen, J.; Karvonen, H.; Lindborg, I. Human Factors Challenges in Unmanned Ship Operations–Insights from Other Domains. Procedia Manuf. 2015, 3, 1038–1045. [Google Scholar] [CrossRef] [Green Version]
- Endsley, M.R. From Here to Autonomy: Lessons Learned From Human–Automation Research. Hum. Factors 2017, 59, 5–27. [Google Scholar] [CrossRef]
- Wróbel, K.; Gil, M.; Chae, C.-J. On the Influence of Human Factors on Safety of Remotely-Controlled Merchant Vessels. Appl. Sci. 2021, 11, 1145. [Google Scholar] [CrossRef]
- IMO. MSC.1/Circ.1604. 2019. Available online: https://wwwcdn.imo.org/localresources/en/MediaCentre/HotTopics/Documents/MSC.1-Circ.1604%20-%20Interim%20Guidelines%20For%20Mass%20Trials%20(Secretariat).pdf (accessed on 28 August 2020).
- IMO. Autonomous Shipping. Available online: http://www.imo.org/en/MediaCentre/HotTopics/Pages/Autonomous-shipping.aspx (accessed on 24 July 2020).
- Maritime UK. Maritime Autonomous Ship Systems (MASS) UK Industry Conduct Principles and Code of Practice: A Voluntary Code; Version 4; Maritime UK: London, UK, 2020. [Google Scholar]
- DNVGL. Autonomous and Remotely Operated Ships; DNVGL: Oslo, Norway, 2018. [Google Scholar]
- Wulvik, A.S.; Dybvik, H.; Steinert, M. Investigating the Relationship between Mental State (Workload and Affect) and Physiology in a Control Room Setting (Ship Bridge Simulator). Cogn. Technol. Work 2020, 22, 95–108. [Google Scholar] [CrossRef] [Green Version]
- Ramos, M.; Utne, I.; Mosleh, A. On Factors Affecting Autonomous Ships Operators Performance in a Shore Control Center; PSAM: Los Angeles, CA, USA, 2018. [Google Scholar]
- Porathe, T.; Fjortoft, K.; Bratbergsengen, I.L. Human Factors, Autonomous Ships and Constrained Coastal Navigation. IOP Conf. Ser. Mater. Sci. Eng. 2020, 929, 012007. [Google Scholar] [CrossRef]
- Hart, S.G.; Staveland, L.E. Development of NASA-TLX (Task Load Index): Results of Empirical and Theoretical Research. In Advances in Psychology; Hancock, P.A., Meshkati, N., Eds.; Human Mental Workload: Amsterdam, The Netherlands, 1988; Volume 52, pp. 139–183. [Google Scholar]
- Pickup, L.; Wilson, J.R.; Sharpies, S.; Norris, B.; Clarke, T.; Young, M.S. Fundamental Examination of Mental Workload in the Rail Industry. Theor. Issues Ergon. Sci. 2005, 6, 463–482. [Google Scholar] [CrossRef]
- Makishita, H.; Matsunaga, K. Differences of Drivers’ Reaction Times According to Age and Mental Workload. Accid. Anal. Prev. 2008, 40, 567–575. [Google Scholar] [CrossRef]
- Jex, H.R. Measuring Mental Workload: Problems, Progress, and Promises. In Advances in Psychology; Elsevier Science & Technology: Amsterdam, The Netherlands, 1988; Volume 52, pp. 5–39. ISBN 978-0-444-70388-0. [Google Scholar]
- Zhou, X.-Y.; Huang, J.-J.; Wang, F.-W.; Wu, Z.-L.; Liu, Z.-J. A Study of the Application Barriers to the Use of Autonomous Ships Posed by the Good Seamanship Requirement of COLREGs. J. Navig. 2020, 73, 710–725. [Google Scholar] [CrossRef]
- Ringbom, H. Regulating Autonomous Ships—Concepts, Challenges and Precedents. Ocean Dev. Int. Law 2019, 50, 141–169. [Google Scholar] [CrossRef]
- NFAS. Definitions for Autonomous Merchant Ships; NFAS: Trondheim, Norway, 2017. [Google Scholar]
- IMO. A772.(18). 1993. Available online: https://wwwcdn.imo.org/localresources/en/KnowledgeCentre/IndexofIMOResolutions/AssemblyDocuments/A.772(18).pdf (accessed on 30 August 2020).
- ICS. Bridge Procedure Guide, 5th ed.; Marisec: London, UK, 2016. [Google Scholar]
- Habberley, J.; Taylor, D. A Behavioural Study of the Collision Avoidance Task in Bridge Watchkeeping. In Proceedings of the 4th International Conference on Marine Simulation (MARSIM), Trondheim, Norway, 22–24 June 1987; pp. 293–301. [Google Scholar]
- Liu, Y.; Subramaniam, S.C.H.; Sourina, O.; Liew, S.H.P.; Krishnan, G.; Konovessis, D.; Ang, H.E. EEG-Based Mental Workload and Stress Recognition of Crew Members in Maritime Virtual Simulator: A Case Study. In Proceedings of the 2017 International Conference on Cyberworlds (CW), Chester, UK, 20–22 September 2017; pp. 64–71. [Google Scholar]
- Svensson, E.; Angelborg-Thanderez, M.; Sjöberg, L.; Olsson, S. Information Complexity-Mental Workload and Performance in Combat Aircraft. Ergonomics 1997, 40, 362–380. [Google Scholar] [CrossRef]
- Sharma, A.; Nazir, S.; Ernstsen, J. Situation Awareness Information Requirements for Maritime Navigation: A Goal Directed Task Analysis. Saf. Sci. 2019, 120, 745–752. [Google Scholar] [CrossRef]
- FleetBroadband. Inmarsat. 2020. Available online: https://www.inmarsat.com/en/solutions-services/fleetbroadband.html (accessed on 5 September 2020).
- Huang, J.; Cao, J. Recent Development of Commercial Satellite Communications Systems. In Proceedings of the Artificial Intelligence in China; Liang, Q., Wang, W., Mu, J., Liu, X., Na, Z., Chen, B., Eds.; Springer: Singapore, 2020; pp. 531–536. [Google Scholar]
- Ren, X.; Zheng, Y.; Liu, Y.; Shen, J. 6G: Network Visions and Requirements for next Generation Optical Networks. In Proceedings of the 2019 International Conference on Optical Instruments and Technology: Optical Communication and Optical Signal Processing, Beijing, China, 12 March 2020; International Society for Optics and Photonics: Bellingham, WA, USA, 2020; Volume 11435, p. 114350H. [Google Scholar]
- Rødseth, Ø.J.; Kvamstad, B.; Porathe, T.; Burmeister, H.-C. Communication Architecture for an Unmanned Merchant Ship. In Proceedings of the 2013 MTS/IEEE OCEANS-Bergen, Bergen, Norway, 10–14 June 2013; pp. 1–9. [Google Scholar]
- Hart, S.G. Nasa-Task Load Index (NASA-TLX); 20 Years Later. Proc. Hum. Factors Ergon. Soc. Annu. Meet. 2006, 50, 904–908. [Google Scholar] [CrossRef] [Green Version]
- Prison, J.; Dahlman, J.; Lundh, M. Ship Sense—Striving for Harmony in Ship Manoeuvring. WMU J. Marit. Aff. 2013, 12, 115–127. [Google Scholar] [CrossRef]
- Hanton, S.; Connaughton, D. Perceived Control of Anxiety and Its Relationship to Self-Confidence and Performance. Res. Q. Exerc. Sport 2002, 73, 87–97. [Google Scholar] [CrossRef]
- Guzman, A.L.; Lewis, S.C. Artificial Intelligence and Communication: A Human–Machine Communication Research Agenda. New Media Soc. 2020, 22, 70–86. [Google Scholar] [CrossRef]
- Li, X.; Hess, T.J.; Valacich, J.S. Why Do We Trust New Technology? A Study of Initial Trust Formation with Organizational Information Systems. J. Strateg. Inf. Syst. 2008, 17, 39–71. [Google Scholar] [CrossRef]
- Pantic, M.; Pentland, A.; Nijholt, A.; Huang, T.S. Human Computing and Machine Understanding of Human Behavior: A Survey. In Artifical Intelligence for Human Computing; Huang, T.S., Nijholt, A., Pantic, M., Pentland, A., Eds.; Springer: Berlin/Heidelberg, Germany, 2007; pp. 47–71. [Google Scholar]
- Porathe, T.; Prison, J.; Man, Y. Situation Awareness in Remote Control Centres for Unmanned Ships. In Proceedings of the Human Factors in Ship Design & Operation, London, UK, 26–27 February 2014. [Google Scholar]
- Huang, Y.; Chen, L.; Chen, P.; Negenborn, R.R.; van Gelder, P.H.A.J.M. Ship Collision Avoidance Methods: State-of-the-Art. Saf. Sci. 2020, 121, 451–473. [Google Scholar] [CrossRef]


| Factor | Option/Level |
|---|---|
| Ship size | Approximately 3000 gross tonnages (GT) |
| Ship type | General type of ship (ocean-going ship) |
| Goal of operators | Navigate safely to the next port without a long delay |
| Weather | Clear, Rain, Heavy rain, and Fog (Section 3.2.1) |
| Navigation area | Open sea, Coastal water, and Channel (Section 3.2.1) |
| Traffic density | One vessel every four hours, Two vessels every one hour, and Five vessels every one hour. These vessels approached own ship at the same time (Section 3.2.1) |
| Visibility | Visibility of 1 mile, 3 miles and 7 miles ahead from own ship (Section 3.2.1) |
| Experience of operators | Deck officer |
| <Additional factors for MASS> | |
| Level of Autonomy (LoA) | No autonomy, Navigation support system, Autonomous navigation system with monitoring and Autonomous navigation system without monitoring (Section 3.3.1) |
| Level of Remote Control (LoRC) | No remote control, Support of navigation, and Navigation (Section 3.3.1) |
| Manning Option (MO) | Combination of responsible officer and support officer between the bridge of a ship and remote-control centre (RCC) (Section 3.3.2) |
| Level of Data Transmission to RCC (LoDT) (visibility on screen and sound at RCC) | Static image (one picture/10 sec), rough video and clear video (Section 3.3.3) |
| Level of Data Transmission to RCC (LoDT) (data of navigation equipment (e.g., ARPA/Radar and ECDIS)) | Same between the bridge and RCC (i.e., operators can acquire the same data without delay and trouble) |
| Experience of MASS navigation (EoM) | No experience |
| Option | Navigation Area | Expected Area | Frequency of Approaching Ship(s) | Non-AIS-Equipped Ships | Visibility (Weather) | Average Wave Height |
|---|---|---|---|---|---|---|
| NC-1 | Open Sea | Pacific Ocean | A vessel every 4 h | No | Visibility of 3 miles ahead (Rain) | 3 m |
| NC-2 | Coastal water | Coast of Boso Peninsula | Two vessels every one hour at the same time | Small fishing vessels Leisure crafts | Visibility of 7 miles ahead (Clear) | 1 m |
| NC-3 | Visibility of 1 mile ahead (Heavy rain) | 3 m | ||||
| NC-4 | Channel | Uraga Channel | Five vessels every one hour at the same time | Visibility of 1 mile ahead (Fog) | 1 m |
| LoA | Detail | LoRC | Detail |
|---|---|---|---|
| LoA-1 | No Autonomy | LoRC-1 | No remote control |
| LoA-2 | Navigation Support System (NSS) | LoRC-2 | Support of Navigation |
| The system can identify non-AIS ships (e.g., small boats) and objects (e.g., driftwood), make a warning, and advise appropriate collision avoidance routes. | |||
| LoA-3 | Autonomous Navigation System (ANS) with monitoring | LoRC-3 | Navigation |
| The system can make autonomous collision avoidance in addition to LoA-2, and is monitored by responsible officers (ROs) defined in Section 3.3.2. | |||
| LoA-4 | Autonomous Navigation System (ANS) without monitoring | ||
| This system is totally autonomous without any human monitoring (not applicable in the case study). |
| Option | MO-1 | MO-2 | MO-3 | MO-4 | MO-5 | MO-6 |
|---|---|---|---|---|---|---|
| LoRC-1 | LoRC-2 | LoRC-1 | LoRC-3 | LoRC-3 | LoRC-3 | |
| Bridge of a ship | RO + SO | RO | RO | - | SO | - |
| Remote control centre (RCC) | - | SO | - | RO + SO | RO | RO |
| Visibility | LoDT-1: Static image with one picture/10 s - Identify vessel of a length of 45 m in 1 mile under the clear weather condition in the daytime. LoDT-2: (rough) Video - Identify vessel of a length of 45 m in 1 mile under the clear weather condition in the daytime. LoDT-3: (clear) Video - Identify vessel of a length of 45 m in 6 miles under the clear weather condition in the daytime. - Recognise the mast of a vessel in 10 miles. |
| Time delay | <0.1 s |
| Failure of data transmission | Redundancy by another internet connection |
| Recover in 1 min | |
| Sound | Clear and no delay |
| Level | Rank | Number of Interviewees |
|---|---|---|
| Management level | Captain (Master) | 2 |
| Chief officer (Chief mate) | 3 | |
| Operational level | 2nd officer | 2 |
| 3rd officer | 3 |
| Variable Factors in Section 3.2 | Number of Scenarios | Note (Assumption) |
|---|---|---|
| 1. Level of Autonomy (LoA) | 17 scenarios Three LoAs in Table 3 and six MOs in Table 4 are combined. One scenario (LoA-1 (no autonomy) and MO-3 (only RO onboard ship without support)) is excluded from the study because this scenario just makes current manning more severe without technological development and would be unlikely to happen. | NC-2 (coastal water in clear visibility) and LoDT-2 (rough movie on the screen of RCC) are applied as an assumption. |
| 2. Manning Option (MO) | ||
| 3. Navigational Condition (NC) | 8 scenarios (*) Four NC options in Table 2 and two MOs (MO-1 and MO-4)) in Table 4 are combined. (*) Two scenarios are duplicated with the scenarios used in LoA and MO. | LoA-3 (autonomous navigation system) and LoDT-2 (rough movie on the screen of RCC) are applied as an assumption. |
| 4. Level of Data Transmission to RCC (LoDT) (visibility of screen and sound at RCC) | 3 scenarios (*) Three LoDTs in Table 5 are used. (*) One scenario is duplicated with the scenario used in LoA and MO. | LoA-3 (autonomous navigation system), MO-4 (every navigational staff at RCC) and NC-2 (coastal water in clear visibility) are applied as an assumption. |
| Total | 28 scenarios (25 scenarios without duplication) |
| Manning Option and Level of Remote Control | Level of Autonomy | |||||
|---|---|---|---|---|---|---|
| Manning Option | Level of Remote Control | Bridge | RCC | LoA-1 | LoA-2 | LoA-3 |
| No Autonomy | Navigation Support System | Autonomous Navigation System with Monitoring | ||||
| MO-1 | LoRC-1 | RO + SO | - | 33.37(22.30) | 30.23 (18.20) | 39.13 (19.30) |
| MO-2 | LoRC-2 | RO | SO | 41.93(23.12) | 40.33 (22.97) | 40.43 (22.21) |
| MO-3 | LoRC-1 | RO | - | 34.83 (18.55) | 34.33 (14.38) | |
| MO-4 | LoRC-3 | - | RO + SO | 66.80(15.80) | 59.60 (16.21) | 56.97 (14.33) |
| MO-5 | LoRC-3 | SO | RO | 54.87(17.99) | 50.20 (19.23) | 48.53 (18.84) |
| MO-6 | LoRC-3 | - | RO | 72.87(16.80) | 67.10 (14.98) | 60.03 (16.19) |
| In Manning Option | MWL of RO in LoA-Endpoint of Arrow Line in Figure 6 | Increase or Decrease | Comparison to MWL of RO in LoA-Start Point of Arrow Lines in Figure 6 (Parentheses Are Numbers in Figure 6) [Square Brackets Are Difference of MLW] |
|---|---|---|---|
| MO-1 | LoA-3 | increase | (1) LoA-2 [+8.9] |
| MO-4 | LoA-2 | decrease | (2) LoA-1 [−7.20] |
| LoA-3 | decrease | (3) LoA-1 [−9.83] | |
| MO-5 | LoA-2 | decrease | (4) LoA-1 [−4.67] |
| LoA-3 | decrease | (5) LoA-1 [−6.34] | |
| MO-6 | LoA-3 | decrease | (6) LoA-1 [−12.84], (7) LoA-2 [−7.07] |
| No | p < 0.05 | No | p < 0.05 | No | p < 0.05 | No | p < 0.05 | No | p < 0.05 | No | p < 0.05 | No | p < 0.05 |
|---|---|---|---|---|---|---|---|---|---|---|---|---|---|
| (1) | MD | (2) | - | (3) | MD/TD | (4) | EF | (5) | MD | (6) | MD/FR | (7) | EF |
| In LoA | MWL of RO in MO-Endpoint of Arrow Line in Figure 7 | Increase or Decrease | Comparison to MWL of RO in MO-Start Point of Arrow Lines in Figure 7 (Parentheses Are Numbers in Figure 7) [Square Brackets are Difference of MLW] |
|---|---|---|---|
| LoA-1 | MO-6 | increase | (1) MO-1 [+39.5], (2) MO-2 [+30.94], (3) MO-5 [+18.00] |
| MO-5 | increase | (4) MO-1 [+21.5], (5) MO-2 [+12.94] | |
| decrease | (7) MO-4 [−11.93] | ||
| MO-4 | increase | (7) MO-1 [+33.43], (8) MO-2 [+24.87] | |
| LoA-2 | MO-6 | increase | (9) MO-1 [+36.87], (10) MO-2 [+26.77], (11) MO-3 [+32.27], (12) MO-4 [+7.5], (13) MO-5 [+16.90] |
| MO-5 | increase | (14) MO-1 [+19.97], (15) MO-3 [+15.37] | |
| decrease | (16) MO-4 [−9.40] | ||
| MO-4 | increase | (17) MO-1 [+29.37], (18) MO-2 [+19.27], (19) MO-3 [+24.77] | |
| MO-2 | increase | (20) MO-1 [+10.1] | |
| LoA-3 | MO-6 | increase | (21) MO-1 [+20.90], (22) MO-2 [+19.60], (23) MO-3 [+25.70], (24) MO-5 [+11.50] |
| MO-5 | increase | (25) MO-3 [+14.20] | |
| MO-4 | increase | (26) MO-3 [+22.64] |
| No. | p < 0.05 | No. | p < 0.05 | No. | p < 0.05 | No. | p < 0.05 |
|---|---|---|---|---|---|---|---|
| (1) | MD/FR | (2) | MD/FR | (3) | MD | (4) | MD/FR |
| (5) | FR | (6) | MD/TD | (7) | MD/FR | (8) | MD/FR |
| (9) | MD/FR | (10) | MD/FR | (11) | MD/FR | (12) | - |
| (13) | OP/EF/FR | (14) | MD/FR | (15) | MD/FR | (16) | - |
| (17) | MD/FR | (18) | MD/FR | (19) | MD/FR | (20) | MD/FR |
| (21) | MD/FR | (22) | MD/FR | (23) | MD/FR | (24) | MD/FR |
| (25) | MD/FR | (26) | MD/FR |
| Manning Option and Level of Remote Control | Navigational Condition | ||||||
|---|---|---|---|---|---|---|---|
| Manning Option | Level of Remote Control | Bridge | RCC | NC-1 | NC-2 | NC-3 | NC-4 |
| Ocean: relatively clear visibility | Coastal: clear visibility | Coastal: restricted visibility | Channel: restricted visibility | ||||
| MO-1 | LoRC-1 | RO + SO | - | 40.37 (20.37) | 39.13 (19.30) | 61.60 (18.55) | 70.23 (19.77) |
| MO-4 | LoRC-3 | - | RO + SO | 53.67 (14.87) | 56.97 (14.38) | 71.67 (20.95) | 84.27 (14.45) |
| In Manning Option | MWL of RO in NC-Endpoint of Arrow Line in Figure 8 | Increase or Decrease | Comparison to MWL of RO in NC-Start Point of Arrow Lines in Figure 8 (Parentheses Are Numbers in Figure 8) [Square Brackets Are Difference of MLW] |
|---|---|---|---|
| MO-1 | NC-4 | increase | (1) NC-1 [+29.86], (2) NC-2 [+31.1] |
| NC-3 | increase | (3) NC-1 [+21.23], (4) NC-2 [+22.47] | |
| MO-4 | NC-4 | increase | (5) NC-1 [+30.6], (6) NC-2 [+27.30], (7) NC-3 [+12.6] |
| NC-3 | increase | (8) NC-1[+18.00], (9) NC-2 [+14.70] |
| No. | p < 0.05 | No. | p < 0.05 | No. | p < 0.05 | No. | p < 0.05 |
|---|---|---|---|---|---|---|---|
| (1) | MD/FR | (2) | MD/FR | (3) | MD/FR | (4) | MD/FR |
| (5) | MD/TD/FR | (6) | MD/TD | (7) | TD | (8) | MD/FR |
| (9) | - |
| Manning Option and Level of Remote Control | Level of Data Transmission to RCC | |||||
|---|---|---|---|---|---|---|
| Manning Option | Level of Remote Control | Bridge | RCC | LoDT-1 | LoDT-2 | LoA-3 LoDT-3 |
| Static image: 1 picture/10 s | Rough video | Clear video | ||||
| MO-4 | LoRC-3 | - | RO + SO | 74.27 (12.29) | 56.97 (14.33) | 49.93 (13.86) |
| In Manning Option | MWL of RO in LoDT-Endpoint of Arrow Line in Figure 9 | Increase or Decrease | Comparison to MWL of RO in LoDT-Start Point of Arrow Lines in Figure 9 (Parentheses Are Numbers in Figure 9) [Square Brackets Are Difference of MLW] |
|---|---|---|---|
| MO-4 | LoDT-2 | decrease | (1) LoDT-1 [−17.30] |
| LoDT-3 | decrease | (2) LoDT-1 [−24.34] |
| No. | p < 0.05 | No. | p < 0.05 |
|---|---|---|---|
| (1) | TD/FR | (2) | MD/TD/EF/FR |
| Factor | Key Sub-Elements of MWL That Mainly Cause MWL Change | Note (Effects on MWL) | Main Linkage with Findings in Section 6.1 (Section Number) |
|---|---|---|---|
| Level of Autonomy (LoA) | MD | RO is on the bridge - No significant effect (negative effects in one case) RO is at RCC - Positive effects by installing autonomous systems - No significant effect between NSS and ANS (except when RO is alone) | - Reliability of the autonomous system (Section 6.1.4) - Mechanical-style movement of the system (Section 6.1.5) |
| EF | |||
| Manning Option (MO) | MD | RO is on the bridge - No significant effect by manning change RO is at RCC - Significant negative effects compared when RO is on the bridge - Decrease in MWL when lookout is on the bridge | - Reliability of the autonomous system (Section 6.1.4) - Conflicted situation (Section 6.1.1) - Physical restriction (Section 6.1.2) - Human–human and human–machine interface (Section 6.1.3) |
| FR | |||
| Navigational Condition (NC) (area, traffic density, weather, visibility) | TD | - Negative effects under high traffic density - Significant negative effects in restricted visibility in bad weather | - Conflicted situation (Section 6.1.1) - Visibility constraint (Section 6.1.6) |
| MD | |||
| FR | |||
| Level of Data Transmission to RCC (LoDT) (visibility on the screen) | TD | - Significant negative effects by using a static image - No significant effect between rough and clear movie | - Visibility constraint (Section 6.1.6) |
| FR |
Publisher’s Note: MDPI stays neutral with regard to jurisdictional claims in published maps and institutional affiliations. |
© 2021 by the authors. Licensee MDPI, Basel, Switzerland. This article is an open access article distributed under the terms and conditions of the Creative Commons Attribution (CC BY) license (http://creativecommons.org/licenses/by/4.0/).
Share and Cite
Yoshida, M.; Shimizu, E.; Sugomori, M.; Umeda, A. Identification of the Relationship between Maritime Autonomous Surface Ships and the Operator’s Mental Workload. Appl. Sci. 2021, 11, 2331. https://doi.org/10.3390/app11052331
Yoshida M, Shimizu E, Sugomori M, Umeda A. Identification of the Relationship between Maritime Autonomous Surface Ships and the Operator’s Mental Workload. Applied Sciences. 2021; 11(5):2331. https://doi.org/10.3390/app11052331
Chicago/Turabian StyleYoshida, Masanori, Etsuro Shimizu, Masashi Sugomori, and Ayako Umeda. 2021. "Identification of the Relationship between Maritime Autonomous Surface Ships and the Operator’s Mental Workload" Applied Sciences 11, no. 5: 2331. https://doi.org/10.3390/app11052331