
Fractal Dimension and Retinal Pathology: A Meta-Analysis


Abstract
:1. Introduction
1.1. Retinal Vasculature and Fractal Dimension
1.2. Common Methods for Measuring Retinal Fractal Dimension
1.3. Objective
1.4. Research Question
2. Methods
2.1. Search Strategy
2.2. Inclusion/Exclusion Criteria
- Digital fundus photography
- Fundus fluorescein angiography
- Optical coherence tomography angiography (OCTA)
- Scanning laser ophthalmoscopy (SLO)
2.3. Screening Process
2.4. Meta-Analysis
3. Results
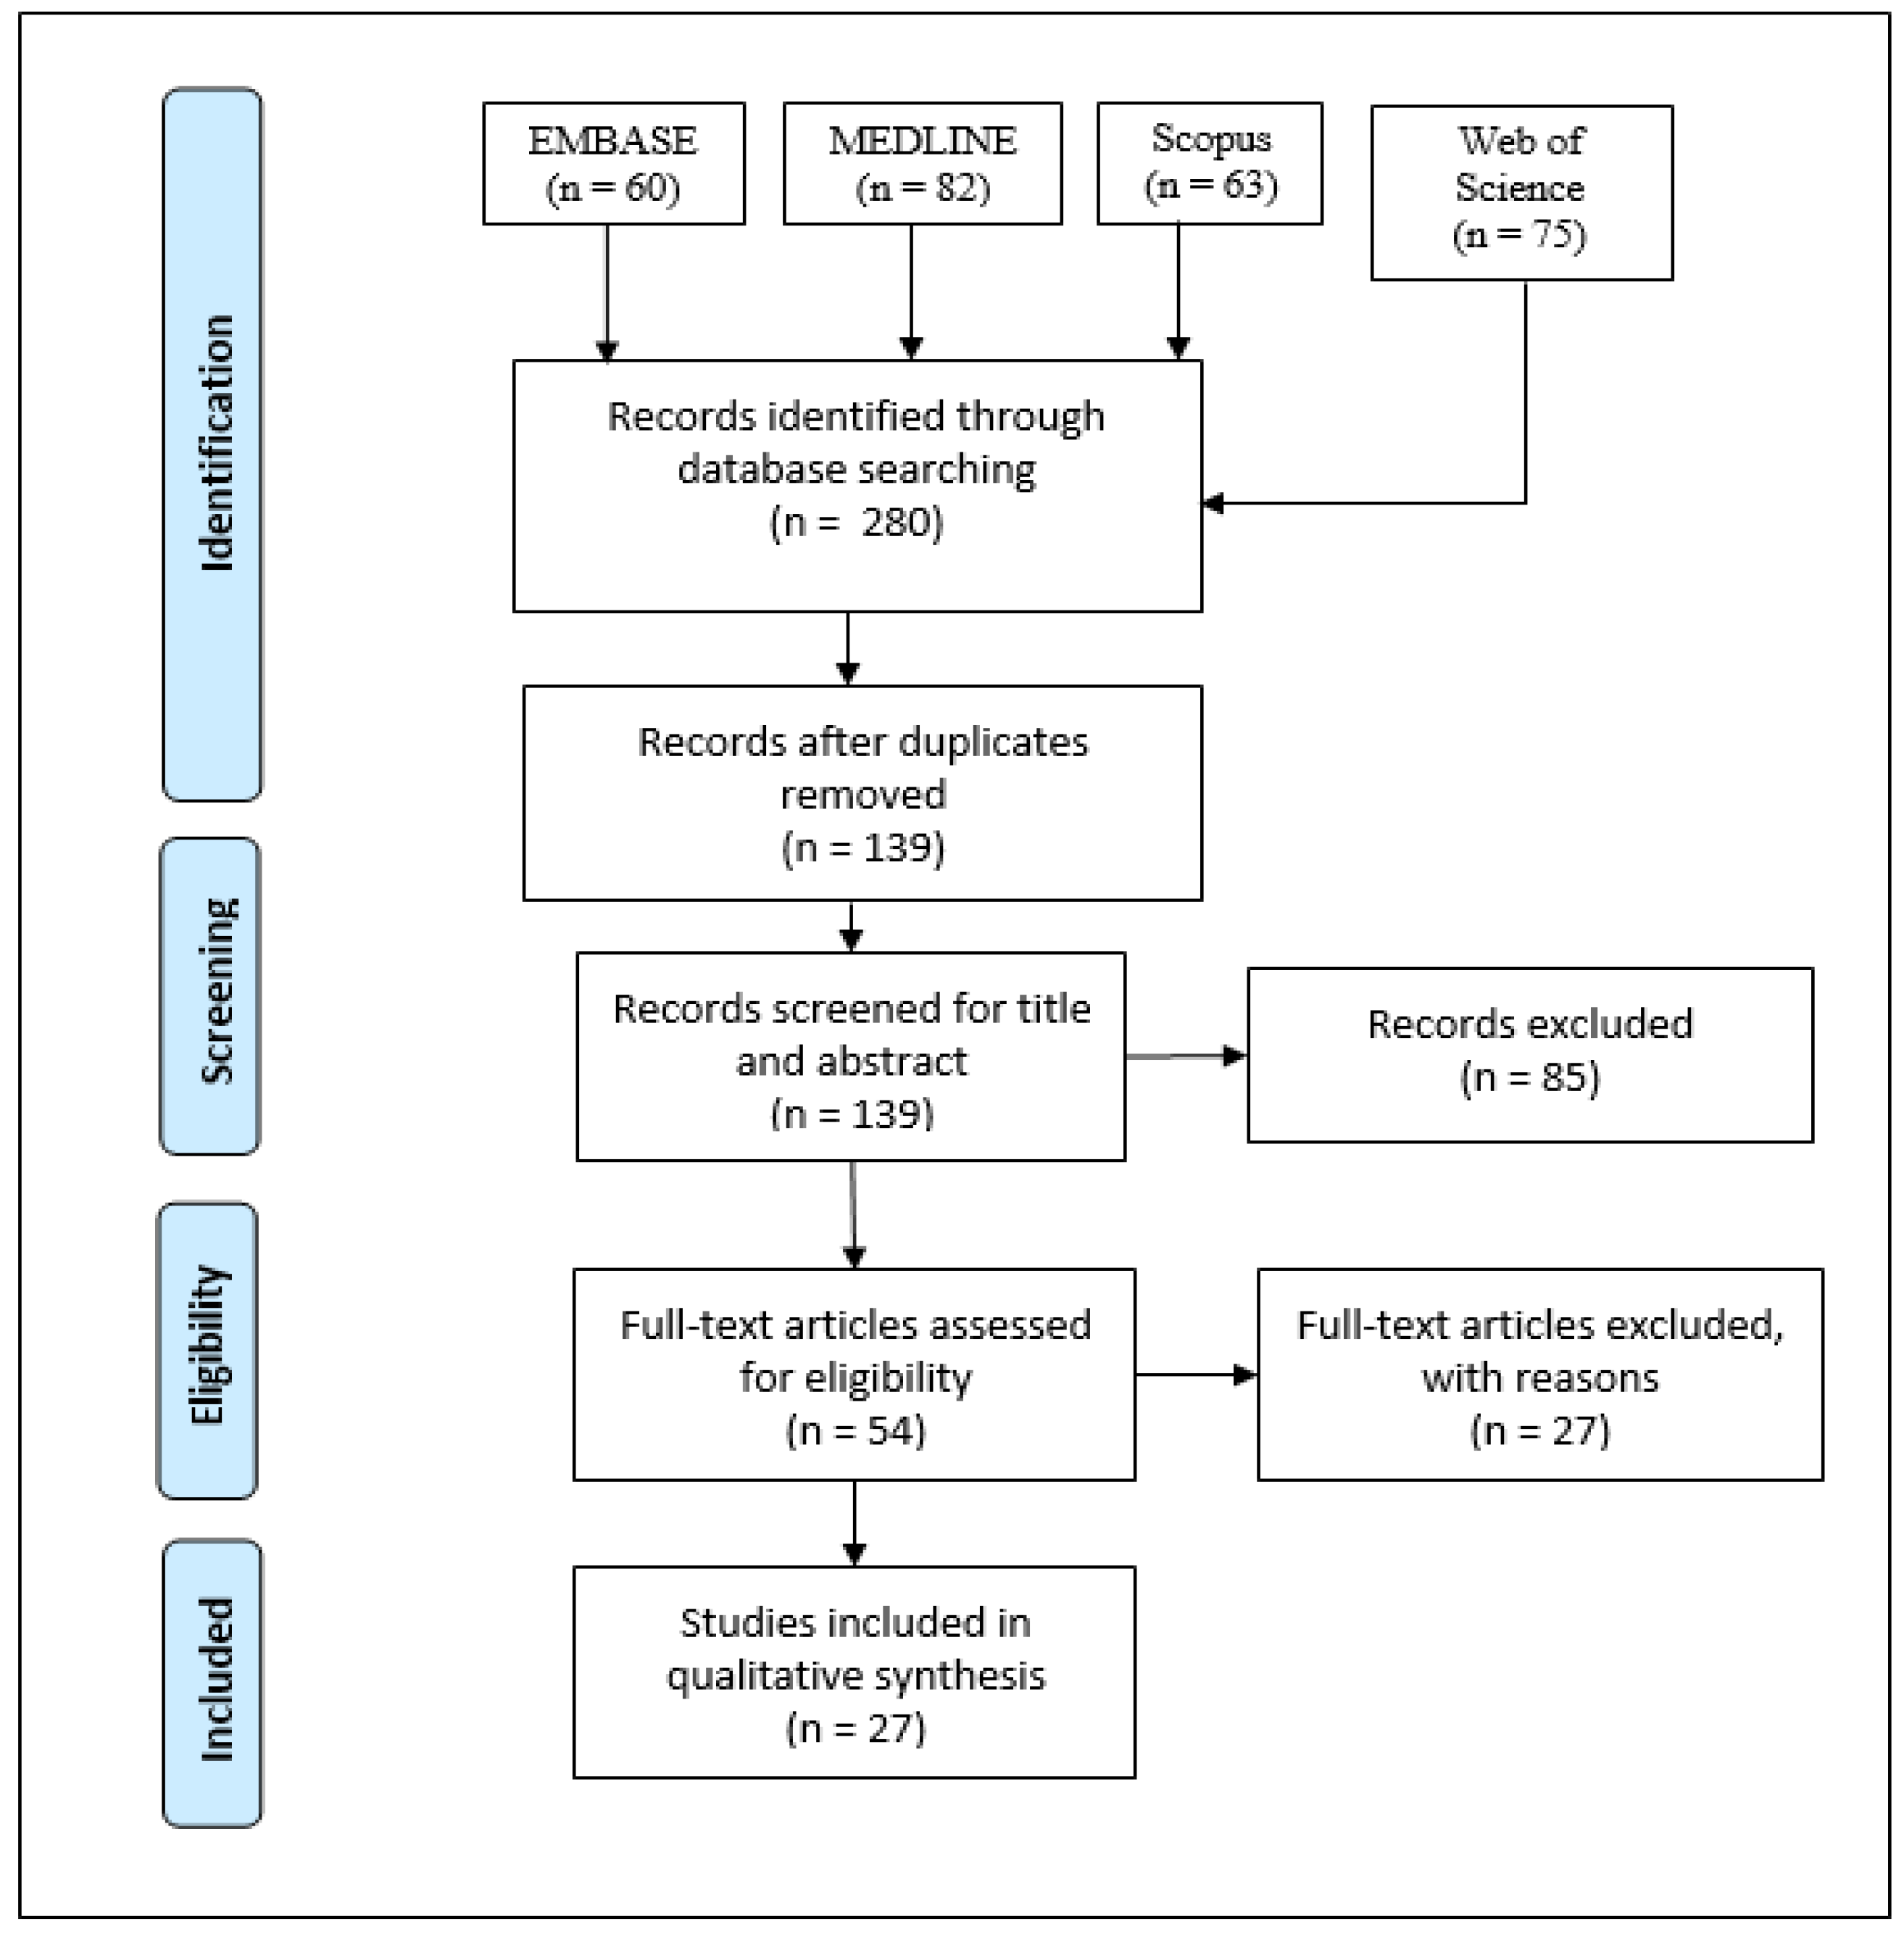
3.1. Results of Study Selection
3.2. Results of Specially Included Study
3.3. Demographic and Clinical Characteristics of Studies from Search
3.4. Results of Studies Conducting Fractal Analysis on Retinal Images
3.5. Results of Meta-Analysis
4. Discussion
4.1. Limitations/Stability of Fractal Dimension
4.2. Meta-Analysis
5. Conclusions
Author Contributions
Funding
Institutional Review Board Statement
Informed Consent Statement
Data Availability Statement
Conflicts of Interest
Abbreviations
| AMD | age-related macular degeneration |
| AVR | arteriolar to venular diameter ratio |
| BAa/v | arteriolar/venular branching angle |
| BCa/v | arteriolar/venular branching coefficient |
| CRAE | central retinal arteriolar equivalent |
| CRVE | central retinal venular equivalent |
| cTORTa/v | curvature arteriolar/venular tortuosity |
| DCP | deep capillary plexus |
| DM | diabetes mellitus |
| DR | diabetic retinopathy |
| DRL | deep retinal layer |
| DVP | deep vascular plexus |
| FD | fractal dimension |
| FAZ | foveal avascular zone |
| FFA | fundus fluorescein angiography |
| FOV | field of view |
| FDa/v/t | arteriolar/venular/total fractal dimension |
| IOP | intraocular pressure |
| MacTel2 | macular telangiectasia type 2 |
| NAION | nonarteritic anterior ischemic optic neuropathy |
| NPDR | non-proliferative diabetic retinopathy |
| OCTA | optical coherence tomography angiography |
| OD | optic disc |
| PDR | proliferative diabetic retinopathy |
| POAG | primary open angle glaucoma |
| RNF | retinal nerve fiber |
| ROI | region of interest |
| RVP | retinal vessel parameter |
| SCP | superficial capillary plexus |
| SD | standard deviation |
| SRL | superficial retinal layer |
| SVP | superficial vascular plexus |
| TORTa/v | arteriolar/venular simple tortuosity |
References
- Murray, C.D. The Physiological Principle of Minimum Work: I. The Vascular System and the Cost of Blood Volume. Proc. Natl. Acad. Sci. USA 1926, 12, 207–214. [Google Scholar] [CrossRef] [PubMed] [Green Version]
- Daxer, A. Characterisation of the Neovascularisation Process in Diabetic Retinopathy by Means of Fractal Geometry: Diagnostic Implications. Graefes Arch. Clin. Exp. Ophthalmol. Albrecht Von Graefes Arch. Klin. Exp. Ophthalmol. 1993, 231, 681–686. [Google Scholar] [CrossRef] [PubMed]
- Daxer, A. The Fractal Geometry of Proliferative Diabetic Retinopathy: Implications for the Diagnosis and the Process of Retinal Vasculogenesis. Curr. Eye Res. 1993, 12, 1103–1109. [Google Scholar] [CrossRef] [PubMed]
- Family, F.; Masters, B.R.; Platt, D.E. Fractal Pattern Formation in Human Retinal Vessels. Phys. Nonlinear Phenom. 1989, 38, 98–103. [Google Scholar] [CrossRef]
- Mainster, M.A. The Fractal Properties of Retinal Vessels: Embryological and Clinical Implications. Eye Lond. Engl. 1990, 4, 235–241. [Google Scholar] [CrossRef] [PubMed] [Green Version]
- Campbell, J.P.; Zhang, M.; Hwang, T.S.; Bailey, S.T.; Wilson, D.J.; Jia, Y.; Huang, D. Detailed Vascular Anatomy of the Human Retina by Projection-Resolved Optical Coherence Tomography Angiography. Sci. Rep. 2017, 7, 42201. [Google Scholar] [CrossRef] [PubMed] [Green Version]
- Mandelbrot, B.B.; Wheeler, J.A. The Fractal Geometry of Nature. Am. J. Phys. 1983, 51, 286–287. [Google Scholar] [CrossRef]
- Lakshminarayanan, V.; Raghuram, A.; Myerson, J.; Varadharajan, S. The Fractal Dimension in Retinal Pathology. J. Mod. Opt. J. MOD Opt. 2003, 50, 1701–1703. [Google Scholar] [CrossRef]
- Soares, J.V.B.; Leandro, J.J.G.; Cesar, R.M.; Jelinek, H.F.; Cree, M.J. Retinal Vessel Segmentation Using the 2-D Gabor Wavelet and Supervised Classification. IEEE Trans. Med. Imaging 2006, 25, 1214–1222. [Google Scholar] [CrossRef] [Green Version]
- Zhang, J.; Bekkers, E.; Abbasi, S.; Dashtbozorg, B.; ter Haar Romeny, B. Robust and Fast Vessel Segmentation via Gaussian Derivatives in Orientation Scores. In Image Analysis and Processing—ICIAP 2015; Murino, V., Puppo, E., Eds.; Springer International Publishing: Cham, Switzerland, 2015; pp. 537–547. [Google Scholar]
- Staal, J.; Abramoff, M.D.; Niemeijer, M.; Viergever, M.A.; van Ginneken, B. Ridge-Based Vessel Segmentation in Color Images of the Retina. IEEE Trans. Med. Imaging 2004, 23, 501–509. [Google Scholar] [CrossRef] [PubMed]
- Kruk, M. Box-Counting Fractal Dimension in Application to Recognition of Hypertension through the Retinal Image Analysis. Przeglad Elektrotechniczny 2013, 89, 286–289. [Google Scholar]
- Huang, F.; Dashtbozorg, B.; Zhang, J.; Bekkers, E.; Abbasi-Sureshjani, S.; Berendschot, T.T.J.M.; Ter Haar Romeny, B.M. Reliability of Using Retinal Vascular Fractal Dimension as a Biomarker in the Diabetic Retinopathy Detection. J. Ophthalmol. 2016, 2016, 6259047. [Google Scholar] [CrossRef] [Green Version]
- Rényi, A. On the Dimension and Entropy of Probability Distributions. Acta Math. Acad. Sci. Hung. 1959, 10, 193–215. [Google Scholar] [CrossRef]
- Tălu, S. Multifractal Geometry in Analysis and Processing of Digital Retinal Photographs for Early Diagnosis of Human Diabetic Macular Edema. Curr. Eye Res. 2013, 38, 781–792. [Google Scholar] [CrossRef]
- Ott, E. Chaos in Dynamical Systems; Cambridge University Press: Cambridge, UK; New York, NY, USA, 1993; ISBN 978-0-521-43799-8. [Google Scholar]
- Moher, D.; Liberati, A.; Tetzlaff, J.; Altman, D.G.; Group, T.P. Preferred Reporting Items for Systematic Reviews and Meta-Analyses: The PRISMA Statement. PLoS Med. 2009, 6, e1000097. [Google Scholar] [CrossRef] [PubMed] [Green Version]
- Schardt, C.; Adams, M.B.; Owens, T.; Keitz, S.; Fontelo, P. Utilization of the PICO Framework to Improve Searching PubMed for Clinical Questions. BMC Med. Inform. Decis. Mak. 2007, 7, 16. [Google Scholar] [CrossRef] [PubMed] [Green Version]
- Luo, D.; Wan, X.; Liu, J.; Tong, T. Optimally Estimating the Sample Mean from the Sample Size, Median, Mid-Range, and/or Mid-Quartile Range. Stat. Methods Med. Res. 2018, 27, 1785–1805. [Google Scholar] [CrossRef] [Green Version]
- Wan, X.; Wang, W.; Liu, J.; Tong, T. Estimating the Sample Mean and Standard Deviation from the Sample Size, Median, Range and/or Interquartile Range. BMC Med. Res. Methodol. 2014, 14, 135. [Google Scholar] [CrossRef] [PubMed] [Green Version]
- Schwarzer, G. Methods for Meta-Analysis in Medical Research. Alex J. Sutton, Keith R. Abrams, David R. Jones, Trevor A. Sheldon and Fujian Song, Wiley, Chichester, U.K., 2000. No. of Pages: Xvii+317. ISBN 0-471-49066-0. Stat. Med. 2003, 22, 3112–3114. [Google Scholar] [CrossRef]
- Diabetic Retinopathy Study. Report Number 6. Design, Methods, and Baseline Results. Report Number 7. A Modification of the Airlie House Classification of Diabetic Retinopathy. Investig. Ophthalmol. Vis. Sci. 1981, 21, 1–226. [Google Scholar]
- Early Treatment Diabetic Retinopathy Study Research Group. Grading Diabetic Retinopathy from Stereoscopic Color Fundus Photographs--an Extension of the Modified Airlie House Classification. ETDRS Report Number 10. Ophthalmology 1991, 98, 786–806. [Google Scholar] [CrossRef]
- Wilkinson, C.P.; Ferris, F.L.; Klein, R.E.; Lee, P.P.; Agardh, C.D.; Davis, M.; Dills, D.; Kampik, A.; Pararajasegaram, R.; Verdaguer, J.T.; et al. Proposed International Clinical Diabetic Retinopathy and Diabetic Macular Edema Disease Severity Scales. Ophthalmology 2003, 110, 1677–1682. [Google Scholar] [CrossRef]
- World Health Organization. Brien Holden Vision Institute The Impact of Myopia and High Myopia. Report of the Joint World Health Organization-Brien Holden Vision Institute Global Scientific Meeting on Myopia. Available online: https://www.visionuk.org.uk/download/WHO_Report_Myopia_2016.pdf (accessed on 4 March 2021).
- Foster, P.J.; Buhrmann, R.; Quigley, H.A.; Johnson, G.J. The Definition and Classification of Glaucoma in Prevalence Surveys. Br. J. Ophthalmol. 2002, 86, 238–242. [Google Scholar] [CrossRef] [PubMed] [Green Version]
- Asman, P.; Heijl, A. Glaucoma Hemifield Test. Automated Visual Field Evaluation. Arch. Ophthalmol. Chic. Ill 1960 1992, 110, 812–819. [Google Scholar] [CrossRef] [PubMed]
- Cheung, C.Y.; Thomas, G.N.; Tay, W.; Ikram, M.K.; Hsu, W.; Lee, M.L.; Lau, Q.P.; Wong, T.Y. Retinal Vascular Fractal Dimension and Its Relationship With Cardiovascular and Ocular Risk Factors. Am. J. Ophthalmol. 2012, 154, 663–674. [Google Scholar] [CrossRef] [PubMed]
- Al-Sheikh, M.; Phasukkijwatana, N.; Dolz-Marco, R.; Rahimi, M.; Iafe, N.A.; Freund, K.B.; Sadda, S.R.; Sarraf, D. Quantitative OCT Angiography of the Retinal Microvasculature and the Choriocapillaris in Myopic Eyes. Investig. Ophthalmol. Vis. Sci. 2017, 58, 2063–2069. [Google Scholar] [CrossRef] [Green Version]
- Azemin, M.Z.C.; Daud, N.M.; Ab Hamid, F.; Zahari, I.; Sapuan, A.H. Influence of Refractive Condition on Retinal Vasculature Complexity in Younger Subjects. Sci. World J. 2014, 2014, 783525. [Google Scholar] [CrossRef] [PubMed] [Green Version]
- Li, H.; Mitchell, P.; Liew, G.; Rochtchina, E.; Kifley, A.; Wong, T.Y.; Hsu, W.; Lee, M.L.; Zhang, Y.P.; Wang, J.J. Lens Opacity and Refractive Influences on the Measurement of Retinal Vascular Fractal Dimension. Acta Ophthalmologica 2010, 88, e234–e240. [Google Scholar] [CrossRef]
- Li, M.; Yang, Y.; Jiang, H.; Gregori, G.; Roisman, L.; Zheng, F.; Ke, B.; Qu, D.; Wang, J. Retinal Microvascular Network and Microcirculation Assessments in High Myopia. Am. J. Ophthalmol. 2017, 174, 56–67. [Google Scholar] [CrossRef] [Green Version]
- Yang, Y.; Wang, J.; Jiang, H.; Yang, X.; Feng, L.; Hu, L.; Wang, L.; Lu, F.; Shen, M. Retinal Microvasculature Alteration in High Myopia. Investig. Ophthalmol. Vis. Sci. 2016, 57, 6020–6030. [Google Scholar] [CrossRef] [PubMed] [Green Version]
- Grauslund, J.; Green, A.; Kawasaki, R.; Hodgson, L.; Sjolie, A.K. Retinal Vascular Fractals and Microvascular and Macrovascular Complications in Type 1 Diabetes. Ophthalmology 2010, 117, 1400–1405. [Google Scholar] [CrossRef] [PubMed]
- Kostic, M.; Bates, N.M.; Milosevic, N.T.; Tian, J.; Smiddy, W.E.; Lee, W.-H.; Somfai, G.M.; Feuer, W.J.; Shiffman, J.C.; Kuriyan, A.E.; et al. Investigating the Fractal Dimension of the Foveal Microvasculature in Relation to the Morphology of the Foveal Avascular Zone and to the Macular Circulation in Patients With Type 2 Diabetes Mellitus. Front. Physiol. 2018, 9, 1233. [Google Scholar] [CrossRef] [PubMed]
- Frydkjaer-Olsen, U.; Soegaard Hansen, R.; Pedersen, K.; Peto, T.; Grauslund, J. Retinal Vascular Fractals Correlate With Early Neurodegeneration in Patients With Type 2 Diabetes Mellitus. Investig. Ophthalmol. Vis. Sci. 2015, 56, 7438–7443. [Google Scholar] [CrossRef] [PubMed] [Green Version]
- Tang, F.Y.; Ng, D.S.; Lam, A.; Luk, F.; Wong, R.; Chan, C.; Mohamed, S.; Fong, A.; Lok, J.; Tso, T.; et al. Determinants of Quantitative Optical Coherence Tomography Angiography Metrics in Patients with Diabetes. Sci. Rep. 2017, 7. [Google Scholar] [CrossRef] [PubMed] [Green Version]
- Tang, F.Y.; Chan, E.O.; Sun, Z.; Wong, R.; Lok, J.; Szeto, S.; Chan, J.C.; Lam, A.; Tham, C.C.; Ng, D.S.; et al. Clinically Relevant Factors Associated with Quantitative Optical Coherence Tomography Angiography Metrics in Deep Capillary Plexus in Patients with Diabetes. EYE Vis. 2020, 7. [Google Scholar] [CrossRef] [PubMed]
- Avakian, A.; Kalina, R.E.; Sage, E.H.; Rambhia, A.H.; Elliott, K.E.; Chuang, E.L.; Clark, J.I.; Hwang, J.-N.; Parsons-Wingerter, P. Fractal Analysis of Region-Based Vascular Change in the Normal and Non-Proliferative Diabetic Retina. Curr. Eye Res. 2002, 24, 274–280. [Google Scholar] [CrossRef] [PubMed]
- Zahid, S.; Dolz-Marco, R.; Freund, K.B.; Balaratnasingam, C.; Dansingani, K.; Gilani, F.; Mehta, N.; Young, E.; Klifto, M.R.; Chae, B.; et al. Fractal Dimensional Analysis of Optical Coherence Tomography Angiography in Eyes With Diabetic Retinopathy. Investig. Ophthalmol. Vis. Sci. 2016, 57, 4940–4947. [Google Scholar] [CrossRef] [PubMed]
- Bhardwaj, S.; Tsui, E.; Zahid, S.; Young, E.; Mehta, N.; Agemy, S.; Garcia, P.; Rosen, R.B.; Young, J.A. Value Of Fractal Analysis Of Optical Coherence Tomography Angiography In Various Stages of Diabetic Retinopathy. Retina 2018, 38, 1816–1823. [Google Scholar] [CrossRef] [PubMed]
- Hirano, T.; Kitahara, J.; Toriyama, Y.; Kasamatsu, H.; Murata, T.; Sadda, S. Quantifying Vascular Density and Morphology Using Different Swept-Source Optical Coherence Tomography Angiographic Scan Patterns in Diabetic Retinopathy. Br. J. Ophthalmol. 2019, 103, 216–221. [Google Scholar] [CrossRef] [PubMed]
- Cheung, N.; Donaghue, K.C.; Liew, G.; Rogers, S.L.; Wang, J.J.; Lim, S.-W.; Jenkins, A.J.; Hsu, W.; Li Lee, M.; Wong, T.Y. Quantitative Assessment of Early Diabetic Retinopathy Using Fractal Analysis. Diabetes Care 2009, 32, 106–110. [Google Scholar] [CrossRef] [PubMed] [Green Version]
- Cheung, C.Y.; Sabanayagam, C.; Law, A.K.; Kumari, N.; Ting, D.S.; Tan, G.; Mitchell, P.; Cheng, C.Y.; Wong, T.Y. Retinal Vascular Geometry and 6 Year Incidence and Progression of Diabetic Retinopathy. Diabetologia 2017, 60, 1770–1781. [Google Scholar] [CrossRef] [PubMed]
- Ting, D.S.W.; Tan, G.S.W.; Agrawal, R.; Yanagi, Y.; Sie, N.M.; Wong, C.W.; San Yeo, I.Y.; Lee, S.Y.; Cheung, C.M.G.; Wong, T.Y. Optical Coherence Tomographic Angiography in Type 2 Diabetes and Diabetic Retinopathy. JAMA Ophthalmol. 2017, 135, 306–312. [Google Scholar] [CrossRef]
- Kunicki, A.C.B.; Oliveira, A.J.; Mendonca, M.B.M.; Barbosa, C.T.F.; Nogueira, R.A. Can the Fractal Dimension Be Applied for the Early Diagnosis of Non-Proliferative Diabetic Retinopathy? Braz. J. Med. Biol. Res. 2009, 42, 930–934. [Google Scholar] [CrossRef] [PubMed] [Green Version]
- Lim, S.W.; Cheung, N.; Wang, J.J.; Donaghue, K.C.; Liew, G.; Islam, F.M.A.; Jenkins, A.J.; Wong, T.Y. Retinal Vascular Fractal Dimension and Risk of Early Diabetic Retinopathy: A Prospective Study of Children and Adolescents with Type 1 Diabetes. Diabetes Care 2009, 32, 2081–2083. [Google Scholar] [CrossRef] [PubMed] [Green Version]
- Koulisis, N.; Kim, A.Y.; Chu, Z.; Shahidzadeh, A.; Burkemper, B.; De Koo, L.C.O.; Moshfeghi, A.A.; Ameri, H.; Puliafito, C.A.; Isozaki, V.L.; et al. Quantitative Microvascular Analysis of Retinal Venous Occlusions by Spectral Domain Optical Coherence Tomography Angiography. PLoS ONE 2017, 12. [Google Scholar] [CrossRef] [PubMed] [Green Version]
- Remond, P.; Aptel, F.; Cunnac, P.; Labarere, J.; Palombi, K.; Pepin, J.L.; Pollet-Villard, F.; Hogg, S.; Wang, R.; MacGillivray, T.; et al. Retinal Vessel Phenotype in Patients with Nonarteritic Anterior Ischemic Optic Neuropathy. Am. J. Ophthalmol. 2019, 208, 178–184. [Google Scholar] [CrossRef] [PubMed]
- Tzaridis, S.; Wintergerst, M.W.M.; Mai, C.; Heeren, T.F.C.; Holz, F.G.; Charbel Issa, P.; Herrmann, P. Quantification of Retinal and Choriocapillaris Perfusion in Different Stages of Macular Telangiectasia Type 2. Investig. Ophthalmol. Vis. Sci. 2019, 60, 3556–3562. [Google Scholar] [CrossRef] [Green Version]
- de Melo de Mendonça, M.B.; de Amorim Garcia, C.A.; de Albuquerque Nogueira, R.; Gomes, M.A.F.; Valença, M.M.; Oréfice, F. Fractal analysis of retinal vascular tree: Segmentation and estimation methods. Arq. Bras. Oftalmol. 2007, 70, 413–422. [Google Scholar] [CrossRef] [Green Version]
- Wainwright, A.; Liew, G.; Burlutsky, G.; Rochtchina, E.; Zhang, Y.; Hsu, W.; Lee, J.; Wong, T.-Y.; Mitchell, P.; Wang, J. Effect of Image Quality, Color, and Format on the Measurement of Retinal Vascular Fractal Dimension. Investig. Ophthalmol. Vis. Sci. 2010, 51, 5525–5529. [Google Scholar] [CrossRef] [Green Version]
- Lemmens, S.; Devulder, A.; Van Keer, K.; Bierkens, J.; De Boever, P.; Stalmans, I. Systematic Review on Fractal Dimension of the Retinal Vasculature in Neurodegeneration and Stroke: Assessment of a Potential Biomarker. Front. Neurosci. 2020, 14, 16. [Google Scholar] [CrossRef] [PubMed] [Green Version]

| Pathology | Number of Subjects | Mean (SD) Fractal Dimension for RNF Images | Mean (SD) Fractal Dimension for FFA Images | Significant Difference in FD from Normals? |
|---|---|---|---|---|
| Normal | 29 | 1.669 (0.0309) | 1.586 (0.0760) | N/A |
| Glaucoma | 25 | 1.694 (0.0229) | N/A | Yes |
| Ocular hypertension | 17 | 1.673 (0.1170) | N/A | No |
| Central Serous retinopathy | 11 | N/A | 1.592 (0.0352) | No |
| Diabetic retinopathy | 10 | N/A | 1.623 (0.0232) | Yes |
| Branch retinal vein occlusion | 4 | N/A | 1.597 (0.0258) | No |
| Central retinal vein occlusion | 3 | N/A | 1.569 (0.0470) | No |
| Central retinal artery occlusion | 2 | N/A | 1.557 (0.0254) | No |
| Author (Year) | Study Design (LOE) | Pathologies | N Subjects Cases/Controls | Mean (SD) Age in Years: | Sex (M, F): Cases/Controls | Population and Clinical Characteristics |
|---|---|---|---|---|---|---|
| Al-Sheikh et al. (2017) | Case–control | Myopia | 48 28/20 | Cases: 57.00 (17.93) Controls: 56.05 (19.27) | (13 M, 15 F)/(6 M, 14 F) | Myopic subjects with refraction greater than −6 diopters or axial lengths longer than 26.5 mm were included along with age-matched controls. Clinic where examinations took place was not stated. |
| Avakian et al. (2002) | Case–control | Diabetic Retinopathy | 9 5/4 | Not stated | Not stated | DR and control patients were diagnosed at the Ophthalmology Clinic, University of Washington, yielding 5 normal and 5 NPDR eyes. DR patients were diagnosed as having mild to moderate NPDR. |
| Azemin et al. (2014) | Case–control | Myopia | 82 41/41 | Cases: 23.93 (2.13) Controls: 24.27 (2.49) | 35 M, 47 F total | Retinal images were collected from attendees at IIUM Optometry Clinic between January 2009 till June 2012. Classification into emmetropic and myopic groups was based on SER: emmetropia; between −1.00 D and +1.00 D SER, and myopia; SER of −3.00 D or worse. Subjects with lens opacity/history of ocular trauma/significant systematic disorder were excluded. |
| Bhardwaj et al. (2018) | Case–control | Diabetic Retinopathy | 61 35/26 | Cases: 56.3 (11.6) Controls: 44.3 (19.1) | Not stated | Cases and controls were recruited from The New York Eye and Ear Infirmary of Mount Sinai, yielding 49 control eyes and 58 DR eyes. DR was graded according to the modified Arlie House classification of DR. Of the 58 DR eyes, 31 were categorized as NPDR (13 mild, 9 moderate, and 9 severe) and 27 as PDR. |
| Cheung et al. (2009) | Cross-sectional | Type 1 Diabetes Mellitus, Diabetic Retinopathy | 729 137/592 | Median age (IQR) of Total: 13.6 (12.8–15.0) | 322 M, 407 F total | Cases and controls were recruited from the Children’s Hospital at Westmead, Sydney, Australia. DR was graded from ETDRS seven-field stereoscopic retinal photographs according to ETDRS adaptation of the Arlie House classification. Retinopathy was defined as ETDRS level 21 (minimal NPDR) or greater. |
| Cheung et al. (2012) | Cross-sectional | Diabetes, Diabetic Retinopathy, Hypertension, AMD, Myopia, Glaucoma | 2913 | Total: 57.67 (10.68) | 1393 M, 1520 F total | Data was taken from the baseline Singapore Malay Eye Study (SiMES-1) of urban Malay adults between 40 to 80 years of age. DM was defined as random plasma glucose ≥11.1 mmol/L, use of diabetic medication, or diagnosis from a physician. Hypertension was defined as blood pressure of 140/90 mmHg or more. Anterior chamber depth, spherical equivalent, and axial length were used as myopic measures. DR was graded using the ETDRS adaptation of Arlie House classification system, presence was defined as severity level of 15 or more. AMD was graded according to the Wisconsin Age-related Maculopathy Grading System and graded as present if early or late AMD signs were present. Glaucoma was diagnosed and classified using International Society of Geographical and Epidemiological Ophthalmology scheme. |
| Cheung et al. (2017) | Cohort | Diabetic Retinopathy | 427 | Total: 58.55 (8.66) | 186 M, 241 F total | Participants were eligible individuals who participated in the SiMES-1 baseline study and also the six year follow-up study SiMES-2. DR was graded as in Cheung et al. (2012). |
| Chicquet et al. (2020) | Case–control | Primary Open Angle Glaucoma | 122 61/61 | Median (IQR) of Cases: 61 (55.5, 71.5) and Controls: 66 (56, 71), | (58 M, 64 F)/(50 M, 72 F) | Cases and controls were recruited from the University Hospital of Dijon and the University Hospital of Grenoble. Diagnosis was based on the Glaucoma Hemifield Test, pattern standard deviation, and characteristic optic nerve damage. |
| Grauslund et al. (2010) | Cross-sectional | Type 1 Diabetes Mellitus, Diabetic Retinopathy | 178 | Total: 57.8 (12.6) | 111 M, 67 F total | Study was part of a cohort study of type 1 diabetes patients from Fye county, Denmark. Participants were identified based on insulin prescriptions in Fyn County, Denmark as described previously. Retinal photos were graded for according to ETDRS version of the Airlie House classification. PDR was considered present for levels 60 to 85. |
| Hirano et al. (2019) | Case–control | Diabetic Retinopathy | 62 46/16 | No DR: 52 (21) NPDR: 62 (14) PDR: 53 (14) Controls: 47 (18) | (29 M, 17 F)/(8 M, 8 F) | All participants were recruited from the Doheny Eye Center at the University of California, Los Angeles and the Shinshu University School of Medicine. DR severity was assessed using the International Clinical Diabetic Retinopathy Severity Scale. All cases were diabetic: 10 having no DR, 18 having NPDR, and 18 having PDR. |
| Kostic et al. (2018) | Case–control | Type 2 Diabetes Mellitus, Diabetic Retinopathy | 47 35/12 | DM: 52.64 (7.79) With DR: 52.63 (5.79) Controls: 54.08 (7.71) | (14 M, 21 F)/(3 M, 9 F) | Participants consisted of patients with DM that had DR up to ETDRS level 35 without macular edema, DM patients with no retinopathy, and healthy individuals. |
| Koulisis et al. (2016) | Case series | Retinal Venous Occlusion | 60 34/26 | Cases: 64.8 (8.8) Controls: 60.9 (9.6) | (14 M, 20 F)/(11 M, 15 F) | Study participants derived were adult subjects who underwent clinical evaluation and treatment for RVO. Control subjects were those without history of vascular disease or had it well controlled. Clinic/RVO diagnosis information not given. |
| Kunicki et al. (2009) | Case–control | Diabetic Retinopathy | 33 5/28 | Age range: 31–86 | Not stated | Control group consisted of 28 diabetic but ophthalmically normal patients. Case group consisted of 5 individuals with mild NPDR. All retinal images were obtained from the Digital Retinal Images for Vessel Extraction (DRIVE) database. |
| Kurniawan et al. (2012) | Cohort | Hypertension | 1174 | Total: 11.91 (1.01) | 576 M, 598 F total | Subjects were schoolchildren from the Singapore Cohort Study of Risk Factors for Myopia. The systolic/diastolic blood pressures used for analysis was calculated by taking the average of three separate measurements. Mean arterial blood pressure was two thirds of diastolic blood pressure plus one third of systolic blood pressure. |
| Li et al. (2010) | Cross-sectional | Myopia | 2859 | Total: 64.17 (8.80) | 1247 M, 1612 F total | Study population was derived from Blue Mountains Eye Study. Emmetropia was defined as a SER between −1.00 D and 1.00 D. Myopia was classified as low (−1.01 D to −2.99 D), moderate (−3.00 D to −5.99 D), and high (−6.00 D or worse). |
| Li et al. (2017) | Case–control | Myopia | 40 20/20 | Cases: 28 (5) Controls: 30 (6) | (5 M, 15 F)/(7 M, 13 F) | Cases had SER worse than −5 D and controls had SER better than −3 D. Clinic where subjects were recruited from was not stated. |
| Lim et al. (2009) | Cohort | Diabetic Retinopathy | 590 | Age range: 12–20 | Not stated | Participants recruited from the Children’s Hospital at Westmead, Sydney, Australia. Type 1 diabetes was defined following the Australasian Pediatric Endocrine Group diabetes register and national guidelines. Diabetic retinopathy was graded according to ETDRS adaptation of Arlie House classification. |
| Lim et al. (2017) | Cohort | Diabetic Retinopathy | 249 | Total: 59.9 (8.9) | 183 M, 66 F total | Subjects were adults with diabetes mellitus referred by physicians to Singapore National Eye Centre. Diabetic retinopathy was graded according to the ETDRS severity scale. |
| Olsen et al. (2015) | Cross-sectional | Type 2 Diabetes Mellitus | 103 | Total: 62.3 Range: 47.9–70.3 | 48 M, 55 F | Type 2 diabetic subjects were recruited from a DR screening clinic and examined at Odense University Hospital, Odense, Denmark. Only patients with no or minimal DR were invited. |
| Remond et al. (2019) | Case series | NAION | 114 57/57 | Cases: 70 (8) Controls: 71 (8) | (32 M, 25 F)/(32 M, 25 F) | Study included retrospectively imaged patients between September 2007 and July 2017 at Grenoble Alpes University. |
| Tang et al. (2017) | Cross-sectional | Type 1 or 2 Diabetes Mellitus, Diabetic Retinopathy | 286 | Total: 65.69 (10.73) | 122 M, 164 F total | DM (type 1 or 2) patients at CUHK Eye Centre, Hong Kong Eye Hospital |
| Tang et al. (2020) | Cross-sectional | Type 1 or 2 Diabetes Mellitus, Diabetic Retinopathy | 250 | Total: 60.7 (13.2) | 135 M, 115 F total | DM (type 1 or 2) patients at CUHK Eye Centre, Hong Kong Eye Hospital |
| Ting et al. (2017) | Cohort | Diabetic Retinopathy | 50 | Total: 59.5 (8.9) | 26 M, 24 F total | Type 2 diabetic subjects recruited from DR screening clinic in the Singapore National Eye Center, Singapore, Singapore. DR was graded according to the International Clinical Diabetic Retinopathy Severity Scales. |
| Tzaridis et al. (2019) | Cross-sectional | MacTel Type 2 | 100 76/24 | Cases: 62.3 (6.1) Controls: 61.5 (5.9) | Not stated | Subjects with confirmed diagnosis were recruited from the Natural History and Observation Study (NHOS) in Germany at the Department of Ophthalmology, University Hospital of Bonn, Germany. |
| Wu et al. (2013) | Cross-sectional | Glaucoma | 2789 123/2666 | Age range: 40–80 | Not stated | Subjects derived from SiMES-1. Glaucoma was diagnosed according to the International Society of Geographic and Epidemiological Ophthalmology criteria. Ocular hypertension (OHT) was defined as intraocular pressure > 21.5 mmHg without glaucoma. |
| Xu et al. (2020) | Case–control | Hypertension | 120 77/43 | Cases: 59.2 (7.6) Controls: 57.0 (6.8) | (26 M, 51 F)/(15 M, 28 F) | Subgroup of an observational study population that was conducted in the village area of Pingyin County in the southwest of Jinan, Shandong, China. Inclusion in the hypertensive group was determined by having blood pressure > 140/90 mmHg and <180/110 mmHg, age from 40–80 years, and no signs of confounding comorbidities. Mean arterial pressure defined as diastolic blood pressure plus one third of the diastolic and systolic blood pressure difference. |
| Yang et al. (2016) | Case–control | Myopia | 45 21/24 | Cases: 26.0 (2.7) Controls: 27.4 (6.4) | (12 M, 9 F)/14 M, 10 F) | Patients from Wenzhou Eye Hospital and students from Wenzhou Medical University were recruited. Control group consisted of subjects with SER between +0.50 D and −3.00 D and highly myopic group consisted of subjects with SER less than −6.00 D. |
| Zahid et al. (2016) | Case series | Diabetic Retinopathy | 37 8/29 | Cases: 56.66 (12.65) Controls: 32.27 (6.71) | Not stated | Subjects were recruited from the private practices of Vitreous, Retina, Macula Consultants of New York. Case group inclusion criteria included age greater than 18 years, history of DM, and presence of mild NPDR to PDR without evidence of DME. Control group included volunteer subjects without history of diabetes or ocular disease. |
| Author (Year) | RVPs | Imaging Device | FD ROI | FD Calculation | Results |
|---|---|---|---|---|---|
| Al-Sheikh et al. (2017) | FDt, vessel density | Optovue RTVue-XR Avanti; OptoVue, Inc., Fremont, CA, USA | Whole area permitted by 3 × 3 mm macula scan | Box-counting method using Fractalyse (ThéMA, Besançon Cedex, France). | Myopic eyes had statistically significantly lower FD in both SCP and DCP layers. |
| Avakian et al. (2002) | FDt, grid intersection | 60° fundus fluorescein angiography | RVPs were calculated for the macular and paramacular regions and also for the entire retina. The image was divided into nine square, equal zones with the central square denoted the macular region, and the paramacular region being comprised of the five zones above, below, and to the right of the macular region. | Segmentation was done manually using NIH, Adobe Photoshop, and computerized processing. RVPs calculation was done using a custom-written computer program. | FD was found to be significantly higher in the macular region for normal patients as opposed to NPDR patients. FD difference in paramacular regions were not strongly significant. |
| Azemin et al. (2014) | FDt | 45° digital retinal camera (AFC-230/210) | Whole area of the image, which is centered at the midway point between the macula and OD. | Vessel segmentation was done using custom-written software. Box-counting FD was calculated using the FracLac plugin of ImageJ. | Eyes with myopia tended to have a smaller FD than the emmetropic control group. |
| Bhardwaj et al. (2018) | FD_SCP, FD_DCP, correlation coefficient | Optovue RTVue-XR Avanti; OptoVue, Inc., Fremont CA, USA | Whole area permitted by 3 × 3 mm scan centered about the fovea. | Box-counting method using Fractalyse. | For all stages of DR, FD was found to be reduced in diabetic eyes as opposed to controls. The DCP was more consistently affected than the SCP. |
| Cheung et al. (2009) | FDt | Seven-standard field stereoscopic retinal photography with Topcon Fundus Camera (TRC 50-VT; Tokyo Optical, Tokyo, Japan) | Circular region of 3.5 DD centered on the OD. | Vessel segmentation and box-counting FD with IRIS-Fractal | Increased FD was associated with early retinopathy signs in young individuals. |
| Cheung et al. (2012) | FDt, CRAE, CRVE | 45° digital retinal camera (Canon CR-DGi with a 10D SLR digital camera backing; Canon, Tochigiken, Japan) | 0.5–2.0 disc diameters away from the OD margin. | RVPs were calculated using Singapore I Vessel Assessment (SIVA) semi-automatic computer program. FD was calculated using box-counting. | Smaller FD was associated with older age, diabetes, hypertension, myopia refraction, and presence of cataract. AMD, glaucoma, had no impact on FD. DR was not related to FD after performing multivariate regression analysis. |
| Cheung et al. (2017) | FDa/v, BAa/v, BCa/v, CRAE, CRVE, sTORTa/v, cTORTa/v | 45° digital retinal camera (Canon CR-DGi 10D; Canon, Tokyo, Japan) | 0.5–2.0 disc diameters away from the OD margin. | Box-counting using SIVA | Higher values of arteriolar fractal dimension were associated with incidence of referable DR. |
| Chicquet et al. (2020) | CRAE, CRVE, TORTa/b, AVR, FDa/v/t (multifractal: capacity, information, correlation) | 30 or 40° digital retinal camera (Visu-cam 200; Carl Zeiss Meditec, Oberkochen, Germany) or (CR2; Canon, Europa, Amstelveen, The Netherlands) | Centered at the OD, circular regions: Zone A [0–0.5 OD disc diameters], Zone B [0.5–1 disc diameters], Zone C [0.5–2.0 disc diameters]. | Fractal parameters were calculated in Zone C using VAMPIRE software. | POAG patients exhibited reduced values of fractal parameters. |
| Grauslund et al. (2010) | FDt | 45° digital retinal camera (TRC-NW6S; Topcon, Tokyo, Japan) | Circular region of 3.5 disc diameters centered at the OD. | Box-counting method using IRIS-Fractal | Persons with lower FD were more likely to have proliferative retinopathy, neuropathy, and nephropathy. |
| Hirano et al. (2019) | Perfusion density, Vessel length density, FDt | PLEX Elite 9000; Carl Zeiss Meditec, Dublin, California, USA | 3 × 3, 6 × 6, and 12 × 12 mm fovea centered scans. Unsegmented retina, SRL, and DRL layers considered separately. | Box-counting method using Fractalyse. | FD progressively decreased with worsening DR severity in segmented and non-segmented layers for all scan sizes. |
| Kostic et al. (2018) | FDt, FAZ perimeter, FAZ roundness, FAZ area | 20° digital retinal camera, exact model not stated | Whole area permitted by photo. | Box-counting method was used after importing images into ImageJ and grayscale format conversion | The healthy group had the highest FD compared to the DM (Diabetes Mellitus) and MDR (Mild diabetic retinopathy) groups. FD in the MDR group was also significantly lower than the DM group. |
| Koulisis et al. (2016) | Skeletal density, vessel diameter index, vessel density, FDt, FD_SRL, FD_DRL | Cirrus; Carl Zeiss Meditec, Dublin, CA, USA | 3 × 3 mm scan centered on the fovea. Unsegmented retina, SRL, and DRL layers considered separately. | Box-counting method using custom software. | Lower mean FD was demonstrated in the non-segmented layer of RVO eyes compared to controls. Subgroup analysis of CRVO and BRVO eyes independently demonstrated lower mean non-segmented FD versus controls. FD was significantly lower in CRVO, BRVO eyes compared to the unaffected fellow eye. In SRL, CRVO and BRVO eyes demonstrated significantly lower FD. In DRL, only CRVO eyes had this trend. |
| Kunicki et al. (2009) | FD0 (Box-counting), FD1 (Information) | 45° digital retinal camera (CR5; Canon, Tokyo, Japan) | Image was divided into 9 square regions of equal size. Fractal dimensions were calculated in each of those regions as well for the entire retina. | Fractal parameters calculated using Benoit Fractal Analysis System (TruSoft, St Petersburg, FL, USA) | Results did not show significant difference between cases and controls. |
| Kurniawan et al. (2012) | CRAE, CRVE, FD | Digital retinal photography, model and FOV not stated. | Circular region of 3.5 disc diameters centered at the OD. | Box-counting using IRIS-Fractal | Blood pressure was inversely related to retinal FD. |
| Li et al. (2010) | FDt | 30° digital retinal camera (Zeiss FF3; Carl Zeiss, Oberkochen, Germany) | Circular region of 3.5 disc diameters centered at the OD. | Box-counting using IRIS-Fractal | Increasing myopia severity was associated with reduced FD after adjusting for confounders, which might suggest rarefaction of retinal vasculature associated with high myopia. |
| Li et al. (2017) | FD_SVP, FD_DVP | Zeiss HD-OCT with Angioplex; Carl Zeiss Meditec, Oberkochen, Germany | Annular zone 0.6–2.5 mm in diameter. The annular zone was further divided into 4 quadrantal zones called the superior temporal, inferior temporal, superior nasal, and inferior nasal. The annular zone was also divided into 6 thin annuli with width ~0.16 mm denoted C1-C6. | Box-counting using Benoit Pro 2.0 (TruSoft International Inc., St Petersburg, FL, USA) | The FD of the superficial and deep microvascular networks were significantly decreased in the myopia group in comparison to the controls. |
| Lim et al. (2009) | FDt | Digital retinal camera (TRC 50-VT; Topcon, Tokyo, Japan), FOV not stated | Circular region of 3.5 disc diameters centered at the OD. | Box-counting method using IRIS-Fractal | Retinal vascular FD was not associated with incident early DR in the sample of children/adolescents with type 1 diabetes. |
| Lim et al. (2017) | FDa/v, cTORTa/v, BCa/v, BAa/v | 45° digital retinal camera (Canon CR-DGi with a 10D SLR digital camera backing; Canon, Tochigiken, Japan) | Circular region of 0.5–2.0 disc diameters from the disc margin. | Box-counting using SIVA | Larger venular FDs were associated with increased likelihood of DR incidence. |
| Olsen et al. (2015) | FDt | Optos 200Tx (Optos plc, Dunferm-line, Scotland, UK) | Circular region of 0.5–2.0 disc diameters from disc margin. | Box-counting using SIVA | Correlation found between lower FD and presence of diabetic neuropathy. |
| Remond et al. (2019) | AVR, CRVE, CRAE, TORTa/v, FDa/v (multifractal: capacity, information, correlation) | 45° digital retinal camera (TRC 50 IX; Topcon, Tokyo, Japan) | Circular region of 0.5–2.0 disc diameters from disc margin. | Fractal parameters calculated using VAMPIRE | Fractal dimension D0a was significantly higher in the NAION group compared to the control group but did not change significantly at different disease stages. |
| Tang et al. (2017) | FAZ area, vessel density, FD_DCP | Triton DRI-OCT; Topcon, Inc., Tokyo, Japan | Whole area permitted by 3 × 3 mm scan centered on the fovea. | Box-counting using customized MATLAB program | DR severity had the most impact on the RVPs and was found to be associated with lower FD. |
| Tang et al. (2020) | FAZ area, FAZ circularity, total vessel density, parafoveal vessel density, FD_SCP, vessel diameter index | Triton DRI-OCT; Topcon, Inc., Tokyo, Japan | Whole area permitted by 3 × 3 mm scan centered on the fovea. | Box-counting using customized MATLAB program | DR severity was found to be associated with lower FD. |
| Ting et al. (2017) | Capillary density index, FD_SVP, FD_DVP | Swept-source OCT (Topcon Corp) | Whole area permitted by 3 × 3 mm scan centered on the fovea. | Box-counting after binarization with ImageJ | FD was positively correlated with worsening DR severity. |
| Tzaridis et al. (2019) | Vessel density, skeleton density, FD_SVP, FD_DVP | PLEX Elite 9000; Carl Zeiss Meditec, Dublin, CA, USA | Annular region was defined between 0.9 and 2.4 diameter circles centered on the fovea. The annular region was then divided into four quadrants by two diagonal perpendicular lines. Fractal analysis were conducted in the rightmost quadrant called the temporal parafovea. | Box-counting with FracLac | FD in the temporal parafovea of the deep retinal plexus showed a progressive decrease in all disease stages. A significant decrease in FD was also found for the deep plexus nasal sector for advanced and neovascular stages. In the superficial plexus, FD was significantly decreased in the temporal parafovea in the advanced and neovascular stages but did not differ from controls in the early stages. |
| Wu et al. (2013) | BAa/v, TORTa/v, FDt | 45° digital retinal camera (Canon CR-DGi with a 10D SLR digital camera backing; Canon, Tokyo, Japan) | Circular region of 0.5–2.0 disc diameters from the disc margin. | Box-counting using SIVA | Eyes with glaucoma had significantly lower FD. Similarly, eyes with ocular hypertension had significantly lower FD. FD was also lower in eyes with higher IOP. |
| Xu et al. (2020) | Vessel density, skeleton density, vessel diameter index, FD, FAZ area, retinal vessel caliber (calculated for both superficial and deep retinal layers) | Optovue RTVue XR Avanti; Optovue Inc., Fremont, CA, USA | Whole area permitted by 6x6 mm scan centered on the fovea. | Box-counting method with Fractalyse | FD of the SRL and DRL showed significant reduction when comparing hypertensive eyes with controls. |
| Yang et al. (2016) | FDt, FD_SVP, FD_DVP. All repeated with separation of large from micro vessels | Optovue RTVue XR Avanti; Optovue Inc., Fremont, CA, USA | Annular zone of 0.6–2.5 mm in diameter. The annular zone was further divided into four quadrantal zones called the superior temporal, inferior temporal, superior nasal, and inferior nasal. The annular zone was also divided into 6 thin annuli with width ~0.16 mm denoted C1-C6. | Box-counting method using Benoit fractal analysis toolbox (TruSoft Internation, Inc., St. Petersburg, FL, USA) | Densities in six annular zones and four quadrantal zones of the superficial, deep, and whole retinal layers were significantly lower in highly myopic subjects compared to controls. |
| Zahid et al. (2016) | FD_SCP, FD_DCP, vessel density | Optovue RTVue XR Avanti; Optovue Inc., Fremont, CA, USA | Whole area permitted by 3 × 3 mm scan centered on the fovea. | Box-counting method with Fractalyse | The average FD for diabetic eyes was significantly lower than control eyes for the superficial and deep capillary plexuses. |
| Disease | Authors (Year) | No. of Cases | No. of Normals | Mean (SD) FD—Cases | Mean (SD) FD—Normals | Effect Size (SE) | Summary Effect Size (SE) and 95% C.I. |
|---|---|---|---|---|---|---|---|
| DR | Avakian et al. (2002) | 5 | 4 | 1.41 (0.02) | 1.46 (0.02) | −0.05 (0.0134) | −0.00269 (0.0088) [−0.0441, −0.0097] |
| Bhardwaj et al. (2018) | 35 | 26 | 1.581 (0.0763) | 1.664 (0.0546) | −0.083 (0.0161) | ||
| Cheung et al. (2009) | 137 | 592 | 1.4676 (0.01) | 1.4598 (0.02) | 0.0078 (0.0018) | ||
| Cheung et al. (2012) | 262 | 2648 | 1.4053 (0.0412) | 1.4054 (0.0421) | −0.0001 (0.0027) | ||
| Hirano et al. (2019) | 36 | 16 | 1.482 (0.0341) | 1.534 (0.010) | −0.052 (0.0087) | ||
| Kostic et al. (2018) | 15 | 12 | 1.35 (0.03) | 1.42 (0.03) | −0.07 (0.0116) | ||
| Kunicki et al. (2009) | 5 | 28 | 1.462 (0.021) | 1.470 (0.025) | −0.008 (0.0119) | ||
| Lakshminarayanan et al. (2002) | 10 | 29 | 1.623 (0.0232) | 1.586 (0.0760) | 0.037 (0.0246) | ||
| Ting et al. (2017) | 41 | 9 | 1.5899 (0.06) | 1.54 (0.0546) | 0.0499 (0.0218) | ||
| Zahid et al. (2016) | 8 | 29 | 1.5815 (0.0565) | 1.6785 (0.0588) | −0.097 (0.0233) | ||
| DM | Cheung et al. (2012) | 667 | 2163 | 1.4063 (0.0439) | 1.402 (0.0419) | 0.0043 (0.0019) | −0.0118 (0.0171) [−0.0453, 0.0218] |
| Kostic et al. (2018) | 20 | 12 | 1.39 (0.02) | 1.42 (0.03) | −0.03 (0.0088) | ||
| Myopia | Al-Sheikh et al. (2017) | 28 | 20 | 1.587 (0.0385) | 1.609 (0.0209) | −0.022 (0.0095) | −0.0176 (0.0053) [−0.0279, −0.0073] |
| Azemin et al. (2014) | 41 | 41 | 1.5588 (0.0142) | 1.5666 (0.0160) | −0.0078 (0.0033) | ||
| Li et al. (2010) | 281 | 1380 | 1.437 (0.0255) | 1.444 (0.0189) | −0.007 (0.0013) | ||
| Li et al. (2017) | 20 | 20 | 1.705 (0.0603) | 1.75 (0.0156) | −0.045 (0.0139) | ||
| Yang et al. (2016) | 21 | 24 | 1.783 (0.014) | 1.809 (0.008) | −0.026 (0.0033) | ||
| Hypertension | Cheung et al. (2012) | 1949 | 963 | 1.404 (0.0441) | 1.4082 (0.0465) | −0.0042 (0.0018) | −0.0054 (0.0036) [−0.0125, 0.0017] |
| Xu et al. (2020) | 77 | 43 | 1.6895 (0.0689) | 1.706 (0.0346) | −0.0165 (0.0112) | ||
| Glaucoma | Cheung et al. (2012) | 72 | 2841 | 1.4067 (0.0433) | 1.4054 (0.0426) | 0.0013 (0.0051) | −0.0049 (0.0191) [−0.0423, 0.0324] |
| Lakshminarayanan et al. (2002) | 25 | 29 | 1.694 (0.0229) | 1.669 (0.0309) | 0.025 (0.0075) | ||
| Wu et al. (2013) | 123 | 2666 | 1.37 (0.10) | 1.41 (0.04) | −0.04 (0.0041) |
Publisher’s Note: MDPI stays neutral with regard to jurisdictional claims in published maps and institutional affiliations. |
© 2021 by the authors. Licensee MDPI, Basel, Switzerland. This article is an open access article distributed under the terms and conditions of the Creative Commons Attribution (CC BY) license (http://creativecommons.org/licenses/by/4.0/).
Share and Cite
Yu, S.; Lakshminarayanan, V. Fractal Dimension and Retinal Pathology: A Meta-Analysis. Appl. Sci. 2021, 11, 2376. https://doi.org/10.3390/app11052376
Yu S, Lakshminarayanan V. Fractal Dimension and Retinal Pathology: A Meta-Analysis. Applied Sciences. 2021; 11(5):2376. https://doi.org/10.3390/app11052376
Chicago/Turabian StyleYu, Sam, and Vasudevan Lakshminarayanan. 2021. "Fractal Dimension and Retinal Pathology: A Meta-Analysis" Applied Sciences 11, no. 5: 2376. https://doi.org/10.3390/app11052376
APA StyleYu, S., & Lakshminarayanan, V. (2021). Fractal Dimension and Retinal Pathology: A Meta-Analysis. Applied Sciences, 11(5), 2376. https://doi.org/10.3390/app11052376