DyEgoVis: Visual Exploration of Dynamic Ego-Network Evolution
Abstract
:1. Introduction
- An ego-network embedding model. Based on topological features and node attributes, the model constructs feature vectors (i.e., embeddings) for both dynamic ego-networks and their snapshots. The feature vectors are projected onto the corresponding 2D views where evolution patterns of the dynamic ego-networks can be revealed by clusters or outliers. Note that a feature vector is actually a representation of the evolution patterns of the corresponding dynamic ego-network.
- A layout method for dynamic ego-networks. Different from the classic small multiples layout, our layout can help users effectively track, compare and analyze the changes in ego-alter relationships of dynamic ego-networks.
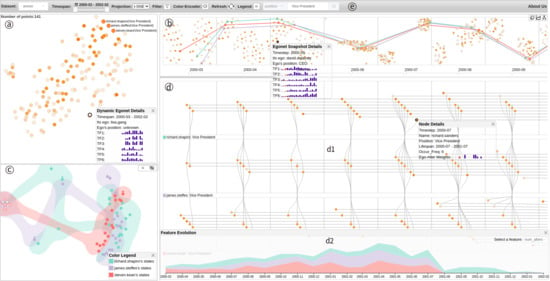
- An interactive visualization system. Integrating the ego-network embedding model and the effective layout method, the system can help users interactively explore, compare and analyze dynamic ego-network evolution. We demonstrate its usability and effectiveness through two real-world datasets. The system’s source code and demo video are available at https://github.com/datavis-ai/DyEgoVis (accessed on 26 February 2021).
2. Related Work
2.1. Dynamic Network Visualization
2.2. Dynamic Ego-Network Visualization
3. Task Analysis
- T1: Get the whole picture of dynamic ego-networks’ evolution patterns in an overview view. Through this view, users can understand the overall evolution patterns of dynamic ego-networks and find similar or abnormal dynamic ego-networks.
- T2: Explore the distributions of dynamic ego-networks along the timeline. Are there similar or abnormal states (snapshots) at each timestep? Are there any clusters? If so, how do these clusters evolve over time? Do they merge, split or disappear?
- T3: Analyze the evolutions of all dynamic ego-networks in the specified timespan. During this timespan, how do dynamic ego-networks evolve? Which dynamic ego-networks have similar evolution patterns?
- T4: Summarize all evolution states of the selected dynamic ego-networks in an overview view. From this view, users can quickly find similar or abnormal states without having to inspect them one by one along the timeline.
- T5: Compare and analyze changes in the properties of the selected dynamic ego-networks. How do their properties change over time? Do they increase, decrease or keep stable?
- T6: Visualize the overall structure of each dynamic ego-network. How should each snapshot be laid out to allow users to track and analyze one-level and two-level alters?
- T7: Analyze changes in the number of alters. How does the number of one- or two-level alters evolve? Do they increase, decrease or remain? Are there any peaks or valleys? If so, what are the causes?
- T8: Investigate the specified alter. How long is its lifespan? When does it appear, disappear and reappear? How long does it appear consecutively? How long does it disappear? Why does it disappear?
- T9: Explore the transition between one-level and two-level alters. Will a two-level alter become a one-level alter? If so, what does this mean? What about the other way around?
- T10: Analyze the strength of the specified ego-alter relationship. How does it change? Are there any peaks or valleys? If so, what does this mean?
- T11: Compare alters of the selected dynamic ego-networks. Are there common alters between two dynamic ego-networks at each timestep?
System Overview
4. Visual Design and Implementation
4.1. Ego-Network Embedding
- TF1: number of the ego u’s one-level alters.
- TF2: number of edges between one-level alters.
- TF3: clustering coefficient of the ego-network, computed as .
- TF4: average weight of edges (i.e., ego-alter edges) between the ego u and one-level alters, computed as , where is an ego-alter edge and indicates ’s weight.
- TF5: number of the ego u’s two-level alters.
- TF6: average degree of one-level alters, computed as , where is the degree of node i.
4.2. User Interface
4.2.1. Dynamic Ego-Network Embedding View
4.2.2. Snapshot Embedding View
4.2.3. State View
 to icon
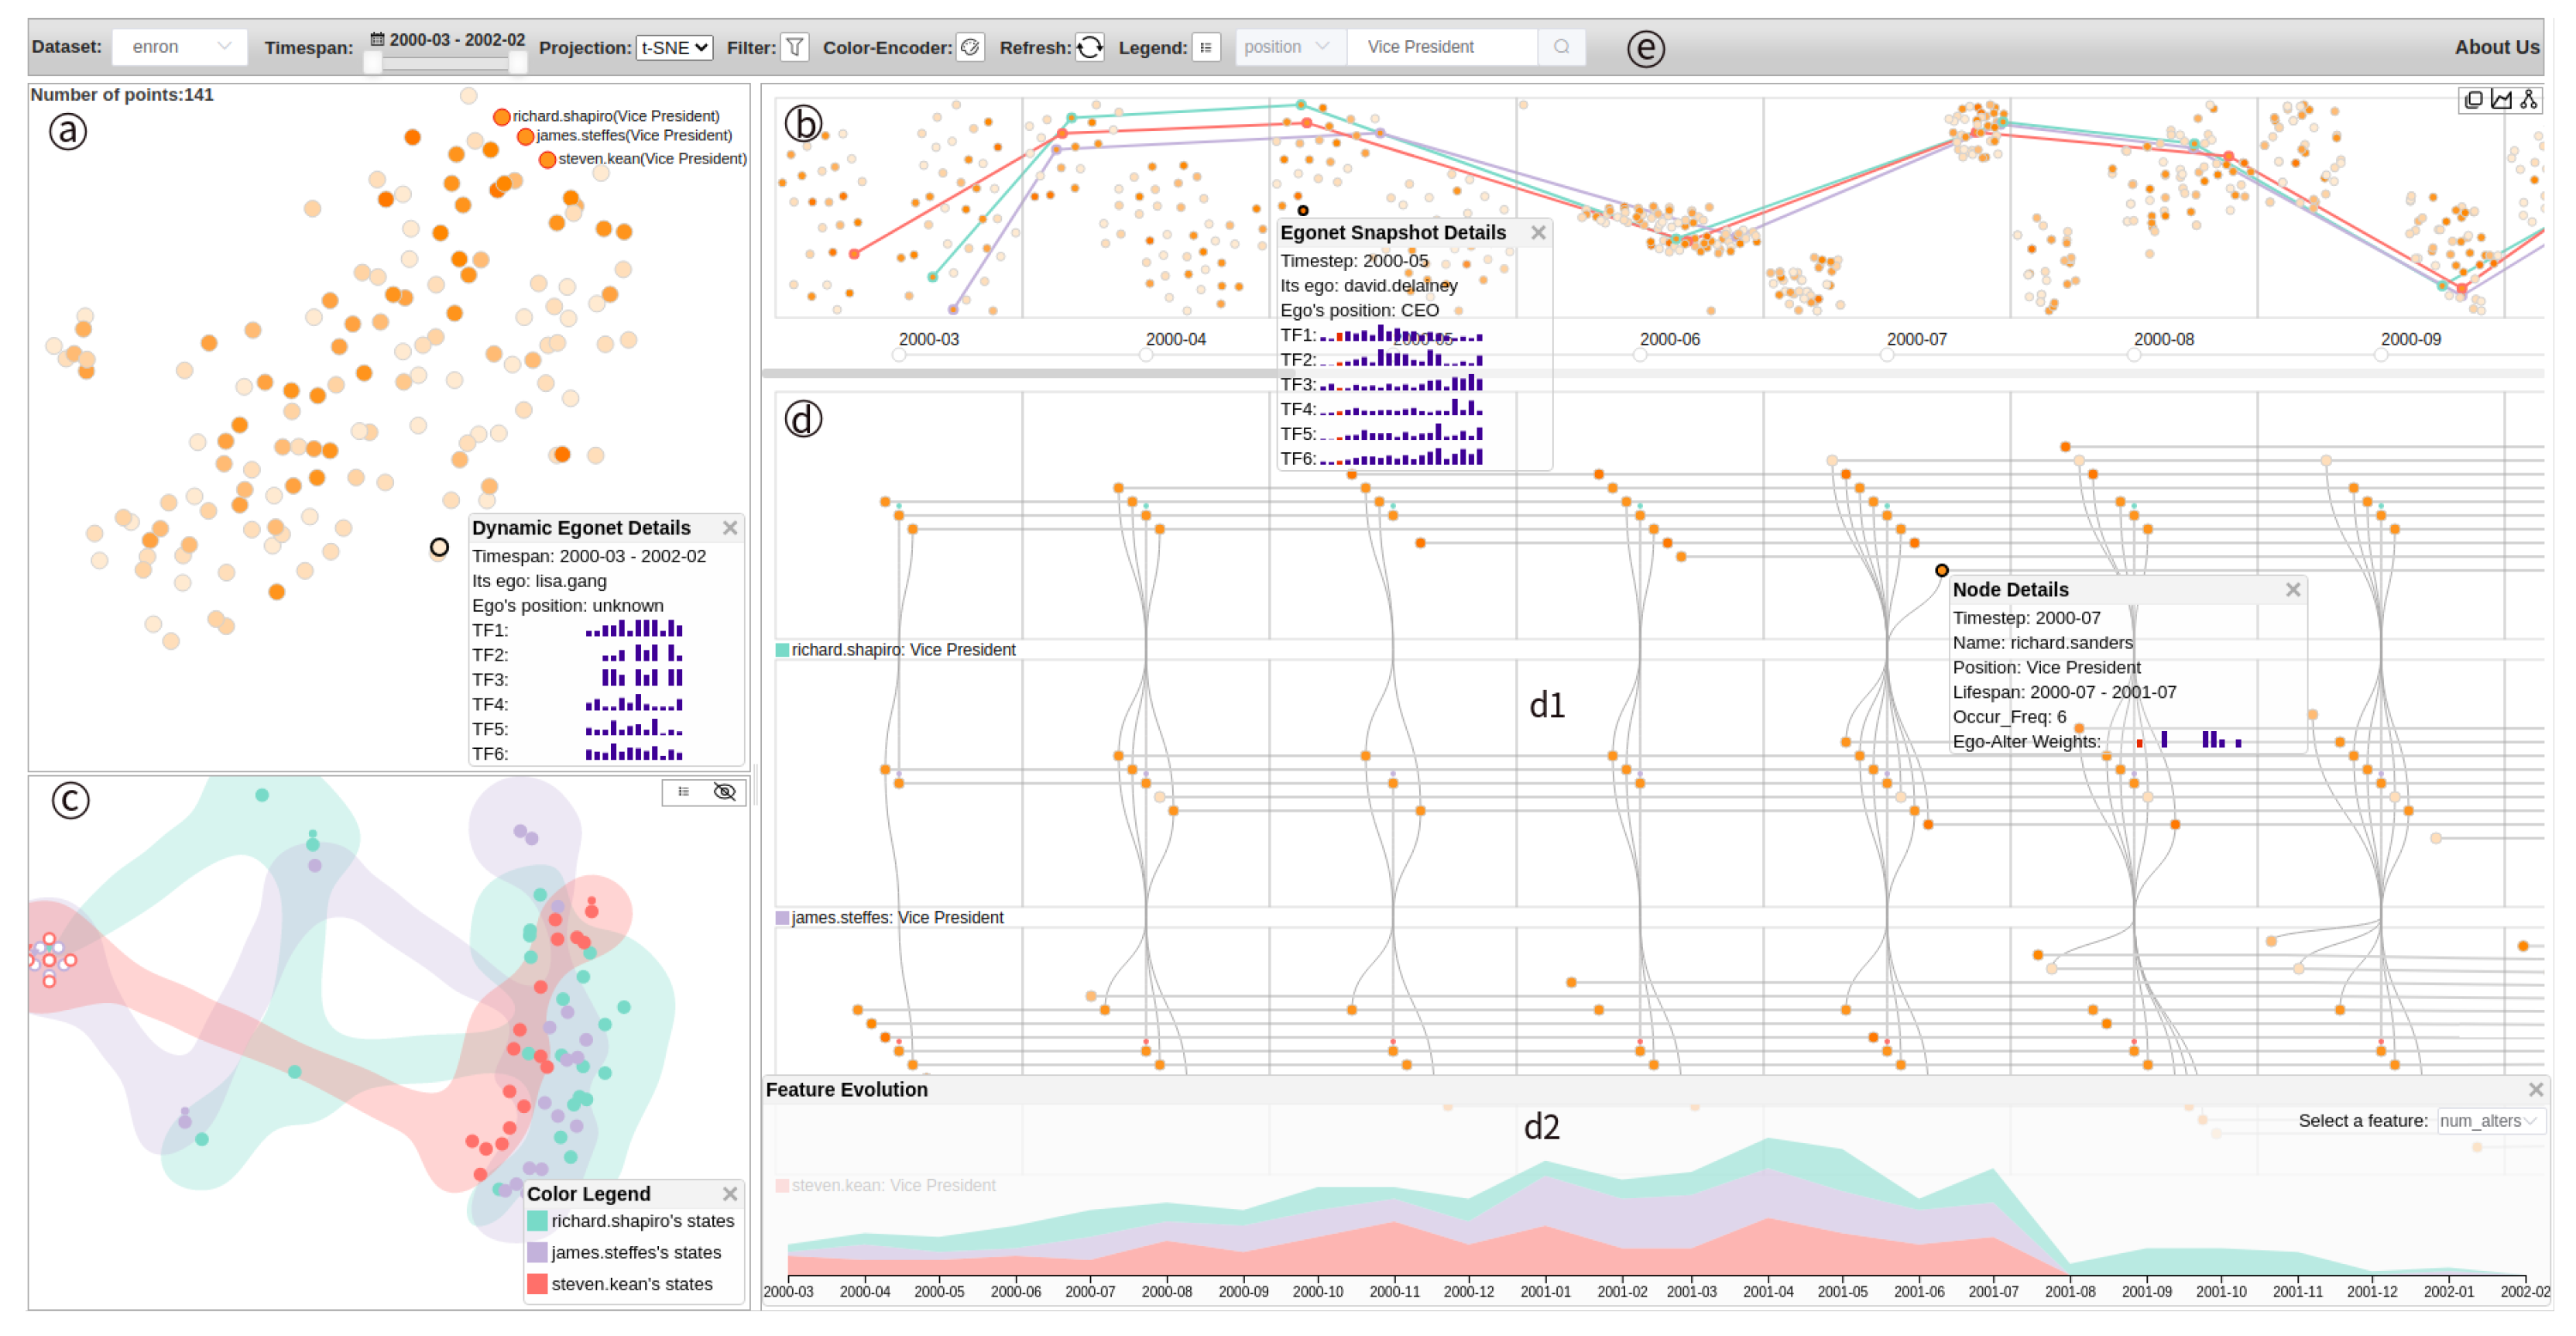
  in the upper right corner, all points of each dynamic ego-network are connected by lines with the corresponding colors along timesteps. Note that the points with circle dots at their top indicate the starting states while the ones with inverted triangles are the ending states. When the user hovers over a point, its previous state and next state are highlighted. Besides, the user can right-click on a point to see its details and click points of interest to locate the corresponding snapshots in dynamic ego-network view (Figure 3(b,d1)).
4.2.4. Dynamic Ego-Network View
 in the upper right corner in Figure 3b. The user can click the icon
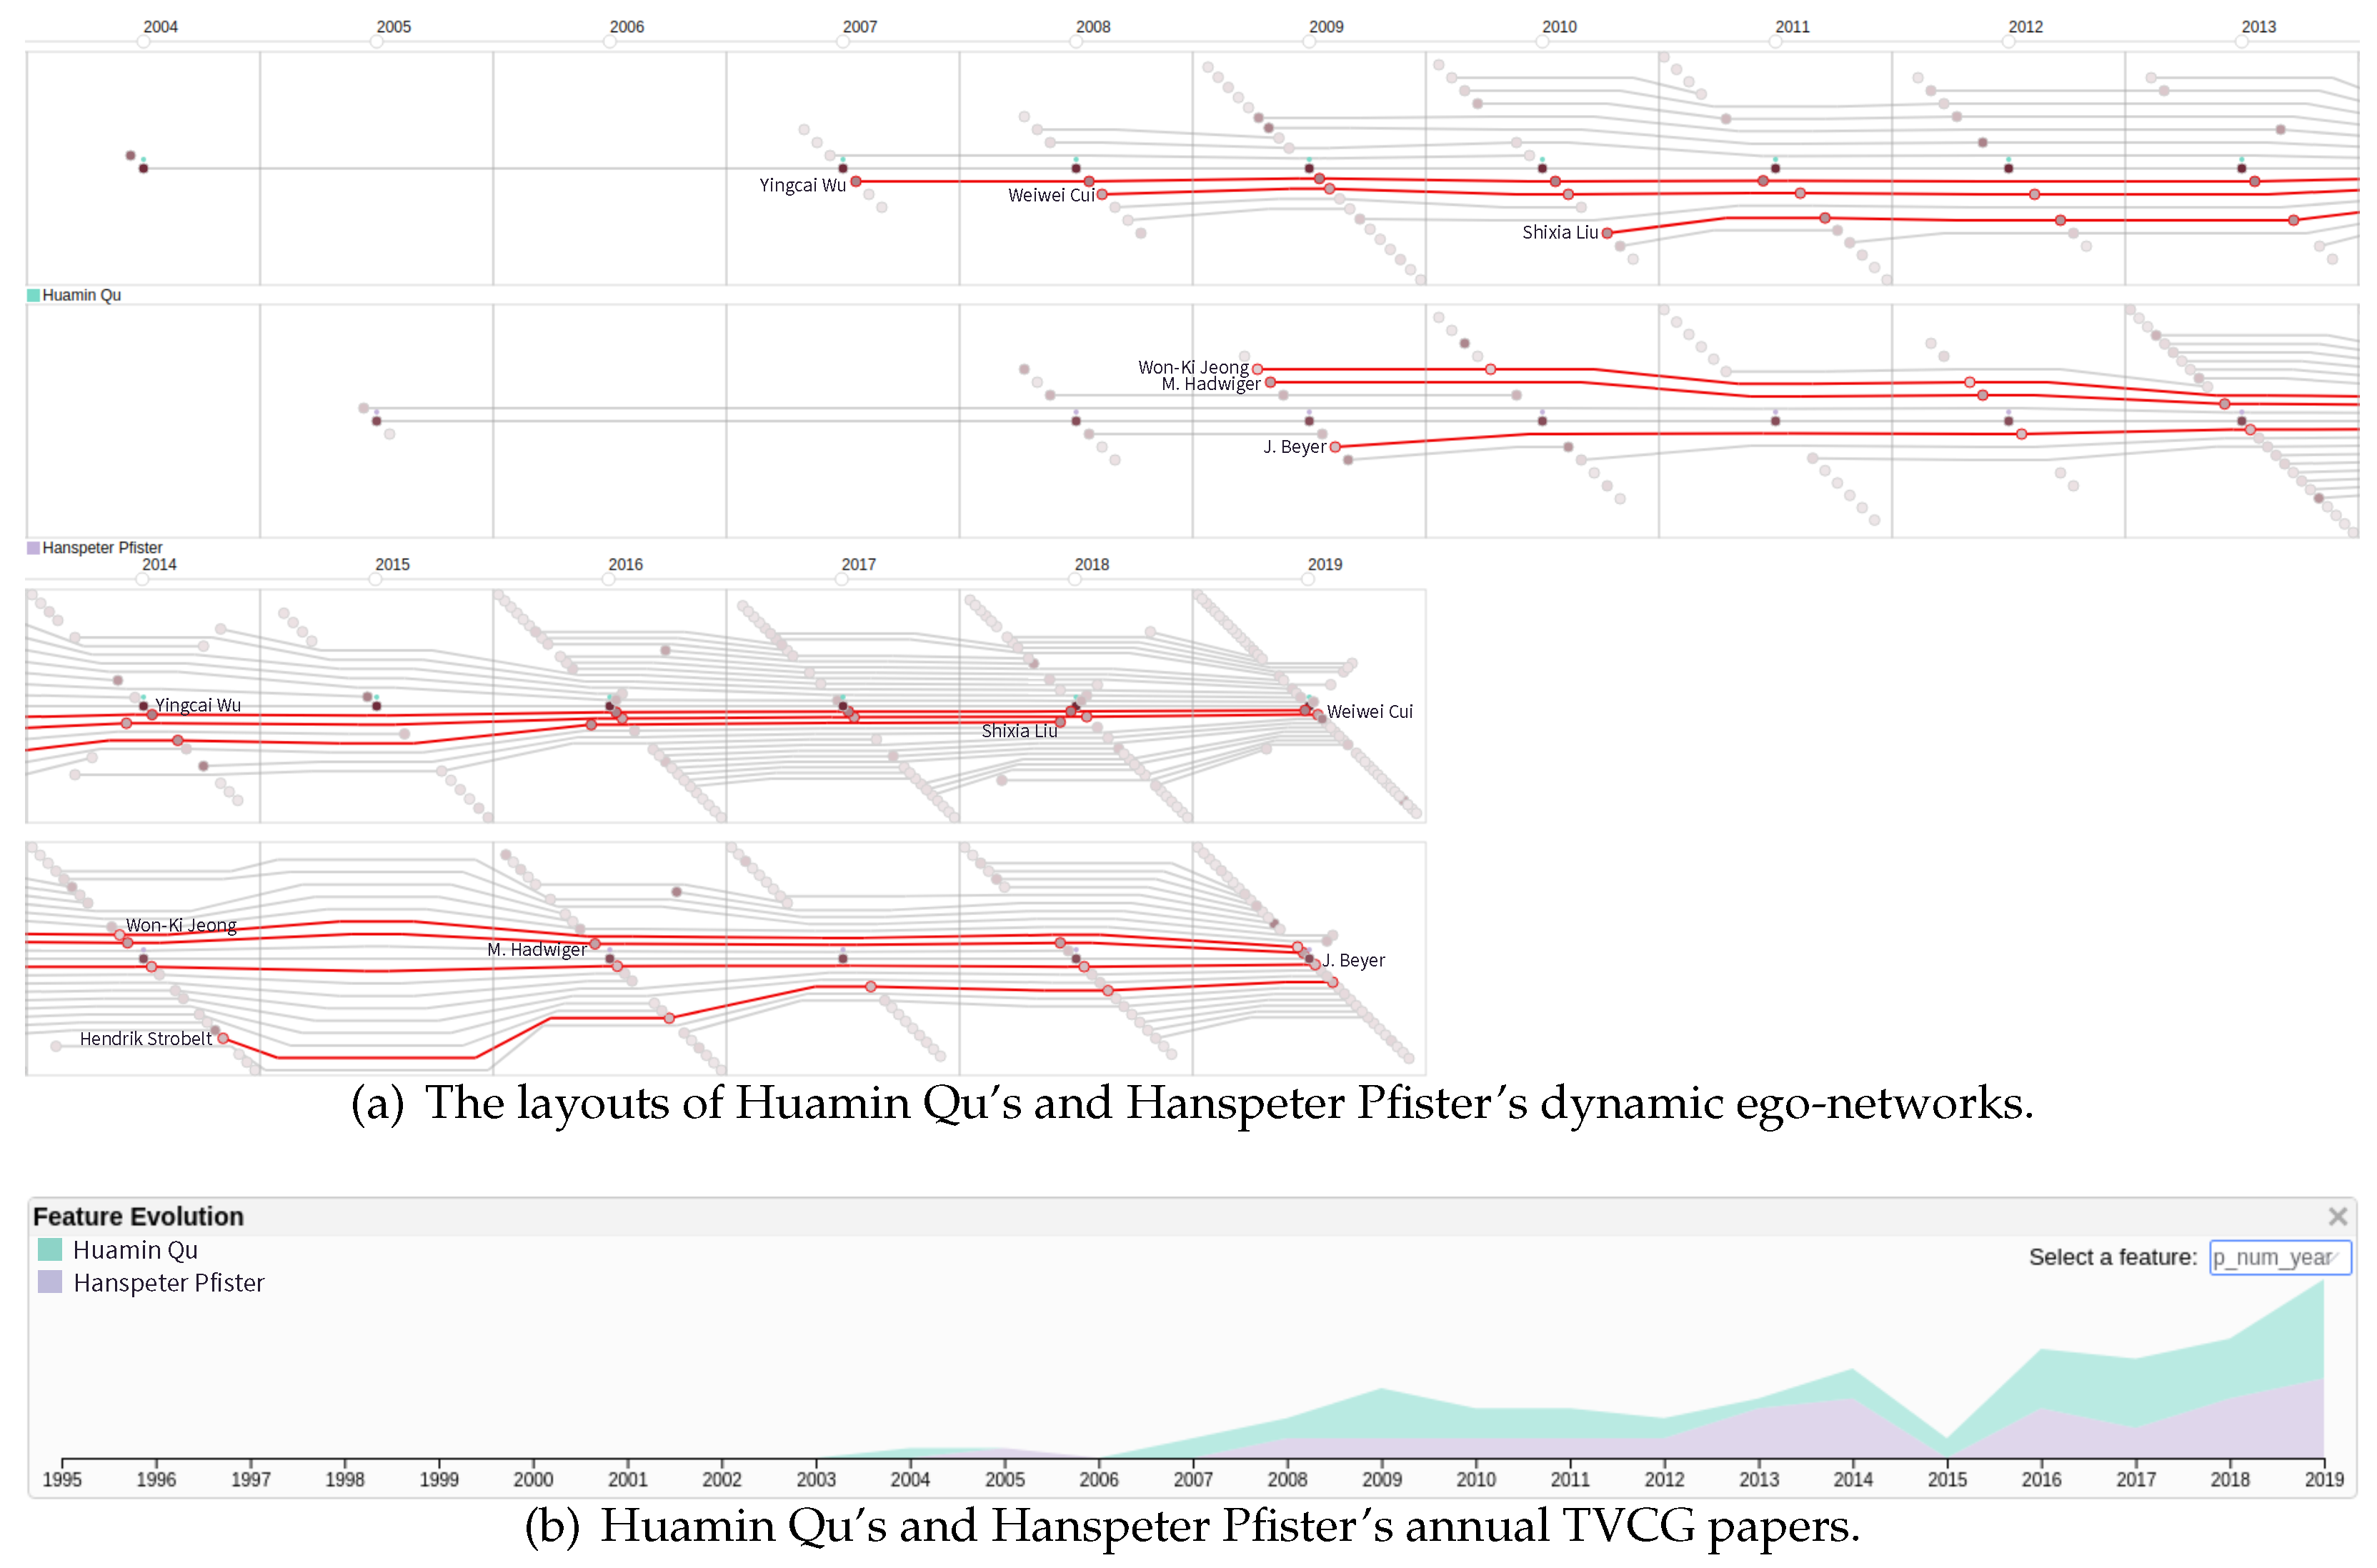
  to decide whether to display two-level alters. To support task T5, we designed a feature evolution panel as shown in Figure 3(d2). This panel can be opened by clicking the icon
  . It adopts a stacked area chart to visualize the evolution of the specified feature of each selected dynamic ego-network. Note that when the user drags the timeline, both the snapshot embedding view and the dynamic ego-network view will move along with the timeline.
| Algorithm 1: Layout of a dynamic ego-network |
 |
4.2.5. Toolbar
 ). As shown in Figure 5, the user can click the filter icon
  to pop up the filter settings dialog and then set the value interval of each feature to filter data. The user can select a color scheme from the color encoder to encode the selected attribute online. The user can also use the search box to search for target nodes and then explore the dynamic ego-networks of nodes of interest.
5. Case Studies
5.1. Enron Email Network
 to encode employees’ positions. The higher the position of an employee is, the darker the color of the corresponding node (or point) is. In this case study, one-level alters are more meaningful than two-level alters, so we show only one-level alters in the dynamic ego-network view.
 (T3). We select t-SNE as our project method and then click the refresh icon
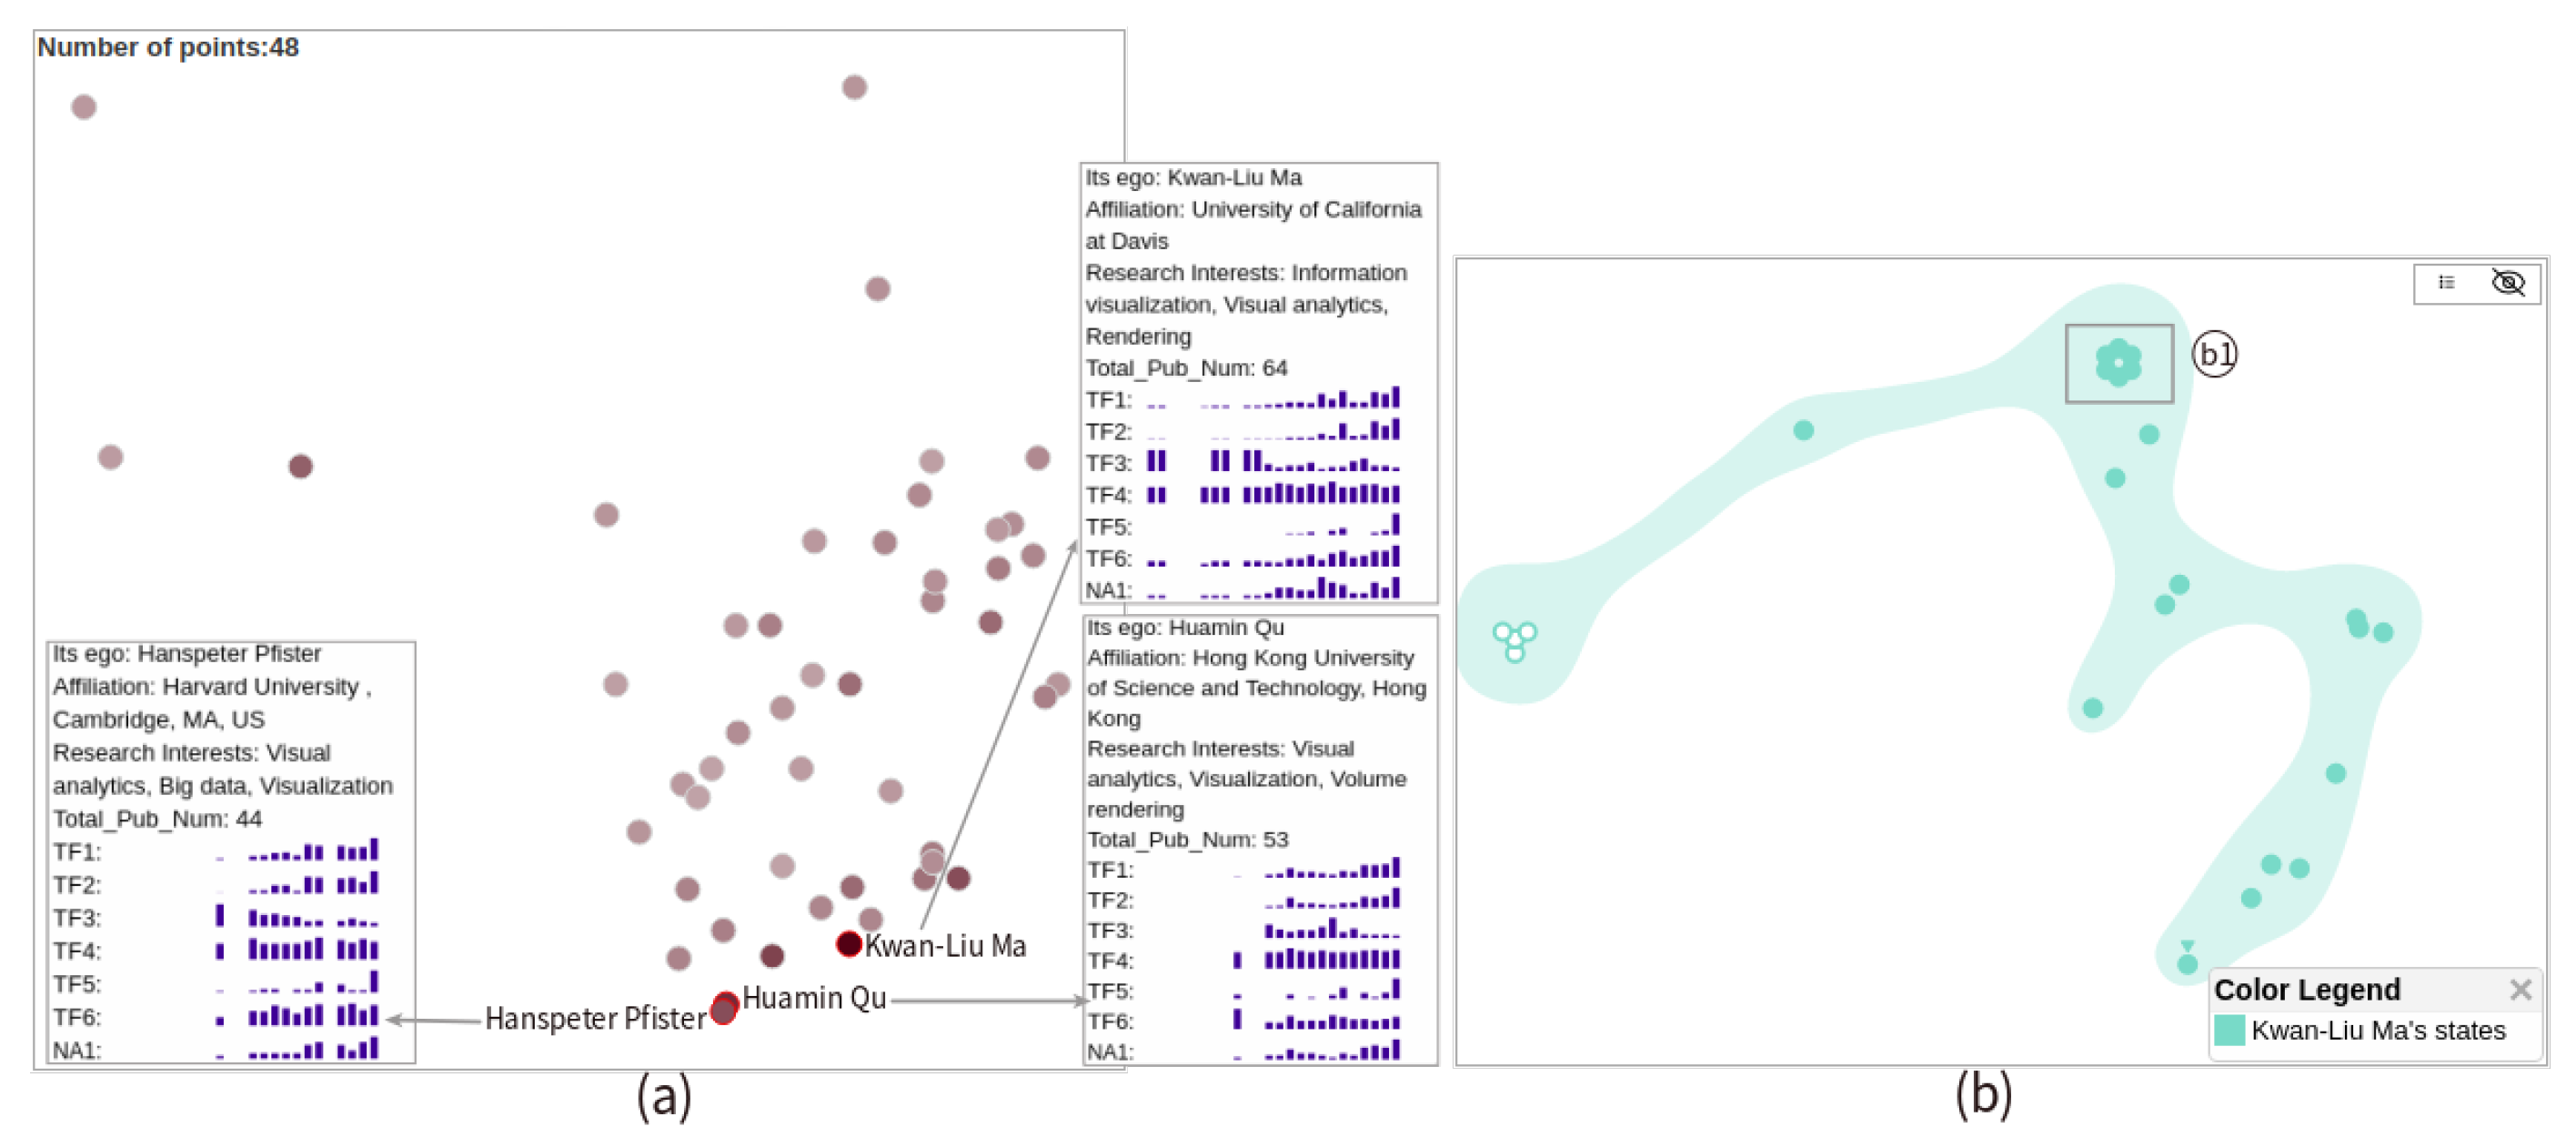
  to reload the data of the current timespan. The embedded results (points) of the dynamic ego-networks of 141 employees (as egos) are shown in Figure 6a. There is a small cluster (a1) in the view. Through examining the details of each point in this cluster, we find they have similar sparse feature sequences, as shown at the bottom in the view. This evolution pattern reveals that their egos did not communicate frequently with others between July 2000 and February 2002 (T1). Next, we want to investigate Enron’s senior executives. With the help of the system’s search box, we find the four CEOs: Kenneth Lay (founder of Enron), Jeff Skilling (second in command of Enron), David Delainey (CEO of Enron North America) and John Lavorato (CEO of Enron America). However, the embedded results of their dynamic ego-networks (highlighted in red) are far away from each other (Figure 6a). This means that their dynamic ego-networks have different evolution patterns (T1). In addition, this can reflect that these CEOs play different roles in the company’s decision-making.
5.2. TVCG Co-Authorship Network
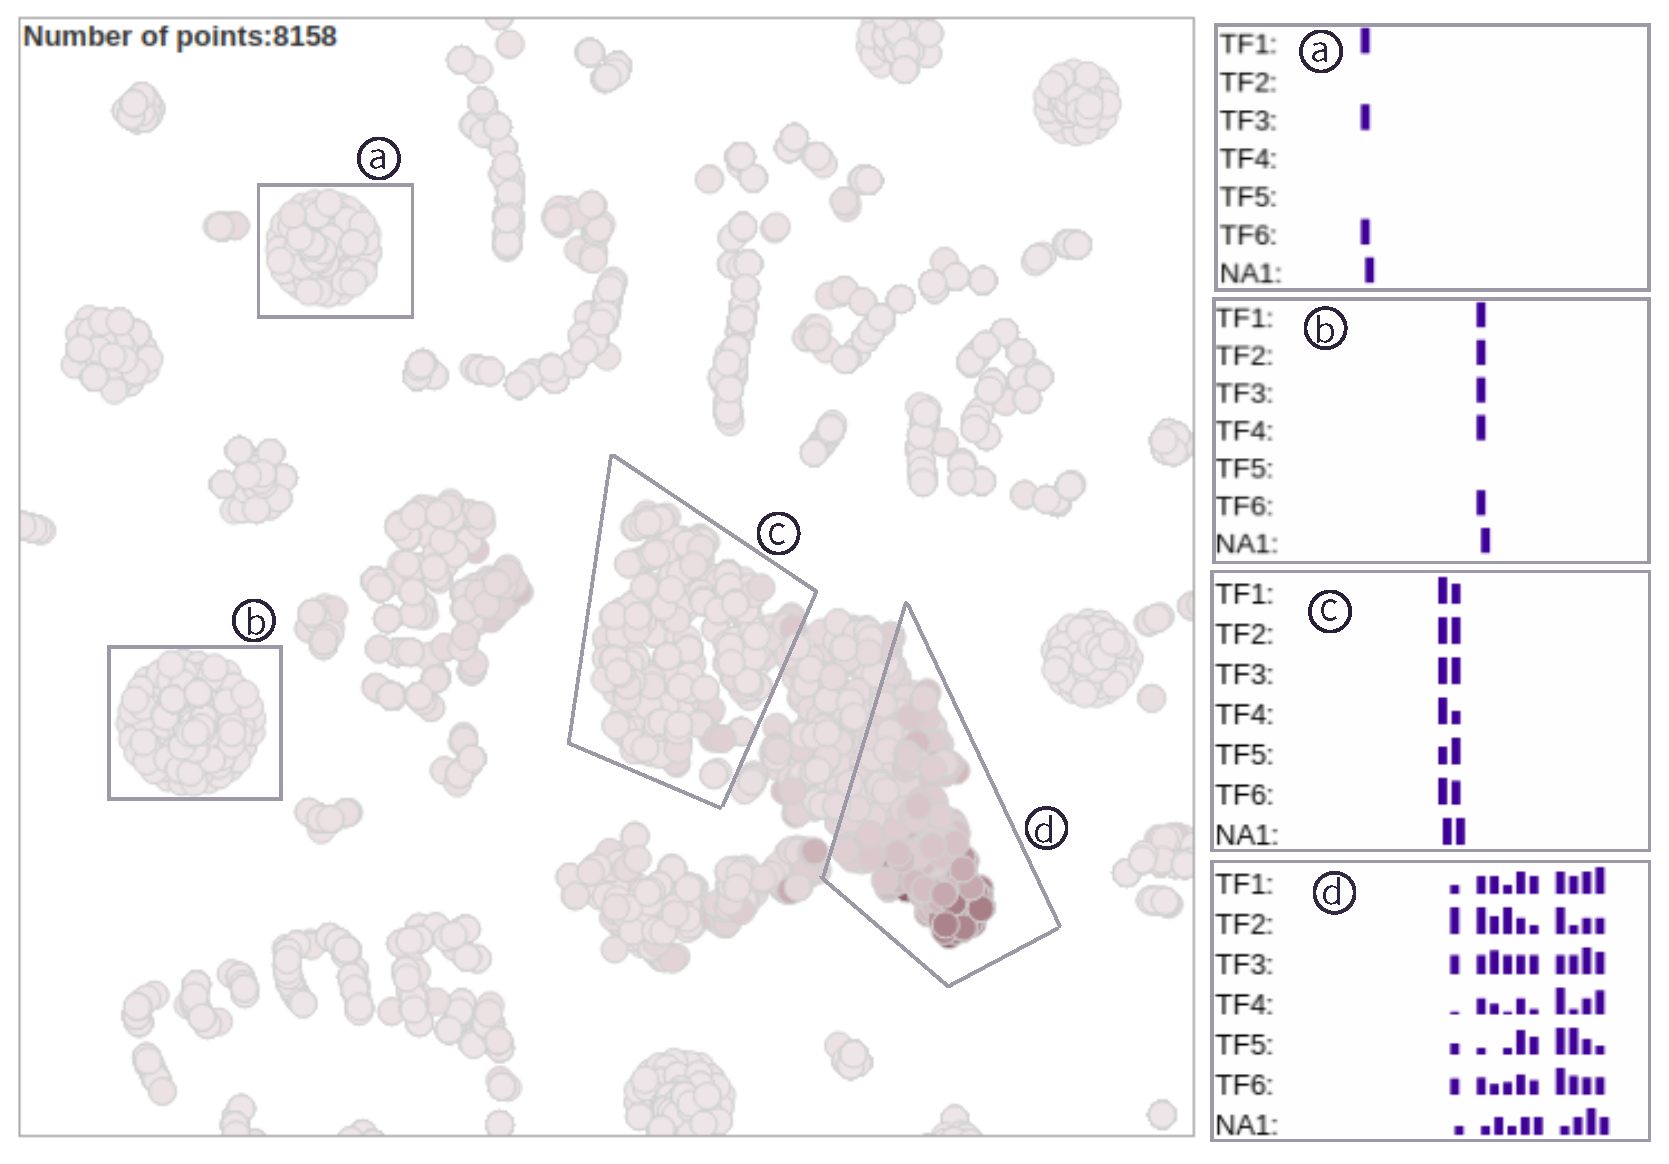
 is used to encode the total number of TVCG papers of each author. The more TVCG papers an author (or ego) has, the darker the corresponding node (or point) is. In this case study, we consider one-level and two-level alters so that we can explore the changes in ego-alter relationships. The embedded results (points) of the dynamic ego-networks of 8158 authors (as egos) are shown in Figure 9. There are many clusters in the view. We choose four dense clusters (a, b, c, d) to explore the corresponding evolution patterns. The general feature sequences of each cluster are shown on the right in Figure 9. Each group of feature sequences, as an interpretation of the corresponding cluster, can reveal the common evolution pattern of dynamic ego-networks in the cluster (T1). In clusters a and a, each dynamic ego-network has only one snapshot and the ego of each dynamic ego-network only published a TVCG paper. Through comparing their feature TF1, we find that each ego in cluster a has only a coauthor while each ego in cluster b has two co-authors. In cluster c, each ego typically published two TVCG papers within five years and each of the two papers has more than two co-authors. Therefore, we infer that almost all the egos in clusters a, b and c were students. In cluster d, each dynamic ego-network has continuous multiple ego-network snapshots, which means each ego has published papers in TVCG for multiple years. Most of the egos in cluster d are long-term visualization researchers who have higher publication performance. They have a more significant impact on the field of visualization.
6. Discussion and Future Work
7. Conclusions
Author Contributions
Funding
Acknowledgments
Conflicts of Interest
References
- Chung, K.; Hossain, L.; Davis, J. Exploring Sociocentric and Egocentric Approaches for Social Network Analysis. In Proceedings of the 2005 International Conference on Knowledge Management, Wellington, New Zealand, 27–28 October 2005. [Google Scholar]
- Zhao, J.; Glueck, M.; Chevalier, F.; Wu, Y.; Khan, A. Egocentric analysis of dynamic networks with egolines. In Proceedings of the 2016 CHI Conference on Human Factors in Computing Systems, San Jose, CA, USA, 7–12 May 2016; pp. 5003–5014. [Google Scholar]
- Lei, S.; Chen, W.; Zhen, W.; Huamin, Q.; Chuang, L.; Qi, L. 1.5D Egocentric Dynamic Network Visualization. IEEE Trans. Vis. Comput. Graph. 2015, 21, 624–637. [Google Scholar]
- Wu, Y.; Pitipornvivat, N.; Zhao, J.; Yang, S.; Huang, G.; Qu, H. egoslider: Visual analysis of egocentric network evolution. IEEE Trans. Vis. Comput. Graph. 2015, 22, 260–269. [Google Scholar] [CrossRef]
- Kikas, R.; Dumas, M.; Karsai, M. Bursty egocentric network evolution in Skype. Soc. Netw. Anal. Min. 2013, 3, 1393–1401. [Google Scholar] [CrossRef] [Green Version]
- Shneiderman, B. The eyes have it: A task by data type taxonomy for information visualizations. In The Craft of Information Visualization; Elsevier: Amsterdam, The Netherlands, 2003; pp. 364–371. [Google Scholar]
- Beck, F.; Burch, M.; Diehl, S.; Weiskopf, D. A Taxonomy and Survey of Dynamic Graph Visualization. Comput. Graph. Forum 2017, 36, 133–159. [Google Scholar] [CrossRef]
- Hadlak, S.; Schumann, H.; Schulz, H.J. A Survey of Multi-faceted Graph Visualization. In Proceedings of the 17th Eurographics Conference on Visualization, EuroVis 2015 - State of the Art Reports, Cagliari, Sardinia, Italy, 25–29 May 2015. [Google Scholar]
- Kerracher, N.; Kennedy, J.; Chalmers, K. A Task Taxonomy for Temporal Graph Visualisation. IEEE Trans. Vis. Comput. Graph. 2015, 21, 1160–1172. [Google Scholar] [CrossRef]
- Eades, P.; Huang, M. Navigating Clustered Graphs Using Force-Directed Methods. J. Graph Algorithms Appl. 2000, 4, 157–181. [Google Scholar] [CrossRef] [Green Version]
- Yee, K.; Fisher, D.; Dhamija, R.; Hearst, M.A. Animated exploration of dynamic graphs with radial layout. In Proceedings of the IEEE Symposium on Information Visualization 2001 (INFOVIS’01), San Diego, CA, USA, 22–23 October 2001. [Google Scholar]
- Bach, B.; Pietriga, E.; Fekete, J.D. GraphDiaries: Animated Transitions andTemporal Navigation for Dynamic Networks. IEEE Trans. Vis. Comput. Graph. 2014, 20, 740–754. [Google Scholar] [CrossRef]
- Crnovrsanin, T.; Shilpika; Chandrasegaran, S.; Ma, K.L. Staged Animation Strategies for Online Dynamic Networks. IEEE Trans. Vis. Comput. Graph. 2021, 27, 539–549. [Google Scholar] [CrossRef]
- Hong, S.; Eades, P.; Torkel, M.; Huang, W.; Cifuentes, C. Dynamic Graph Map Animation. In Proceedings of the 2020 IEEE Pacific Visualization Symposium, PacificVis 2020, Tianjin, China, 3–5 June 2020. [Google Scholar] [CrossRef]
- Elzen, S.V.D.; Wijk, J.V. Small Multiples, Large Singles: A New Approach for Visual Data Exploration. Comput. Graph. Forum 2013, 32, 191–200. [Google Scholar] [CrossRef]
- Bach, B.; Riche, N.; Dwyer, T.; Madhyastha, T.; Fekete, J.D.; Grabowski, T. Small MultiPiles: Piling Time to Explore Temporal Patterns in Dynamic Networks. Comput. Graph. Forum 2015, 34, 31–40. [Google Scholar] [CrossRef] [Green Version]
- Wang, Y.; Archambault, D.W.; Haleem, H.; Möller, T.; Wu, Y.; Qu, H. Nonuniform Timeslicing of Dynamic Graphs Based on Visual Complexity. In Proceedings of the 30th IEEE Visualization Conference, IEEE VIS 2019 - Short Papers, Vancouver, BC, Canada, 20–25 October 2019. [Google Scholar]
- Cakmak, E.; Schlegel, U.; Jäckle, D.; Keim, D.; Schreck, T. Multiscale Snapshots: Visual Analysis of Temporal Summaries in Dynamic Graphs. IEEE Trans. Vis. Comput. Graph. 2020, 27, 517–527. [Google Scholar] [CrossRef]
- Bach, B.; Shi, C.; Heulot, N.; Madhyastha, T.M.; Grabowski, T.J.; Dragicevic, P. Time Curves: Folding Time to Visualize Patterns of Temporal Evolution in Data. IEEE Trans. Vis. Comput. Graph. 2016, 22, 559–568. [Google Scholar] [CrossRef] [Green Version]
- Elzen, S.V.D.; Holten, D.; Blaas, J.; Wijk, J.J.V. Reducing Snapshots to Points: A Visual Analytics Approach to Dynamic Network Exploration. IEEE Trans. Vis. Comput. Graph. 2015, 22, 1. [Google Scholar] [CrossRef]
- Hajij, M.; Wang, B.; Scheidegger, C.; Rosen, P. Visual Detection of Structural Changes in Time-Varying Graphs Using Persistent Homology. In Proceedings of the IEEE Pacific Visualization Symposium, PacificVis 2018, Kobe, Japan, 10–13 April 2018. [Google Scholar]
- Arendt, D.; Blaha, L.M. SVEN: Informative Visual Representation of Complex Dynamic Structure. arXiv 2014, arXiv:abs/1412.6706. [Google Scholar]
- Bach, B.; Pietriga, E.; Fekete, J.D. Visualizing Dynamic Networks with Matrix Cubes. In Proceedings of the CHI Conference on Human Factors in Computing Systems, CHI’14, Toronto, ON, Canada, 26 April–1 May 2014. [Google Scholar]
- Bach, B.; Kerracher, N.; Hall, K.; Carpendale, M.S.T.; Kennedy, J.; Riche, N. Telling Stories about Dynamic Networks with Graph Comics. In Proceedings of the 2016 CHI Conference on Human Factors in Computing Systems, San Jose, CA, USA, 7–12 May 2016. [Google Scholar]
- Burch, M.; Hlawatsch, M.; Weiskopf, D. Visualizing a Sequence of a Thousand Graphs (or Even More). Comput. Graph. Forum 2017, 36. [Google Scholar] [CrossRef]
- Pham, V.; Nguyen, V.N.; Dang, T. DualNetView: Dual Views for Visualizing the Dynamics of Networks. In Proceedings of the 11th International EuroVis Workshop on Visual Analytics, EuroVA@Eurographics/EuroVis 2020, Norrköping, Sweden, 25 May 2020. [Google Scholar]
- Rufiange, S.; McGuffin, M. DiffAni: Visualizing Dynamic Graphs with a Hybrid of Difference Maps and Animation. IEEE Trans. Vis. Comput. Graph. 2013, 19, 2556–2565. [Google Scholar] [CrossRef] [PubMed] [Green Version]
- Hadlak, S.; Schulz, H.J.; Schumann, H. In Situ Exploration of Large Dynamic Networks. IEEE Trans. Vis. Comput. Graph. 2011, 17, 2334–2343. [Google Scholar] [CrossRef]
- Lee, A.; Archambault, D.W.; Nacenta, M.A. Dynamic Network Plaid: A Tool for the Analysis of Dynamic Networks. In Proceedings of the 2019 CHI Conference on Human Factors in Computing Systems, CHI 2019, Glasgow, Scotland, UK, 4–9 May 2019. [Google Scholar]
- Reitz, F. A Framework for an Ego-centered and Time-aware Visualization of Relations in Arbitrary Data Repositories. arXiv 2010, arXiv:1009.5183. [Google Scholar]
- Farrugia, M.; Hurley, N.; Quigley, A. Exploring temporal ego networks using small multiples and tree-ring layouts. Proc. ACHI 2011, 2011, 23–28. [Google Scholar]
- Liu, Q.; Hu, Y.; Lei, S.; Mu, X.; Zhang, Y.; Jie, T. EgoNetCloud: Event-based egocentric dynamic network visualization. In Proceedings of the IEEE Conference on Visual Analytics Science & Technology, Chicago, IL, USA, 25–30 October 2015. [Google Scholar]
- Boz, H.A.; Bahrami, M.; Suhara, Y.; Bozkaya, B.; Balcisoy, S. An Exploratory Visual Analytics Tool for Multivariate Dynamic Networks. In EuroVis Workshop on Visual Analytics (EuroVA); Turkay, C., Vrotsou, K., Eds.; The Eurographics Association: Geneve, Switzerland, 2020. [Google Scholar] [CrossRef]
- Kruskal, J. Multidimensional scaling by optimizing goodness of fit to a nonmetric hypothesis. Psychometrika 1964, 29, 1–27. [Google Scholar] [CrossRef]
- Lu, B.; Zhu, M.; He, Q.; Li, M.; Jia, R. TMNVis: Visual Analysis of Evolution in Temporal Multivariate Network at Multiple Granularities. J. Vis. Lang. Comput. 2017, 43, S1045926X16301458. [Google Scholar] [CrossRef]
- He, Q.; Zhu, M.; Lu, B.; Liu, H.; Shen, Q. MENA: Visual Analysis of Multivariate Egocentric Network Evolution. In Proceedings of the International Conference on Virtual Reality & Visualization, Zhengzhou, China, 21–22 October 2017. [Google Scholar]
- Freire, M.; Plaisant, C.; Shneiderman, B.; Golbeck, J. ManyNets: An interface for multiple network analysis and visualization. In Proceedings of the 28th International Conference on Human Factors in Computing Systems, CHI 2010, Atlanta, GA, USA, 10–15 April 2010. [Google Scholar]
- Law, P.M.; Wu, Y.; Basole, R.C. Segue: Overviewing Evolution Patterns of Egocentric Networks by Interactive Construction of Spatial Layouts. In Proceedings of the 2018 IEEE Conference on Visual Analytics Science and Technology (VAST), Berlin, Germany, 21–26 October 2018. [Google Scholar]
- Ahn, J.; Plaisant, C.; Shneiderman, B. A Task Taxonomy for Network Evolution Analysis. IEEE Trans. Vis. Comput. Graph. 2014, 20, 365–376. [Google Scholar]
- Hagberg, A.; Schult, D.; Swart, P.J. Exploring Network Structure, Dynamics, and Function using NetworkX; Los Alamos National Lab. (LANL): Los Alamos, NM, USA, 2008. [Google Scholar]
- Bostock, M.; Ogievetsky, V.; Heer, J. D3 data-driven documents. IEEE Trans. Vis. Comput. Graph. 2011, 17, 2301–2309. [Google Scholar] [CrossRef]
- Berlingerio, M.; Koutra, D.; Eliassi-Rad, T.; Faloutsos, C. NetSimile: A Scalable Approach to Size-Independent Network Similarity. Comput. Sci. 2012, 12, 28. [Google Scholar]
- Pienta, R.; Hohman, F.; Endert, A.; Tamersoy, A.; Roundy, K.; Gates, C.; Navathe, S.; Chau, D.H. VIGOR: Interactive Visual Exploration of Graph Query Results. IEEE Trans. Vis. Comput. Graph. 2017, 24, 215–225. [Google Scholar] [CrossRef] [PubMed]
- Pincus, S.M. Approximate entropy as a measure of system complexity. Proc. Natl. Acad. Sci. USA 1991, 88, 2297–2301. [Google Scholar] [CrossRef] [PubMed] [Green Version]
- Wold, S.; Esbensen, K.; Geladi, P. Principal component analysis. Chemom. Intell. Lab. Syst. 1987, 2, 37–52. [Google Scholar] [CrossRef]
- Maaten, L.V.D.; Hinton, G.E. Visualizing Data using t-SNE. J. Mach. Learn. Res. 2008, 9, 2579–2605. [Google Scholar]
- Collins, C.; Penn, G.; Carpendale, S. Bubble Sets: Revealing Set Relations with Isocontours over Existing Visualizations. IEEE Trans. Vis. Comput. Graph. 2009, 15, 1009–1016. [Google Scholar] [CrossRef]
- Byron, L.; Wattenberg, M. Stacked Graphs—Geometry & Aesthetics. IEEE Trans. Vis. Comput. Graph. 2008, 14, 1245–1252. [Google Scholar]
- Enron Email Dataset. Available online: http://www.cs.cmu.edu/~enron/ (accessed on 7 October 2020).





Publisher’s Note: MDPI stays neutral with regard to jurisdictional claims in published maps and institutional affiliations. |
© 2021 by the authors. Licensee MDPI, Basel, Switzerland. This article is an open access article distributed under the terms and conditions of the Creative Commons Attribution (CC BY) license (http://creativecommons.org/licenses/by/4.0/).
Share and Cite
Fu, K.; Mao, T.; Wang, Y.; Lin, D.; Zhang, Y.; Sun, X. DyEgoVis: Visual Exploration of Dynamic Ego-Network Evolution. Appl. Sci. 2021, 11, 2399. https://doi.org/10.3390/app11052399
Fu K, Mao T, Wang Y, Lin D, Zhang Y, Sun X. DyEgoVis: Visual Exploration of Dynamic Ego-Network Evolution. Applied Sciences. 2021; 11(5):2399. https://doi.org/10.3390/app11052399
Chicago/Turabian StyleFu, Kun, Tingyun Mao, Yang Wang, Daoyu Lin, Yuanben Zhang, and Xian Sun. 2021. "DyEgoVis: Visual Exploration of Dynamic Ego-Network Evolution" Applied Sciences 11, no. 5: 2399. https://doi.org/10.3390/app11052399
APA StyleFu, K., Mao, T., Wang, Y., Lin, D., Zhang, Y., & Sun, X. (2021). DyEgoVis: Visual Exploration of Dynamic Ego-Network Evolution. Applied Sciences, 11(5), 2399. https://doi.org/10.3390/app11052399


