Article

Sustainable Management of Water Resources in Supplementary Irrigation Management

by
Monika Marković
1,*,
Goran Krizmanić
2,
Andrija Brkić
2,
Atilgan Atilgan
3,
Božica Japundžić-Palenkić
4,
Davor Petrović
1 and
Željko Barač
1
1
Faculty of Agrobiotechnical Scineces, University of Joisp Juraj Strossmayer, 31000 Osijek, Croatia
2
Agricultural Institute Osijek, 31000 Osijek, Croatia
3
Faculty of Agriculture, Isparta University of Applied Sciences, 32200 Isparta, Turkey
4
Biotechnical Department, University of Slavonski Brod, 35000 Slavonski Brod, Croatia
*
Author to whom correspondence should be addressed.
Appl. Sci. 2021, 11(6), 2451; https://doi.org/10.3390/app11062451
Submission received: 12 February 2021 / Revised: 4 March 2021 / Accepted: 8 March 2021 / Published: 10 March 2021
(This article belongs to the Special Issue Water Footprint and Life Cycle Assessment)

Abstract

:
Watermark, Tensiometer and Time Domain Reflectometry (TDR) are commonly used soil water sensors in irrigation practice whose performance depends on soil type, depth and growing conditions. Here, the results of sensor performance evaluation in different soil depths as well as the field and laboratory testing in silty clay loamy soil are presented. Gravimetric soil moisture samples were taken from sensor installation depths (10, 20, 30 and 45 cm) and used as reference Soil Water Content (SWC). The measurements varied significantly (p < 0.05) across the monitoring depths. On average across the soil depths, there was a strong negative linear relationship between Watermark (r = −0.91) and TDR (r = 0.94), and a moderate negative (r = −0.75) linear relationship between SWC and Tensiometer. In general, Watermark and Tensiometer measured SWC with great accuracy in the range of readily available water, generated larger Mean Difference (MD) than TDR and overestimated SWC, while TDR underestimated SWC. Overall, laboratory testing reduced the root mean square error (RMSE, Watermark = 1.2, Tensiometer = 2.6, TDR = 1.9) and Mean Average Error (MAE, Watermark = 0.9, Tensiometer = 2.04. TDR = 1.04) for all tested sensors.

1. Introduction

Irrigation scheduling is an important component of irrigated and sustainable agriculture, aiming to improve water use efficiency by applying the right amount of water at the right time. As a result, plants are supplied with sufficient water while losses caused by runoff or drainage are minimized. In terms of irrigation scheduling, water in the soil corresponds to the amount of water that is available to plants (Available Water Content, AWC), and it ranges from Saturated soil (SAT) to Permanent Wilting Point (PWP). However, not all water between SAT and PWP is easily extracted from the soil. Allen et al. [1] stated that the fraction of Total Available Water (TAW) that crops can extract from the root zone without suffering water stress is the Readily Available Water (RAW). The soil is considered to be saturated (0 MPa) if the micropores and macropores within the soil are filled with water. Water moves downward through the soil profile by the force of gravity, and after the drainage of macropores has occurred, Field Water Capacity (FWC) is reached (−0.033 MPa). This process usually takes only a few hours for sandy soils but can take up to 72 h for soils with high clay content [2]. FWC is not the upper limit of TAW to plants because all water that is not held tightly by soil can be used by plants while it is in contact with roots, even if the water is rushing by during rapid drainage [3]. In the absence of rainfall or irrigation events, the amount of water in the soil is continuously decreasing, and it reaches the soil water content of PWP (−1.5 MPa). The PWP is the lower soil water limit below which plants cannot effectively extract water and will eventually wilt.
The key factor in successful irrigation scheduling is to know the RAW that represents the Maximum Allowed Water Depletion (MAD) at the time of irrigation. There are different techniques to determine the time of irrigation and how much water to apply in one irrigation event. In practice, this decision is mostly based on personal experience of the irrigation engineer or meteorological data or by counting the calendar days since the last irrigation, while the most reliable and precise technique for irrigation scheduling is measuring and monitoring of Soil Water Content (SWC) during the growing season. In practice, some of the sensors for measuring SWC are more reliable or have higher maintenance requirements than others. Challenges in the measurement of SWC include labor-intensive activities such as the permanent installation of soil moisture devices, repeated monitoring of water content, destructive sampling, and water extraction from soil samples [4]. SWC can be measured directly (gravimetric, destructive sampling) or indirectly with the use of sophisticated devices (in situ sampling). Brevik [5] has stated that destructive sampling, which involves gathering soil samples in the field and taking them to the laboratory for analysis, can provide good measurements of SWC but can be time-consuming and does not allow for retesting at the same site due to removal of the soil material. Furthermore, the author claims that in situ sampling gives results much more rapidly than destructive sampling and can provide repeated measurements from the same site at virtually any time interval desired, given the correct data logging equipment, but in situ instrumentation is typically quite expensive in comparison to destructive sampling. The in situ use of sophisticated expensive sensors for measuring SWC is not often used in practice, mostly due to a lack of previous knowledge about SWC and of course due to its high price, even though the measuring of SWC is essential for irrigation scheduling by keeping it within a target range. Regarding previous knowledge of SWC, Jabro et al. [6] have stated that prior knowledge of the FWC and the soil-water retention curve (also named as the soil moisture characteristics curve) is important for the effective irrigation management and scheduling of many crops. Kirkham [7] claims that the soil–water retention curve is affected by soil physical and chemical characteristics, while Chow et al. [8] add that the relationship between SWC and physical properties might not be unique and may differ along with drying and wetting cycles, especially in finer-textured soils. Plauborg et al. [9] claim that each sensor may perform differently when used in real measurement operations in a specific region. Soil moisture sensors perform differently not only with different soil types, but also with different soil depths [10], different parts of the field and different growing conditions [11]. Because of the above-mentioned factors, without the site-specific calibration, it is hard to obtain accurate data on SWC. Site-specific calibration would not only significantly increase the precision of sensors [12], it is also essential in the modeling of water flow and nitrogen transport in soils [13].
In the present study, the performance of the following devices for measuring SWC was tested: Granular Matrix Sensor (GMS, Watermark 200SS), Tensiometer both manufactured by Irrometer Co. (Riverside, CA, USA) and Time Domain Reflectometry (FieldScout, TDR300) manufactured by Spectrum Technologies, Inc. Watermark is an electrical resistance device in a gypsum wafer surrounded by a granular matrix material. It is a relatively low-cost GMS, which is easy to use and install and can function consistently over a range of soil water tension from −10 kPa to −200 kPa [14]. The Watermark sensor operates on the same principles as other electrical resistance sensors. Water content inside the sensor changes corresponding to soil water content. The changes with the sensor are reflected by differences in electrical resistance between the electrodes [15]. Tensiometer measures soil water potential and comprises a tube filled with water attached to a ceramic cup on one end and a vacuum gauge on the other end [16]. The last sensor used in this study was Time Domain Reflectometry (TDR300). TDR was chosen because of its increased usage for field soil water estimation because the measurement is non-destructive and less affected by soil texture, bulk density and temperature [17]. TDR is a technology in which an electromagnetic pulse is propagated down a parallel rod, which acts like a balanced transmission line [18]. The advantage of TDR is its ability to accurately measure the permittivity of material and the ability to estimate SWC and measure bulk soil EC simultaneously [19]. The sensor measures the travel time of a step pulse of electromagnetic radiation from a reference node along the guide rods inserted into the soil and back to the reference node [20]. With TDR, the soil dielectric constant (Ka) is measured and related to Volumetric Water Content (VWC) using a calibration equation [21]. The most important issue is to ensure that the rods are fully inserted straight into the soil.
The main goal of this study was to (i) evaluate the performance of sensors for measuring SWC in supplementary irrigation scheduling, (ii) to perform field calibration and (iii) to perform laboratory calibration to reduce errors.

2. Materials and Methods

2.1. Site and Soil Description

The study area lies in the Pannonian Plain, Slavonia region in the northeastern, continental part of the Republic of Croatia. It is a major agricultural and farming region of Croatia due to considerable areas covered by fertile soil (Figure 1). The field and laboratory testing of the selected sensors were performed in the pea (Pisum sativum L.) field at Agricultural Institute Osijek (45°32′ N and 18°44′ E, altitude 90 m).
In continental, the lowland part of Croatia is a prevalent subhumid climate (Cfwbx) with an average annual temperature of 12 °C and the annual amount of precipitation from 600 to 700 mm and 360 mm during the growing season, April–September [22]. The soil at the experimental site is classified as anthropogenic eutric cambisol (WRB), silty clay loamy texture, with its main properties presented in Table 1.
National classification of soil was used [23], which is genetic and serves as the basis for soil production and ecological assessment and is based on the properties of soils that are morphologically visible or easily measurable. Comparison of national soil classification with The World Reference Base (WRB) [24] classification system was also conducted as well as the separation of the reference group of soils with appropriate prefixes that correspond to lower systematic units than soil type. The anthropogenic horizon is brown to light brown color, classified as silty clay loam soil. The top 50 cm layer is made from coarse-grained particles, high in sesquioxide (R2O3) contents and free from carbonates. At 50 to 105 cm depth, the soil texture is clay to silty clay, yellowish-brown to brown in color in deeper soil layers. The parent material occurs at 105 to 115 cm depth, yellow, without structure and rich in CaCO3 (Figure 2).
The gley horizon is typically mottled and occasionally saturated with groundwater. For the preparation of the average sample from the selected location, control circular sampling was used according to Škorić [25]. Soil samples were prepared for physical and chemical analyses according to ISO 11464 procedures in a drying oven. The determination of soil pH was made in 1:5 (v/v) suspension of soil in water and a 1M potassium chloride (KCl) solution according to ISO 10390.
The soil organic matter was determined using organic carbon (C) by sulfochromic oxidation prescribed in ISO 14235. Plant-available phosphorus (P2O5) and potassium (K2O) were extracted by AL solution (Ammonium Lactate-acetate) and detected by spectrophotometry and flame photometry, respectively. The soil texture and clay content were determined by sieving and sedimentation method prescribed in ISO 11277. All physical properties of the soil are determined according to Bittelli [26]. Soil water content (%) determined with pressure plate apparatus was as follows: 0.33 bar = 39.52 to 40.88, 6.25 bar = 24.3 to 25.2, 15 bar = 23.65 to 24.52.
The crop was sown in the middle of the month of May (100 plants/m2), while the harvest time was at the beginning of the month of July (the year 2017). The total size of the experimental plot was 230 m2 plus side borders. Rainfall data (mm) were obtained from a meteorological and hydrological service, which was located 1.5 km from the study location (Figure 3a). The groundwater level (m) was monitored in an observation well located near the experimental plot (Figure 3b).

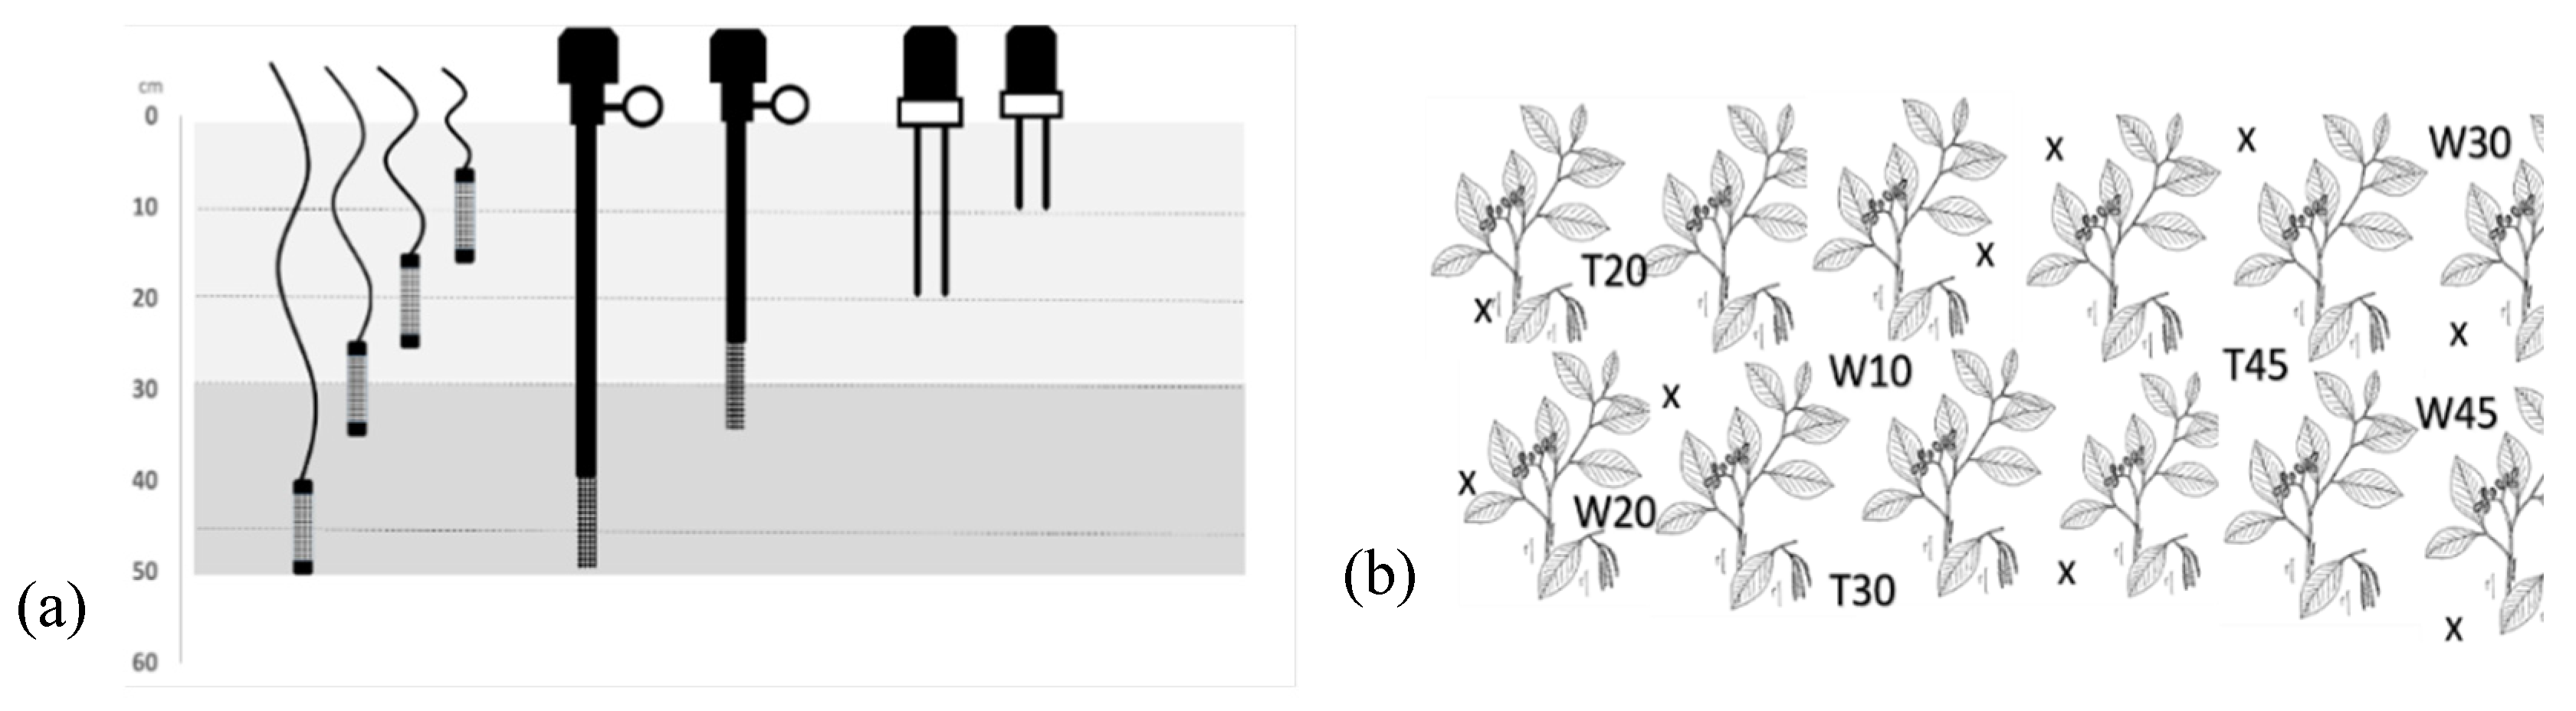
2.2. Measuring Soil Water Content

This section provides a short specification of each sensor used in this study. Sensor installation processes and operational procedures were carried out according to the manufacturer’s recommendations and instructions for each sensor.
Before sensor installation in the field, some undisturbed soil samples were taken for laboratory calibration in perforated cylindrical plastic columns. The laboratory testing was performed so that each sensor would be analyzed in the full range of moisture content (SAT to PWP) since the pea crop was grown in a non-irrigated condition. Soil samples were taken from the topsoil layer within 7 m diameter of sensors that were placed in the soil. For the calibration of Watermark sensors, soil samples were taken with 300 cc sample rings (Ejikelkamp, soil and water) hammered in the soil at the study site. Watermark sensors were placed in four sampling rings, and the excess soil was trimmed with the knife on top and the bottom of the sampling rings. After the sampling in the field, the sampling rings were taken in the laboratory and placed on a tray with filter paper and filled with distilled water. Soil samples were watered until the Water Content (WC) was above FC. Sensors were then left for two days so that they could equilibrate with the matric potential of the soil water. At the same time, four sampling rings were filled only with soil (without the sensors), and those samples were oven-dried (105 °C for 24 h) and afterward weighted. As for field calibration, soil samples were taken along with each sensor measurement, at the same soil depth as the sensors were installed. After taking the soil samples, the sampling holes were immediately refilled with soil from the same location so that the mass flow of soil water would be reduced. Soil sample weight and sensor readings were taken a few times, averaged and recorded until the SWC was near the WP. For both field and laboratory testing, water content measured by the sensors was compared with corresponding values from gravimetric samples, and as a final result, a regression equation was created. As for the calibration of the tensiometer and TDR sensor, the protocol was similar to the one for GMS with the difference in soil sampling. For this testing, the disturber soil samples were taken, air-dried, passed through 2 mm sieve and packed in containers (10 L). Bulk Density (BD) of the soil samples was approximately the same as that in the field. Afterward, the sensors were inserted into the soil. The rest of the procedure was the same as for the GMS. Before being placed in the soil, GMS and tensiometer were soaked in water for 24 h. Tensiometers were filled with distilled water enriched by algaecide to prevent algae growth inside the tensiometer tube. The proper installation of GMS and tensiometer imply the good contact of a ceramic cup with the surrounding soil. For this reason, before setting the sensors in the soil, we prepared holes with an auger with a similar diameter as a tensiometer tube. Furthermore, we covered the porous ceramic cup and GMS with mud from the excavated site for better hydraulic connectivity with the surrounding soil. In this study, tensiometer 30 and 45 cm long rods were used, while the GMS was set up at 10 cm, 20 cm, 30 cm and 45 cm deep in the soil (Figure 4a). As for TDR, the 10 cm and 20 cm rods were used in this study, while the 30 cm long rods were excluded from the study, since it was impossible to insert the rods into the dry soil at their full length. Unlike tensiometer and GMS, there was no need to prepare the TDR device before usage. However, predrilling holes were made before the rods were inserted vertically into the soil to avoid the compaction caused around the holes by the rods, which can cause underestimation of SWC [27]. Sensors had 5 replications per measurement for each soil depth. In total, SWC was measured 110 times on four soil depths as follows: 10, 20, 30 and 45 cm (Figure 4b).
At the same time, 88 disturbed soil samples were taken from the experimental site (22 measurements and four soil depths) for field testing (Figure 3b, x marks represent the location of soil sampling, T represents Tensiometer and W represents Watermark). Edelman auger was driven into the soil to collect soil samples for the same soil depths and location where sensors were placed or where the sensor readings were taken. After taking the soil samples, the sampling holes were immediately refilled with soil from the same location so that the mass flow of soil water would be reduced. The direct method for measuring SWC was done by a thermogravimetric method that refers to the difference in weight before and after drying of the soil sample. Moreover, the thermogravimetric method is a reference method for SWC measurement [28]. After the weighing, the soil samples were dried at 105 °C for 24 h and weighed again [29]. Gravimetric soil water content was determined as
θ gwc = ( Ww Wd ) Wd   × 100
where θgwc is gravimetric water content, Ww is the weight of the wet soil and Wd is the weight of the dry soil. The gravimetric method expresses gravimetric water content [30], while the Volumetric Water Content (VWC, %) is the volume of water held within a volume of oven-dried undisturbed sample (soil core). VWC was determined as [31]
θ v = θ ρ b
where θv is VWC, θ is Gravimetric Moisture (GM) and ρb is soil bulk density (g cm−3).
Factorial analysis of variance (ANOVA) was done to assess the impact of soil layer (depths) on θv. Furthermore, a comparison of the gravimetric method and sensor readings was made by using correlation and regression analysis in STATISTICA 13 (StatSoft, Inc., Tulsa, OK, USA). The following statistical methods were used to examine the differences between the sensor measurements and θv. The degree of similarity between the sensor readings and GM measurements was done by using a coefficient of determination (R2) and correlation (r). Root Mean Square Error (RMSE) used for validation of calibration equation and was calculated as the difference between the sensor readings and gravimetric moisture (θv), proposed by Milly [32]:
RMSE = [ n 1 i = 1 n ( Si Oi ) 2 ]
where Si is the estimated and Oi is the observed value. Mean Absolute Error (MAE) was calculated according to Addicott and Whitmore [33] and was used to quantify the deviation of the estimated θv means from the observed θv:
MAE = 1 N i = 1 N ( S i O i )
where N is the number of observations and Si and Oi are estimated and observed values, respectively. Mean Difference (MD) was used to describe the average difference between the sensor readings and corresponding VWC measurements [34]:
MD = i = 1 n ( Msi Mgi ) n
where Msi is the sensor reading, Mgi is θv measurement and n is the number of samples.

3. Results

In general, the sensors’ reflection of rainfall patterns over the study period was soil-depth-dependent (Figure 4). ANOVA showed a significant variation in SWC across the soil layers for all tested sensors (LSDp<0.01 34.97 for Watermark, LSDp<0.01 4.98 for tensiometer and LSDp<0.05 3.18 for TDR). Especially notable was the performance of Watermark sensor as a function of soil depth, which will be discussed later. The results of the study clearly provide insight into the interpretation of sensor readings with respect to the time of irrigation. For silty clay loamy soil at 0 to 40 cbar, Watermark and Tensiometer readings represent the FWC range, and at 40 to 70 cbar, the irrigation initiation range or management allowable depletion (MAD). This result of our study confirms that there is a need for sensor calibration for specific soil types, since according to the manufacturer’s recommendation, the FWC is in the range of <20 cbar, while according to our results, it is <40 cbar, or irrigation initiation range is <80 cbar while in our study it is <60 to 70 cbar. In terms of time irrigation time and amount of irrigation water, this means that irrigation scheduling according to the manufacturer’s guidelines will lead to over-irrigation.
In the 8 to 12 cm soil layer, VWC ranged from 19 to 37.6% (27.9% on average). A considerable amount of rainfall occurred at the beginning of June (24.3 L, Figure 5a), which increased the SWC to almost 100% FC. In the 0 to 10 cm soil layer, the Watermark sensor and TDR captured the change in SWC, from 74 to 42 cbar and 23.3% vol. to 32.9% vol., respectively. A similar situation occurred at the end of June (16.6 L), when Watermark and TDR captured the increase in SWC from 67 to 45 cbar. For the 10 cm soil layer, there was a strong positive correlation between TDR and VWC (r = 0.93, p < 0.05) and a strong negative correlation between Watermark and VWC (r = −0.83, p < 0.05). Regression analysis was done to test the significance of the relationship between SWC and sensor readings.
The best fit of the regression function (linear or polynomial) was chosen according to the highest R2 (p < 0.05). In comparison to Watermark, TDR showed better performance, which is obvious from the scatter patterns (Figure 6a,h). The scatter dots (Figure 6h) for TDR showed good distribution along the 1:1 line (R2 = 0.86) when SWC was below 33%. The difference in SWC between the TDR and VWC was below 2%. Watermark sensor (Figure 6a) did not show a tight distribution along 1:1 line (R2 = 0.68).
In the 18 to 22 cm soil layer, VWC ranged from 19.2 to 38.7% (29.2% on average). Similar to the previous soil layer, all tested sensors captured the changes in SWC (Figure 5b). In this soil layer, both Watermark and tensiometer captured SWC changes with good matching up to the point where SWC was getting lower, above 60 cbar. This indicates that both Watermark and Tensiometer measure SWC with great accuracy in the range of readily available water (0 to 80 cbar). Although Watermark had a wider measuring range (0 to 199 cbar) than tensiometer, the measurements outside 80 to 100 cbar have no meaning for irrigation scheduling. In this soil layer, the best performance had a Watermark sensor (Figure 6b) with scatter dots close to the 1:1 trendline when VWC was above 23.7%. As the SWC was decreasing, the Watermark mostly underestimated SWC. The correlation analysis showed strong negative relationship between VWC and Watermark (r = −0.96, p < 0.05), tensiometer (r = −0.83, p < 0.05) and VWC. At this soil depth, TDR generally followed the pattern well (Figure 6i), although without thigh distribution along the line. The coefficient of determination (R2 = 0.86) was almost the same as in the previous soil layer, which indicates that TDR measurement is not soil-depth-dependent. Further, there was a strong relationship between TDR and VWC (r = 0.94, p < 0.05).
In the 28 to 32 cm soil layer (Figure 5c), VWC ranged from 10.1 to 35.6% (23.8% on average). As previously mentioned for the 28 to 32 cm soil layer, TDR 30 cm-long rods were excluded from the analysis since there was a difficulty with properly inserting rods into dry soil despite preparing holes. As a result, the TDR showed unreasonable measurements. In this layer, Watermark followed the trend in SWC up to the point when SWC was out of range of readily available water. At that time, the sensor readings showed 199 cbar until the first rainfall event (June 23, 6 L), when the sensor reading was reduced to 118 cbar and afterward to 21 cbar after the rainfall event on June 27, 16.6 L. Furthermore, with the drying of the soil, the sensor readings were increasing, which confirms that Watermark recorded the changes in SWC. Here, the best fitting relationship was described with a polynomial line (Figure 6c), and a strong negative correlation was established between Watermark and SWC at this soil depth (r = −0.93, p < 0.05). As for tensiometer, similar to Watermark, the sensor captured changes in SWC up to 83 cbar (readily available water) at the beginning of the study. Afterward, the SWC was below the measuring capability of the tensiometer. After the measuring scale dropped to 0 cbar, sensor service was required since the soil had become too dry and the tensiometer had lost suction. The tensiometer generally overestimated SWC (Figure 6f) and performed worse than in the 10 to 20 cm soil layer (r = −0.76, p < 0.05). Similar results were obtained in 30 to 45 cm soil layer (Figure 5d), where VWC ranged from 11.2 to 28.7% (28.7% on average). Watermark showed a strong negative correlation (r = −0.93, p < 0.05) with VWC, and in the previous soil layer, Watermark captured the changes in SWC at the beginning of the study when the SWC was high, but at this depth, SWC was not influenced by later rainfall events (2 June, 24.3 L). As a result, the Watermark readings were 199 cbar until the rainfall event on 27 June (16.6 L). Good Watermark performance in high SWC was described with a polynomial line (Figure 6d, R2 = 0.93). On the other hand, the tensiometer captured the rainfall on 27 June, but immediately after that, the measuring scale dropped to 0 cbar and service was again required (r = 0.003, Figure 6g).
As for the laboratory calibration, Watermark and tensiometer are best described by a linear relationship, while TDR was best described by polynomial (Figure 7). It is obvious for Watermark and TDR that the calibration is less scattered regarding field calibration.
Here, R2 was higher for all tested sensors in comparison to field calibration (Table 2). Correlation analysis showed a strong negative relationship for Watermark vs. gravimetric (r = −0.98, n = 120) and Tensiometer vs. gravimetric (r = −0.93, n = 83) and a strong positive relationship for TDR vs. gravimetric (r = 0.98, n = 75).

4. Discussion

The amount of rainfall during the January-July period was only 30 mm lower than the long-term average (LTA) and was well-distributed through the growing season. Further, the amount of rainfall during winter and early springtime was above the LTA, which provided a considerable amount of SWC for initial growth (Figure 3b). The SWC was near the FWC (readily available water) up to the beginning of the month of June, when there was a rainfall event. Twenty-four millimiters of rainfall in one single day provided enough water for the pea crop till the end of the growth, so there was no need to irrigate. At the time when SWC was low, the pea crop was in a development stage when there was no need for additional water (end of the month of June and the beginning of the month of July). As a result of such a growing condition, the year with a sufficient amount of rainfall for pea growing and lack of irrigation water, the sensors’ laboratory testing was performed to test the sensor performance in a full range of moisture.
In general, Watermark and tensiometer generated larger MD than TDR and overestimated SWC, while the TDR underestimated SWC (both for field and laboratory calibration) with minor differences in MD for both soil depths (Table 2). Plauborg et al. [9] also found that the Watermark sensor overestimated SWC in sandy loam soil. Furthermore, Watermark and tensiometer performed differently at different soil depths and after the rainfall event. The best performance of the Watermark sensor was ≥20 cm (Table 2). A conclusion from previous research [12] was that the main factor for irrigation efficiency is to properly determine the optimum level for Watermark sensor installation. The sensor installation at ≥20 cm due to the impact of groundwater level on sensor performance is proposed. As is presented in Figure 1, in this study, the groundwater was below 2 m and therefore had no impact on SWC in the top layer nor in sensor performance. Furthermore, in this study, we noticed the poor response of the Watermark sensor to wetting and drying processes in 10 and 45 cm of soil depth. This is also confirmed by Intrigliolo and Castel [35] and Dukes and Scholberg [36]. The author claims that the Watermark does not respond properly to rapid drying or partial rewetting of the soil, showing hysteretic behavior, which consequently may lead to incorrect estimation of the actual soil water status in these situations. As for the tensiometer, the best performance was at 20 cm with the emphasis on the fact that maintenance (servicing) was required. Patel and Rank [37] have also stated that tensiometers tend to require more maintenance compared to solid-state sensors such as Granular Matrix Sensors (GMS) or Time Domain Reflectometry (TDR) sensors. As is presented in Table 2, the sensor performance was soil-depth-dependent. The performance of calibration equations was tested with RMSE analysis for both field and laboratory calibration as well, where good performance was shown with RMSE close to 0. For example, the Watermark sensor showed the best performance of the calibration equation in 20 cm soil layer with a value of RMSE 1.7. The RMSE value increased as the soil layer deepened (20 cm = 1.7; 45 cm = 2.8). The highest RMSE was for a 10 cm soil layer, which indicates that the Watermark sensor has difficulty capturing the changes in SWC in the upper soil layer. Since there was no large variation in SWC, this poor response of the Watermark sensor could be because of the lack of adequate contact between the sensor and cracking soil. Abdulahh et al. [38] claim that poor contact between sensor and soil will increase mud (slurry). The author also claims that when the slurry dries, it will crack and move away from the soil, creating space between the sensor and the soil. Similar to the Watermark calibration equation, the lowest RMSE for tensiometer was in topsoil layer (20 cm = 3.2; 45 cm = 5.0). TDR showed good performance but also underestimated SWC in both soil layers (0 to 10 and 10 to 20 cm, while TDR 30 cm long rods were excluded from the analysis since there was a difficulty with proper inserting of rods in dry soil). As for the performance of the TDR calibration equation, RMSE was almost the same for 10 cm (2.1) and 20 cm (2.2) soil layers. In this study, TDR showed good performance when SWC was below 33%, which is in agreement with Tfwala et al. [39], who also claim edthat the accuracy in measurement using TDR was reduced as the amount of SWC increased more than 30%. In general, RMSE values were greater for the field compared to laboratory calibration, except in the case of TDR. As previously stated by Skierucha [40], this implies higher VWC estimation accuracy for the laboratory calibration equations compared to field calibration equations. In addition, R2 between the sensor measurements and gravimetric VWC was higher when using the laboratory in comparison to the field calibration equation for all tested sensors (Table 2). This also implies that laboratory calibration gives more accurate estimations. Furthermore, a lower mean absolute error (MAE) was recorded for all tested sensors when the laboratory calibration equation was applied to sensor readings (Table 2). The smallest difference in MAE between field and laboratory calibration is established for TDR (both soil layers), which confirms the good performance of this sensor on both tested soil depths. As previously stated by Skierucka et al. [40], TDR has superior accuracy to within 1 or 2% vol., and the calibration requirements are minimal. According to Jones et al. [41], TDR calibration was found to fit the gravimetrically determined VWC data very well (R2 = 0.995, n = 4), with the maximum calculated standard error (0.015 m m−3). Hignett and Evett [42] stated that for most agricultural and research applications, the measurement accuracy needs to be within 0.01 to 0.02 m3 m−3 (1–2% VWC). Therefore, laboratory calibration in our study is needed to reduce the error and improve sensor accuracy.

5. Conclusions

Overall, the results of this study showed that the sensor performance considerably varied across different soil water content and monitoring soil depths. Regression equations indicated slow response of Watermark and Tensiometer in a lower range of soil water content, which is especially important in areas where irrigation is a supplementary source of water for the crops. That was another factor that was examined in this study, and the result indicated that TDR showed better responsiveness to drying and wetting cycles regardless of the monitoring soil depth. The Watermark and Tensiometer responses to rapid wetting and drying cycles were slow or even non-existant in deeper soil layers. All tested sensors performed best at 20 cm soil depth, even though the soil profile was homogenous in terms of physical properties. This means that if the effects of soil depth are ignored, the error in estimated soil water content will be greater. Results of the study indicate that in growing conditions where irrigation is a supplementary source of water, laboratory testing is necessary to improve sensor performance for accurate measurement in a wider soil water range. Several factors have contributed to differences among sensor performances, including the lack of adequate contact of the sensor with dry cracking soil as well as the loss of the soil suction in low soil water content conditions. Because some of the sensors did not capture changes in SWC at a certain soil depth, it is suggested that the effect of sensor installation depth might not be negligible in certain cases, especially in growing conditions when frequent changes in soil water content are present.

Author Contributions

Conceptualization, M.M. and G.K.; methodology, M.M. and G.K.; formal analysis, A.B. and A.A.; investigation, M.M. and B.J.-P.; writing—original draft preparation, M.M., D.P. and Ž.B.; writing—review and editing, M.M., B.J.-P., A.B., D.P. and Ž.B. All authors have read and agreed to the published version of the manuscript.

Funding

This research received no external funding.

Institutional Review Board Statement

Not applicable.

Informed Consent Statement

Not applicable.

Data Availability Statement

Not applicable.

Conflicts of Interest

The authors declare no conflict of interest.

References

  1. Allen, R.G.; Pereira, L.S.; Raes, D.; Smith, M. Crop Evapotranspiration—Guidelines for Computing Crop Water Requirements—FAO Irrigation and Drainage Paper 56; FAO: Rome, Italy, 1998; pp. 161–162. [Google Scholar]
  2. Weil, R.P.; Brady, N.C. The Nature and Properties of Soils, 15th ed.; Pearson Educ.: Harlow, UK, 2017; pp. 2013–2217. [Google Scholar]
  3. Kirkham, M.B. Principles of Soil and Plant Water Relations, 2nd ed.; Academic Press: Cambridge, MA, USA, 2014; pp. 87–101. [Google Scholar]
  4. Jiang, P.; Newell, R.K.; Anderson, S.H.; Sadler, E.J.; Sudduth, K.A. Estimating Plant-Available Water Using the Simple Inverse Yield Model for Claypan Landscapes. Agron. J. 2008, 100, 830–836. [Google Scholar] [CrossRef] [Green Version]
  5. Brevik, E. Evaluation of the FieldScout TDR300 for Determining Volumetric Water Content in Sandy South Georgia Soils. Soil Horiz. 2012, 53, 27–30. [Google Scholar] [CrossRef]
  6. Jabro, J.D.; Evans, R.G.; Kim, Y.; Iversen, W.M. Estimating in situ soil–water retention and field water capacity in two contrasting soil textures. Irrig. Sci. 2008, 27, 223–229. [Google Scholar] [CrossRef]
  7. Kirkham, M.B. Principles of Soil and Plant Water Relations; Elsevier Academic Press: Burlington, MA, USA, 2004; pp. 153–161. [Google Scholar]
  8. Chow, L.; Xing, Z.; Rees, H.W.; Meng, F.; Monteith, J.; Stevens, L. Field Performance of Nine Soil Water Content Sensors on a Sandy Loam Soil in New Brunswick, Maritime Region. Can. Sens. 2009, 9, 9398–9413. [Google Scholar] [CrossRef]
  9. Plauborg, F.; Iversen, B.V.; Laerke, P.E. In situ comparison of three dielectric soil moisture sensors in drip irrigated sandy soils. Vadose Zone J. 2005, 4, 1037–1047. [Google Scholar] [CrossRef]
  10. Thompson, R.B.; Gallardo, M.; Agüera, T.; Valdez, L.C.; Fernández, M.D. Evaluation of the Watermark sensor for use with drip irrigated vegetable crops. Irrig. Sci. 2006, 24, 185–202. [Google Scholar] [CrossRef]
  11. Girisha, K.G.; Zhuping, S.; Clark, J.A. Soil Salinity and Sodicity Appraisal by Electromagnetic Induction in Irrigated Cotton Soils. Land Degrad. Dev. 2014, 25, 228–235. [Google Scholar]
  12. Marković, M.; Filipović, V.; Legović, T.; Josipović, M.; Tadić, V. Evaluation of Different Soil Water Potential by Field Capacity Threshold in Combination with a Triggered Irrigation Module. SWR 2015, 10, 164–171. [Google Scholar] [CrossRef] [Green Version]
  13. Leib, B.G.; Jabro, J.D.; Mathews, G.R. Field evaluation and performance comparison of soil moisture sensors. Soil Sci. 2003, 168, 396–408. [Google Scholar] [CrossRef]
  14. Irmak, S.; Payero, O.J.; Eisenhauer, E.D.; Kranz, L.W.; Martin, L.D.; Zoubek, L.G.; Rees, M.J.; VanDe Walle, B.; Christiansen, P.A.; Leininer, D. Watermark Granular Matrix Sensor to Measure Soil Metric Potential for Irrigation Management; Institute of Agriculture and Natural Resources at the University of Nebraska: Lincoln, Nebraska, 2006; Available online: https://lancaster.unl.edu/ag/Crops/Watermark_Sensor.pdf (accessed on 15 August 2019).
  15. Ganjegunte, K.G.; Sheng, Z.; Clark, J.A. Evaluating the accuracy of soil water sensors for irrigation scheduling to conserve freshwater. Appl. Water Sci. 2016, 2, 119–125. [Google Scholar] [CrossRef] [Green Version]
  16. Gong, Y.; Cao, Q.; Sun, Z. The effects of soil bulk density, clay content and temperature on soil water content measurement using time-domain reflectometry. Hydrol. Process. 2003, 17, 3601–3614. [Google Scholar] [CrossRef]
  17. Reeves, T.L.; Smith, M.A. Time domain reflectometry for measuring soil water content in range surveys. J. Range Manag. 1992, 45, 412–414. [Google Scholar] [CrossRef]
  18. Robinson, D.A.; Jones, S.B.; Wraith, J.M.; Or, D.; Friedman, S.P. A review of advances in dielectric and electrical conductivity measurement in soils using time domain reflectometry. Vadose Zone J. 2003, 2, 444–475. [Google Scholar] [CrossRef]
  19. Jury, W.A.; Gardner, W.R.; Gardner, W.H. Soil Physics, 5th ed.; John Wiley & Sons, INC: New York, NY, USA, 1991; p. 47. [Google Scholar]
  20. Chandler, D.G.; Seyfried, M.; Murdock, M.; McNamara, J. Field Calibration of Water Content Reflectometers. Soil Sci. Soc. Am. J. 2004, 68, 1–9. [Google Scholar] [CrossRef]
  21. IUSS Working Group WRB. World Reference Base for Soil Resources 2014; World Soil Resources Report, Update 2014; FAO: Rome, Italy, 2014; Available online: http://www.fao.org/3/i3794en/I3794en.pdf (accessed on 4 September 2020).
  22. Zaninović, K.; Gajić-Čapka, M.; Perčec Tadić, M.; Vučetić, M.; Milković, J.; Bajić, A.; Cindrić, K.; Cvitan, L.; Katušin, Z.; Kaučić, D.; et al. Climate Atlas of Croatia 1961–1990, 1971–2000; Meteorological and Hydrological Service of Croatia: Zagreb, Croatia, 2008.
  23. Škorić, A.; Filipovski, G.; Ćirić, M.; Vuković, T. Klasifikacija Zemljišta Jugoslavije; Academy of Sciences and Arts of Bosnia and Herzegovina: Sarajevo, Bosnia and Herzegovina, 1985. [Google Scholar]
  24. FAO. Soil and Plant Testing and Analysis; FAO Soils Bulletin 38/1; FAO: Rome, Italy, 1977; Available online: http://www.fao.org/3/ar117e/ar117e.pdf (accessed on 29 July 2019).
  25. Škorić, A. Priručnik za Pedološka Istraživanja; Sveučilište u Zagrebu: Zagreb, Croatia, 1986. [Google Scholar]
  26. Bittelli, M. Measuring Soil Water Content: A Review. Horttechnology 2011, 21, 293–300. [Google Scholar] [CrossRef]
  27. Cai, G.; Vanderborght, J.; Klotzsche, A.; van der Kruk, J.; Neumann, J.; Hermes, N.; Vereecken, H. Construction of Minirhizotron Facilities for Investigating Root Zone Processes. Vadose Zone J. 2016, 15, 1–13. [Google Scholar] [CrossRef] [Green Version]
  28. Evett, S.R.; Heng, L.K.; Moutonnet, P.; Nguyen, M.L. Field Estimation of Soil Water Content; International Atomic Energy Agency: Vienna, Austria, 2008; pp. 123–129. Available online: https://www-pub.iaea.org/MTCD/publications/PDF/TCS-30_web.pdf (accessed on 27 June 2019).
  29. Muñoz-Carpena, R.; Shukla, S.; Morgan, K. Field Devices for Monitoring Soil Water Content; USDA: Washington, DC, USA, 2004; pp. 1–24. Available online: http://citeseerx.ist.psu.edu/viewdoc/download?doi=10.1.1.514.6862&rep=rep1&type=pdf (accessed on 2 May 2019).
  30. Ma, Y.; Qu, L.; Wang, W.; Yang, X.; Lei, T. Measuring soil water content through volume/mass replacement using a constant volume container. Geoderma 2016, 271, 42–49. [Google Scholar] [CrossRef]
  31. Abbas, F.; Fares, A.; Fares, S. Field calibrations of soil moisture sensors in a forested watershed. Sensors 2011, 11, 6354–6369. [Google Scholar] [CrossRef] [Green Version]
  32. Milly, O.C.D. A simulation analysis of thermal effects on evaporation from soil. Water Resour. Res. 1984, 20, 1087–1098. [Google Scholar] [CrossRef]
  33. Addicott, T.M.; Whitmore, A.P. Computer simulation of changes in soil mineral nitrogen and crop nitrogen during autumn, winter and spring. J. Agric. Sci. 1987, 109, 141–157. [Google Scholar] [CrossRef]
  34. McCann, I.R.; Kincaid, D.C.; Wang, D. Operational characteristics of the watermark model 200 soil water potential sensor for irrigation management. Appl. Eng. Agric. 1992, 8, 603–609. [Google Scholar] [CrossRef]
  35. Intrigliolo, D.S.; Castel, J.R. Continuous measurement of a plant and soil water status for irrigation scheduling in plum. Irrig. Sci. 2004, 23, 93–102. [Google Scholar] [CrossRef]
  36. Dukes, M.D.; Scholberg, J.M. Soil moisture controlled subsurface drip irrigation on sandy soils. Appl. Eng. Agric. 2005, 21, 89–101. [Google Scholar] [CrossRef]
  37. Patel, R.J.; Rank, H.D. Performance analysis of electrical resistance based granular matrix sensors for measuring soil water potential in clay loam soil. Agres 2016, 5, 313–319. [Google Scholar]
  38. Abdullah, N.H.H.; Kuan, N.W.; Ibrahim, A.; Ismail, B.N.; Majid, M.R.A.; Ramli, R.; Mansor, N.S. Determination of soil water content using time domain reflectometer (TDR) for clayey soil. In Advances in Civil Engineering and Science Technology, Proceedings of the AIP Conference 2020, Penang, Malaysia, 5–6 September 2018; Goh, L.D., Ng, K.S., Hassan, S.H., Woo, Y.P., Eds.; AIP Publishing: Melville, NY, USA, 2020. [Google Scholar]
  39. Tfwala, C.M.; van Rensburg, L.; Bello, Z.; Zietsman, P.C. Laboratory vs. Field Calibration of HydraSCOUT Probes for Soil Water Measurement. Pedosphere 2019, 29, 132–136. [Google Scholar] [CrossRef]
  40. Skierucha, W.; Wilczek, A.; Szypłowska, A.; Sławiński, C.; Lamorsk, K. A TDR-Based Soil Moisture Monitoring System with Simultaneous Measurement of Soil Temperature and Electrical Conductivity. Sensors 2012, 12, 13545–13566. [Google Scholar] [CrossRef] [PubMed]
  41. Jones, S.; Wraith, J.M.; Or, D. Time domain reflectometry measurement principles and applications. Hydrol. Proc. 2002, 16, 141–153. [Google Scholar] [CrossRef]
  42. Hignett, C.; Evett, S. Direct and surrogate measures of soil water content. In Field Estimation of Soil Water Content: A Practical Guide to Methods, Instrumentation, and Sensor Technology; Evett, S.R., Heng, L.K., Moutonnet, P., Nguyen, M.L., Eds.; IAEA: Vienna, Austria, 2008; pp. 1–22. [Google Scholar]
Figure 1. Map of the study area and location.
Applsci 11 02451 g001
Figure 2. Soil profile at the experimental site.
Applsci 11 02451 g002
Figure 3. Rainfall (mm) and air temperatures (°C) (a), and groundwater level (b) during the January–July period.
Applsci 11 02451 g003
Figure 4. The position of tested sensors regarding the monitoring depth (a) and location in the experimental plot (b).
Applsci 11 02451 g004
Figure 5. Amount of rainfall (mm) and soil water content (Volumetric Water Content (VWC) (%), cbar) at 10 (a), 20 (b), 30 (c) and 45 cm (d).
Applsci 11 02451 g005
Figure 6. (a) Watermark vs. Soil Water Content (SWC) 10 cm, (b) Watermark vs. SWC 20 cm, (c) Watermark vs. SWC 30 cm, (d) Watermark vs. SWC 45 cm, (e) Tensiometer vs. VWC 20 cm, (f) Tensiometer vs. VWC 30 cm, (g) Tensiometer vs. VWC 45 cm, (h) Time Domain Reflectometry (TDR) vs. VWC 10 cm, (i) TDR vs. SWC 20 cm.
Applsci 11 02451 g006
Figure 7. Relationship between sensor readings and laboratory calibrations for Watermark (a), Tensiometer (b) and TDR (c).
Applsci 11 02451 g007
Table 1. Physical and chemical properties of the soil.
Physical Properties
DepthSiltClaySandpRCACPWPPD
(cm)%%%%%%%g cm3
0–3064.732.52.844.839.65.223.72.75
30–5066.431.32.342.137.84.324.52.66
50–7068.225.56.3
70–10571.821.66.6
Chemical Properties
DepthpHAl-P2O5Al-K2OOrganic MatterCaCO3
(cm)H2OKClmg/100 g%%
0–305.596.6026.4029.702.551.25
30–506.857.6413.7525.331.632.51
p = porosity; RC = retention capacity; AC = air capacity; PWP = permanent wilting point; FC = field capacity; SAT = saturation; PD = particle density.
Table 2. Field vs. laboratory calibration.
WatermarkTensiometerTDR
Field CalibrationLab.Field CalibrationLab.FieldLab.
cm102030452030451020
RMSE3.11.72.72.81.23.24.95.02.62.12.21.9
MD30.423.863.495.633.613.838.844.332.9−2.6−1.4−1.2
MAE1.71.22.11.50.92.24.03.92.041.41.81.04
R20.680.930.910.930.970.710.570.0010.860.860.860.97
r−0.83−0.96−0.93−0.93−0.98−0.73−0.760.03−0.930.930.940.98
Publisher’s Note: MDPI stays neutral with regard to jurisdictional claims in published maps and institutional affiliations.

