Article

Numerical Phase-Field Model Validation for Dissolution of Minerals

1
Institute of Construction and Building Materials, TU Darmstadt, Franziska Braun-Straße 3, 64287 Darmstadt, Germany
2
CONICET and LMNI-FIUBA, Universidad de Buenos Aires, Buenos Aires C1127AAR, Argentina
*
Authors to whom correspondence should be addressed.
Appl. Sci. 2021, 11(6), 2464; https://doi.org/10.3390/app11062464
Submission received: 30 January 2021 / Revised: 25 February 2021 / Accepted: 6 March 2021 / Published: 10 March 2021
(This article belongs to the Section Materials Science and Engineering)

Abstract

:
Modelling of a mineral dissolution front propagation is of interest in a wide range of scientific and engineering fields. The dissolution of minerals often involves complex physico-chemical processes at the solid–liquid interface (at nano-scale), which at the micro-to-meso-scale can be simplified to the problem of continuously moving boundaries. In this work, we studied the diffusion-controlled congruent dissolution of minerals from a meso-scale phase transition perspective. The dynamic evolution of the solid–liquid interface, during the dissolution process, is numerically simulated by employing the Finite Element Method (FEM) and using the phase–field (PF) approach, the latter implemented in the open-source Multiphysics Object Oriented Simulation Environment (MOOSE). The parameterization of the PF numerical approach is discussed in detail and validated against the experimental results for a congruent dissolution case of NaCl (taken from literature) as well as on analytical models for simple geometries. In addition, the effect of the shape of a dissolving mineral particle was analysed, thus demonstrating that the PF approach is suitable for simulating the mesoscopic morphological evolution of arbitrary geometries. Finally, the comparison of the PF method with experimental results demonstrated the importance of the dissolution rate mechanisms, which can be controlled by the interface reaction rate or by the diffusive transport mechanism.

1. Introduction

Mathematical modelling of the moving-boundary dissolution fronts of minerals is important in a wide range of engineering technologies. For example, it is of great importance in fields of geochemistry, materials science, hydrometallurgy, etc. Predictions of the moving boundary dissolution phenomena can support in the design of engineering processes where dissolution is desired: e.g., in extraction of elements or reactivity of cementitious minerals, but also when not desired, e.g., in durability (corrosion) issues of building materials (e.g., steel-reinforced concrete frames). In general, minerals dissolve when exposed to aggressive solution environments and form leached layers of varying density and strength [1]. This in turn affects the mechanical and transport properties of the microstructure which further may be relevant at higher scales, for example when the material (rock, concrete or mortars) has structural applications. In addition, the dissolution mechanisms of some special minerals can be of great industrial and environmental interest. For example, the dissolution of scorodite is considered a potentially good carrier for arsenic fixation [2]. Moreover, the application of innovative self-healing concrete in civil engineering has been extensively and intensively studied in recent years. The dissolution of Ca(OH)2 from the concrete matrix is one of the key processes of the durability and self-healing mechanisms [3,4,5].
The dissolution of minerals often involves complex physico-chemical processes at the solid–liquid interface. However, this can be simplified at the mesoscale to the problem of a continuously moving boundaries. Traditional sharp interface models are thus required to trace these moving fronts [6,7,8,9,10,11,12,13,14,15,16]. However, this becomes extremely difficult for high-dimensional problems, with complex dynamic geometries, especially those whose interface evolution is accompanied by energy changes. In this sense, phase-field (PF) methods provide a powerful way to track such interfaces. The PF method has been applied to various phenomena in materials science area, such as, solidification, solid-state phase transformation, recrystallization, grain growth, fracture, and electromigration [17,18,19,20,21,22].
Generally speaking, the PF model can be regarded as a kind of diffusion interface model [23,24,25], which assumes that the thickness of the interface is limited, while the physical properties on the interface are continuous and smooth [26,27]. The moving solid–liquid interface can thus be accurately tracked [28]. Compared with sharp interface models, the PF diffusion interface model has the important advantage that no boundary conditions are specified on the interface between different domains [29,30]. This allows us to study the evolution of arbitrarily complex morphology without tracking the microscopic shape of the grain [31,32]. A new variable, namely the order parameter, is required to represent the ordered numbers of materials in terms of time and position [33,34]. In these works, the complex interfacial spatial-temporal evolution has been investigated through the aforementioned order parameter in an implicit way. An additional feature of the PF method is that there is a functional total free energy that can characterize the nature of the phase transition. It includes the various energy contributions of the system at the non-equilibrium state: i.e., chemical energy [35,36,37,38], electric potential energy [39,40,41], stress energy [42,43,44], etc. It is the competition between these different energies that leads to the generation of changing microstructural topography during the phase transition. In solving the PF model, conservative fields such as concentration fields can be described e.g., through the Cahn–Hilliard equation [45], while non-conservative fields, as order parameters, can be described via the Allen–Cahn one [46].
There are four models in the literature that are most commonly used to address two- or multi-phase transition processes. They provide important insights into solving of the mineral dissolution problems: the Wheeler-Boettinger-McFadden (WBM) model [30,47], the Kim-Kim-Suzuki (KKS) model [48], Steinbach model [49] and Losert model [50]. The WBM model is derived in a thermodynamically consistent way, which is based on an assumption that each point of the interface is a mixture of coexisting phases with the same composition but different volume fractions [27]. This model works under both sharp-interface condition and finite-interface thicknesses [51,52]. However, the larger interface thickness will lead to unreliable calculation results [53,54,55]. KKS model shows a different definition of the free energy density, which defines the interface as a mixture of liquid and solid phases of different compositions, but with the same chemical potential [56]. For the KKS model, the relationship between model parameters and material properties can be established through the equilibrium and thin interface limit analysis [48]. The Steinbach model is not based on the thermodynamic treatment, but based on the geometric description of interface through the interpolating function of interface curvature. This model is more suitable for a dilute alloy [57]. Losert et al. [50] finally used the similarity of alloys and pure materials to expand the thin interface model by matching variables in pure materials. However, there are two strict assumptions in the model that limit its application (1) the liquidus and solidus lines need to be parallel, and (2) the diffusivity of the solute is constant in the entire region [58].
In applying the PF model, described above, to the moving boundary problem of minerals, it is necessary to understand how to select the interface mobility so that the model can effectively describe the dissolution process. In the literature, there are only a few studies that address this issue. Qin and Bhadeshia [59] proposed that, in a single-component system, the interface mobility is related to the interface velocity and the driving force according to the chemical rate theory. In the case of spinodal decomposition, the interface mobility can be obtained from the diffusion coefficient and thermodynamics. When the model is used to simulate the complex meso-morphological evolution, the interface mobility needs to be determined based on experiments, as also demonstrated in this paper (Section 6.3). Karma and Rappel [25] made a linear approximation of the temperature gradient at the interface and proved that in dealing with the solidification problem of pure melting, the PF parameters can be accurately determined under the thin interface limit. Based on this model, Xu and Meakin [60] developed a phase-field approach for aqueous dissolution/precipitation reactions assuming first order reaction kinetics. The model was validated by a one-dimensional analytical solution of interface motion due to solute precipitation. Two additional terms were added to the diffusion equation, one corresponding to the discontinuity of the solute concentration gradient, at the interface, while the second one represents the net source (or sink) of the solute, coming from the discontinuity in the solute concentration across the interface. In most of the studies, the values of interface mobility are used as empirical or hypothetical ones [61,62,63,64,65,66,67]. Furthermore, few attempts have been made to explain in detail the calculation of the interface mobility and its relation to other physical parameters [51,68,69,70,71]. Therefore, tackling of this difficulty will be one of the innovations of this paper.
In contrast to the reaction kinetics controlled case, here we further validate the PF approach on the experimental results (of NaCl dissolutions) and are focusing mainly on the diffusion limited mechanisms. First, the one-dimensional diffusion-controlled dissolution problem will be simulated using an analytical solution and the classical KKS model, separately. The results will then be compared to clarify the estimation and interaction of the interface mobility with other PF parameters. The effect of solid particle shape on the dissolution process is 2D analysed and validated on literature data for NaCl dissolutions. The PF results are then validated against the data obtained from analysis by the video-microscopy images and compared with the analytical model. Finally, a concluding discussion on the whole article is given.

2. Dissolution Mechanisms

2.1. Types of Dissolution

Chemical dissolution of minerals occurs as a congruent or an incongruent reaction, depending upon the type of a mineral [72]. Congruent dissolution of a solid mineral is a chemical reaction which completely dissolves the mineral and all products of this reaction are dissolved species. An obvious example would be calcite CaCO3 and NaCl [73,74]:
A a B b s aA aq + bB aq
when the primary solid phase is altered and at the same time a secondary solid phase is formed, incongruent dissolution occurs, for example the alteration of albite to gibbsite NaAlSi3O8, or Kaolinite [75,76], which requires a more advanced thermodynamic modelling approaches to be integrated in the PF:
A a B b s cC s + dD aq

2.2. Diffusion-Controlled Dissolution Mechanisms

Figure 1 shows the dissolved diffusion process of soluble minerals based on the diffusion interface. When dealing with the problem of moving boundaries, the conventional approach separates the different phases by a sharp interface. The interface movement is solved by a partial differential equation describing, for example, mass and thermal diffusion equations. These equations have to be combined with boundary conditions of varying values and positions. When some variables (heat flux or concentration) cross the sharp interface, jump discontinuities can occur, making the calculation very difficult. In the PF model, the interface is described as a diffuse interfacial layer with smooth transitions. Thus, the phase transformation is represented by a change in an order parameter ( ϕ ). As shown in Figure 1, the solid phase is represented by “1” while the liquid phase by “0”, hence the order parameter varies continuously between 0 and 1 at the solid–liquid interface.
As the congruent dissolution process occurs, the solute is gradually transferred into the solution, the length of the solute base phase decreases, and the solid–liquid diffuse interface gradually moves toward the inside of the solute base phase. The solute concentration in the initial solution is c L 0 , while the solute concentration at equilibrium is c Le . The solute concentration in the solid is kept constant when the diffusion phenomenon in the solid is not taken into account. The change of solute concentration in solution with time is related to its position. The solute concentration ( c L ) increases with time away from the solute matrix phase; solute concentration ( c IS ) decreases with time near the solute matrix phase. The solute concentration in between ( c I ) is in a state of dynamic increase or decrease. x Se , x S 0 , x Le and x L 0 indicates the positions corresponding to the above solute concentrations.

3. Mathematical Methods

3.1. Analytical Solutions

A following 1D planar analytical description of a diffusion-controlled dissolution for phase transformation is considered, where the solid is immersed in a (semi-)infinitive liquid solution. The diffusion equation is a parabolic partial differential equation, which is expressed as follows:
c x , t t = D L 2 c x , t ,
where D L is the diffusion coefficient, c ( x , t ) is the concentration at location x and time t , subject to the conditions:
c | x = R ,   t = c Le ( 0 < t ) ,
c | x ,   t = 0 = c L 0 x R ,
where x = R is the position at the solid-liquid interface, c L 0 and c Le represents the initial concentration and the equilibrium concentration of one component in the liquid phase.
At the solid–liquid interface, the following independent flux balance condition must be fulfilled:
c S c Le d R d t = D L c r | x = R ,
where c S is the concentration in solid phase which is taken as a constant.
The exact analytical solution for the field is [6]:
c x , t c M = c Le c L 0 e r f c x R 0 / 2 D t e r f c λ .
The interface position at current time can be expressed as
R = R 0 λ I D t ,
where R 0 denotes the value of R at the time t = 0 , while
λ I = 2 λ ,
where λ is given by:
π λ exp ( λ 2 ) e r f c λ = β / 2 ,
where β = 2 c Le c L 0 / c S c Le .
Different from the planar solid where exact solution is available, only approximately analytical solution model for the diffusion-controlled dissolution of the spherical solid has been found. The stationary-interface approximation is expressed as [6]:
c x , t c M = c Le c L 0 R x e r f c x R 2 ( D L t ) 1 / 2 ,
where the current interface position is R 2 = R 0 2 β D L t ; β as defined in Equation (10).
The implicit expression for the particle radius ratio y ( y = R / R 0 ) with respect to time is defined as follows:
ln [ y + 2 p ( τ ) 1 / 2 y + τ ] + 2 p ( 1 p 2 ) 1 / 2 arctan ( 1 p 2 ) 1 / 2 y τ 1 / 2 + p = 0 ,
where,
τ = α 2 t R 0 2 ,
α 2 = β D L ,
p 2 = κ 4 π ,

3.2. The Phase-Field (PF) Method

The total free energy of the thermodynamic system drives changes in the microstructure of materials only when the total free energy changes from a high chemical potential (or a higher free energy) state to a low chemical potential (or a lower free energy) state to eventually attain an equilibrium. The total free energy F of the system is a function of the solute concentration c and the phase parameter ϕ and expressed as:
F c , ϕ = F loc + F int = V f loc c , ϕ + k 2 | ϕ | 2 d V ,
where F loc is the local free energy of the system, F int is the interfacial energy, and k is the gradient energy coefficient. In order to simplify the numerical calculation, the molar concentration of the solute is normalized by the molar concentration of the solid c S , that is, c = c / c S . The molar concentration of the solid is defined as the density of the solid divided by its average molar mass [77]. Each point in the entire domain is a mixture of two phases with different chemical compositions. The Gibbs free energy expression, in the KKS model, has been widely employed in solidification mechanisms of binary alloys [78,79], in addition to the recent extension to the field of electrochemical corrosion [61,68]. The mechanism of the corrosion reaction is similar to that of the dissolution reaction, i.e., both are phase transformations triggered by the diffusion of ions. Hence, the double well potential (i.e., Gibbs free energy density) has two minima at ϕ = 0 , ϕ = 1 and a maximum at ϕ = 0.5 (middle of the interface). Based on this theoretical basis, the present model identifies the local free energy f loc ( c , ϕ ) as a fractionally weighted average of the solid f S ( c S ) and liquid free energies f L ( c L ) , and imposes a double-well potential ω g ( ϕ ) as follows:
f loc c , ϕ = h ϕ f S c S + 1 h ϕ f L c L + ω g ϕ ,
where the interpolation function h ( ϕ ) is built as h ( ϕ ) = 2 ϕ 3 + 3 ϕ 2 , and ω is the height of the double-well potential function given by g ( ϕ ) = ϕ 2 ( 1 ϕ ) 2 .
The free energy density of the solid and liquid phase is approximated by a parabolic function with the same curvature A as follows:
f S c S = A ( c S c Se ) 2 ,
f L c L = A ( c L c Le ) 2 ,
where c Se = c S / c S = 1 and c Le = c sat / c S are the solute concentrations at the normalized equilibrium of the solid and the liquid phase, respectively.
Complementary condition indicates that the phase concentrations are constrained such that the chemical potentials of each phase are equal:
f S c S c S = f L c L c L .
The solute composition in the interface area is the fraction-weighted average of the liquid and solid composition, and the same formula is used for the diffusion coefficient, as shown below:
c = h ϕ c S + 1 h ϕ c L ,
D = h ϕ D S + 1 h ϕ D L ,
The interfacial evolution is controlled through coupled conserved and non-conserved dynamics. Particularly, the Allen-Cahn equation is used to describe the temporal evolution of the non-conserved variable ϕ . However, the diffusion equation is applied for solving the evolution of the conserved parameter c:
ϕ x , t t = L δ F δ ϕ = L f ϕ ϕ k Δ ϕ ,
where L is the PF mobility:
c x , t t = D 2 c x , t ,
where D is the diffusion coefficient.
The energy of the system is minimal when it reaches equilibrium. In order to find the PF profile ϕ 0 ( x ) and the composition c 0 ( x ) at equilibrium state, Kim, et al. [48] deduced a one-dimensional solidification problem with boundary conditions ϕ 0 | x = 1 (solid) and ϕ 0 | x + = 0 (liquid). Since the equilibrium state means the vanishing of the driving force, the PF profile ϕ 0 ( x ) should satisfy the following Equation:
δ F δ ϕ 0 = f ϕ 0 ϕ 0 k Δ ϕ 0 = 0 ,
Thus, by combining with the double well equation, the PF profile can be expressed as:
ϕ 0 x = 1 2 1 tanh x ω 2 k .
Then, the composition is:
c 0 x = h ϕ 0 x c S e + 1 h ϕ 0 x c L e .

4. Problem Description and Model Tests

In this section a 1D congruent dissolution case study is presented selected as benchmark for verifying the soundness and capability of the proposed PF procedure.

4.1. Benchmark with Analytical Model for One-Dimensional (1D) Congruent Dissolution

The model consists of a one-dimensional domain with a size of 20 mm. The solid and liquid domains have a 3:17 ratio (see Figure 2). This is chosen to ensure that the length of the solution must be long enough for diffusion to take place in a system whose domain is considered to be semi-infinite.
In the initial aqueous solution concentration c L 0 is specified as 0.1 mol/m3. The concentration c S of the solid was constant at 1 mol/m3. The equilibrium concentration c Le was maintained at 0.4 mol/m3 at the fluid-solid interface. The diffusion coefficient of the solute in the liquid D L is taken as 1.0 × 10⁻⁹ m2/s, while the diffusion of the solute in the solid D S is 1.0 × 10⁻¹⁵ m2/s. Neumann conditions (zero flux) were applied on the right and left side of the domain boundary. The parameters used in this study and their values are listed in Table 1.

4.2. Simulation Case Study Based on Available Measured Experimental Data of Mineral Particle Dissolution

Most of the available experimental data on solid dissolution in the literature focus on recording the evolution of solute concentration [11,14,80,81] or dissolved solid mass over time, and do not explicitly observe the movement of the solid–liquid boundary [80,81]. In some experiments, the dissolution process was influenced by convection with stirring [82,83,84,85]. In this sense, sodium chloride (NaCl) is one of the most common minerals: its congruent dissolution mechanism and the corresponding reaction thermodynamics and kinetics are well documented in the literature [74,86,87,88,89,90,91]. However, studies addressing solid–liquid boundary regression due to diffusion-controlled dissolution have mainly tended to focus on the nanoscale [92,93,94].
The study of Quilaqueo and Aguilera [95] is one of the few studies that provides detailed experimental dataset to be used for the experimental validation of the PF numerical models. They performed image analysis by coupling a digital camera to a stereo microscope to obtain microscopic images of the dissolution process. Recording started by placing a single NaCl particle in 500 μL of water without stirring at 20 °C. The time profile of dissolution was obtained by calculating the projected area of the single crystal as a function of dissolution time from the video microscope image.
Based on these experimental data, one-dimensional simulations of the dissolution process of a single salt particle performed, in a spherical coordinate system, and two-dimensional simulations of the dissolution process of three different shapes of NaCl particles, namely round, ellipsoidal and irregular, have been performed by using the PF model. Neumann no-flux boundary conditions are applied for 1D simulation. Periodic boundary conditions are used for 2D simulations. The thin interface limit is supported by the chosen experimental case of the highly soluble mineral crystals, which can be considered as non-porous. This results in negligible solid-liquid thickness (at the mesoscopic scale) and it has been considered in this paper. The employed parameters are summarized in Table 2. For easier implementation of energy equations at microscale, all length dimensions were normalized by the solution radius and energy terms normalized by A (see Appendix B).

5. PF Modelling Methodology and Numerical Implementation

5.1. Summary of Modelling Assumptions

In the analytical solution and the PF model, following simplifying assumptions are made:
  • The NaCl particle dissolves isotropically;
  • The diffusion coefficients of aqueous species in solids and in solution are constants, respectively;
  • The diffusion of all aqueous species is expressed in terms of a single ionic concentration;
  • The solubility of NaCl in solution is independent of particle size.

5.2. Parameterization

The relationships between material properties (interface thickness l 0 and interface energy σ ) and PF parameters (coefficient of PF gradient k and double-well potential ω ) are discussed in Appendix A.1. The derivation of the interface mobility L , under the thin-interface thickness condition, is shown in Appendix A.2. The curvature of the free energy density function A can be determined from the Gibbs free energy, i.e., Δ G (Appendix A.3.).

5.3. Parameter Normalization

Normalization of the model parameters is one of the important steps of data pre-processing. A series of input values are normalized to the range [0, 1] according to Appendix B, in order to let models converge effectively.

5.4. Finite Element Implementation

Numerical implementation of the PF model is carried out by using finite element method in the framework of multiphysics object-oriented simulation (MOOSE) environment [28]. Transient solver with preconditioned Newton’s method was used. In this case, the full and accurate Jacobian was calculated. The backward Euler algorithm was employed. Adaptive time stepping was used to improve computational efficiency. The time step would grow or shrink according to the number of iterations taken and needed to obtain a converged solution in the last converged step. The maximum number of nonlinear iterations per time step was also set to provide optimal solution efficiency. For 2D simulation, the triangular element type was chosen to mesh the geometry.
In addition, an adaptive mesh refinement (AMR) was used [97]. Based on the error estimated from the FEM results, the global and local mesh errors were calculated, and then the mesh size was automatically adjusted to the changing morphology of the grain boundaries at each time step. This is very effective for the numerical solution of partial differential equations in regions of arbitrary shape. In order to ensure numerical stability and simulation accuracy, at least 5 nodes on the diffusion interface were used to describe the boundary morphology, while coarser grids were used for solutions and solids that were far from the boundary (Figure 3). This does not only provide an accurate representation of the boundary evolution, but also improved the computational efficiency. The relative and absolute error tolerance was set to 10−8.

5.5. Central Processing Unit (CPU) Computation

The analytical experiments were performed using an Intel Core i7-6500U central processing unit (CPU) 2.5 GHz with 8 GB of RAM and MATLAB R2017a (64-bit). For the PF computation, a parallel computing was achieved by using Open Multi-Processing (OpenMP 42.0.51) on a High Performance Computer.

6. Results and Discussion

6.1. PF Validation against Analytical Solution for a Dissolution of Planar Mineral

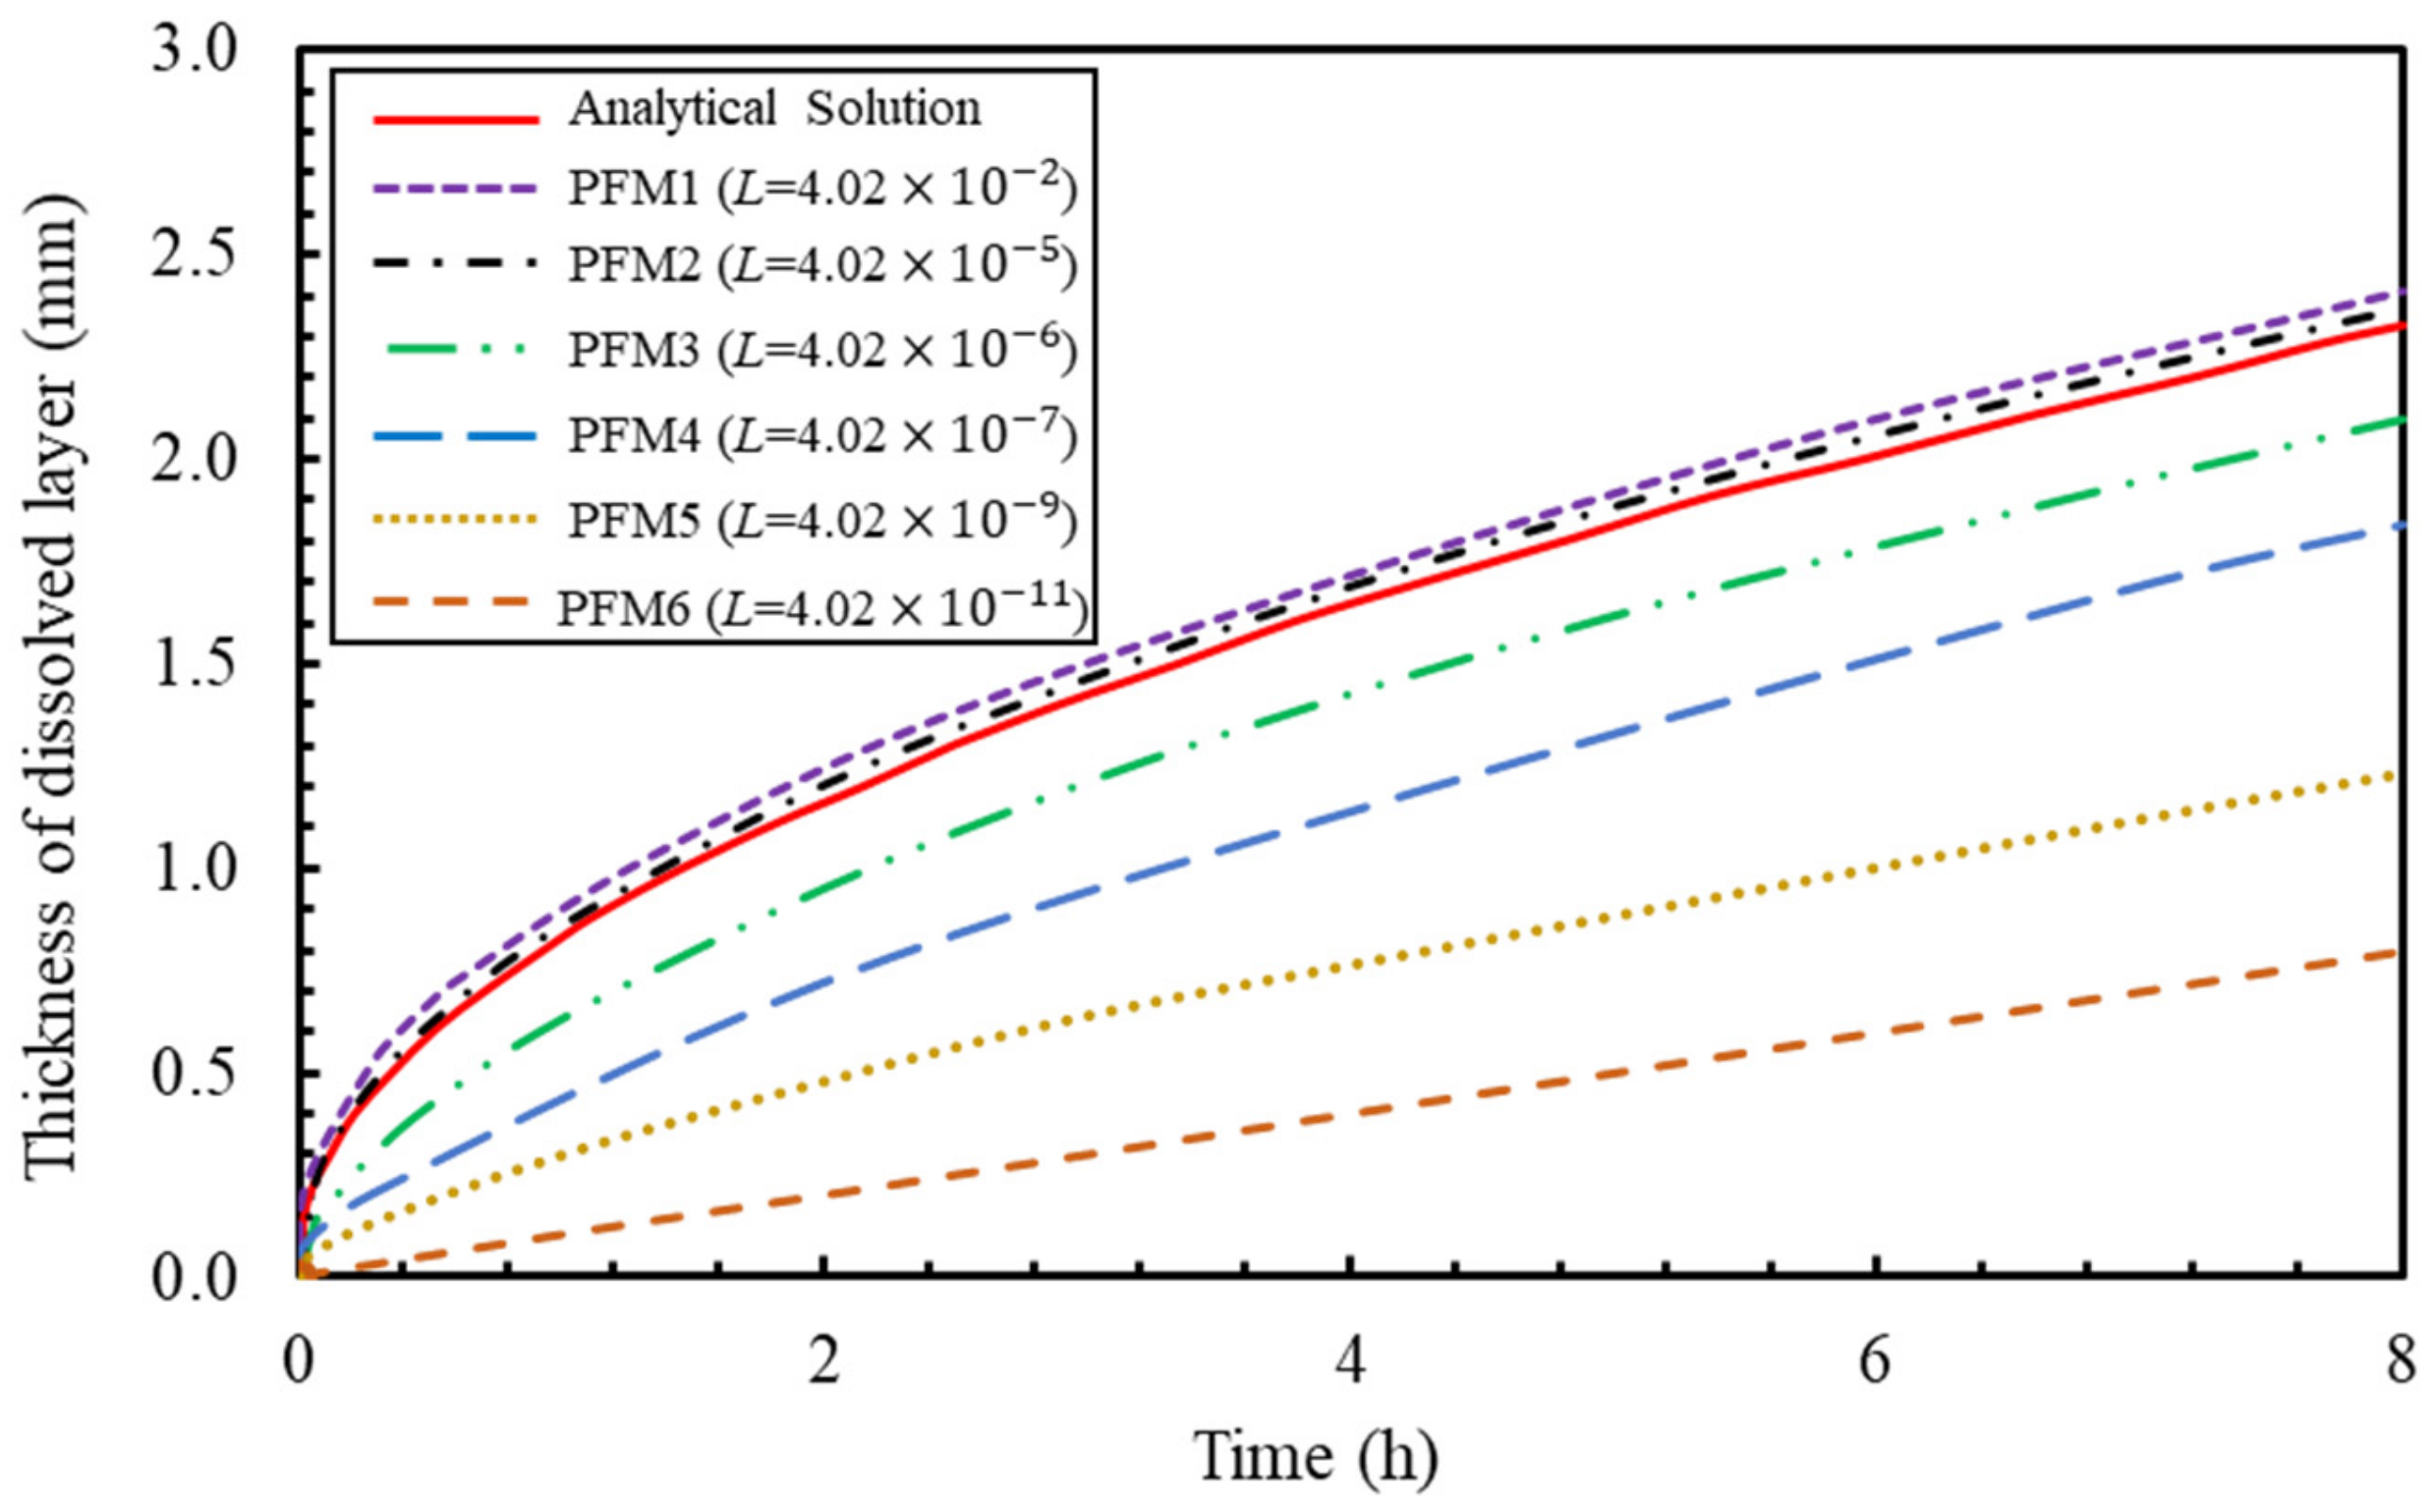
Under diffusion-controlled dissolution conditions, if the initial thickness of the diffuse interface ( l 0 ) is known, the interface mobility L can be determined using Equation (A10). Due to the lack of relevant experimental data upon the values of l 0 , a parametric study of L was carried out. Under the assumption of a thin interface condition [48], the value of l 0 should be taken much smaller than the minimum radial dimensions of the initial solid phase; however, from a computational point of view, it is expected that the thickness of the interface has to be as large as possible in order to keep the interface from being overly densely meshed, which increases the computational effort. Therefore, three cases of initial interface width, i.e., 1 × 10⁻⁸ (PFM1); 1 × 10⁻⁵ (PFM2) and 1 × 10⁻⁴ (PFM3), were tested, corresponding to 0.0003%, 0.33% and 3.33% of the initial length of the solid phase. In addition, there must be at least 5 to 10 grid points in the interface area to ensure the stability of the numerical calculation and the reliability of the results [28]. Three cases of V 0 (1 × 10⁻⁶ (PFM4); 1 × 10⁻⁸ (PFM5) and 1 × 10⁻¹⁰ (PFM6)) were tested.
Figure 4 shows a comparison between the analytical (diffusion limited) model and six cases of PF models, where the reaction rates are slower than in case of diffusion control. As l 0 decreases, L increases (as they are inversely related by Equation (A10)), causing a faster dissolution reaction, till reaching a limit defined by a diffusion control. At 8 h, PFM1 dissolves at a thickness 1.15 times greater than that of PFM3. The result of PFM2 is in good agreement with that of the analytical model. It can also be seen that the slope of the dissolution curve becomes progressively smaller with dissolution time due to the diffusion-controlled dissolution, i.e., the overall rate of dissolution slows down as it is governed by the diffusion flux and thus dependent on the concentration gradient that reduces with saturation of the solution. However, the (slow) reaction-controlled mechanism (see curves PFM4, PFM5 and PFM6) approaches linearity as the V 0 decreases, and the lower the V 0 , the slower the dissolution speed. The above results show that the PF model developed is capable of describing both the diffusion-controlled and the reaction-controlled dissolution. Under the thin interface limit condition, the agreement between the analytical (diffusion-controlled) results and the PF model for the diffusion-controlled dissolution is in satisfactory agreement with the converged solution (PFM2).
A slight overestimation by the PFM1 model may be attributed to the used approximation (Equation (A10)) to numerically approach the diffusion-limited case. In this approximation, V 0 is approximated as D L / l 0 (where D L is the diffusion coefficient of the solute in the solution). The slight difference could also be the result from small incompatibility issues between the employed thermodynamic parameters, namely the used NaCl interfacial energy in PF model, and the NaCl solubility constant ( p ). Overall, we argue that the obtained agreement is overwhelming considering that no fitting calibration of the parameters has been performed.
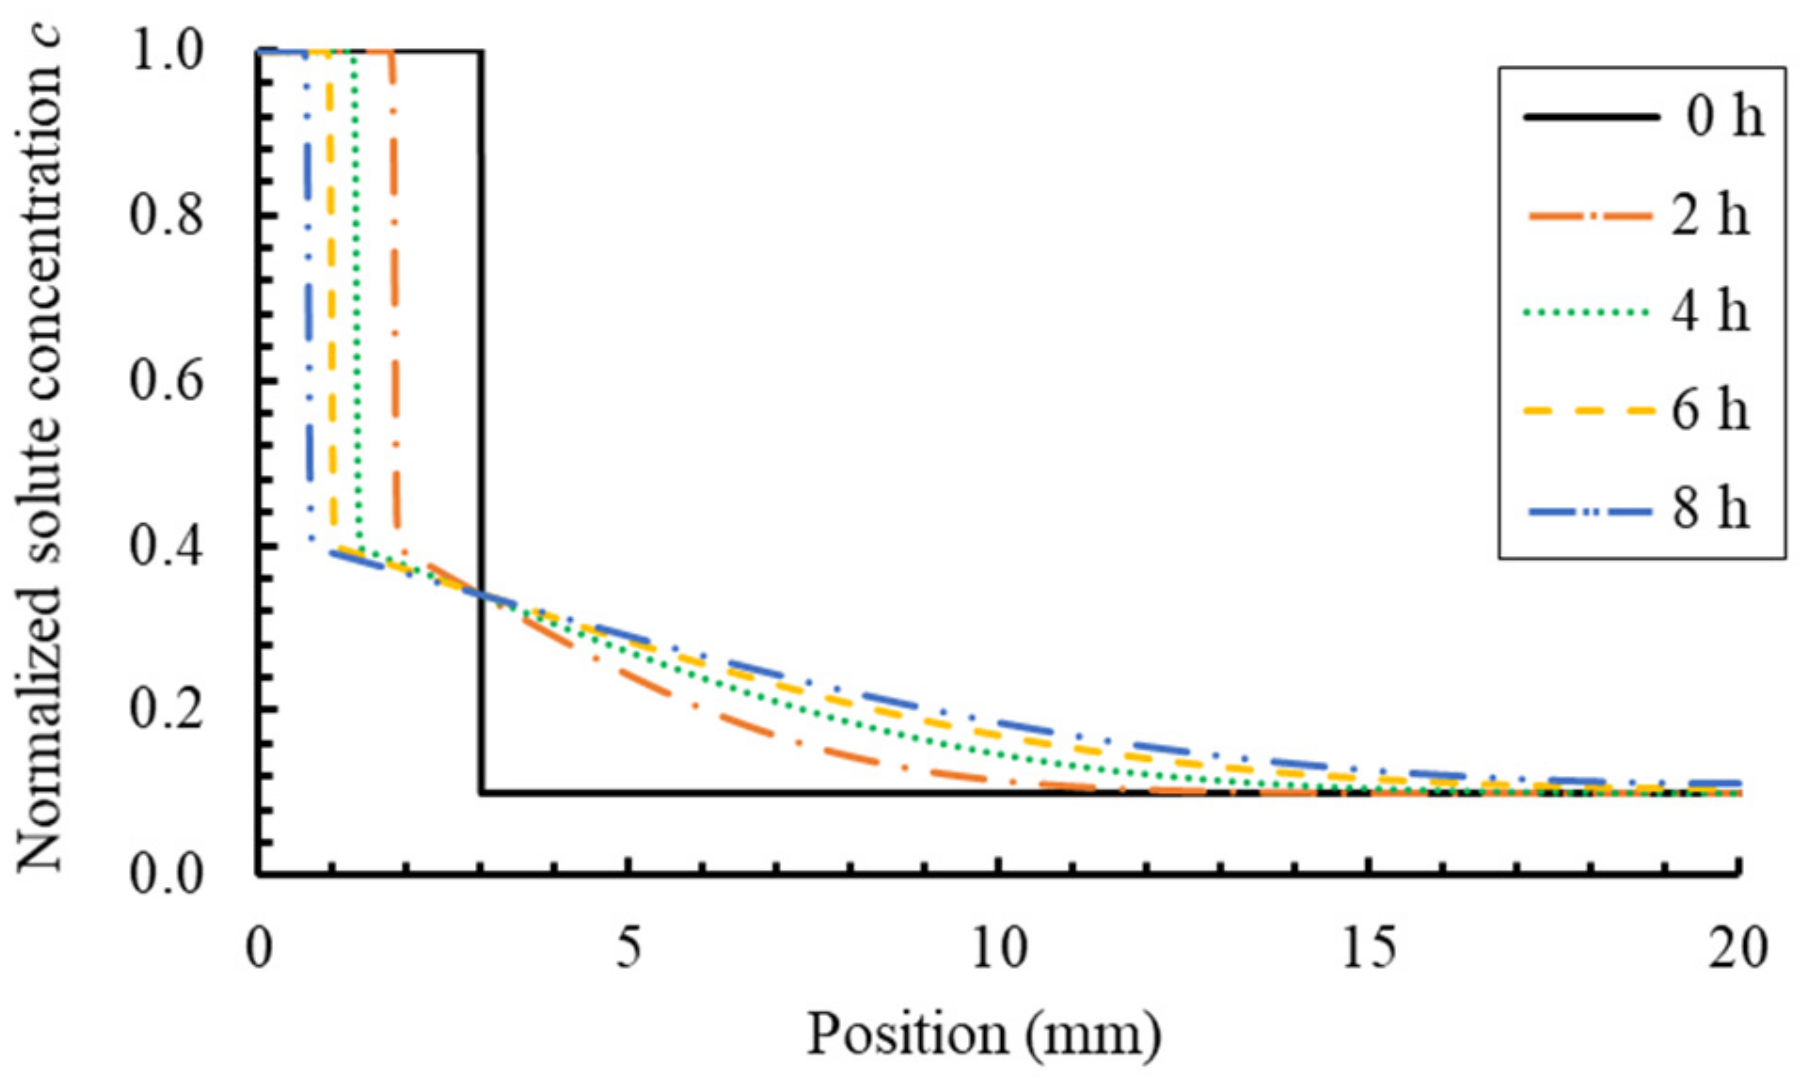
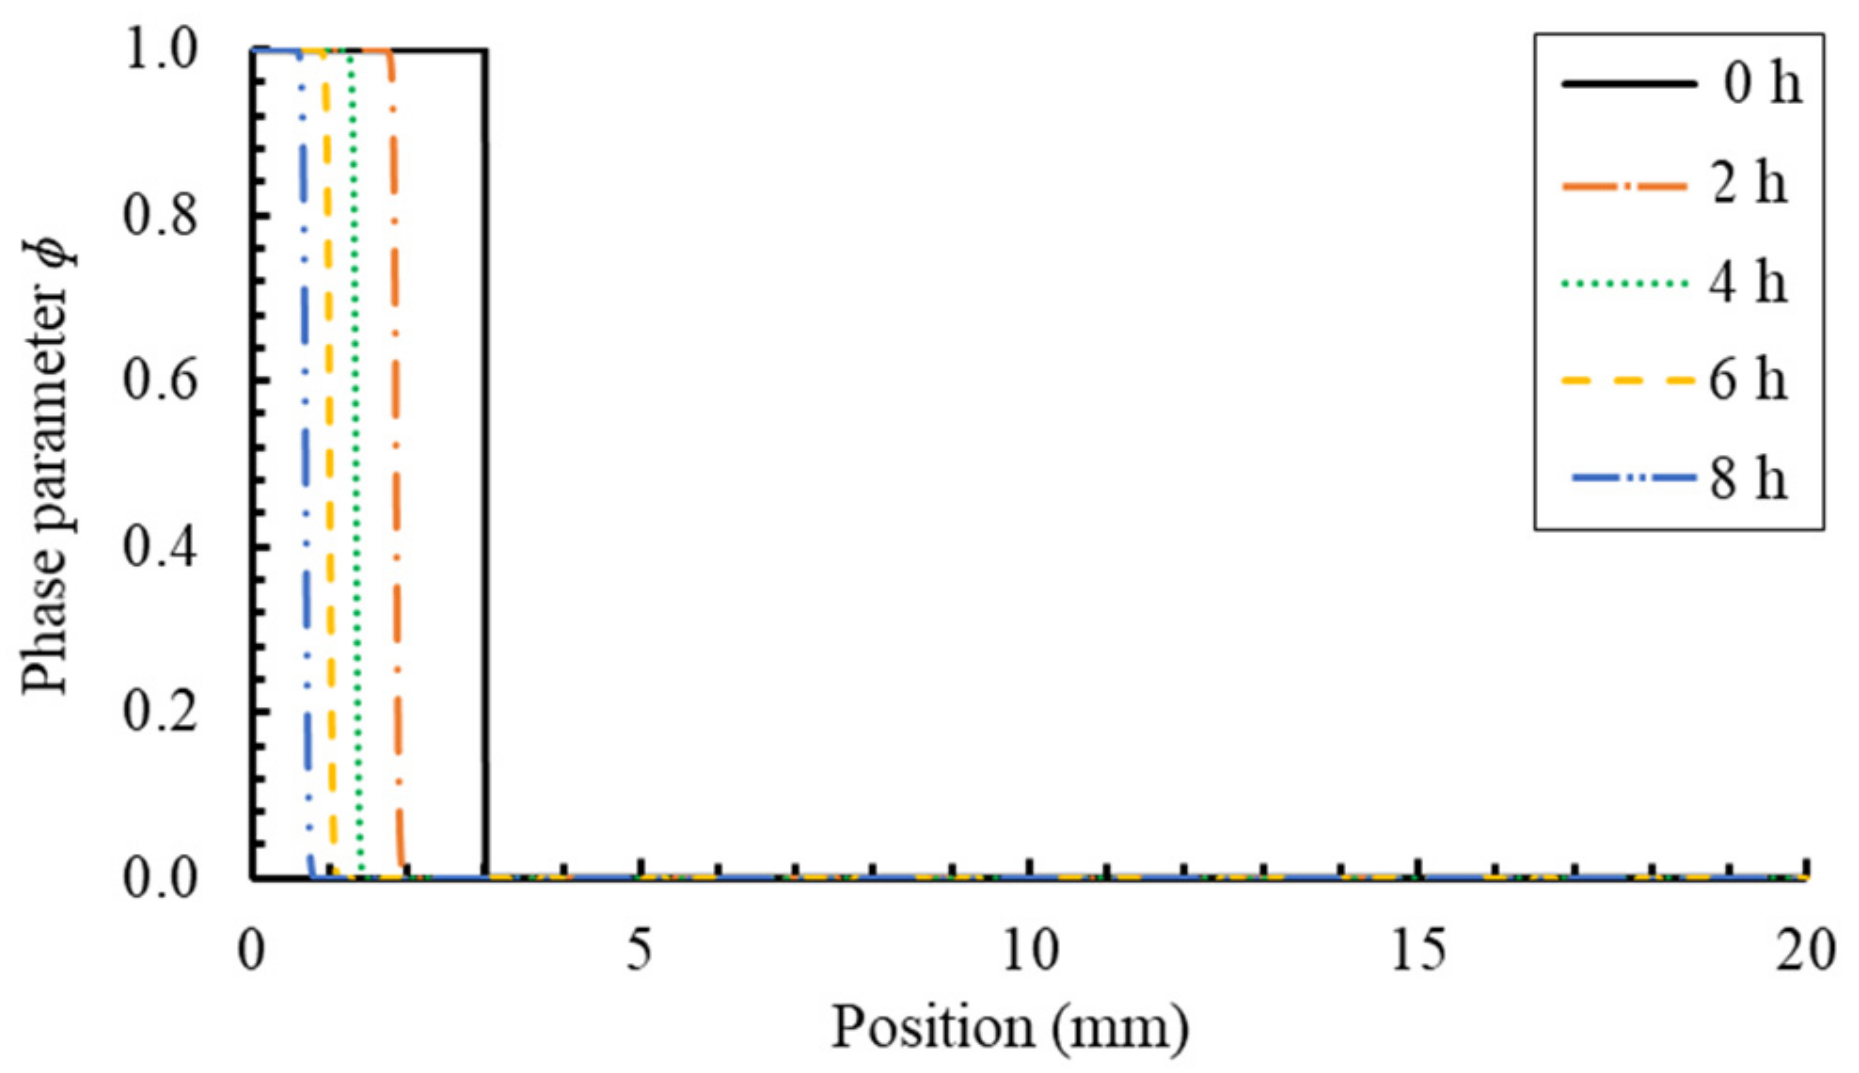
Figure 5 shows the spatial distribution of solute normalised concentration over time. As solid dissolution starts, the concentration of solution c L at the diffusive solid–liquid interface rapidly reaches saturation concentration (i.e., c Le equilibrium state), while the solute normalised concentration in the solid phase keeps constant at 1 (i.e., at initial concentration). The solutes form a diffusion layer at the thin solid–liquid interface and continue to enter (diffuse) into the bulk solution. This results in a gradual decrease in the width of the solid phase. The concentration of solutes in the solution is gradually increasing, and the increase of the concentration near the solid–liquid interface is particularly significant due to diffusion limited transport through the solution. In turn the concentration of solute smoothly decreases to zero from the interface zone to the right end of the solution. This confirms also that the dissolution is carried out in a system that is regarded as semi-infinite space, which is only controlled by a diffusion mechanism without any significant effects of the imposed boundary conditions (which deviate from the idealized semi-infinitive case). Figure 6 shows the movement of the interface over time. As the dissolution proceeds, the interface gradually moves toward the solid phase. It can be seen from the reduced width of the solid phase that the speed of dissolution starts faster and then slows down, again due to the limited diffusion process of the solute through the exposure solution.

6.2. The Effect of Mineral Shape: Dissolution Simulation by Two-Dimensional (2D) PF Model

Irregular particles can be simplified by spherical shapes provided certain conditions are met. Numerical simulations are then performed using the spherical symmetry and coordinate system, reducing the model to only one space dimension (1D model). However, some studies have shown, both theoretically and experimentally, that the particle shape and surface roughness may affected the dissolution rates [98,99,100,101,102]. Therefore, before adopting the spherical simplified 1D model for NaCl crystals in this study, the effect of particle shape on the dissolution rate was analysed. In this way one can determine whether the simplification of the spherical shape for NaCl particle having some circularity factors (0.71 ± 0.06) as in used literature data [95] is reasonable.
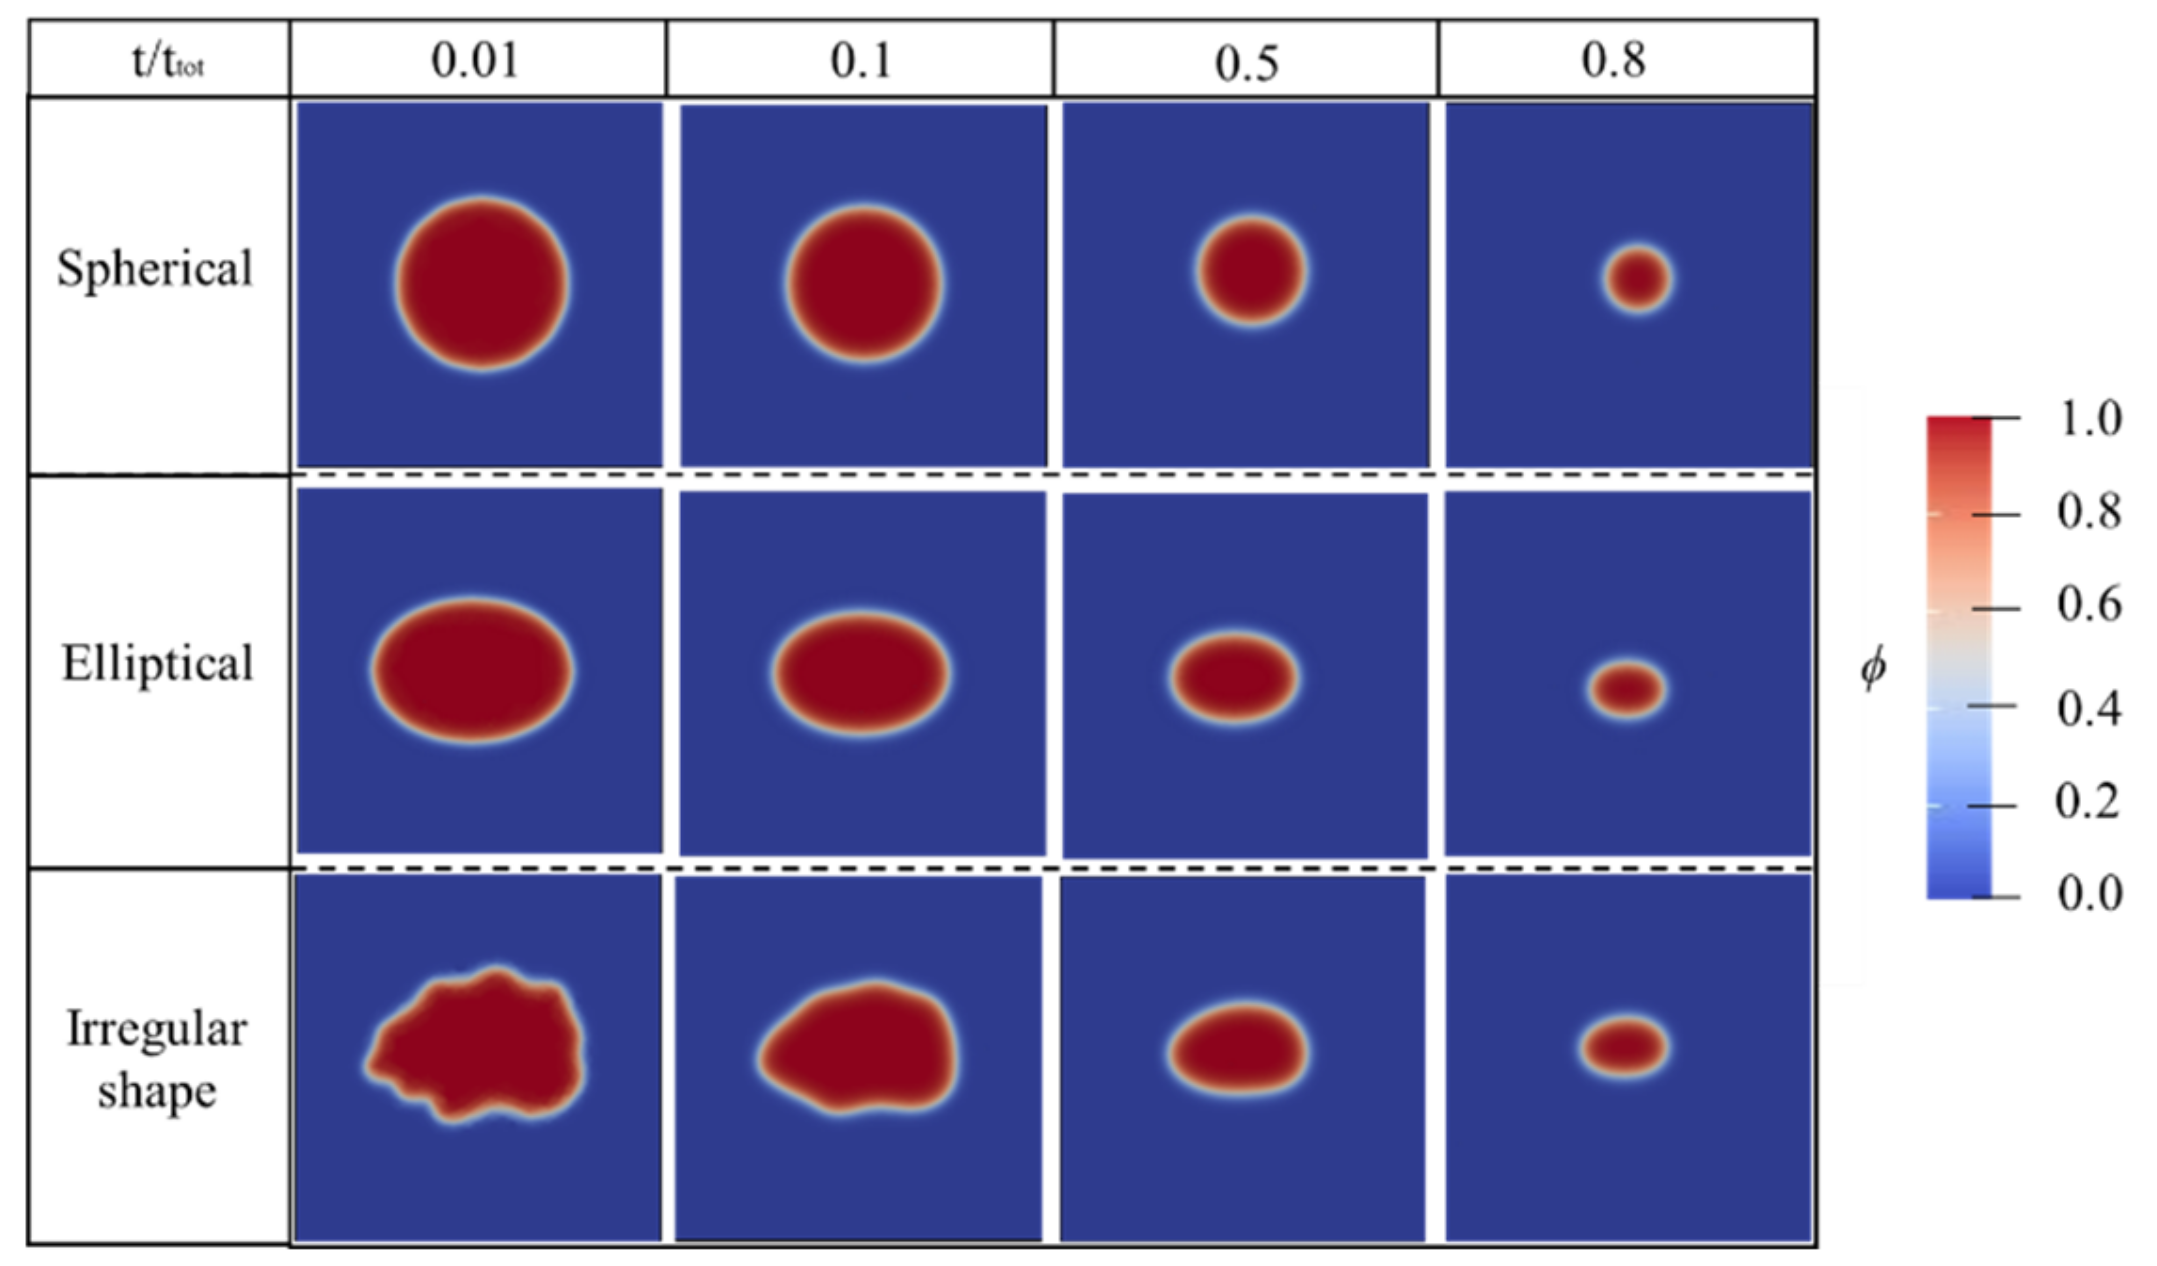
Therefore, Figure 7 shows the 2D dissolution simulation results over time for spherical, elliptical and irregular shapes but with the same area. Qualitatively, the sharp edges of irregular shapes gradually disappear during the initial stages of dissolution, and the curvature decreases until they are completely rounded. The ratio of the major axis to the minor axis of the ellipse gradually decreases and develops towards the circular direction. The radius of the circle decreases gradually and the curvature remains constant. It can be seen that the dissolution under all shapes follows the process of spheroidization. The edges of the particle become smoother during dissolution. As the dissolution reaction proceeds, the morphological differences between the particles with different shapes become smaller.
The reason for this trend is that among closed geometries of equal area, circles have the smallest circumference. This means that the total interfacial free energy of the solid-liquid is minimal. Irregularly shaped solids have a high solid–liquid total interface free energy due to their uneven boundaries. A high interfacial energy means a high total free energy of the system. The system always tends to decrease the total free energy, this being an important factor in determining the mineral shape during dissolution. The area of the solid–liquid interface tends to decrease, which causes the flange at the solid–liquid interface to disappear and eventually to become round.
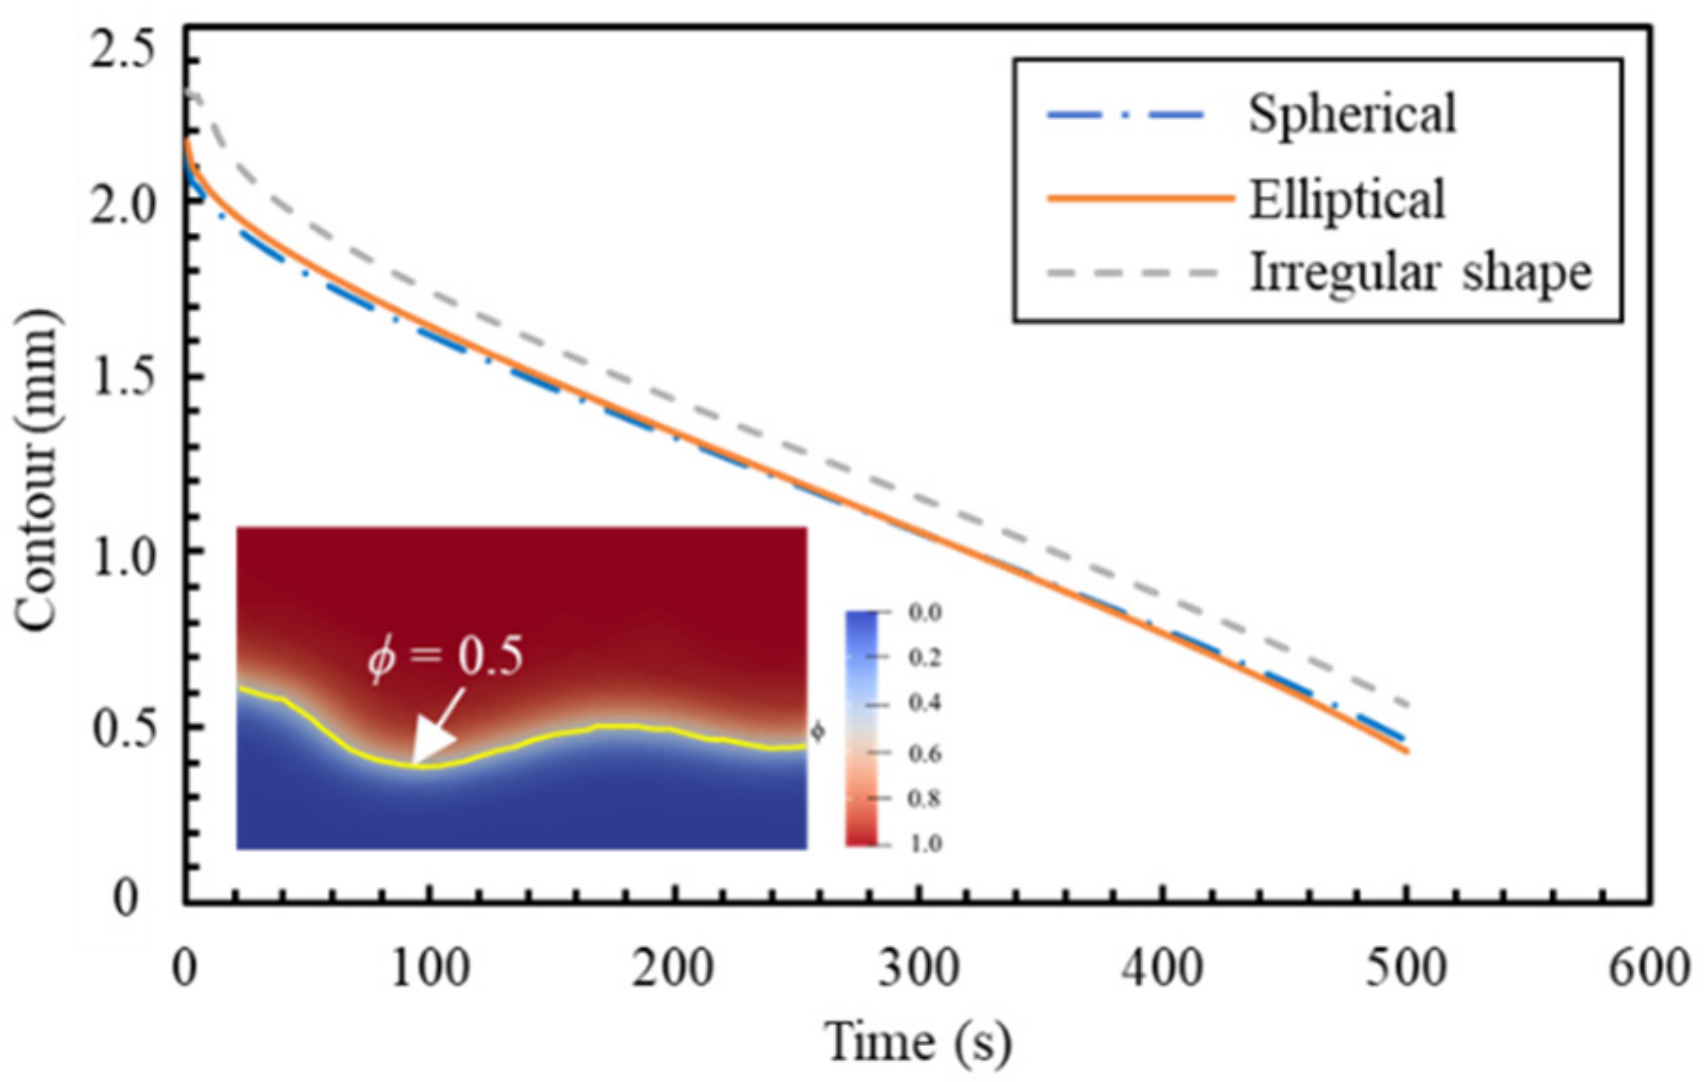
Since the solid–liquid interface is described in the PF model as a diffuse interface, with a certain width, it is difficult to describe the interface length in terms of the absolute perimeter of the solid phase. However, in order to characterize the change in the surface morphologies of crystals for different shapes with time, the contour length of ϕ = 0.5 is taken to approximate the solid-phase perimeter. Figure 8 shows that at the initial condition, the irregular mineral grain has the maximum interfacial length. As the dissolution reaction proceeds, the interfacial length gradually decreases and the curves of the ellipse and circle almost coincide.
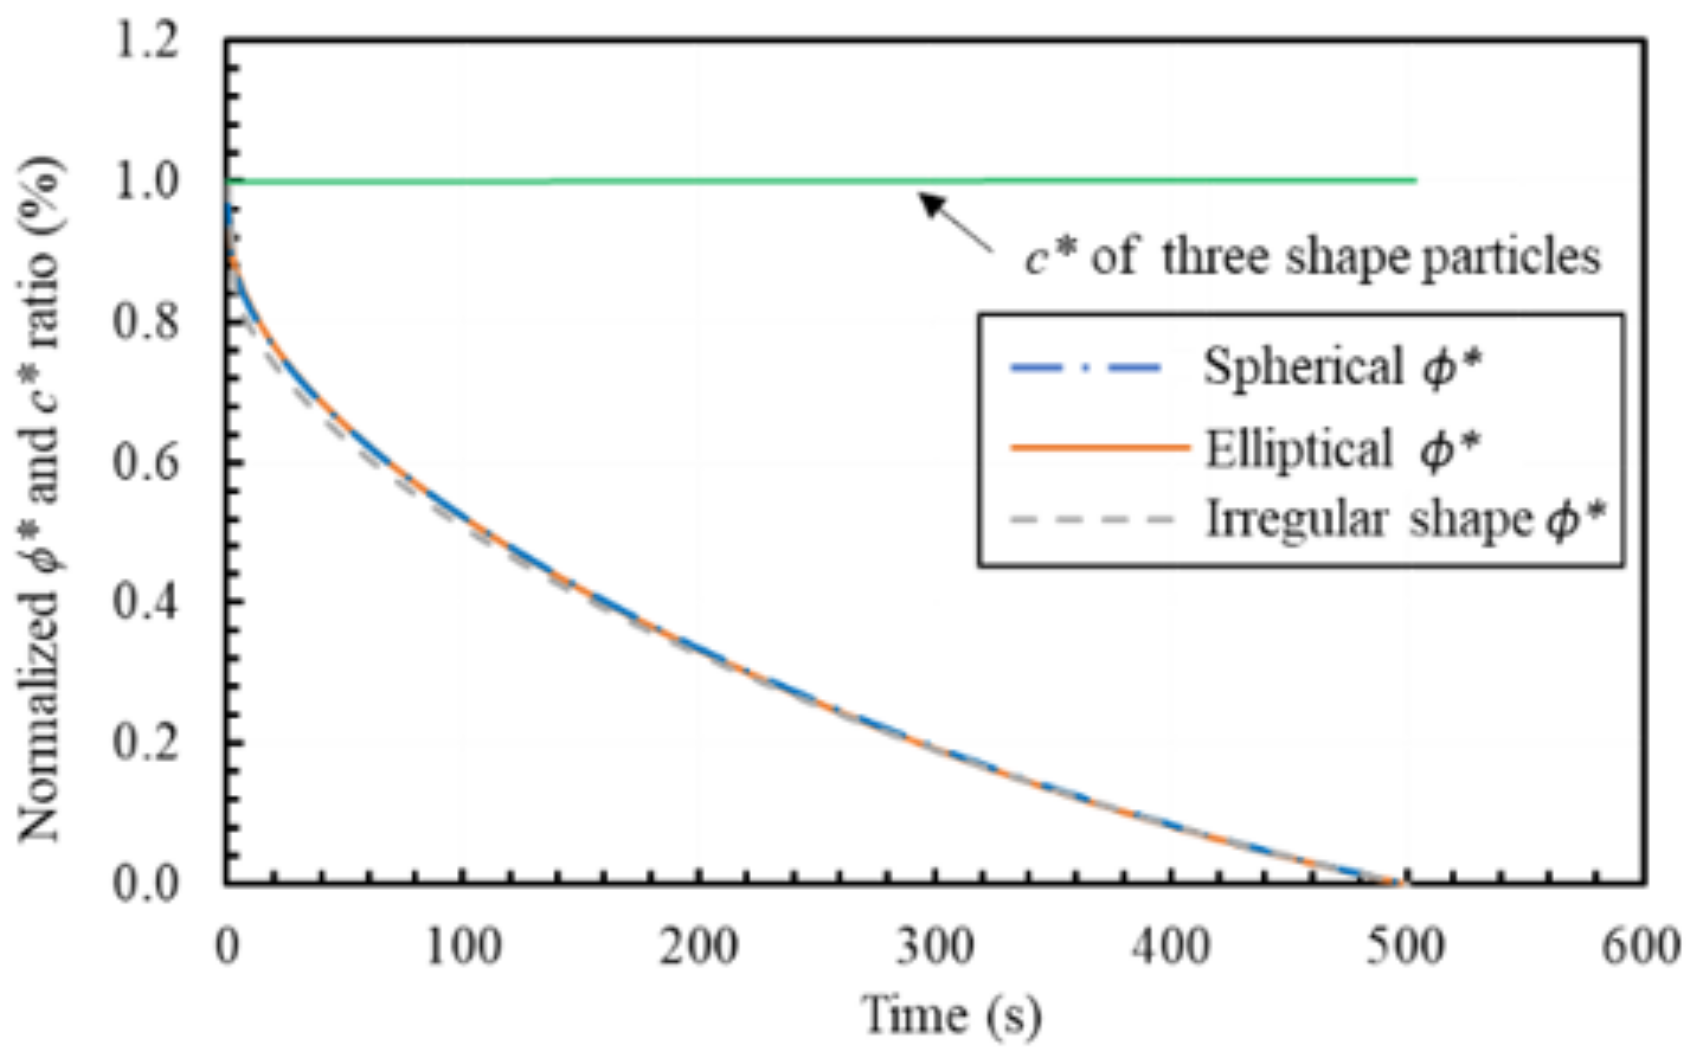
The normalized phase ratio ϕ * is defined as ϕ * = ϕ t ϕ m i n / ϕ m a x ϕ m i n , being ϕ t the integration of the phase at the time t, over the domain, while ϕ m i n and ϕ m a x are representing the min and max integration of the phase, respectively (for c as well). The profile of the normalized phase ratio physically represents the projected area of particles. It can be seen from Figure 9 that the projected area of the three shapes of particles decreases with time, while the normalized concentration ratio ( c * ) keeps constant, which proves the conservation of mass for solute transport. The slope of ϕ * becomes progressively smaller. This is because as the solid phase dissolves, the interfacial area decreases. The contact area between the solute source and the diffusion-solution zone is getting smaller. This results in a decreasing solute flux to the solid surface, which leads to a progressively slower dissolution rate. It can also be seen from this figure that the ϕ * profile of the circles and ellipses basically overlap. The dissolution rate of irregular shapes before 200 s is slightly faster than that of circles and ellipses, while after 200 s, the three curves overlap and dissolve completely at the same time. This is because the perimeter of the irregular shape is much larger than that of the circles and ellipses, which exhibits a faster rate at the beginning of dissolution. As the dissolved shape tends to be round with the lowest interfacial energy, the circumference between the three shapes becomes similar (Figure 8). Therefore, in the later stages of dissolution, the dissolution curves of the three shapes are coincident.
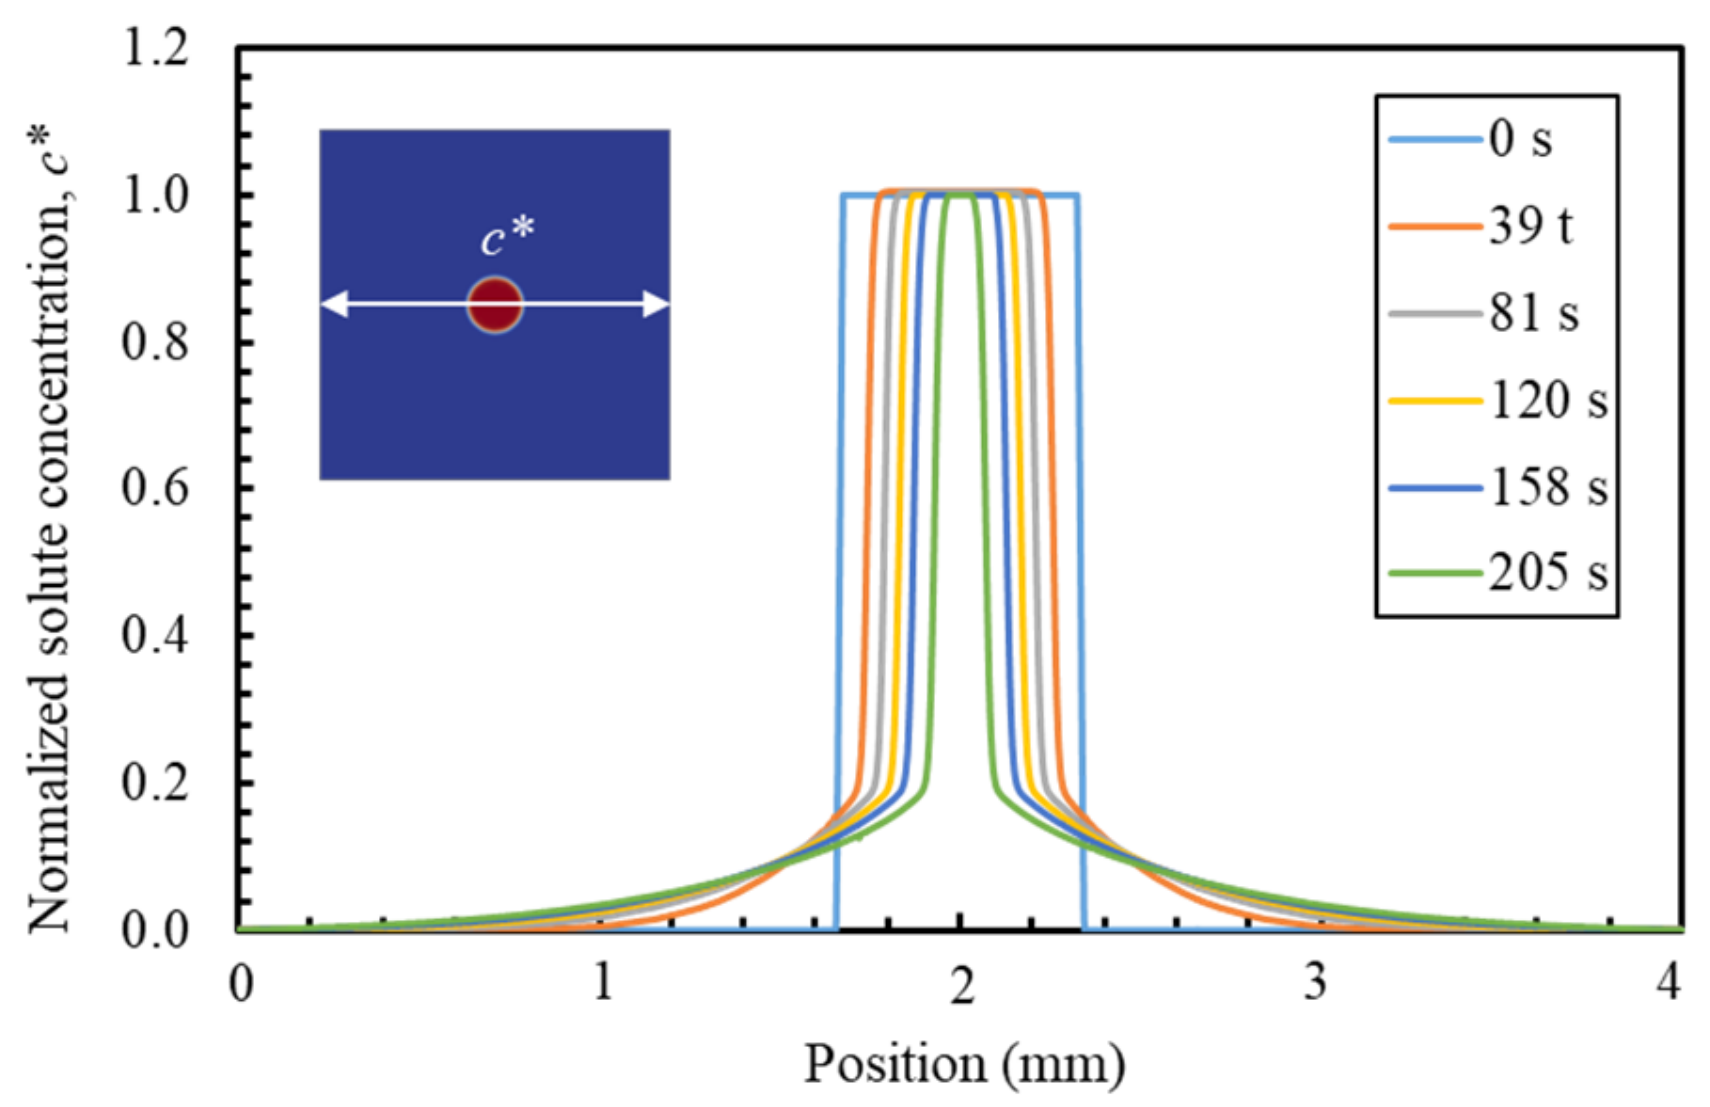
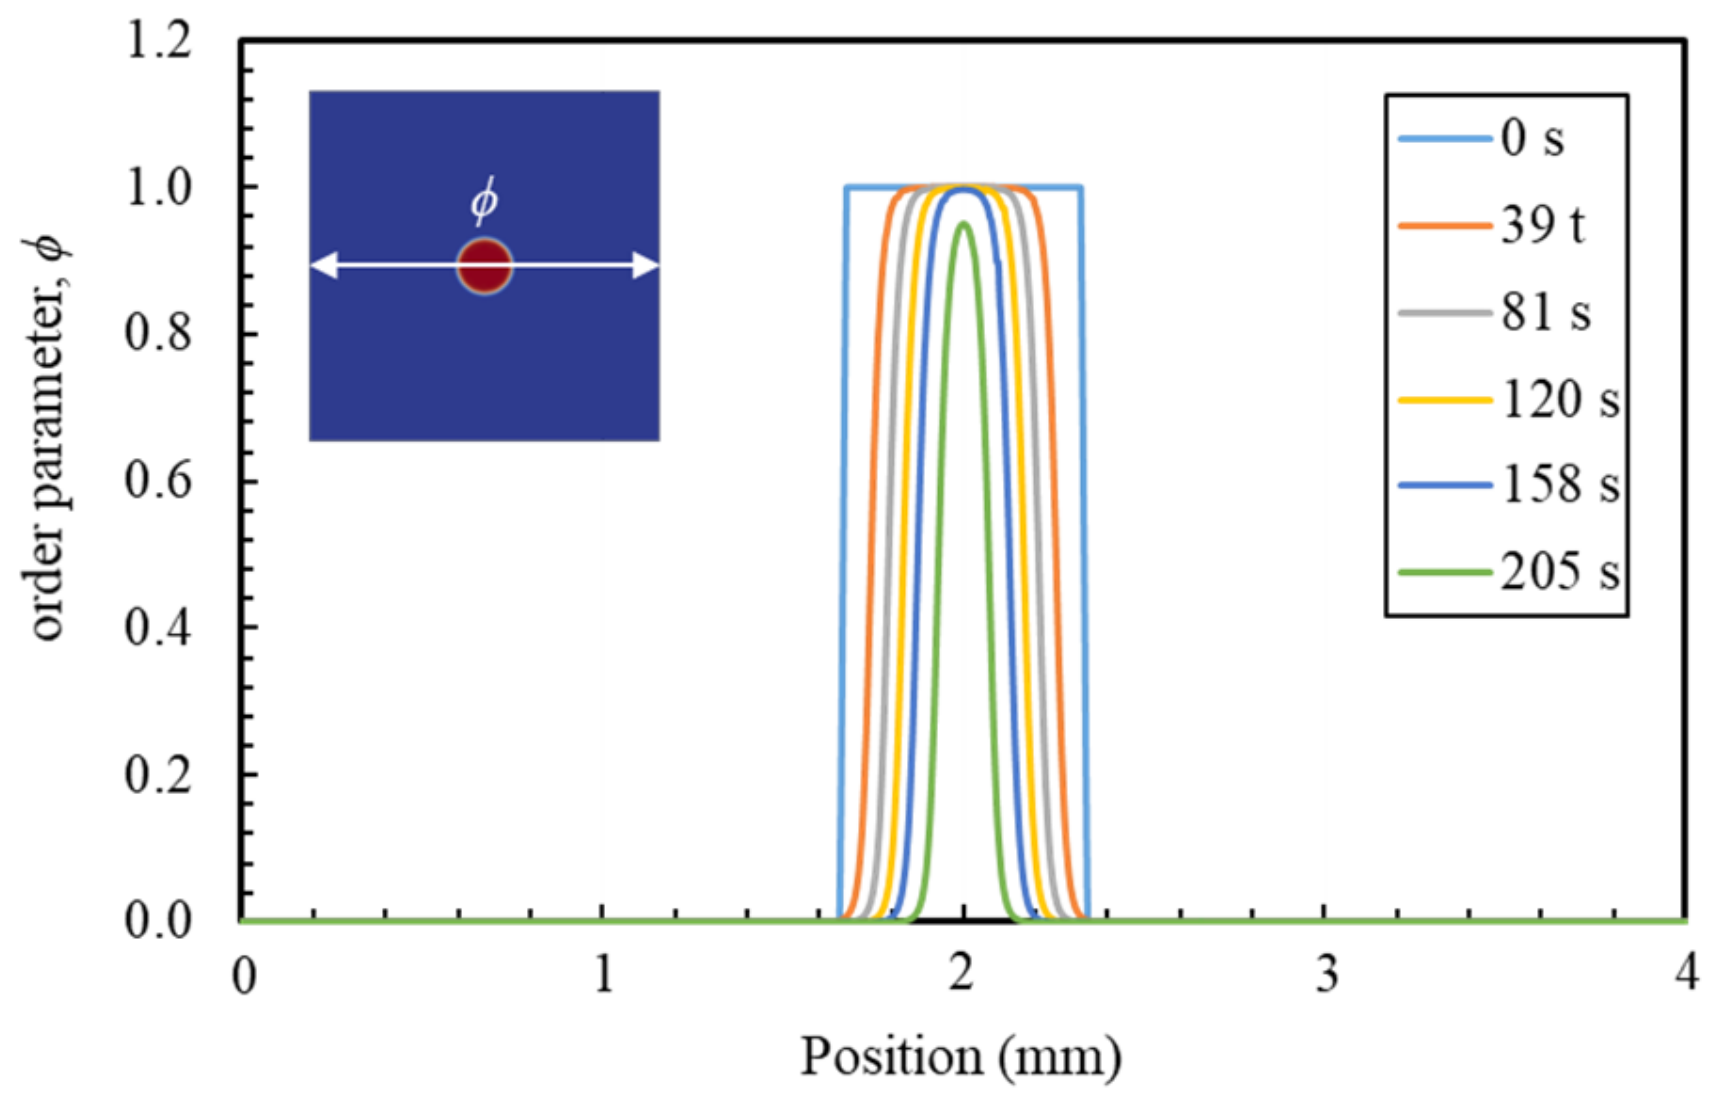
Figure 10 and Figure 11 show the concentration along the radial of the circle and the spatial distribution of its phase with time, respectively. The concentration of the solute in the solid phase remains constant. The radial length of the solid phase decreases symmetrically towards the centre. After the onset of dissolution, the concentration of solutes near the solid–liquid interface saturates rapidly. The concentration of solutes in the solvent gradually increases with the diffusion mechanism.

6.3. PF Validation against Experimental Results and Analytical Solution

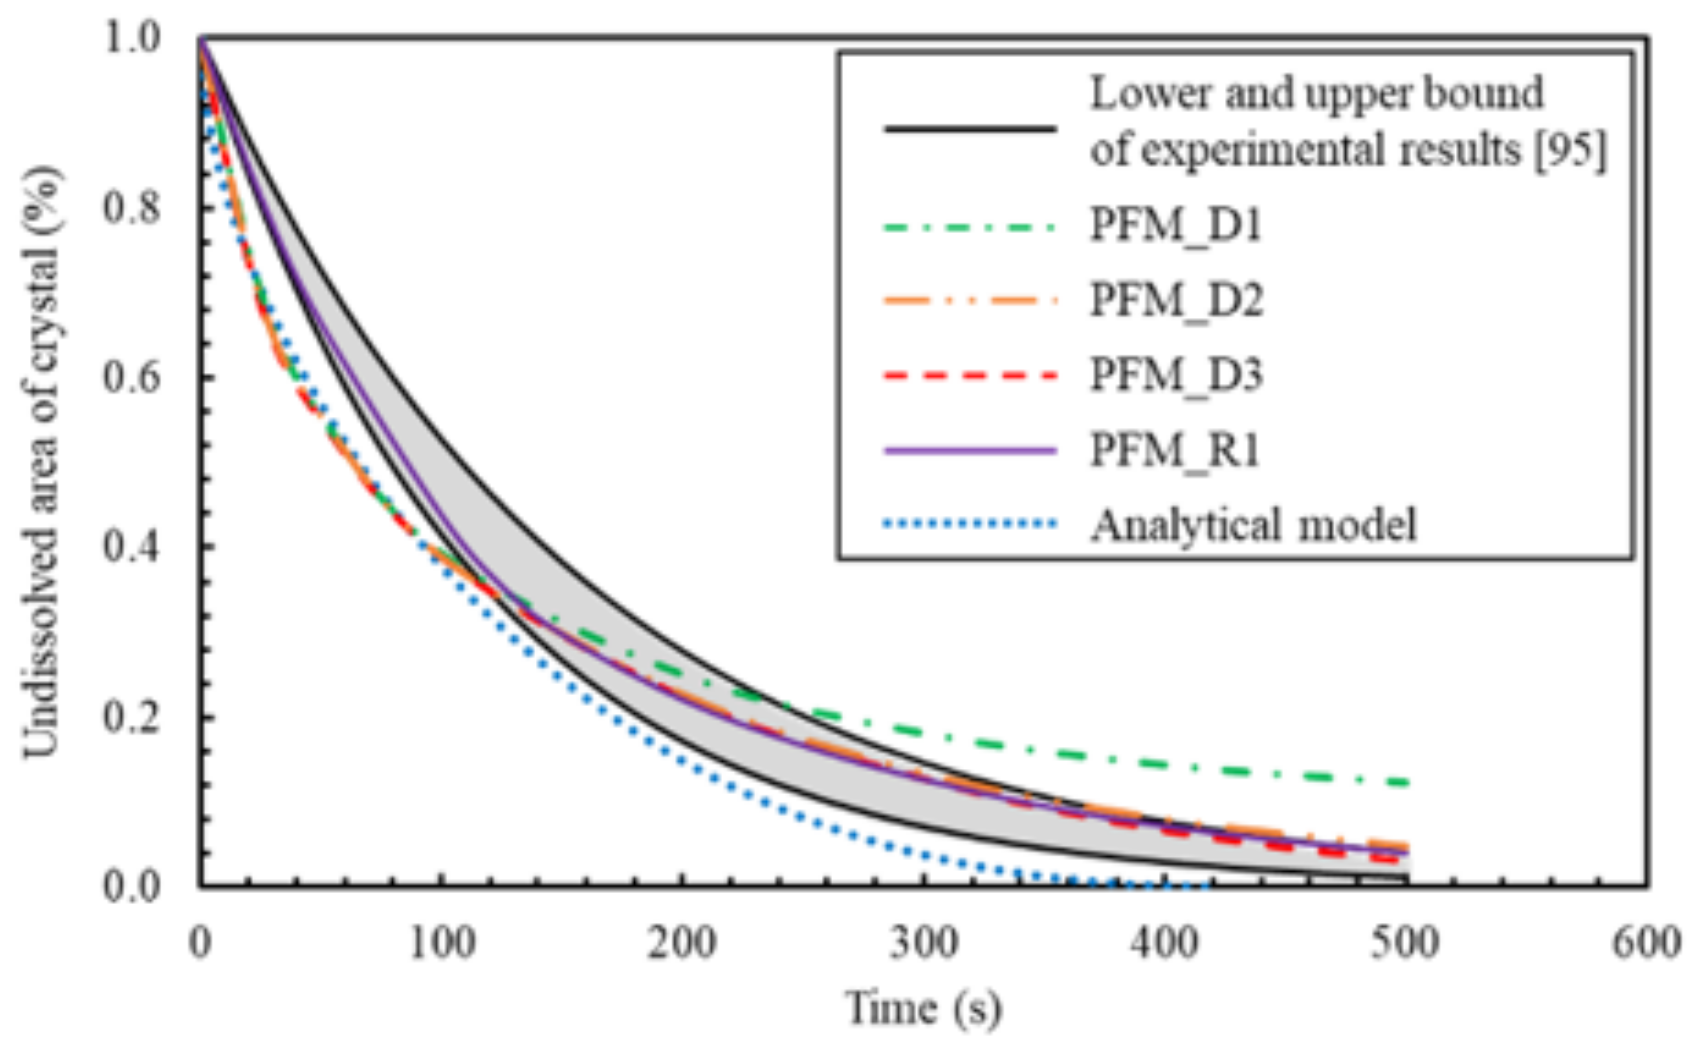
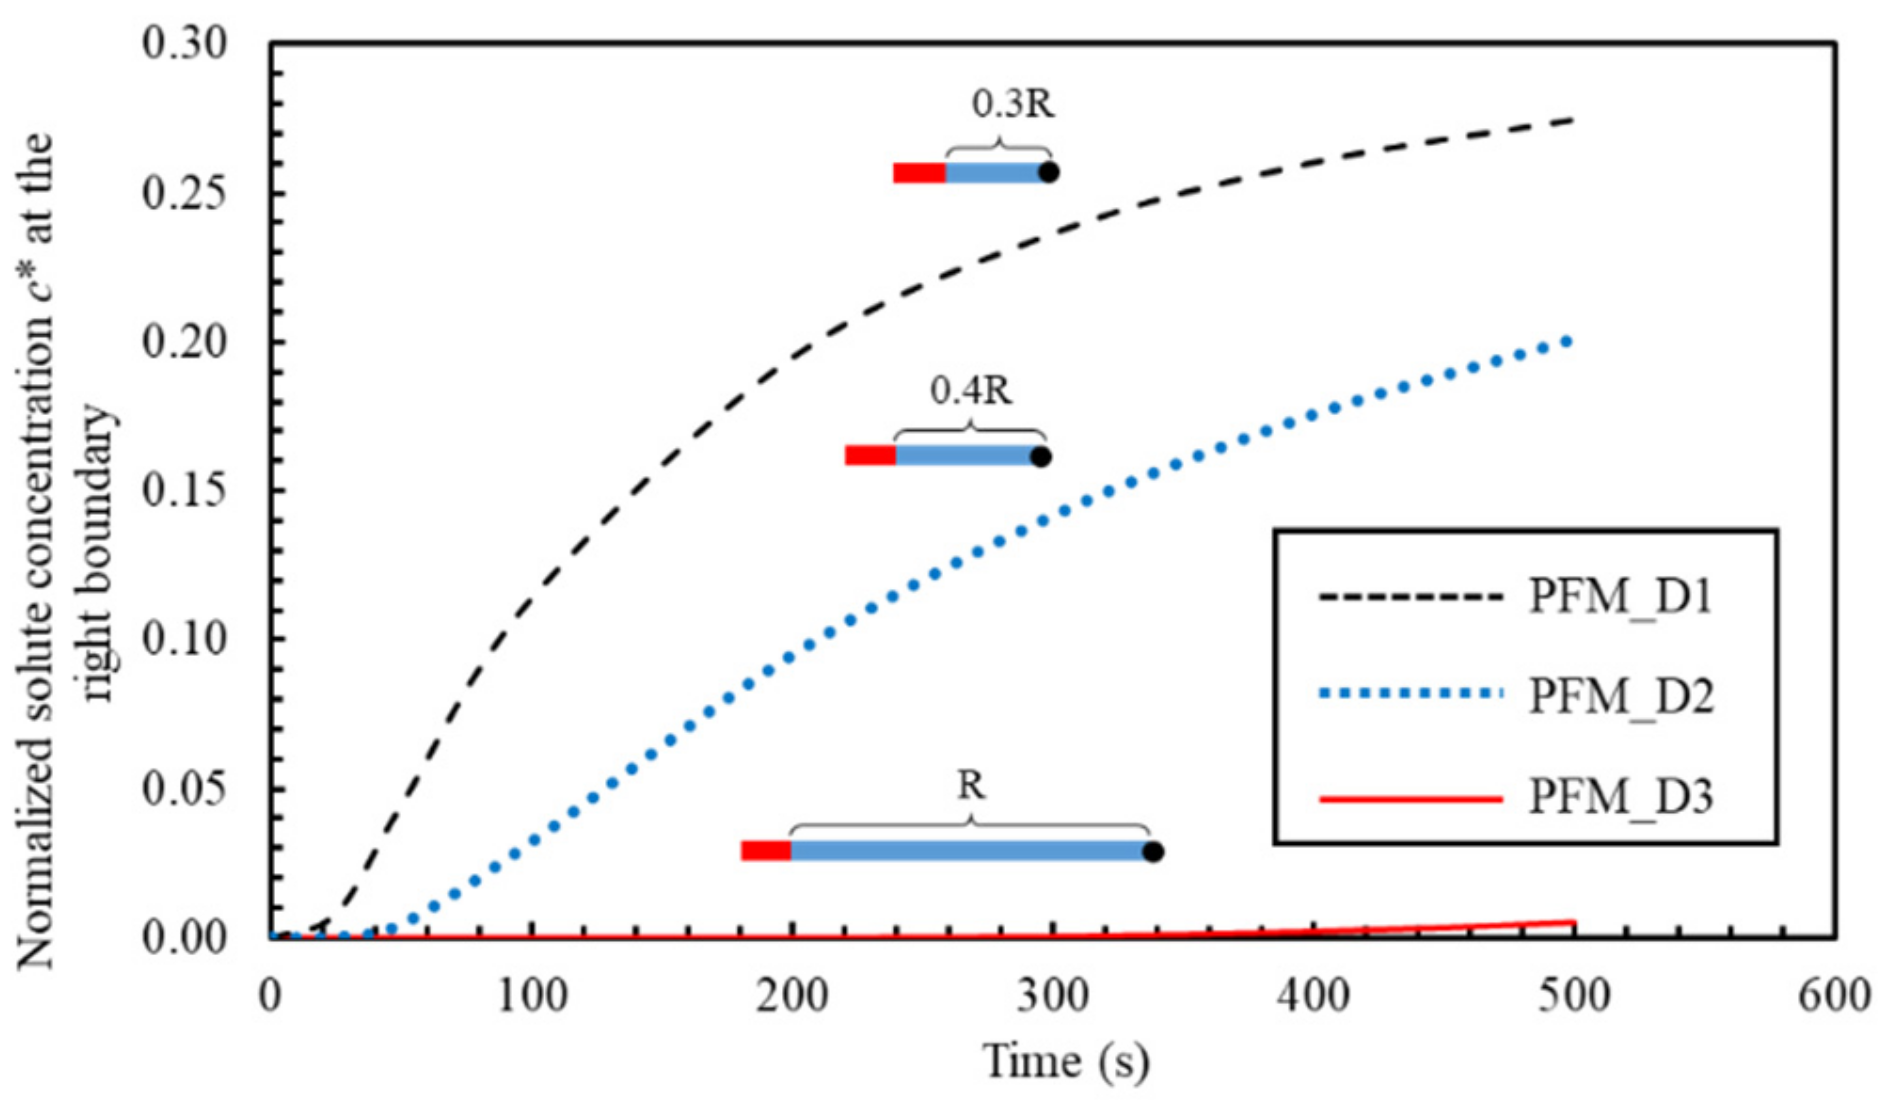
Figure 12 shows a comparison of the analytical solution, the PF model results and experimental results regarding the dissolution rate of individual NaCl crystals. The undissolved area is calculated from the residual solid phase length in the 1D simulation. The analytical solution is slightly below the lower boundary of the experimental values. In order to ensure that the dissolution reaction rate is completely controlled by the diffusion, the length (volume) of the exposure solution must be large enough so that semi-infinitive conditions are met, corresponding to the analytical solution. In that case no increase in concentration of solute should occur at the system (solution) boundary point. The length of solution 0.3 times (PFM_D1), 0.4 times (PFM_D2) and the original length (PFM_D3, 4.92 × 10⁻³ m) were tested using the PF method. From the results it can be seen that the dissolution rate slows down and the solute concentration increases significantly at the solution boundary point as the solution phase length becomes shorter (Figure 13). The change in solute at the boundary point, calculated using the solution lengths in the experiment (PFM_D3), is almost zero. It was thus verified that the diffusive dissolution of individual NaCl crystals can be simulated well using our implementation of the PF method.
The experimental result in Figure 12 shows lower initial rates, due to the reaction controlled mechanism. Initially, the diffusion flux is very high, as the solute concentration of the initial exposure solution is zero (initial condition). Therefore the overall reaction rate is limited by the reaction rate which is lower than the initial high diffusion flux. Such reaction rates in the PF model can be considered in the interface mobility ( L ) that should vary with time and is fundamentally a function of the Gibbs free energy of the chemical reaction or the solute concentration. In future, it should be attempted to physically represent the interface mobility kinetics (L) as a function of the solute-under saturation, as commonly used in reaction rates expressions. Such a more fundamental approach is still missing in PF, due to the complexity in its mathematical derivation. Here, L is adjusted in a simplified way as a smaller value (4.11 × 10⁻⁶) within 100 s and a larger value (4.11 × 10⁻³) after 100 s whose result is represented by PFM_R1. As can be seen from the comparison, the dissolution rate is relatively flat at the early stage of dissolution when process controlled by the reaction. The curve of PFM_R1 is higher than that of PFM_D1, D2 and D3. However, after 100 s, PFM_R1 almost overlap with the other three due to the conversion of the dissolution rate control into the diffusion control mechanism.

7. Conclusions

Based on the results of this study, the following conclusions can be summarized:
  • by comparing with the results of the analytical method, it is verified that the PF model can accurately handle the dynamic evolution of the general diffusion-controlled phase transformation process;
  • using NaCl as an example, the PF model can successfully simulate the mesoscopic evolution of inorganic non-metallic materials caused by diffusion-controlled dissolution. Using the derived interfacial mobility, the PF numerical simulation results show accurate and consistent agreement with the analytical method results, as well as with the experimental ones derived with video-microscopy images analyses. It is worth mentioning that all the input parameters of the PF model have real physical meaning and are based on the experiments data;
  • an observed discrepancy was related to the dissolution mechanism, which was found to be initially limited by the reaction rate, being slower than the diffusion flux due to the rapid change of solute concentration. This change in dissolution mechanism was successfully captured by adjusting the PF interface mobility ( L ).
  • the dissolution characteristics of NaCl particles with different circularity factors were analysed by the 2D PF model. The simplification of spherical shape for NaCl particles was verified to hold.
In future studies, the reaction control and diffusion control mechanisms will be combined with the second law of thermodynamics and non-equilibrium thermodynamics with respect to L , so that L can be represented as the function of solute concentration or the Gibbs free energy of the reaction. In addition, numerical simulations need to be implemented at higher space dimensions to allow the introduction of complex microstructures in mineral particles, such as pores, grain structure and surface roughness, so that their impact on dissolution kinetics can be assessed. The above results confirm that the dissolution kinetics of mineral particles can be successfully simulated using the employed PF model and the irregular morphological evolution can be effectively simulated in 2D. It is worth noting that the surface morphology of irregular particles has a strong influence on the dissolution kinetics. The complex evolution of particle morphology in physicochemical processes can be accurately evaluated only in a full 3D system. Furthermore, a dynamic (apparent) diffusion coefficient should be explicitly taken into account, e.g., as a function of concentration, which is of critical importance in analyzing the diffusion-controlled dissolution through porous materials involving additional chemical interactions. However, highly soluble (NaCl) crystals, as investigated in this work, can be considered as non-porous which leads to assume that their diffusion coefficient can be kept constant. It is worth mentioning that the proposed PF approach can be also extended for simulating the opposite processes of those presented in this paper, namely the precipitation of NaCl. This is part of forthcoming research and will be undertaken by enriching the current free energy density function of the liquid phase through adding an extra precipitation term, i.e., Δ r f . This should be considered for further development to develop a comprehensive mineral dissolution and precipitation modelling tool.

Author Contributions

Conceptualization, S.Y. and N.U.; data curation, S.Y. and N.U.; writing—original draft preparation, S.Y.; writing—review and editing, everybody; supervision, N.U. and A.C.; project administration, N.U. and E.K.; funding acquisition, N.U. and E.K. All authors have read and agreed to the published version of the manuscript.

Funding

This research was funded by National German DFG organization under project number 426807554 titled “Experimentally supported multi-scale Reactive Transport modeling of cementitious materials under Acid attack (ExpeRTa)”.

Data Availability Statement

No applicable.

Acknowledgments

The authors acknowledge the Open Access Publishing Fund of Technische Universität Darmstadt. Calculations for this research were conducted on the Lichtenberg high performance computer of the TU Darmstadt.

Conflicts of Interest

The authors declare no conflict of interest.

Appendix A

Appendix A.1. The Height of the Double Well Potential ω and Gradient Energy Coefficient k

Using the composition and PF profile at equilibrium, the interface energy σ , and the interface thickness l 0 can be evaluated as:
σ = k ω 3 2 ,
l 0 = 2.94 2 k ω ,
In general, σ and l 0 can be estimated from the experiment, then the height of the double well potential ω and gradient energy coefficient k can be easily obtained by the Equations (A1) and (A2):
ω = 6 2.94 σ l 0 ,
k = 3 l 0 σ 2.94 ,

Appendix A.2. The Interface Mobility L

The interface velocity V is typically expressed as product of a factor involving the thermodynamic driving force for dissolution and a kinetic factor involving the interface mobility [103], i.e.,
V = V 0 1 exp Δ G R T ,
where the kinetic factor V 0 corresponds to the limiting velocity under infinite driving force (forward reaction rate), Δ G is the Gibbs free energy difference, between the free energy of solid and liquid which is responsible for the interface displacement. The driving force of dissolution Δ F is given by Δ F = f L c L e f S c S e c L e c S e f c S S c S , ( Δ G = Δ F ). Thus, Equation (A5) is obtained by Taylor series expansion and approximated as:
V V 0 Δ G R T = V 0 Δ F R T .
Using the derivation in the KKS model, Equation (23) can be expressed in terms of Δ F as follows:
ϕ t = L k ϕ + h ϕ Δ F ω g ϕ .
Under 1D instantaneous steady state, ϕ is derived for the position as follows:
d ϕ d x = L V k d 2 ϕ d x 2 + h ϕ Δ F ω g ϕ .
Under the thin interface limit condition, Equation (A8) combined with the equilibrium phase expression ( d x / d ϕ 0 = k / 2 ω [ 1 / ϕ 0 ( 1 ϕ 0 ) ] ) and Equation (A1) modifies into:
R T V 0 = σ L k .
It should be noted that this equation only holds if the diffusion potential of solute in the interface region is constant. In addition, if the dissolution process is controlled by diffusion, V 0 is usually approximated as D L / l 0 ; where D L is the diffusion coefficient of the solute in solution [31]. In general, the determination of V 0 is very difficult [104]. In summary, L can be derived from Equation (A9):
L = D L σ l 0 R T k ,

Appendix A.3. The Curvature of the Free Energy Density Function A
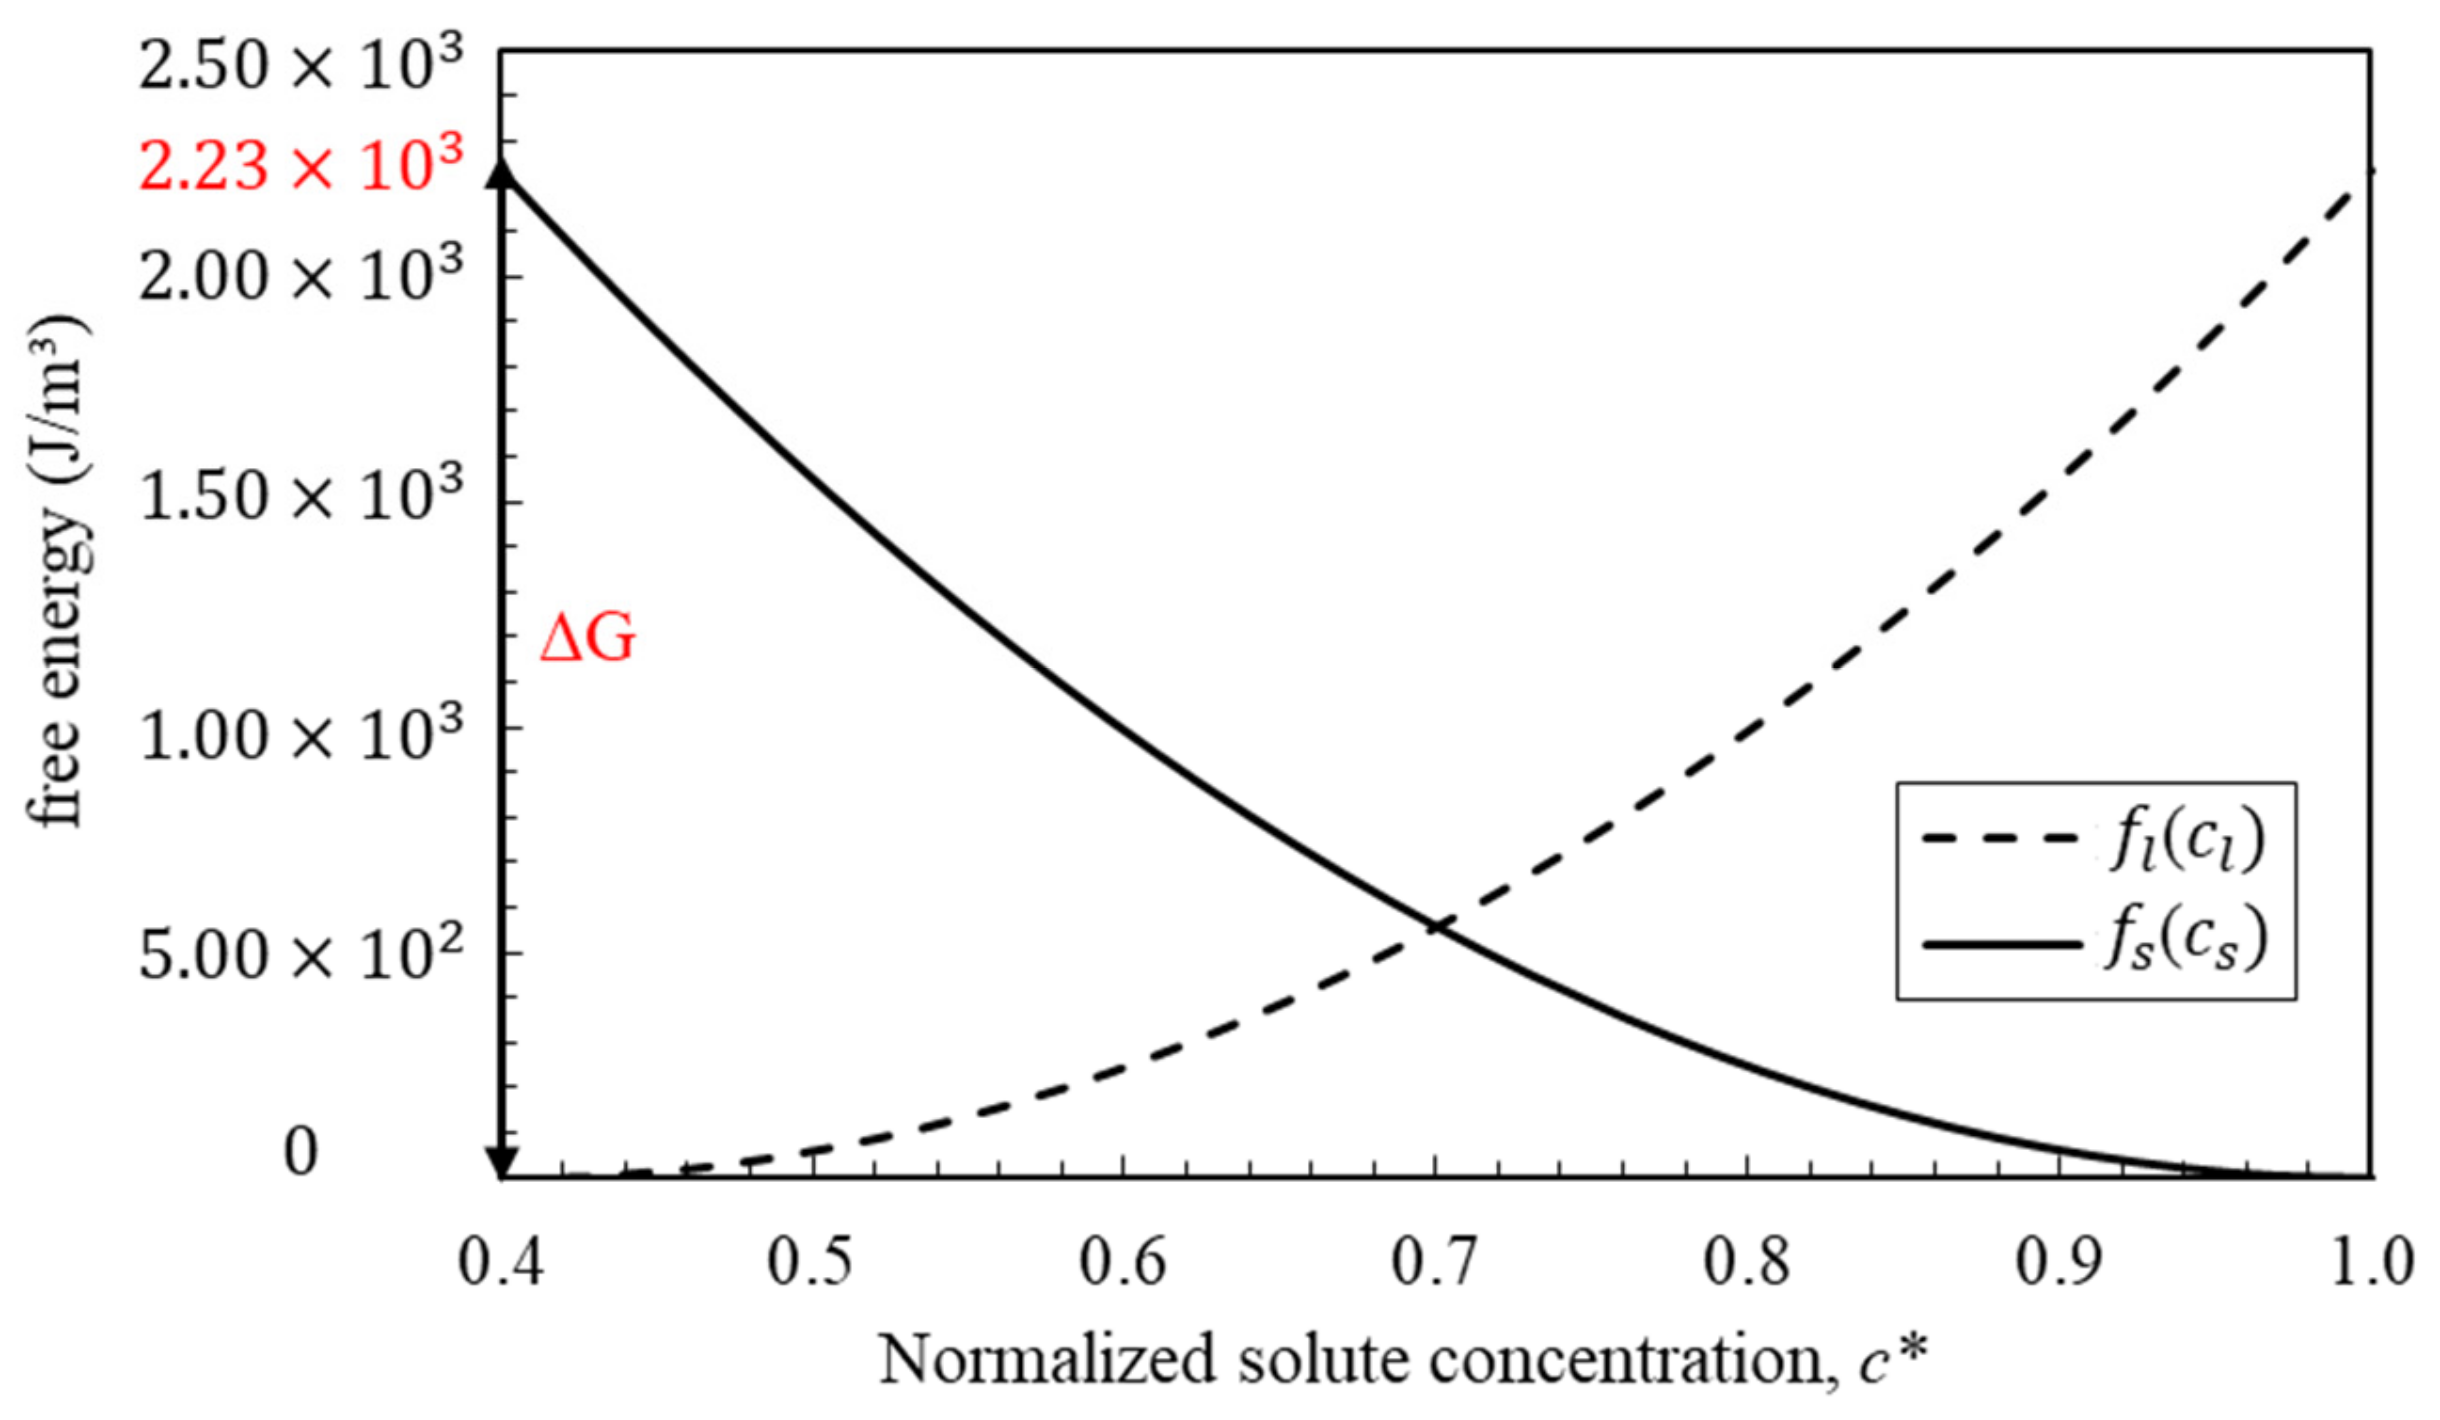
The Gibbs free energy Δ G can be obtained through equilibrium constant K :
Δ G = R T ln K
Δ G = 8.314 293.15 ln   0.4 1.0 = 2233.23 J / m 3 ,
The value of A can be derived from Δ G . Following [61], A makes the free energy of the solid phase is equal to Δ G when c is 0.4 (see Figure A1).
Figure A1. Variation of concentration with chemical driving force.
Applsci 11 02464 g0a1

Appendix B. PF Parameters Normalization

In order to ensure the convergence of the model on the mesoscale and improve the calculation efficiency, all variables are normalized. All molar concentrations are normalized by the solid molar concentration c S , and all length scales are normalized by the length of the domain ( l ). According to the total energy function in Equation (9), three equations are proposed as follows:
* = l 0 ,
F * = F A ,
D S * = D S D L ,
The normalized variables are presented as follows:
A * = 1 ,
k * = k A l 0 2 ,
ω * = ω A ,
L * = A l 0 2 L D L ,
t * = D L t l 0 2 ,
D L * = 1 ,
c se = c solid c solid = 1 ,
c Le = p c solid ,
where, p is the solubility of sodium chloride at 20 °C and 1 atm, which needs to be converted to units of m o l / m 3 in the calculation.

References

  1. Weissbart, E.J.; Rimstidt, J. Wollastonite: Incongruent dissolution and leached layer formation. Geochim. Cosmochim. Acta 2000, 64, 4007–4016. [Google Scholar] [CrossRef]
  2. Bluteau, M.-C.; Demopoulos, G.P. The incongruent dissolution of scorodite—Solubility, kinetics and mechanism. Hydrometallurgy 2007, 87, 163–177. [Google Scholar] [CrossRef]
  3. Reinhardt, H.W.; Jonkers, H.M.; Van Tittelboom, K.; Snoeck, D.; De Belie, N.; De Muynck, W.; Verstraete, W.; Wang, J.; Mechtcherine, V. Recovery against Environmental Action; Springer: Dordrecht, The Netherlands, 2013; pp. 65–117. [Google Scholar]
  4. Yang, Y.; Lepech, M.D.; Yang, E.-H.; Li, V.C. Autogenous healing of engineered cementitious composites under wet-dry cycles. Cem. Concr. Res. 2009, 39, 382–390. [Google Scholar] [CrossRef]
  5. De Belie, N.; Gruyaert, E.; Al-Tabbaa, A.; Antonaci, P.; Baera, C.; Bajare, D.; Darquennes, A.; Davies, R.; Ferrara, L.; Jefferson, T.; et al. A Review of Self-Healing Concrete for Damage Management of Structures. Adv. Mater. Interfaces 2018, 5, 1800074. [Google Scholar] [CrossRef]
  6. Aaron, H.B.; Fainstein, D.; Kotler, G.R. Diffusion-limited phase transformations: A comparison and critical evaluation of the mathematical approximations. J. Appl. Phys. 1970, 41, 4404–4410. [Google Scholar] [CrossRef]
  7. Wehrli, B. Monte Carlo simulations of surface morphologies during mineral dissolution. J. Colloid Interface Sci. 1989, 132, 230–242. [Google Scholar] [CrossRef]
  8. Yang, X.; Liu, X.; Wang, J.; Zhao, Z.; Lei, H. Analytical solution of a mathematical model for rock salt dissolution in still water. Arab. J. Geosci. 2018, 11, 732. [Google Scholar] [CrossRef]
  9. Shekunov, B.; Montgomery, E.R. Theoretical Analysis of Drug Dissolution: I. Solubility and Intrinsic Dissolution Rate. J. Pharm. Sci. 2016, 105, 2685–2697. [Google Scholar] [CrossRef] [PubMed] [Green Version]
  10. Siepmann, J. Mathematical modeling of drug dissolution. Int. J. Pharm. 2013, 453, 12–24. [Google Scholar] [CrossRef]
  11. Wang, Y.; Abrahamsson, B.; Lindfors, L.; Brasseur, J.G. Comparison and Analysis of Theoretical Models for Diffusion-Controlled Dissolution. Mol. Pharm. 2012, 9, 1052–1066. [Google Scholar] [CrossRef]
  12. Guo, X.; Sietsma, J.; Yang, Y.; Sun, Z.; Guo, M. Diffusion-limited dissolution of spherical particles: A critical evaluation and applications of approximate solutions. AIChE J. 2017, 63, 2926–2934. [Google Scholar] [CrossRef]
  13. Samaha, D.; Shehayeb, R.; Kyriacos, S. Modeling and comparison of dissolution profiles of diltiazem modified-release formulations. Dissolution Technol. 2009, 16, 41–46. [Google Scholar] [CrossRef]
  14. Wang, J.; Flanagan, D.R. General solution for diffusion-controlled dissolution of spherical particles. 2. Evaluation of experimental data. J. Pharm. Sci. 2002, 91, 534–542. [Google Scholar] [CrossRef]
  15. Matsubara, H.; Tomonori, Y. Mathematical and numerical modelling of limestone dissolution. Environ. Geotech. 2019, 40, 1–12. [Google Scholar] [CrossRef]
  16. Nicoleau, L.; Bertolim, M.A. Analytical Model for the Alite (C 3 S) Dissolution Topography. J. Am. Ceram. Soc. 2015, 99, 773–786. [Google Scholar] [CrossRef]
  17. Chen, Q.; Ma, N.; Wu, K.; Wang, Y. Quantitative phase field modeling of diffusion-controlled precipitate growth and dissolution in Ti–Al–V. Scr. Mater. 2004, 50, 471–476. [Google Scholar] [CrossRef]
  18. Nambu, S.; Sagala, D.A. Domain formation and elastic long-range interaction in ferroelectric perovskites. Phys. Rev. B 1994, 50, 5838–5847. [Google Scholar] [CrossRef] [PubMed]
  19. Kim, S.G.; Kim, D.I.; Kim, W.T.; Park, Y.B. Computer simulations of two-dimensional and three-dimensional ideal grain growth. Phys. Rev. E 2006, 74, 061605. [Google Scholar] [CrossRef] [Green Version]
  20. Wang, Y.U.; Jin, Y.M.; Cuitiño, A.M.; Khachaturyan, A.G. Phase field microelasticity theory and modeling of multiple dislocation dynamics. Appl. Phys. Lett. 2001, 78, 2324–2326. [Google Scholar] [CrossRef]
  21. Wen, Y.-H.; Chen, L.-Q.; Hawk, J.A. Phase-field modeling of corrosion kinetics under dual-oxidants. Model. Simul. Mater. Sci. Eng. 2012, 20. [Google Scholar] [CrossRef]
  22. Kobayashi, R.; Warren, J.; Carter, W. Vector-valued phase field model for crystallization and grain boundary formation. Phys. D: Nonlinear Phenom. 1998, 119, 415–423. [Google Scholar] [CrossRef]
  23. Chen, L.-Q. Phase-Field Models for Microstructure Evolution. Annu. Rev. Mater. Res. 2002, 32, 113–140. [Google Scholar] [CrossRef] [Green Version]
  24. Boettinger, W.J.; Warren, J.A.; Beckermann, C.; Karma, A. Phase-field simulation of solidification. Annu. Rev. Mater. Res. 2002, 32, 163–194. [Google Scholar] [CrossRef]
  25. Karma, A.; Rappel, W.J. Phase-field method for computationally efficient modeling of solidification with arbitrary interface kinetics. Phys. Rev. E 1996, 53, R3017–R3020. [Google Scholar] [CrossRef]
  26. Steinbach, I. Phase-Field model for microstructure evolution at the mesoscopic scale. Annu. Rev. Mater. Res. 2013, 43, 89–107. [Google Scholar] [CrossRef]
  27. Wang, S.L.; Sekerka, R.F.; Wheeler, A.A.; Murray, B.T.; Coriell, S.R.; Braun, R.; McFadden, G.B. Thermodynamically-consistent phase-field models for solidification. Phys. D Nonlinear Phenom. 1993, 69, 189–200. [Google Scholar] [CrossRef]
  28. Moelans, N.; Blanpain, B.; Wollants, P. An introduction to phase-field modeling of microstructure evolution. Calphad 2008, 32, 268–294. [Google Scholar] [CrossRef]
  29. Provatas, N.; Elder, K. Phase-Field Methods in Materials Science and Engineering; John Wiley & Sons: Weinheim, Germany, 2011. [Google Scholar]
  30. Wheeler, A.A.; Boettinger, W.J.; McFadden, G.B. Phase-field model for isothermal phase transitions in binary alloys. Phys. Rev. A 1992, 45, 7424–7440. [Google Scholar] [CrossRef] [PubMed]
  31. Cha, P.-R.; Yeon, D.-H.; Yoon, J.-K. A phase field model for isothermal solidification of multicomponent alloys. Acta Mater. 2001, 49, 3295–3307. [Google Scholar] [CrossRef]
  32. Suzuki, T.; Ode, M.; Kim, S.G.; Kim, W.T. Phase-field model of dendritic growth. J. Cryst. Growth 2002, 237–239, 125–131. [Google Scholar] [CrossRef]
  33. Echebarria, B.; Folch, R.; Karma, A.; Plapp, M. Quantitative phase-field model of alloy solidification. Phys. Rev. E 2004, 70, 061604. [Google Scholar] [CrossRef] [Green Version]
  34. Nestler, B.; Garcke, H.; Stinner, B. Multicomponent alloy solidification: Phase-field modeling and simulations. Phys. Rev. E 2005, 71, 041609. [Google Scholar] [CrossRef] [PubMed] [Green Version]
  35. Badalassi, V.E.; Ceniceros, H.D.; Banerjee, S. Computation of multiphase systems with phase field models. J. Comput. Phys. 2003, 190, 371–397. [Google Scholar] [CrossRef]
  36. Petersen, T.; Valdenaire, P.-L.; Pellenq, R.; Ulm, F.-J. A reaction model for cement solidification: Evolving the C–S–H packing density at the micrometer-scale. J. Mech. Phys. Solids 2018, 118, 58–73. [Google Scholar] [CrossRef]
  37. Steinbach, I.; Zhang, L.; Plapp, M. Phase-field model with finite interface dissipation. Acta Mater. 2012, 60, 2689–2701. [Google Scholar] [CrossRef]
  38. Tonegawa, Y. Phase field model with a variable chemical potential. Proc. R. Soc. Edinburgh: Sect. A Math. 2002, 132, 993–1019. [Google Scholar] [CrossRef] [Green Version]
  39. Bazant, M.Z. Theory of chemical kinetics and charge transfer based on nonequilibrium thermodynamics. Accounts Chem. Res. 2012, 46, 1144–1160. [Google Scholar] [CrossRef]
  40. Chen, L.Q.; Fan, F.; Hong, L.; Chen, J.; Ji, Y.Z.; Zhang, S.L.; Zhu, T. A phase-field model coupled with large elasto-plastic deformation: Application to lithiated silicon electrodes. J. Electrochem. Soc. 2014, 161, F3164–F3172. [Google Scholar] [CrossRef] [Green Version]
  41. Lin, C.; Ruan, H. Multi-phase-field modeling of localized corrosion involving galvanic pitting and mechano-electrochemical coupling. Corros. Sci. 2020, 177, 108900. [Google Scholar] [CrossRef]
  42. Kuhn, C.; Müller, R. A continuum phase field model for fracture. Eng. Fract. Mech. 2010, 77, 3625–3634. [Google Scholar] [CrossRef]
  43. Hesch, C.; Weinberg, K. Thermodynamically consistent algorithms for a finite-deformation phase-field approach to fracture. Int. J. Numer. Methods Eng. 2014, 99, 906–924. [Google Scholar] [CrossRef]
  44. Heider, Y.; Markert, B. A phase-field modeling approach of hydraulic fracture in saturated porous media. Mech. Res. Commun. 2017, 80, 38–46. [Google Scholar] [CrossRef]
  45. Cahn, J.W.; Hilliard, J.E. Free energy of a nonuniform system. I. Interfacial free energy. J. Chem. Phys. 1958, 28, 258–267. [Google Scholar] [CrossRef]
  46. Allen, S.M.; Cahn, J.W. A microscopic theory for antiphase boundary motion and its application to antiphase domain coarsening. Acta Metall. 1979, 27, 1085–1095. [Google Scholar] [CrossRef]
  47. Wheeler, A.A.; McFadden, G.B.; Boettinger, W.J. Phase-field model for solidification of a eutectic alloy. Proc. R. Soc. London. Ser. A Math. Phys. Eng. Sci. 1996, 452, 495–525. [Google Scholar]
  48. Kim, S.G.; Kim, W.T.; Suzuki, T. Phase-field model for binary alloys. Phys. Rev. E 1999, 60, 7186–7197. [Google Scholar] [CrossRef] [PubMed]
  49. Steinbach, I.; Pezzolla, F.; Nestler, B.; Seeßelberg, M.; Prieler, R.; Schmitz, G.; Rezende, J. A phase field concept for multiphase systems. Phys. D Nonlinear Phenom. 1996, 94, 135–147. [Google Scholar] [CrossRef]
  50. Losert, W.; Stillman, D.A.; Cummins, H.Z.; Kopczyński, P.; Rappel, W.-J.; Karma, A. Selection of doublet cellular patterns in directional solidification through spatially periodic perturbations. Phys. Rev. E 1998, 58, 7492–7506. [Google Scholar] [CrossRef] [Green Version]
  51. Ode, M.; Lee, J.S.; Kim, S.G.; Kim, W.T.; Suzuki, T. Phase-field Model for Solidification of Ternary Alloys. ISIJ Int. 2000, 40, 870–876. [Google Scholar] [CrossRef] [Green Version]
  52. Kim, S.G.; Kim, W.T.; Suzuki, T. Interfacial compositions of solid and liquid in a phase-field model with finite interface thickness for isothermal solidification in binary alloys. Phys. Rev. E 1998, 58, 3316. [Google Scholar] [CrossRef]
  53. Tiaden, J.; Nestler, B.; Diepers, H.; Steinbach, I. The multiphase-field model with an integrated concept for modelling solute diffusion. Phys. D Nonlinear Phenom. 1998, 115, 73–86. [Google Scholar] [CrossRef]
  54. Eiken, J.; Böttger, B.; Steinbach, I. Multiphase-field approach for multicomponent alloys with extrapolation scheme for numerical application. Phys. Rev. E 2006, 73, 066122. [Google Scholar] [CrossRef]
  55. Wheeler, A.A.; Boettinger, W.J.; McFadden, G.B. Phase-field model of solute trapping during solidification. Phys. Rev. E 1993, 47, 1893. [Google Scholar] [CrossRef]
  56. Ode, M.; Suzuki, T.; Kim, S.; Kim, W. Phase–field model for solidification of Fe–C alloys. Sci. Technol. Adv. Mater. 2000, 1, 43–49. [Google Scholar] [CrossRef]
  57. Beckermann, C.; Diepers, H.-J.; Steinbach, I.; Karma, A.; Tong, X. Modeling melt convection in phase-field simulations of solidification. J. Comput. Phys. 1999, 154, 468–496. [Google Scholar] [CrossRef]
  58. Cha, P.R.; Yeon, D.H.; Yoon, J.K. Phase-field model for multicomponent alloy solidification. J. Cryst. Growth. 2005, 274, 281–293. [Google Scholar] [CrossRef]
  59. Qin, R.S.; Bhadeshia, H.K. Phase field method. Mater. Sci. Technol. 2010, 26, 803–811. [Google Scholar] [CrossRef]
  60. Xu, Z.; Meakin, P. Phase-field modeling of solute precipitation and dissolution. J. Chem. Phys. 2008, 129, 014705. [Google Scholar] [CrossRef] [PubMed] [Green Version]
  61. Abubakar, A.A.; Akhtar, S.S.; Arif, A.F.M. Phase field modeling of V2O5 hot corrosion kinetics in thermal barrier coatings. Comput. Mater. Sci. 2015, 99, 105–116. [Google Scholar] [CrossRef]
  62. Grafe, U.; Böttger, B.; Tiaden, J.; Fries, S.G. Coupling of multicomponent thermodynamic databases to a phase field model: Application to solidification and solid state transformations of superalloys. Scr. Mater. 2000, 42, 1179–1186. [Google Scholar] [CrossRef]
  63. Qin, R.; Wallach, E.; Thomson, R. A phase-field model for the solidification of multicomponent and multiphase alloys. J. Cryst. Growth 2005, 279, 163–169. [Google Scholar] [CrossRef]
  64. Ansari, T.Q.; Xiao, Z.; Hu, S.; Li, Y.; Luo, J.L.; Shi, S.Q. Phase-field model of pitting corro-sion kinetics in metallic materials. NPJ Comput. Mater. 2018, 4, 1–9. [Google Scholar] [CrossRef]
  65. Mai, W.; Soghrati, S.; Buchheit, R.G. A phase field model for simulating the pitting corrosion. Corros. Sci. 2016, 110, 157–166. [Google Scholar] [CrossRef]
  66. Mai, W.; Soghrati, S. A phase field model for simulating the stress corrosion cracking initiated from pits. Corros. Sci. 2017, 125, 87–98. [Google Scholar] [CrossRef]
  67. Xiao, Z.; Wang, Y.; Hu, S.; Li, Y.; Shi, S.-Q. A quantitative phase-field model of gas bubble evolution in UO2. Comput. Mater. Sci. 2020, 184, 109867. [Google Scholar] [CrossRef]
  68. Mai, W.; Soghrati, S. New phase field model for simulating galvanic and pitting corrosion processes. Electrochim. Acta 2018, 260, 290–304. [Google Scholar] [CrossRef]
  69. Zhang, R.; Jing, T.; Jie, W.; Liu, B. Phase-field simulation of solidification in multicomponent alloys coupled with ther-modynamic and diffusion mobility databases. Acta Mater. 2006, 54, 2235–2239. [Google Scholar] [CrossRef]
  70. Kobayashi, H.; Ode, M.; Kim, S.G.; Kim, W.T.; Suzuki, T. Phase-field model for solidification of ternary alloys coupled with thermodynamic database. Scr. Mater. 2003, 48, 689–694. [Google Scholar] [CrossRef]
  71. Böttger, B.; Eiken, J.; Steinbach, I. Phase field simulation of equiaxed solidification in technical alloys. Acta Mater. 2006, 54, 2697–2704. [Google Scholar] [CrossRef]
  72. Clark, J.B.; Hastie, J.W.; Kihlborg, L.H.E.; Metselaar, R.; Thackeray, M.M. Definitions of terms relating to phase transitions of the solid state. IUPAC Standards Online 2016, 66, 577–594. [Google Scholar] [CrossRef] [Green Version]
  73. McGillen, M.R.; Fairchild, I.J. An experimental study of incongruent dissolution of CaCO3 under analogue glacial conditions. J. Glaciol. 2005, 51, 383–390. [Google Scholar] [CrossRef] [Green Version]
  74. Simon, B. Dissolution rates of NaCl and KCl in aqueous solution. J. Cryst. Growth 1981, 52, 789–794. [Google Scholar] [CrossRef]
  75. Antignano, A.; Manning, C.E. Rutile solubility in H2O, H2O—SiO2, and H2O—NaAlSi3O8 fluids at 0.7–2.0 GPa and 700–1000 C: Implications for mobility of nominally insoluble elements. Chem. Geol. 2008, 255, 283–293. [Google Scholar] [CrossRef]
  76. Xie, Z.; Walther, J.V. Incongruent dissolution and surface area of kaolinite. Geochim. Cosmochim. Acta 1992, 56, 3357–3363. [Google Scholar] [CrossRef]
  77. Scheiner, S.; Hellmich, C. Stable pitting corrosion of stainless steel as diffusion-controlled dissolution process with a sharp moving electrode boundary. Corros. Sci. 2007, 49, 319–346. [Google Scholar] [CrossRef]
  78. Yang, C.; Li, S.; Wang, X.; Wang, J.; Huang, H. Phase-field simulation of multi-phase interactions in Fe-C peritectic solidification. Comput. Mater. Sci. 2020, 171, 109220. [Google Scholar] [CrossRef]
  79. Kim, S.G.; Kim, W.T.; Suzuki, T.; Ode, M. Phase-field modeling of eutectic solidification. J. Cryst. Growth 2004, 261, 135–158. [Google Scholar] [CrossRef]
  80. Wang, Y.; Abrahamsson, B.; Lindfors, L.; Brasseur, J.G. Analysis of diffusion-controlled dissolution from polydisperse collec-tions of drug particles with an assessed mathematical model. J. Pharm. Sci. 2015, 104, 2998–3017. [Google Scholar] [CrossRef] [PubMed]
  81. Burt, H.M.; Mitchell, A. Crystal defects and dissolution. Int. J. Pharm. 1981, 9, 137–152. [Google Scholar] [CrossRef]
  82. Wang, J.; Keener, T.C.; Li, G.; Khang, S.-J. The dissolution rate of CA(OH)2 in aqueous solutions. Chem. Eng. Commun. 1998, 169, 167–184. [Google Scholar] [CrossRef]
  83. Vermilyea, D.A. The Dissolution of MgO and Mg(OH)2 in Aqueous Solutions. J. Electrochem. Soc. 1969, 116, 1179–1183. [Google Scholar] [CrossRef]
  84. Johannsen, K.; Rademacher, S. Modelling the kinetics of calcium hydroxide dissolution in water. Acta Hydrochim. Hydrobiol. 1999, 27, 72–78. [Google Scholar] [CrossRef]
  85. Giles, D.; Ritchie, I.; Xu, B.-A. The kinetics of dissolution of slaked lime. Hydrometallurgy 1993, 32, 119–128. [Google Scholar] [CrossRef]
  86. Lanaro, G.; Patey, G.N. Molecular Dynamics Simulation of NaCl Dissolution. J. Phys. Chem. B 2015, 119, 4275–4283. [Google Scholar] [CrossRef] [PubMed]
  87. Yang, Y.; Meng, S.; Xu, L.F.; Wang, E.G.; Gao, S. Dissolution dynamics of NaCl nanocrystal in liquid water. Phys. Rev. E 2005, 72, 012602. [Google Scholar] [CrossRef] [Green Version]
  88. Garcia, J.; Hernandez, J.; Rubio, J. Dissolution of in monocrystalline sodium chloride. Phys. Rev. B 1980, 21, 5012. [Google Scholar]
  89. Ohtaki, H.; Fukushima, N.; Hayakawa, E.; Okada, I. Dissolution process of sodium chloride crystal in water. Pure Appl. Chem. 1988, 60, 1321–1324. [Google Scholar] [CrossRef]
  90. Langlet, M.; Nadaud, F.; Benali, M.; Pezron, I.; Saleh, K.; Guigon, P.; Metlas-Komunjer, L. Kinetics of dissolution and recrystallization of sodium chloride at controlled relative humidity. KONA Powder Part. J. 2011, 29, 168–179. [Google Scholar] [CrossRef] [Green Version]
  91. Utoft, A.; Kinoshita, K.; Bitterfield, D.L.; Needham, D. Manipulating single microdroplets of NaCl solutions: Solvent dissolution, microcrystallization, and crystal morphology. Langmuir 2018, 34, 3626–3641. [Google Scholar] [CrossRef]
  92. Holmberg, N.; Chen, J.-C.; Foster, A.S.; Laasonen, K. Dissolution of NaCl nanocrystals: An ab initio molecular dynamics study. Phys. Chem. Chem. Phys. 2014, 16, 17437–17446. [Google Scholar] [CrossRef]
  93. Yang, Y.; Meng, S.; Wang, E.G. A molecular dynamics study of hydration and dissolution of NaCl nanocrystal in liquid water. J. Phys. Condens. Matter 2006, 18, 10165–10177. [Google Scholar] [CrossRef] [Green Version]
  94. Ohtaki, H.; Fukushima, N. Dissolution of an NaCl crystal with the (111) and (-1-1-1) faces. Pure Appl. Chem. 1989, 61, 179–185. [Google Scholar] [CrossRef]
  95. Quilaqueo, M.; Aguilera, J.M. Dissolution of NaCl crystals in artificial saliva and water by video-microscopy. Food Res. Int. 2015, 69, 373–380. [Google Scholar] [CrossRef]
  96. Espinosa, J.R.; Vega, C.; Valeriani, C.; Sanz, E. The crystal-fluid interfacial free energy and nucleation rate of NaCl from different simulation methods. J. Chem. Phys. 2015, 142, 194709. [Google Scholar] [CrossRef] [Green Version]
  97. Plewa, T.; Linde, T.; Weirs, V.G. Adaptive Mesh Refinement-Theory and Applications; Springer: Berlin/Heidelberg, Germany, 2005. [Google Scholar]
  98. Mosharraf, M.; Nyström, C. The effect of particle size and shape on the surface specific dissolution rate of microsized practically in-soluble drugs. Int. J. Pharm. 1995, 122, 35–47. [Google Scholar] [CrossRef]
  99. Liu, J.; Aruguete, D.M.; Jinschek, J.R.; Rimstidt, J.D.; Hochella, M.F., Jr. The non-oxidative dissolution of galena nanocrystals: Insights into mineral dissolution rates as a function of grain size, shape, and aggregation state. Geochim. Cosmochim. Acta 2008, 72, 5984–5996. [Google Scholar] [CrossRef]
  100. Higuchi, W.I.; Hiestand, E.N. Dissolution rates of finely divided drug powders I. Effect of a distribution of particle sizes in a diffu-sion-controlled process. J. Pharm. Sci. 1963, 52, 1963. [Google Scholar] [CrossRef]
  101. Higuchi, W.I.; Rowe, E.L.; Hiestand, E.N. Dissolution rates of finely divided drug powders II: Micronized methylprednisolone. J. Pharm. Sci. 1963, 52, 162–164. [Google Scholar] [CrossRef] [PubMed]
  102. De Almeida, L.P.; Simões, S.; Brito, P.; Portugal, A.; Figueiredo, M. Modeling dissolution of spar-ingly soluble multisized powders. J. Pharm. Sci. 1997, 86, 726–732. [Google Scholar] [CrossRef] [PubMed] [Green Version]
  103. Ludwig, A. The interface response-functions in multi-componental alloy solidification. Phys. D Nonlinear Phenom. 1998, 124, 271–284. [Google Scholar] [CrossRef]
  104. Aziz, M.J.; Boettinger, W.J. On the transition from short-range diffusion-limited to collision-limited growth in alloy solidification. Acta Metall. Mater. 1994, 42, 524–537. [Google Scholar] [CrossRef]
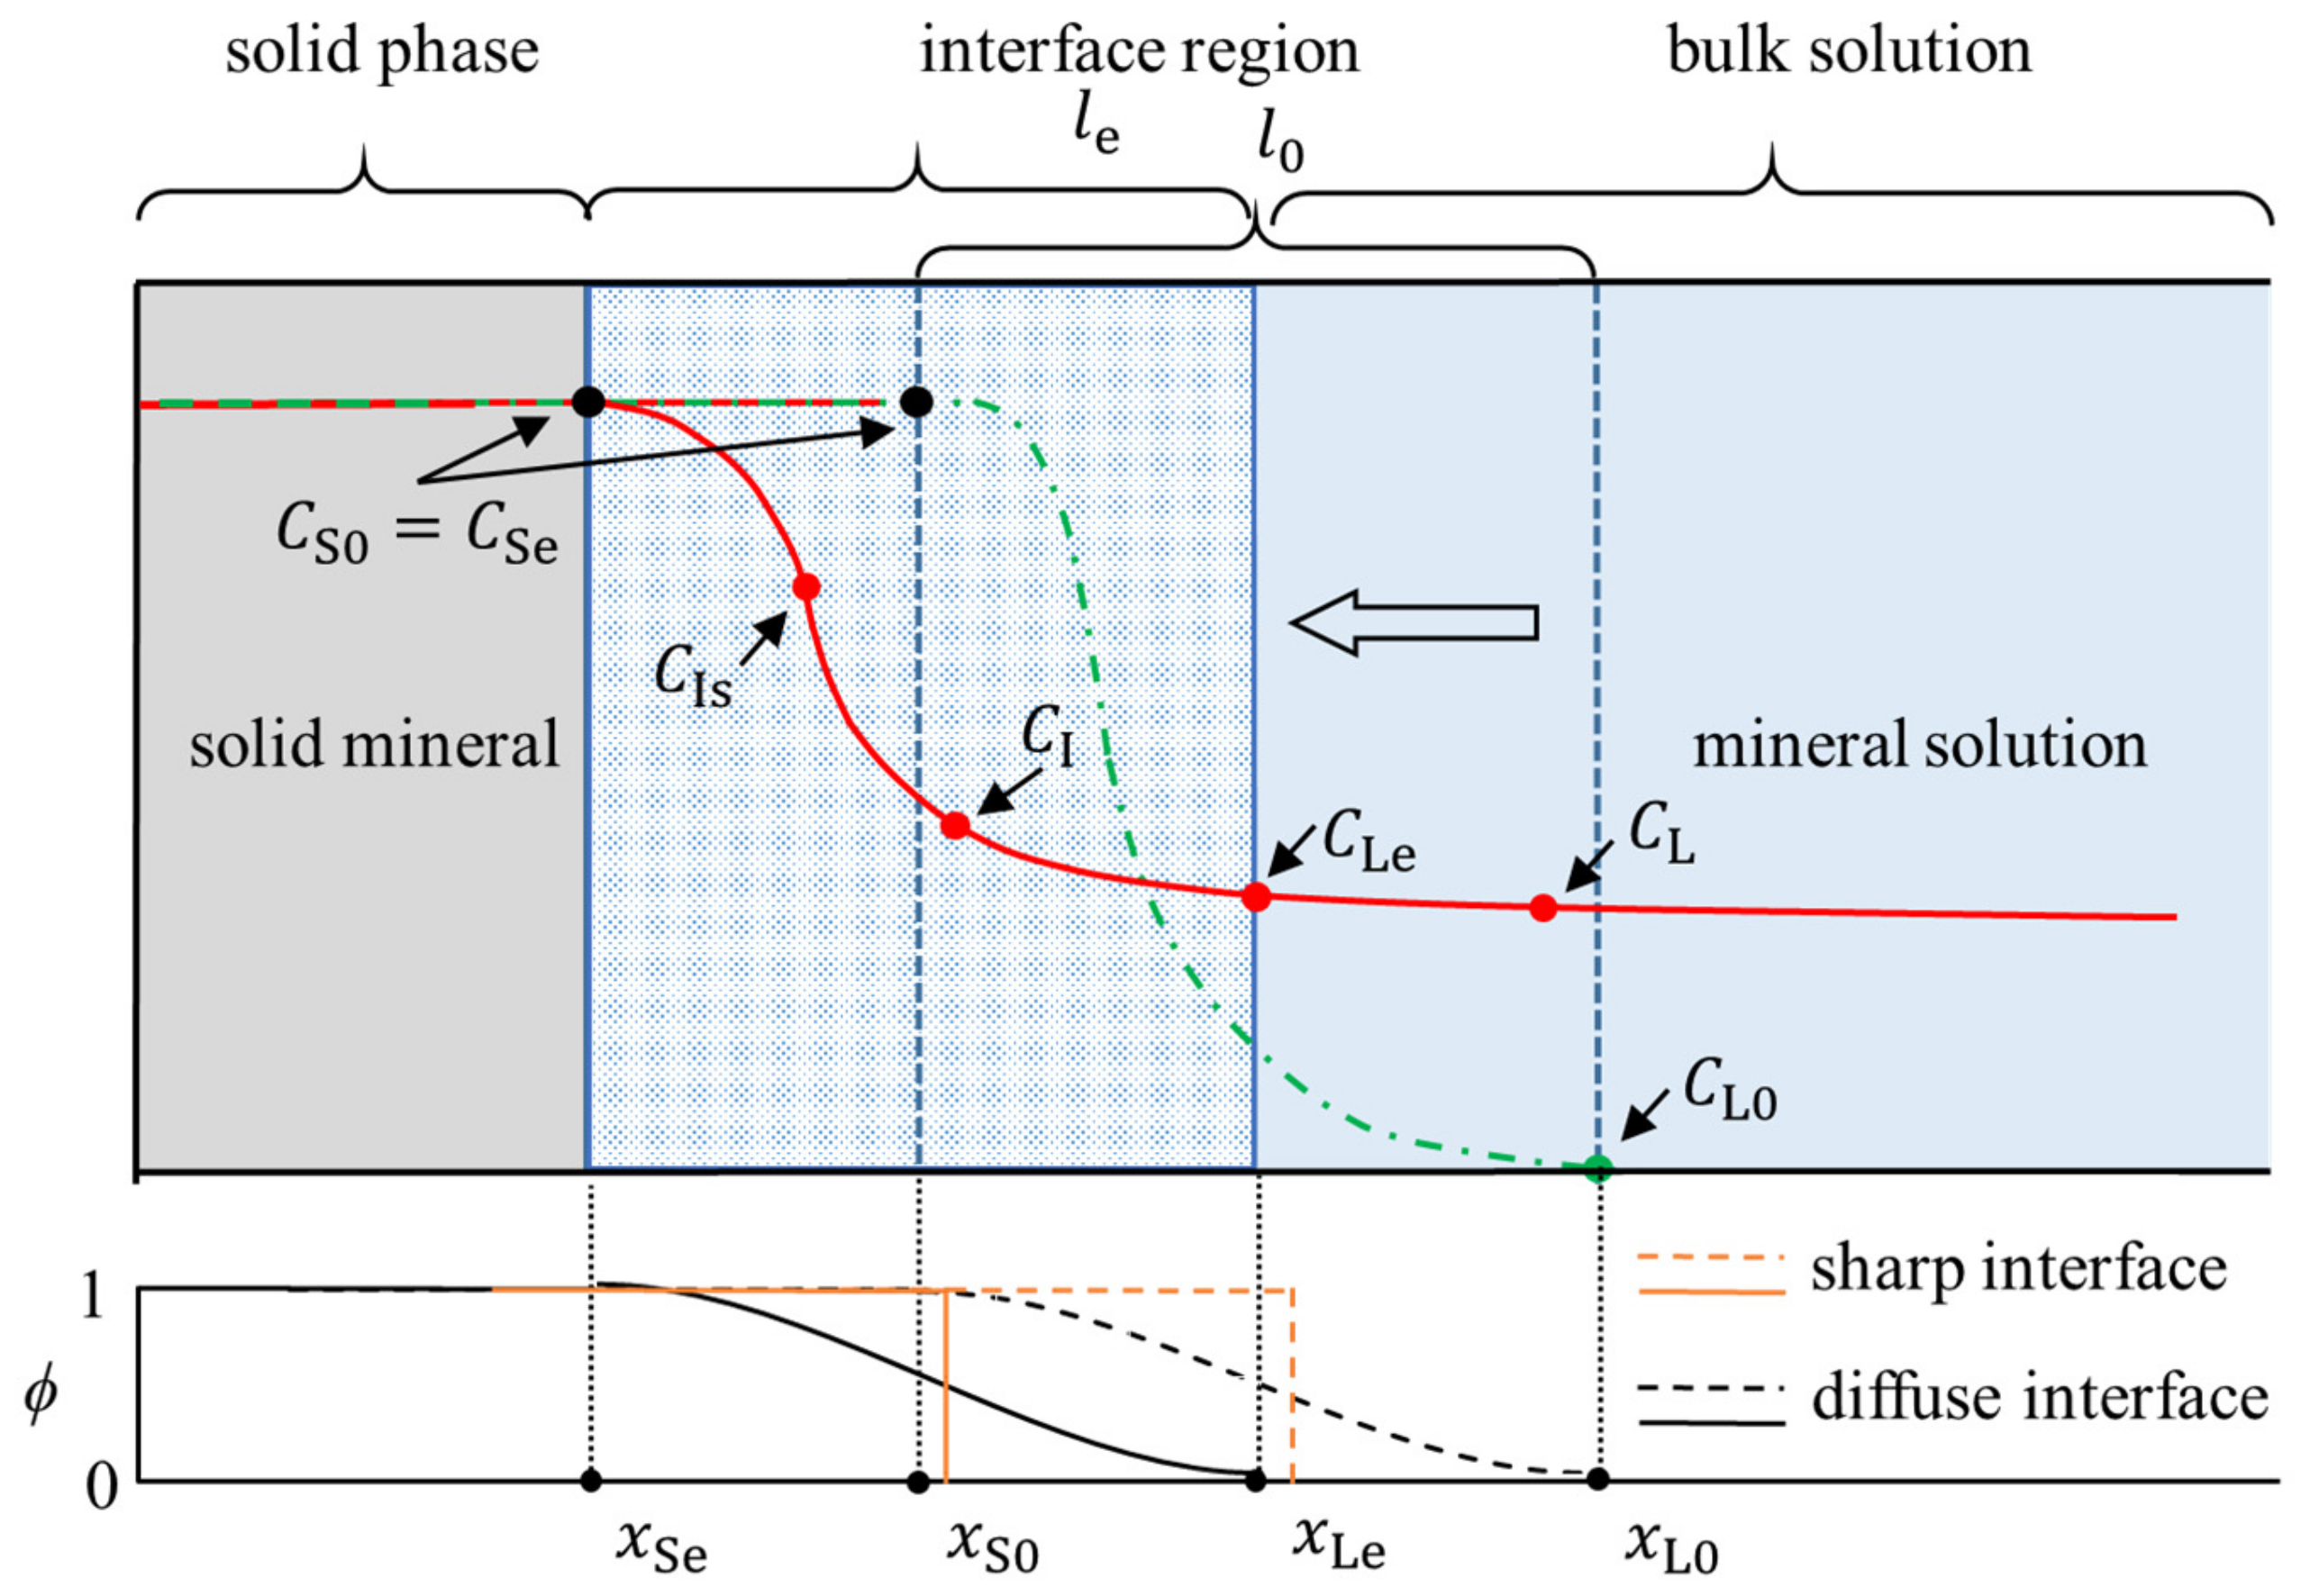
Figure 1. Schematic representation of solute concentration of soluble minerals in situ (i.e., green dotted line) and equilibrium states (i.e., red solid line), and the phase transformation within a diffuse and sharp interface, respectively. For the sharp interface, the evolution of the solute concentration is discontinuous at the interface. However, for the diffuse interface, the solute concentration evolves continuously between their equilibrium values at the mineral ( c Se ) and solution boundary ( c Le ).
Applsci 11 02464 g001
Figure 2. Initial benchmark configurations and boundary conditions for 1D single-component dissolution of a planar solid.
Applsci 11 02464 g002
Figure 3. Adaptive mesh refinement in the simulation for mineral dissolution.
Applsci 11 02464 g003
Figure 4. Comparison of analytical and phase-field (PF) model results of a dissolving planar mineral with variation of interface mobility L, to shift from the fastest diffusion controlled mechanism towards the slower ones limited by reaction rates.
Applsci 11 02464 g004
Figure 5. One-dimensional distribution of solute concentration by PF model ( L = 4.02 × 10⁻¹).
Applsci 11 02464 g005
Figure 6. One-dimensional distribution of interface by PF model ( L = 4.02 × 10⁻¹).
Applsci 11 02464 g006
Figure 7. Snapshots corresponding to different time points in the dissolution profile of the NaCl crystal in 2D simulation.
Applsci 11 02464 g007
Figure 8. The contour change diagram of different particles for ϕ = 0.5.
Applsci 11 02464 g008
Figure 9. Evolution of normalized ϕ * and c * .
Applsci 11 02464 g009
Figure 10. Concentration profiles of single NaCl spherical particle along radial direction with time.
Applsci 11 02464 g010
Figure 11. Phase profiles of single NaCl spherical particle along radial direction with time.
Applsci 11 02464 g011
Figure 12. Comparison of numerical and experimental results of NaCl single particle dissolution.
Applsci 11 02464 g012
Figure 13. Change in solute at the solution boundary with time.
Applsci 11 02464 g013
Table 1. Summary of benchmark parameters.
ParameterDescriptionValueUnit
Δ G Gibbs free energy2233.23 J / m 3
A curvature of the free energy density function6.20 × 103 J / m 3
ω height of the double well potential1.94 × 104 J / m 3
L interface mobility4.02 × 10−5 m 3 / ( J s )
k gradient energy coefficient1.12 × 10−5 J / m
l 0 initial thickness of the diffuse interface1.0 × 10−4 m
σ interfacial energy1.1 × 10−1 J / m 2
D L diffusion coefficient in solution1.0 × 10−9 m 2 / s
D S diffusion coefficient in solute1.0 × 10−15 m 2 / s
c Se saturation concentration in the solid phase1.0 m o l / m 3
c Le saturation concentration in the solution4.0 × 10−1 m o l / m 3
R gas constant8.31 J / ( K m o l )
T ambient temperature2.93 × 102Kelvin
Kequilibrium constant0.4[-]
t calculation time2.88 × 104s
Table 2. Model parameters for diffusion-controlled NaCl dissolution.
ParameterValueUnitRef.
Δ G 5.15 × 10⁵ J / m 3
A 5.17 × 10⁵ J / m 3
ω 1.51 × 10⁵ J / m 3
L 4.11 × 10⁻³ m 3 / ( J s )
k 1.44 × 10⁻⁶ J / m
l 0 1.28 × 10⁻⁵ m
σ 1.10 × 10⁻¹ J / m 2 [96]
D L 1.68 × 10⁻⁹ m 2 / s [96,97]
D S 1.68 × 10⁻¹⁵ m 2 / s
c solid 3.70 × 10⁴ m o l / m 3 [95]
p 357–360 g / L [98,99]
r6.41 × 10−4 m [95]
t 5 × 10²Second[95]
Publisher’s Note: MDPI stays neutral with regard to jurisdictional claims in published maps and institutional affiliations.