Article

Experimental Assessment of the Spatial and Temporal Distribution of Non-Contact Tonometer Airflows

by
Daniela Oehring
1,*,
David Jenkins
2,
Phillip Jonathan Buckhurst
1 and
Hetal Buckhurst
1
1
Faculty of Health, School of Health Professions, University of Plymouth, Plymouth PL6 8AA, UK
2
Faculty of Science and Engineering, School of Engineering, Computing and Mathematics, University of Plymouth, Plymouth PL4 8AA, UK
*
Author to whom correspondence should be addressed.
Appl. Sci. 2021, 11(6), 2499; https://doi.org/10.3390/app11062499
Submission received: 25 January 2021 / Revised: 4 March 2021 / Accepted: 6 March 2021 / Published: 11 March 2021
(This article belongs to the Section Mechanical Engineering)

Abstract

:
(1) The aim of the study was to investigate the spatial and temporal characteristics of the airflow created by two commercially available non-contact tonometers: the CorvisST and the Ocular Response Analyser (ORA). (2) The airflow pressure was measured using a microelectromechanical system (MEMS) pressure sensor to investigate the spatial and temporal distribution. The airflow from the CorvisST and Ocular Response Analyser were mapped to a 600 µm and a 1 mm resolution grid, respectively. (3) Central airflow pressure of the CorvisST (96.4 ± 1.4 mmHg) was higher than that of the Ocular Response Analyser (91.7 ± 0.7 mmHg). The duration of the air-puffs also differed, with the CorvisST showing a shorter duration (21.483 ± 0.2881 ms) than that of the ORA (23.061 ± 0.1872 ms). The rising edge of the CorvisST airflow pressure profile demonstrated a lower gradient (+8.94 mmHg/ms) compared to that of the Ocular Response Analyser (+11.00 mmHg/ms). Both had similar decay response edges: CorvisST −11.18 mmHg/ms, Ocular Response Analyser −11.65 mmHg/ms. (4) The study presents a valid method to investigate the physical dimensions of the airflow pressure of non-contact tonometers. Novel findings relating to the magnitude, duration and spatial characteristics of the respective airflow pressures are reported. It is anticipated that this information will better inform clinical studies and theoretical models relating to ocular biomechanics.

1. Introduction

Tonometers are used to measure the eye’s intraocular pressure (IOP). These tonometers vary in design, but all are based on measuring the force needed to applanate or indent a given surface area of the cornea to infer the pressure within the eye. Limitations relating to the influence of corneal biomechanics on the IOP measurements are well recognised with all tonometric tests. To overcome some of these, a non-contact air-puff tonometers such as the CorvisST (Oculus Optikgeräte GmbH; Wetzlar, Germany) and the Reichert Ocular Response Analysers (ORA; Reichert Technologies Inc., New York, NY, USA) have been developed to provide simultaneous assessment of both corneal biomechanics and IOP.
The CorvisST records the displacement of the corneal surface caused by the application of the airflow over time and derives the IOP by determining the time to first corneal applanation [1]. The biomechanical characteristics derived by the CorvisST are based on the corneal deformation response recorded with the inbuilt high-speed camera system [2]. Recently attempts have been made to develop characteristics which are assumed to represent corneal biomechanics. For these, the pressure inside the piston chamber of the device and experimentally assessed airflow pressure amplitudes have been used [3].
Similarly, the ORA provides a non-invasive measurement of IOP utilising an airflow of 300 m/s for 20 ms to applanate the cornea [4]. Following a controlled increase in airflow pressure during the inward deformation of the cornea, a defined decrease in pressure occurs through the outward phase of the deformation [4,5]. Through the use of the piston chamber pressure, data obtained from each measurement and empirically derived algorithms, the ORA offers measures of corneal hysteresis and corneal resistance factors that can be considered with the IOP [4]. However, the measurements derived by the ORA are not true representatives of corneal properties, but measurements that are thought to be related to corneal behaviour and in particular viscoelasticity and the mechanical stiffness that is governed by corneal thickness.
Despite significant efforts to understand corneal biomechanics with the use of the CorvisST and ORA [2,6,7,8,9,10,11,12], there is a dearth of literature on the actual physical and geometric properties of the airflow pressure applied to the cornea with these devices. Indeed, the physical attributes of the airflow pressure applied during non-contact tonometry is fundamental to the measures of both IOP and corneal biomechanics. For both the CorvisST and ORA, the airflow pressure for each tonometer measurement is generated by an inbuilt piston-cylinder system (further referred as chamber pressure), Figure 1. The temporal profile of the chamber pressure varies in shape, height and width depending on the specific tonometer. The tonometer nozzle consists of a tube with an inner diameter of 1 to 2 mm, through which, the airflow exits the device. Most tonometers require an 11 mm distance between the nozzle and the eye. When considering the jet stream created by the tonometer, the nozzle-to-eye distance is likely to affect the cross-sectional profile of the pressure applied to the eye, i.e., a short nozzle-to-eye distance is likely to result in a narrower cross-section of the airflow being applied at the corneal plane when compared to a long distance [13]. This effect is likely to be pronounced as the velocity of the airflow is assumed to lie within a narrow range of 300 to 400 km/h [14,15]. Due to the nozzle-to-eye distance and subsequent change in the pressure profile, it may be justifiably assumed that the spatial and temporal profile of the actual airflow pressure on the cornea differs significantly from that of the piston chamber pressure.
The knowledge of the actual physical pressure and its spatial and temporal distribution at the corneal plane is limited but has been a topic of much debate. Previous understanding of the airflow pressure has been based on advanced models of the cornea and extracted from the airflow pressure within the tonometer with the view of identifying the material properties of the cornea [16,17,18,19,20].
Through empirical assessments and numerical simulations, previous attempts to characterise the CorvisST airflow pressure at eye-to-nozzle working distances provide disparate results. Using a differential pressure sensor, Kling, Bekesi [21] demonstrated the CorvisST airflow at 11 mm distance reached a maximum of 120 mmHg lasting 27.50 ms. Fitting the temporal pressure profile with a linear function, the study reported that the increasing pressure phase was maintained for 18.2 ms, whilst the decreasing phase lasted for 9.3 ms. In comparison, Metzler et al. [22,23] used hot-wire anemometry at different sensor-to-nozzle distances to obtain measures of the CorvisST airflow velocity. Between 9 and 12 mm, the airflow velocity was above 90 m/s, whereas at the nozzle it was over 100 m/s. With the use of the Navier–Stokes equation, the pressure at the nozzle and corneal plane (11 mm distance) were estimated to be 124.6 and 100.9 mmHg, respectively. In a numerical simulation experiment, Bahr, Ali [24] reported the maximal airflow velocity to be 80 m/s at the nozzle, but at the corneal surface they found the maximal airflow pressure to be significantly lower at approximately 2.3 kPa (17.3 mmHg). Despite these attempts to characterise the CorvisST airflow, there is still ambiguity surrounding its physical profile. Regarding the ORA, little is known about the air flow’s spatial and temporal distribution. Work by Luce [25] suggests that the air flow demonstrates a Gaussian profile with a constant width. According to the operation manual, the amplitude of the pressure curve varies with the eye’s IOP; the higher the IOP, the greater the amplitude of the pressure curve.
Given that the assessment of the IOP and corneal biomechanics with the CorvisST and ORA are based upon the application of known forces to the cornea, there is still no comprehensive evidence available about the spatial distribution, magnitude and duration of the airflow pressure generated by these devices. Moreover, it is still unclear how much of the cornea is affected during the application of the pressure and how repeatable the airflow pressure is across the entire ocular surface.
Since the introduction of the CorvisST and ORA, there has been much clinical interest in assessing corneal biomechanics in vivo and many have compared and contrasted the metrics produced by these two devices [2,26,27,28,29], but little consideration has been given to assessing whether the principal airflow used by the devices are equivalent or not. Understanding the fundamental physical characteristics of the airflow pressures produced by non-contact tonometers is vital when interpreting measures of IOP and corneal biomechanics. Thus, the principal aim of this experimental study was to investigate the spatial and temporal characteristics of the airflow pressure produced by the CorvisST and ORA and to assess their concordance.

2. Materials and Methods

2.1. Experimental Set Up

2.1.1. Pressure Sensor

The typical non-contact tonometer operating distance was assumed to be 11 mm. In view of these assumptions, a range of sensors were tested (silicon piezoresistive, dual pressure sensor; piezoresistive transducer, differential pressure sensor, piezoresistive static force sensor; piezoresistive transducer, gauge pressure sensor; differential compensated pressure sensor) for their applicability. The linear time-invariant systems were found to be best suited for the requirements, and thus the gauge pressure sensor (the MPX5050GP (Freescale Halbleiter Deutschland GmbH, Munich, Germany) was chosen for investigation. The MPX5050GP is a piezoresistive, monolithic silicon pressure sensor which offers a differential sensitivity of 7.241 mmHg for a full scale of 362.004 mmHg, with an accuracy of ±2.5% over the whole detection span.

2.1.2. Mapping Grids

The mapping procedure for the CorvisST and the ORA was different as the CorvisST facilitates a viewing screen to capture the measurement area, whereas the ORA facilitates infrared emitters and detectors to record the corneal response to the air-puff.
For both devices, conventional digital photo cameras were used to evaluate the position accuracy for the mapping procedure. One camera was positioned on axis with the sensor opening and the device nozzle, and one perpendicular, to capture the position of the sensor tube and nozzle for each measurement. Photos were then used to analyse the nozzle-sensor position accuracy for the horizontal and vertical distance as well as tilt.
CorvisST: To assess the absolute pressure, Map 1 was developed. Map 2 had a higher spatial resolution and was used for the spatial and temporal mapping.
Using millimetre graph paper, the size of the area imaged by CorvisST at 11 mm distance from the nozzle was determined to be (12.7 × 10.6) mm. The pressure sensor with a tube opening of 1.0 mm diameter was placed 11 mm from the CorvisST nozzle; the CorvisST screen was captured with a conventional digital camera. The image of the sensor tube opening on the CorvisST screen was used to develop a mapping grid (Figure 2a,b) which was the size of the CorvisST screen (75 × 90) mm. Since the CorvisST screen is rectangle shaped (Figure 2a), the grid comprised 137 measurement points: 12 to 13 horizontally and 11 vertically. The mapping grid 1 (Map 1) was used to measure the absolute pressure of the CorvisST airflow.
For assessing the spatial extent of the airflow pressure, the resolution of the measurement map was increased to 600 µm using an aluminium aperture, fixed at the pressure sensor tube opening (Figure 2b). Measurement of the pressure was dependent upon the diameter of the tube opening, with small aperture size reducing the output signal. When using an aperture diameter smaller than 600 µm, it was not possible to differentiate the magnitude of the output signal from the sensor noise. Using the 600 µm aperture, the second mapping grid (Map 2) was created with 382 measurement points, Figure 2a,b.
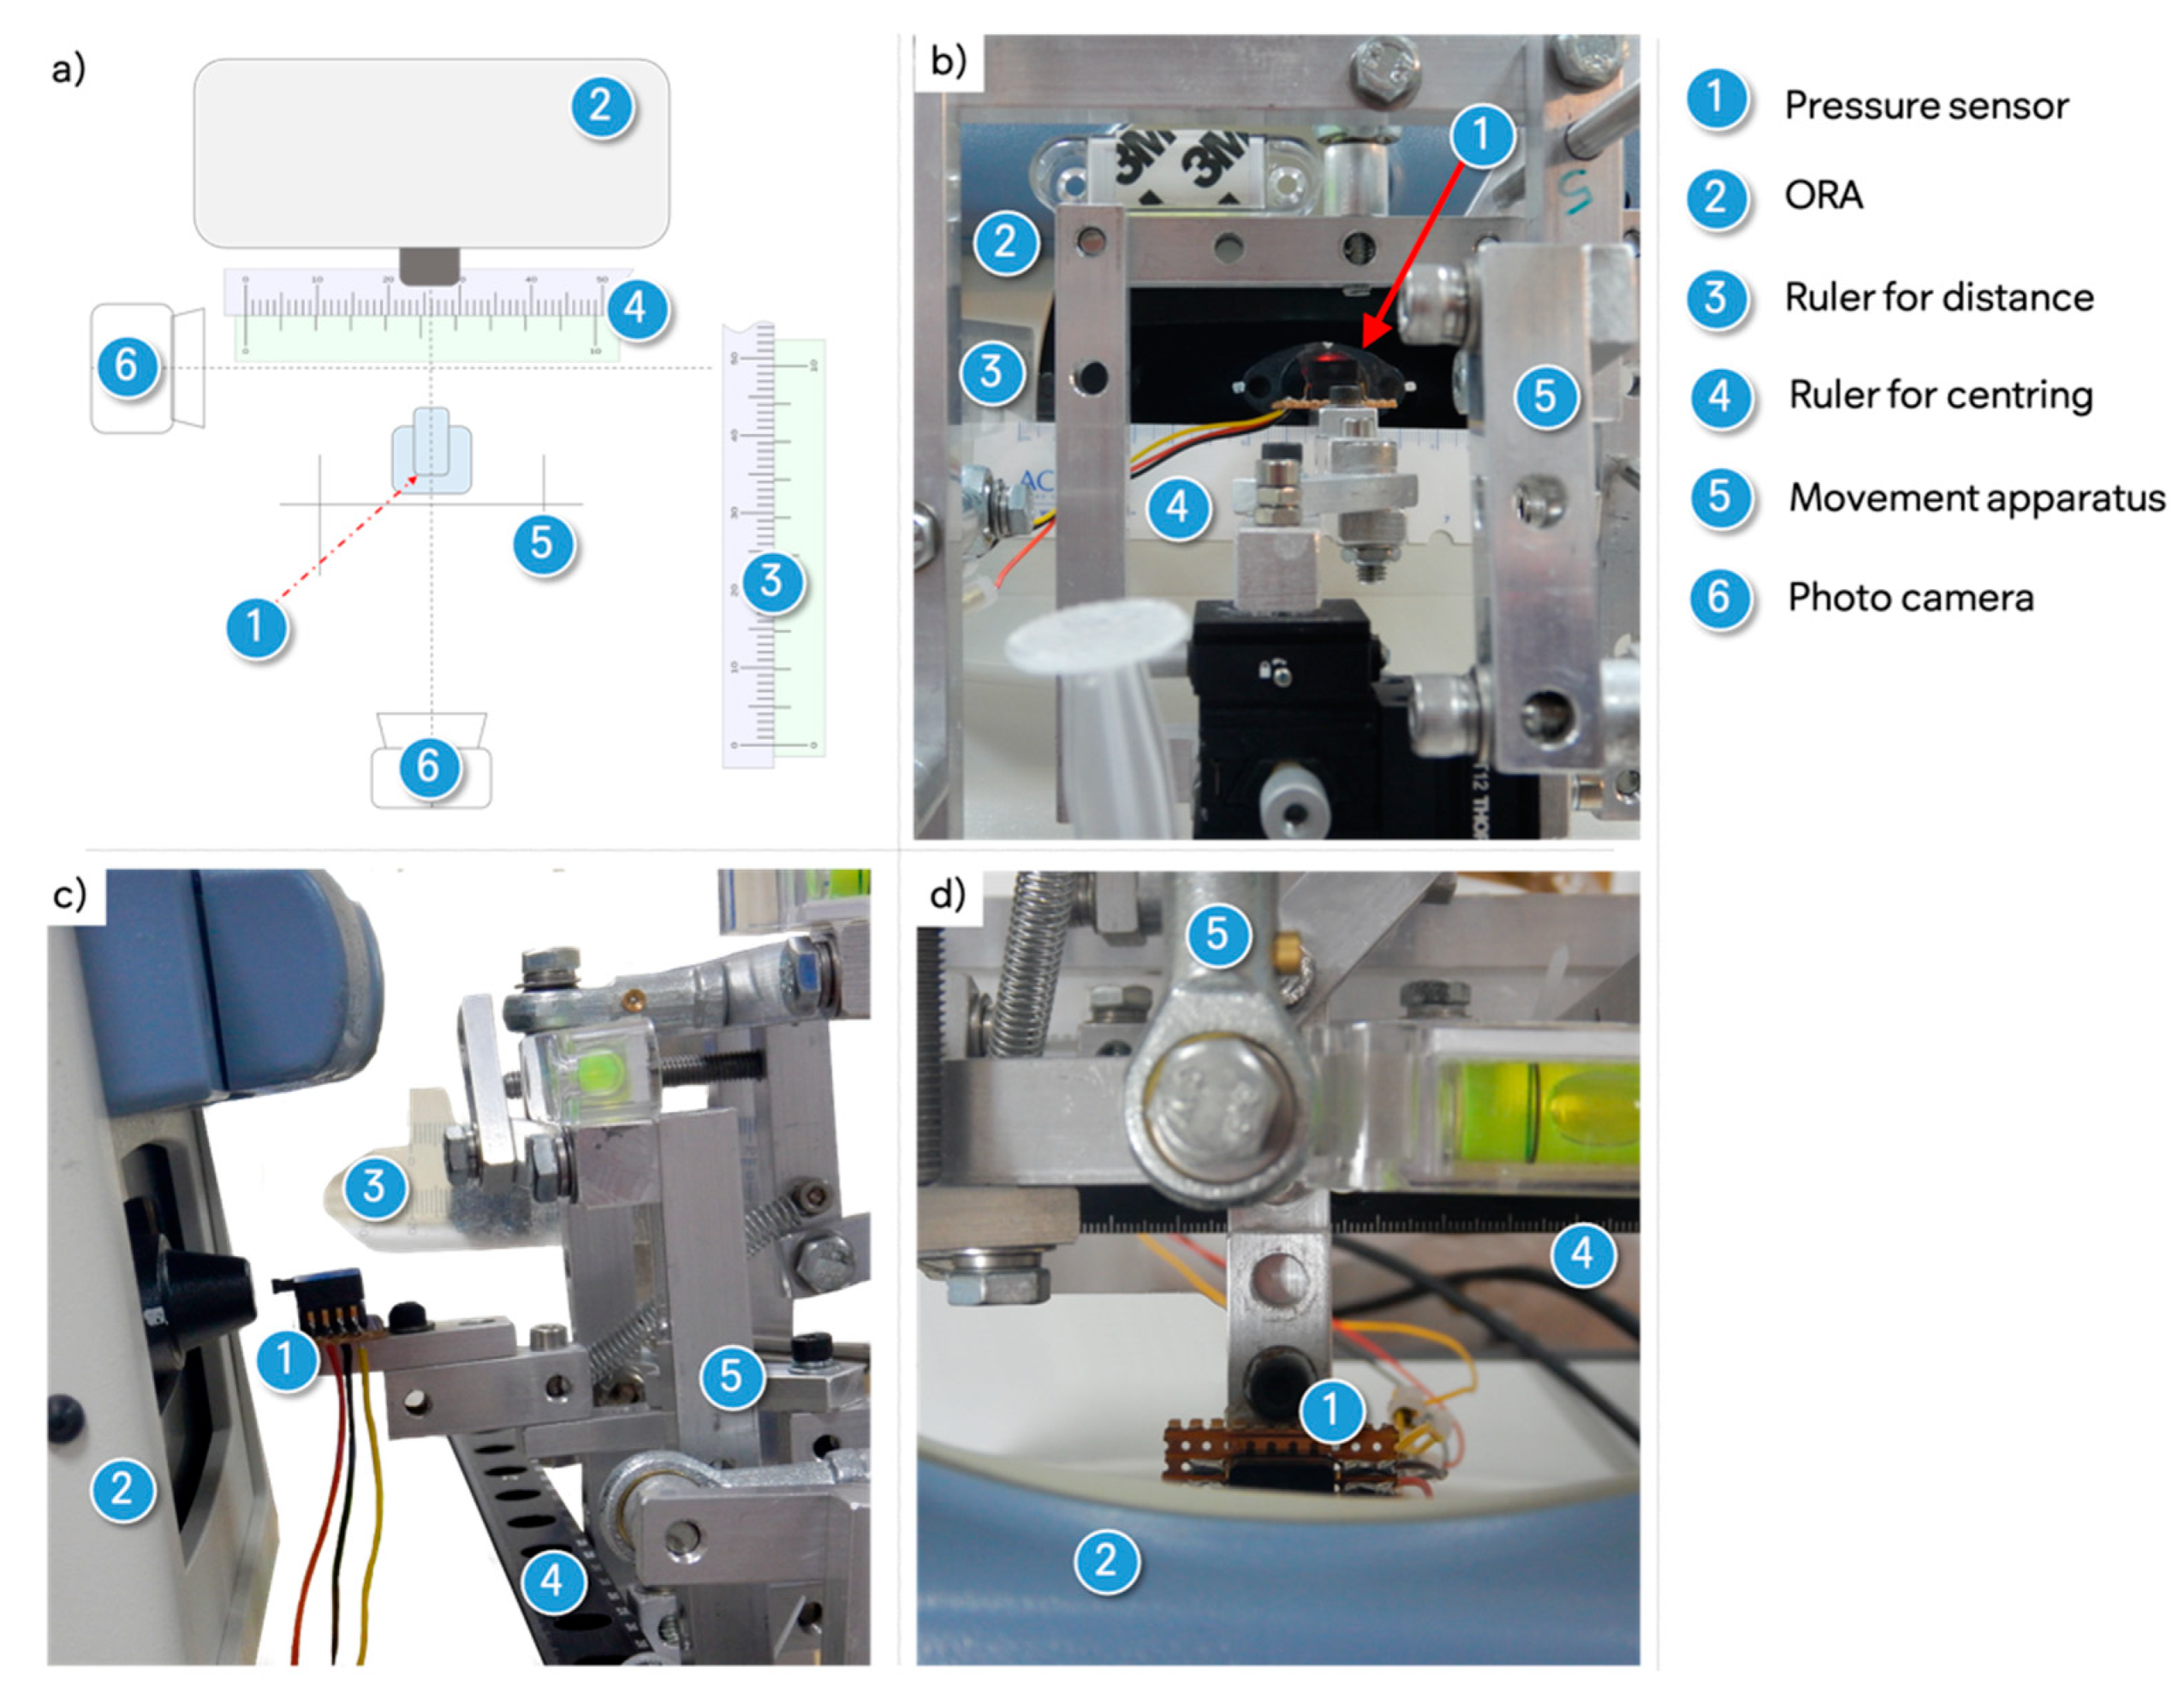
ORA: Unlike the CorvisST, the ORA does not have a viewing screen. Therefore, the pressure sensor tube opening was manually aligned with the tonometer nozzle for distance (11 mm), height and tilt. To avoid parallax errors, two digital cameras were placed parallel and perpendicular to the ORA nozzle, thus capturing a view of the nozzle and the sensor tube. The cameras were connected to a computer allowing simultaneous viewing and control of the position of the pressure sensor in real-time. Since the ORA was kept in a static position (Figure 3), the tonometer nozzle and the sensor tube opening were aligned (Figure 3b). To allow visual alignment between sensor and nozzle, the casing of the pressure sensor was marked horizontally on each side with a straight line to highlight the centre of the sensor (Figure 3b(1)). The real time camera images on a computer screen were used to fit a digital level (Ruler for Mac V.20.2) between the nozzle and the sensor casing lines to amend the position of the sensor tube to the ORA nozzle.
To investigate the spatial and temporal distribution, the pressure sensor was moved horizontally and vertically in one-millimetre increments until a measurement area of (13.0 × 7.0) mm was assessed; hence, in this manner 117 measurement points were evaluated.

2.1.3. Pressure Recording

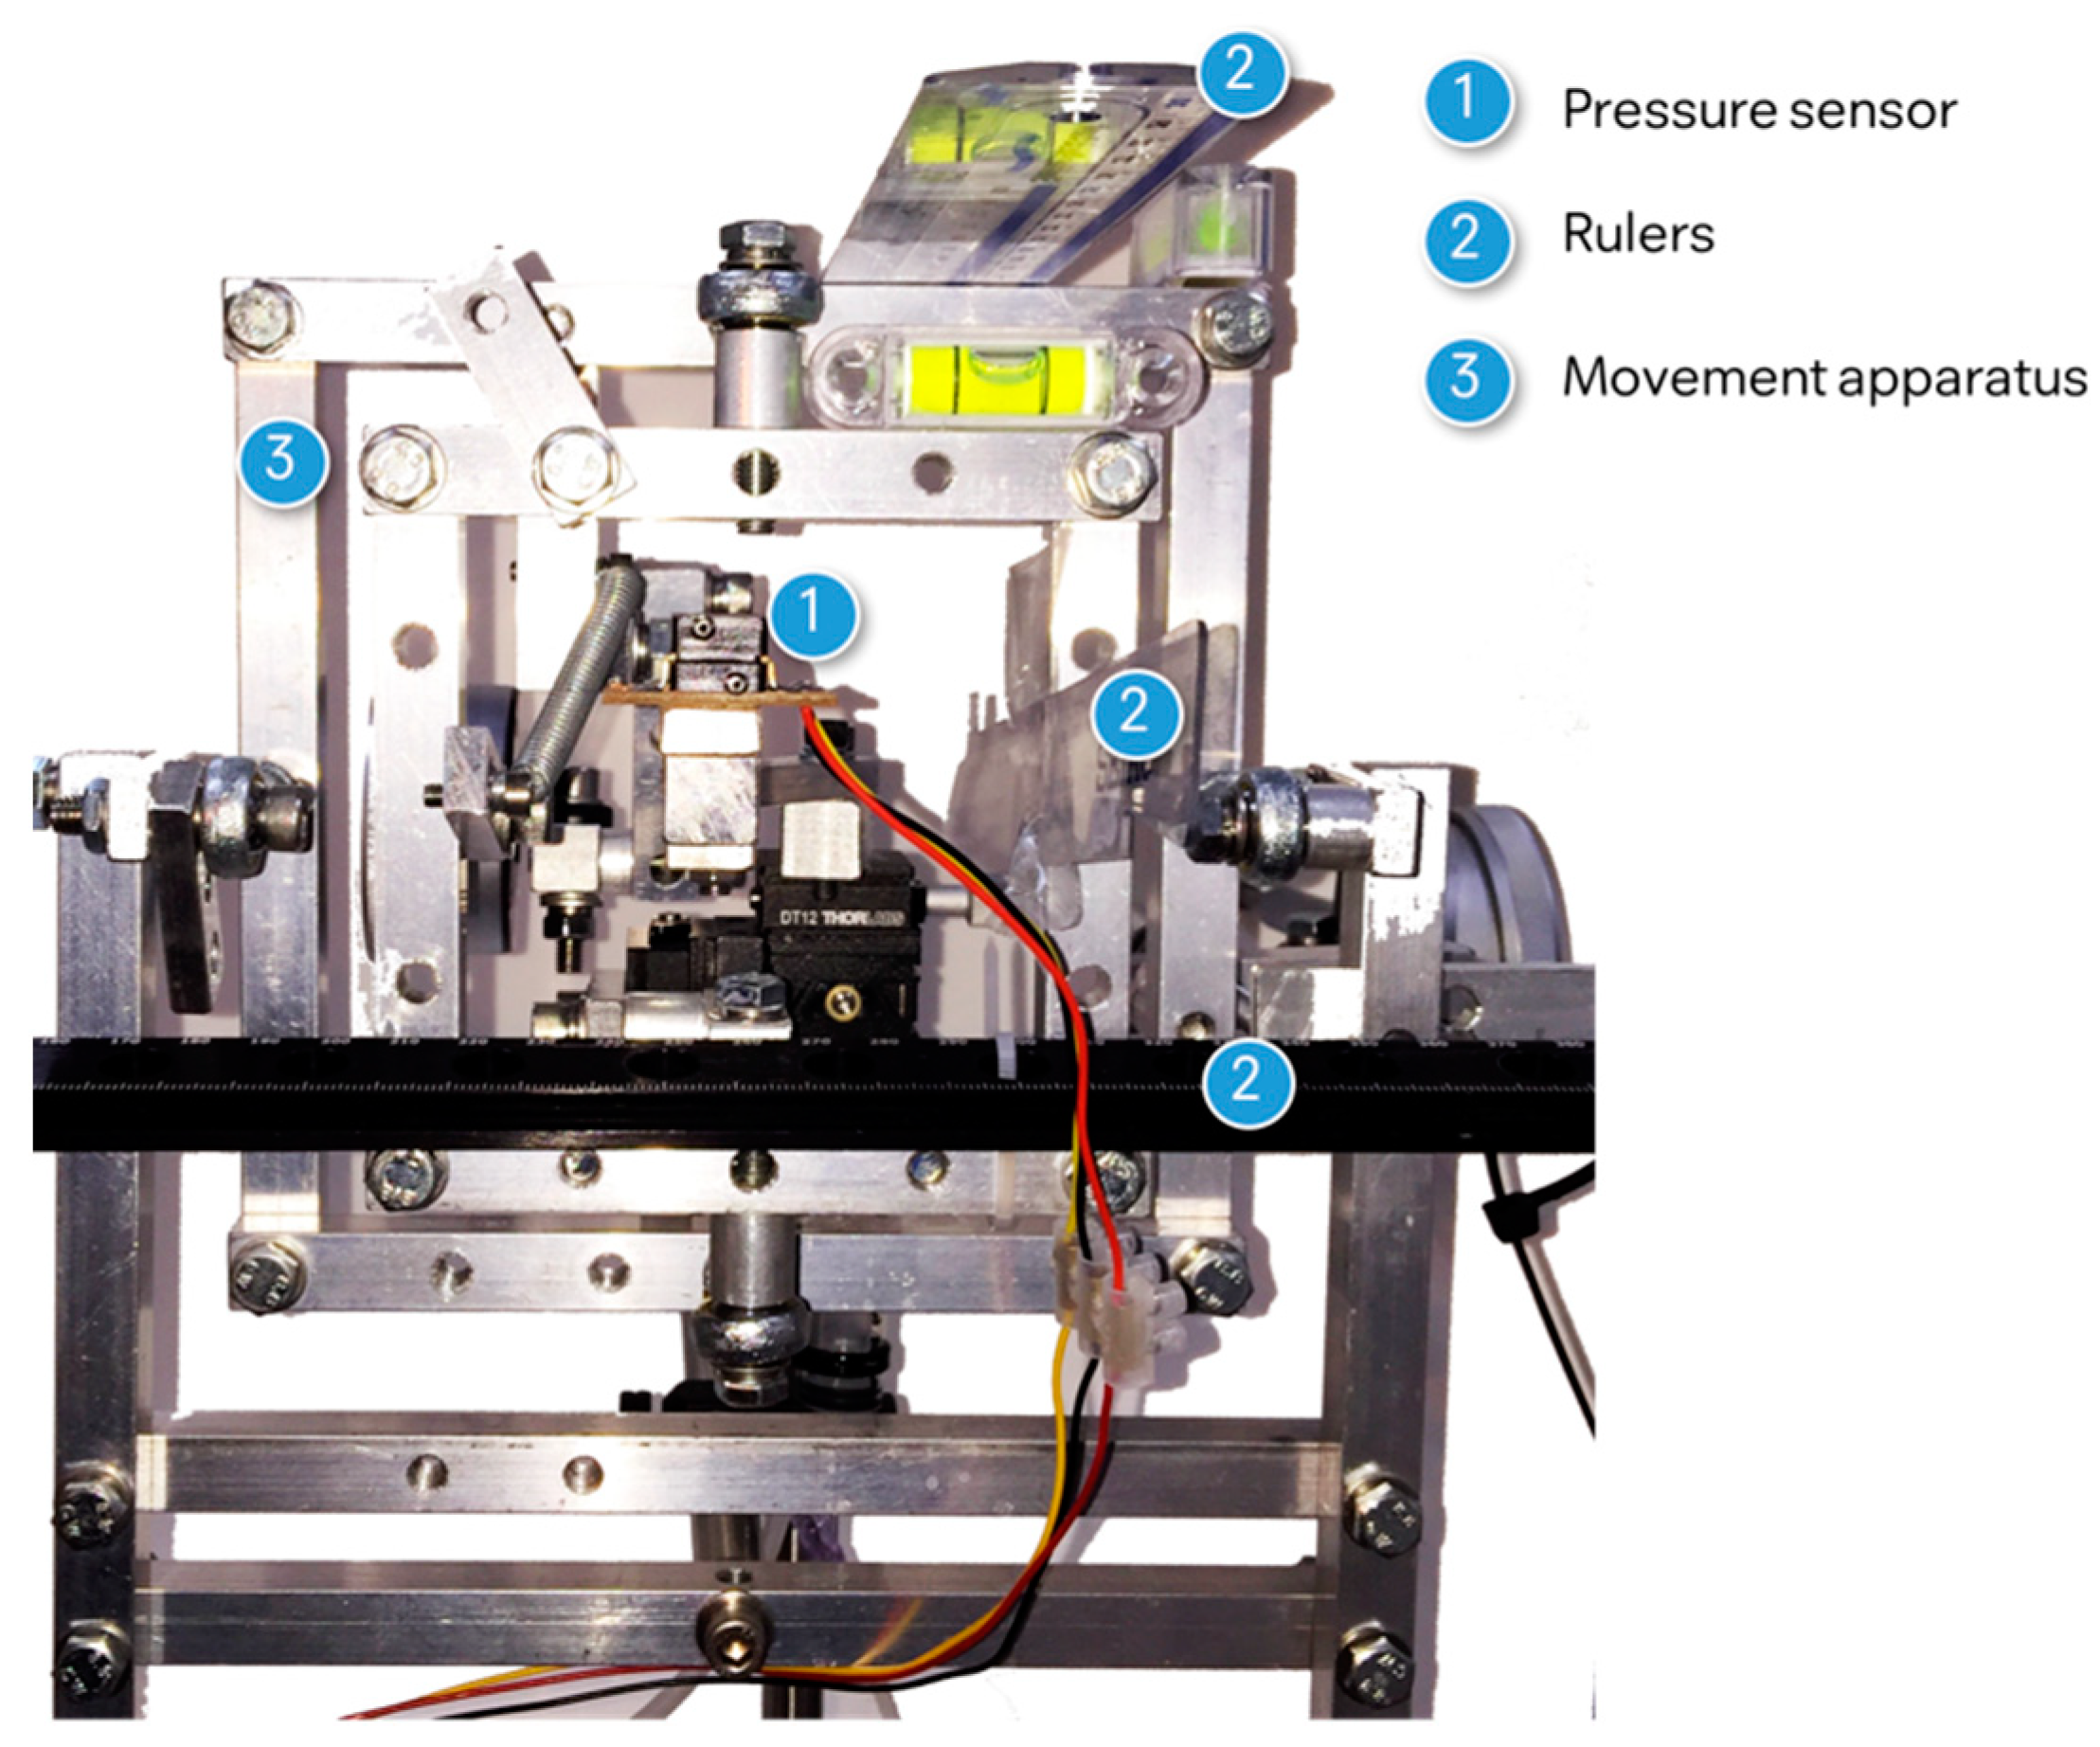
The set-up required a digital oscilloscope (NI myDAQ) connected to a laptop (Toshiba LT, Intel Core i5-2520M CPU 2.5 GH, RAM 8.00 GB; Windows 7 Enterprise 64-bit) within LabVIEW. The pressure sensor was connected to the oscilloscope. The sensor was housed in a custom designed holder which allowed precise horizontal, vertical and angular movement in 50 µm increments, Figure 4(3). The distance between the nozzle and the sensor was adjusted to 11.0 mm. To ensure adequate positioning spirit levels, digital rulers and two digital camera systems were used to line up the nozzle and the sensor position in real-time.
For the CorvisST measurements only, the mainboard of the CorvisST was connected to the oscilloscope to record the piston chamber pressure. The main board signal that initiated the cylinder movement was used as a trigger to commence the oscilloscope recording.
For the ORA, the air-puff and the oscilloscope recordings were initiated manually.
A programme was coded in LabVIEW 2015 (V15.0f2, 32-bit) to record and export pressure readings. The program consists of a loop (n = 30), and the input signal range was set to 0 to 5 V, 10 kHz and 20,000 samples. For each measurement, a time frame of 60 s and 1.2 million time points was recorded. The LabVIEW programme used to process the readings for the spatial and temporal assessment of the airflow provided a temporal resolution of 100 µs. Output signals were saved as binary TDMS files containing the raw readings. Subsequently, the binary TDMS files were imported into Microsoft Excel 2016 for Mac (Microsoft Inc., Redmond, WA, USA).
For the CorvisST, the programme was able to capture the pressure input signals simultaneously: signals from both the sensor and CorvisST mainboard.

2.2. Mapping Procedure

For the purposes of the investigation, the geometric extent of the airflow was estimated to be analogous to the average horizontal corneal diameter size of 12 mm [30]. Furthermore, to simulate a curved mapping surface, the average corneal radius of 7.8 mm [31] with an eccentricity of 0.5 [32] was used.
CorvisST: To record the maximum pressure, Map 1 was used (resolution 1 mm). Map 2 (resolution 0.6 mm) was utilised to assess the spatial and temporal distribution in depth. The respective mapping grid was placed on the CorvisST screen and the sensor or aperture opening were, respectively, aligned according to the measurement point on the grid.
Starting centrally, the CorvisST was moved horizontally and/or vertically to align to the next measurement point until for each point a pressure value was obtained. The pressure sensor was moved backwards/forwards to change the distance between nozzle and tube opening, accounting for the corneal curvature. Therefore, the pressure readings were taken on a curved surface.
At each measurement point, the CorvisST airflow was triggered and recorded ten times consecutively, and the mean was used to obtain the pressure value at the specific point.
ORA: To assess the spatial and temporal distribution of the ORA air-puff, the ORA device was kept in a static position. The pressure sensor was moved to align the nozzle with the pressure sensor opening for each measurement point. The pressure sensor was moved horizontally and vertically in 1 mm steps, starting centrally. To account for corneal curvature change, the pressure sensor was also moved to change the distance between nozzle and sensor. At each point, the ORA airflow was initiated ten times using the demo puff mode, and the average was used as the value for each position.

2.3. Data Processing

CorvisST: The piston chamber pressure is automatically recorded by the CorvisST and provided as a pressure reading (mmHg) per frame for each measurement. To match the airflow pressure readings on to the CorvisST high-speed camera frame rate, the piston chamber pressure recorded by the LabVIEW programme was synchronised with the CorvisST airflow pressure results. Airflow pressure and piston-chamber pressure data within ±30 ms of the maximum piston-chamber pressure were extracted for further analysis.
ORA: Unlike with the CorvisST, it was not possible to determine the location of the piston chamber pressure signal on the mainboard of the ORA. Therefore, the recorded airflow pressures were synchronised by their respective maximum value. This was challenging given that the ORA pressure values are only provided as a graphical output with discrete numbers per frame. Therefore, different frequencies were trialled to find the matching time domain resolution between the ORA and the oscilloscope output. These trials showed the recording frequency of the ORA’s piston chamber pressure to be equivalent to 11 kHz, which was used for further analysis.

2.4. Outcome Measures and Analysis

The primary outcome measure was the airflow pressure over time recorded for both devices. Spatial and temporal distributions were analysed and visualised.
Environmental factors such as the temperature, humidity and atmospheric pressure were monitored using a conventional hygrometer and a barometer app with GPS tracking and height calibration and were kept constant throughout the experiment. To minimise the effects of background noise potentially contaminating sensor readings, data were collected over weekends or evenings after normal working hours.
To evaluate the accuracy of the mapping, for each measurement the camera pictures were used to analyse the position of the sensor tube opening and the nozzle. Ten pictures for each measurement point were taken and averaged to describe the respective position.
Standard statistical analysis (mean and standard deviation (SD)) was used to determine the airflow pressure for each measurement point. Covariance (CoV) was calculated to analyse the variability of the recorded pressure over time and for each point. For comparisons between pressure curves, the full width at half maximum (FWHM) was used.

3. Results

3.1. Evaluation of the Experimental Set Up

3.1.1. Sensor Noise and Signal-to-Noise Ratio

The estimated type B uncertainty was found to be between 0.722 and 1.776 kPa. Trial measurements for both devices showed that the recorded airflow pressure had maximal magnitudes of 1.600 V (15.6 kPa). Thus, the range of uncertainty for the airflow pressure was between 0.725 and 0.889 kPa (5.433 to 6.669 mmHg).
The average noise level of the sensor was detected to be 0.166 kPa with a range from 0.139 to 0.168 kPa (1.250 mmHg, from 1.041 to 1.258 mmHg); airflow pressure less than the maximum noise level could be distinguished from the sensor noise.
The signal to noise ratio during the maximum airflow pressure was 17.6 dB (V = 1.445 kPa, SD = 191.20 Pa). To minimise the noise of the sensor readings, the raw data were smoothed by eliminating the Fourier components, with higher frequencies than the calculated cut-off frequency using five consecutive data points as the analysis interval. This improved the signal to noise ratio by 57.0 dB (SD = 2.020 Pa).

3.1.2. Mapping Procedure

The position accuracy for the CorvisST was within ±0.03 mm for the spatial assessment. The variability of the position of the tube opening and the ORA nozzle was ±0.44 mm and included the inclination of the ORA nozzle.

3.2. CorvisST Airflow Pressure

3.2.1. Spatial Distribution

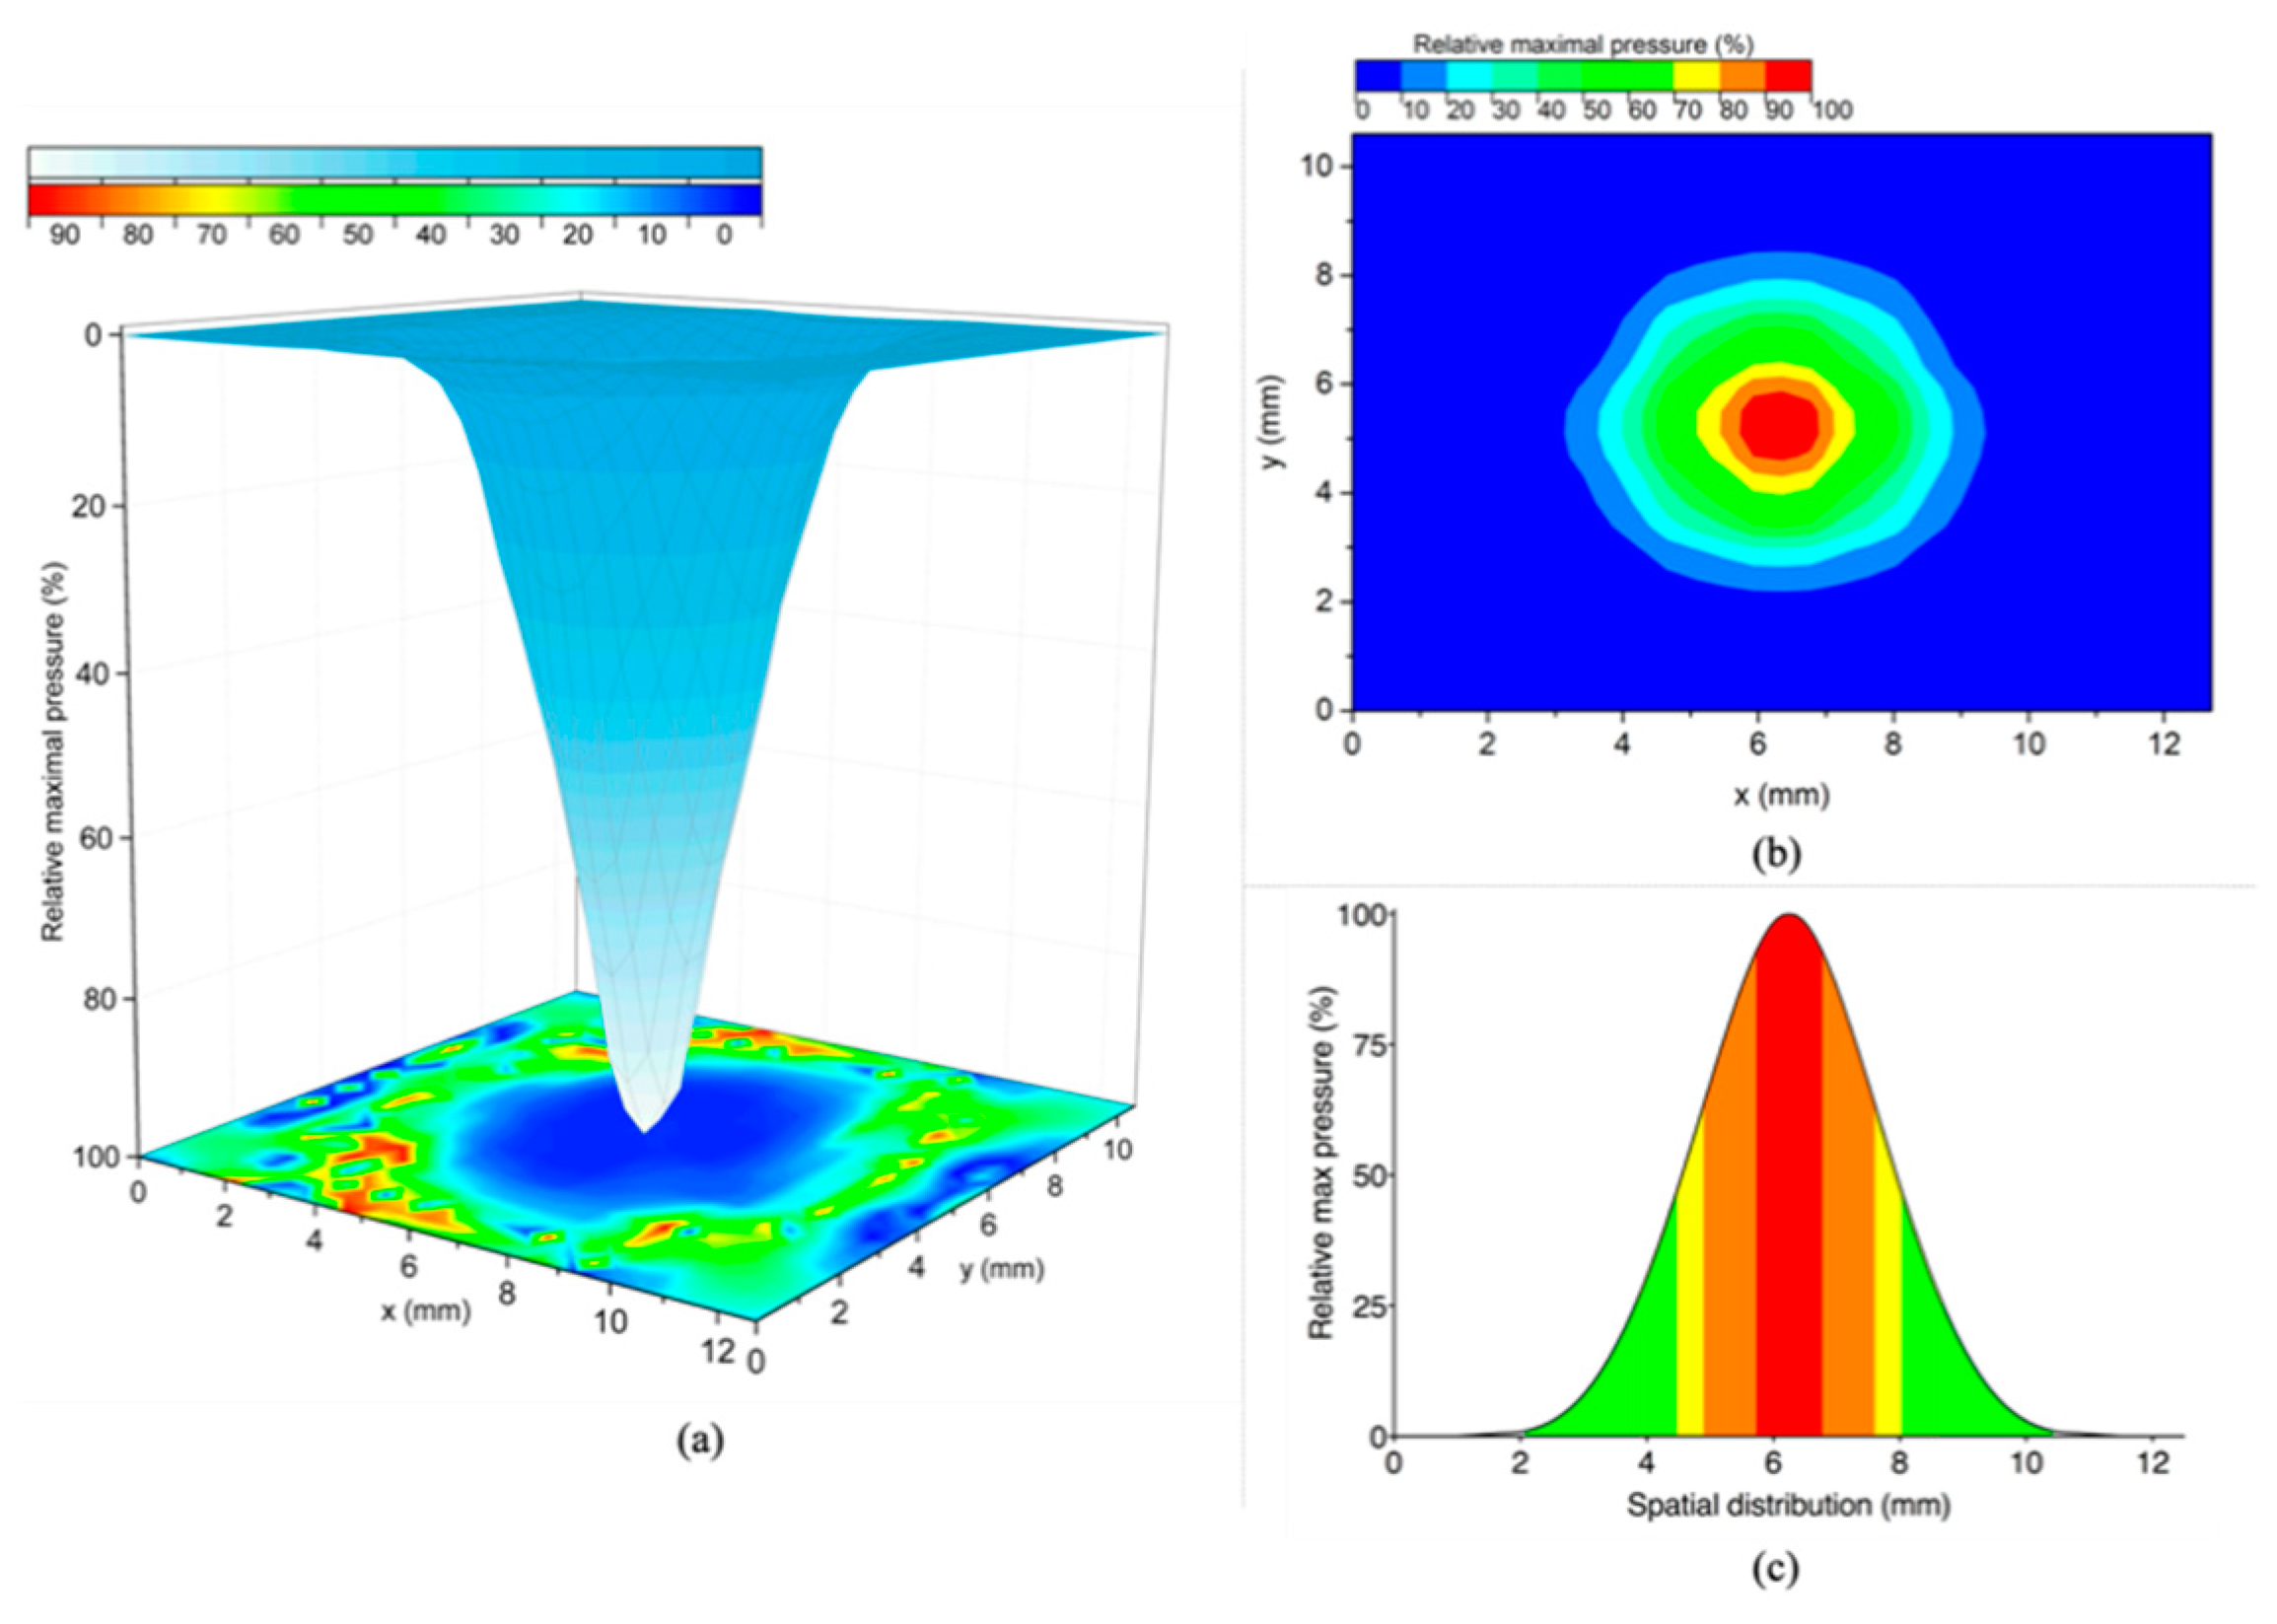
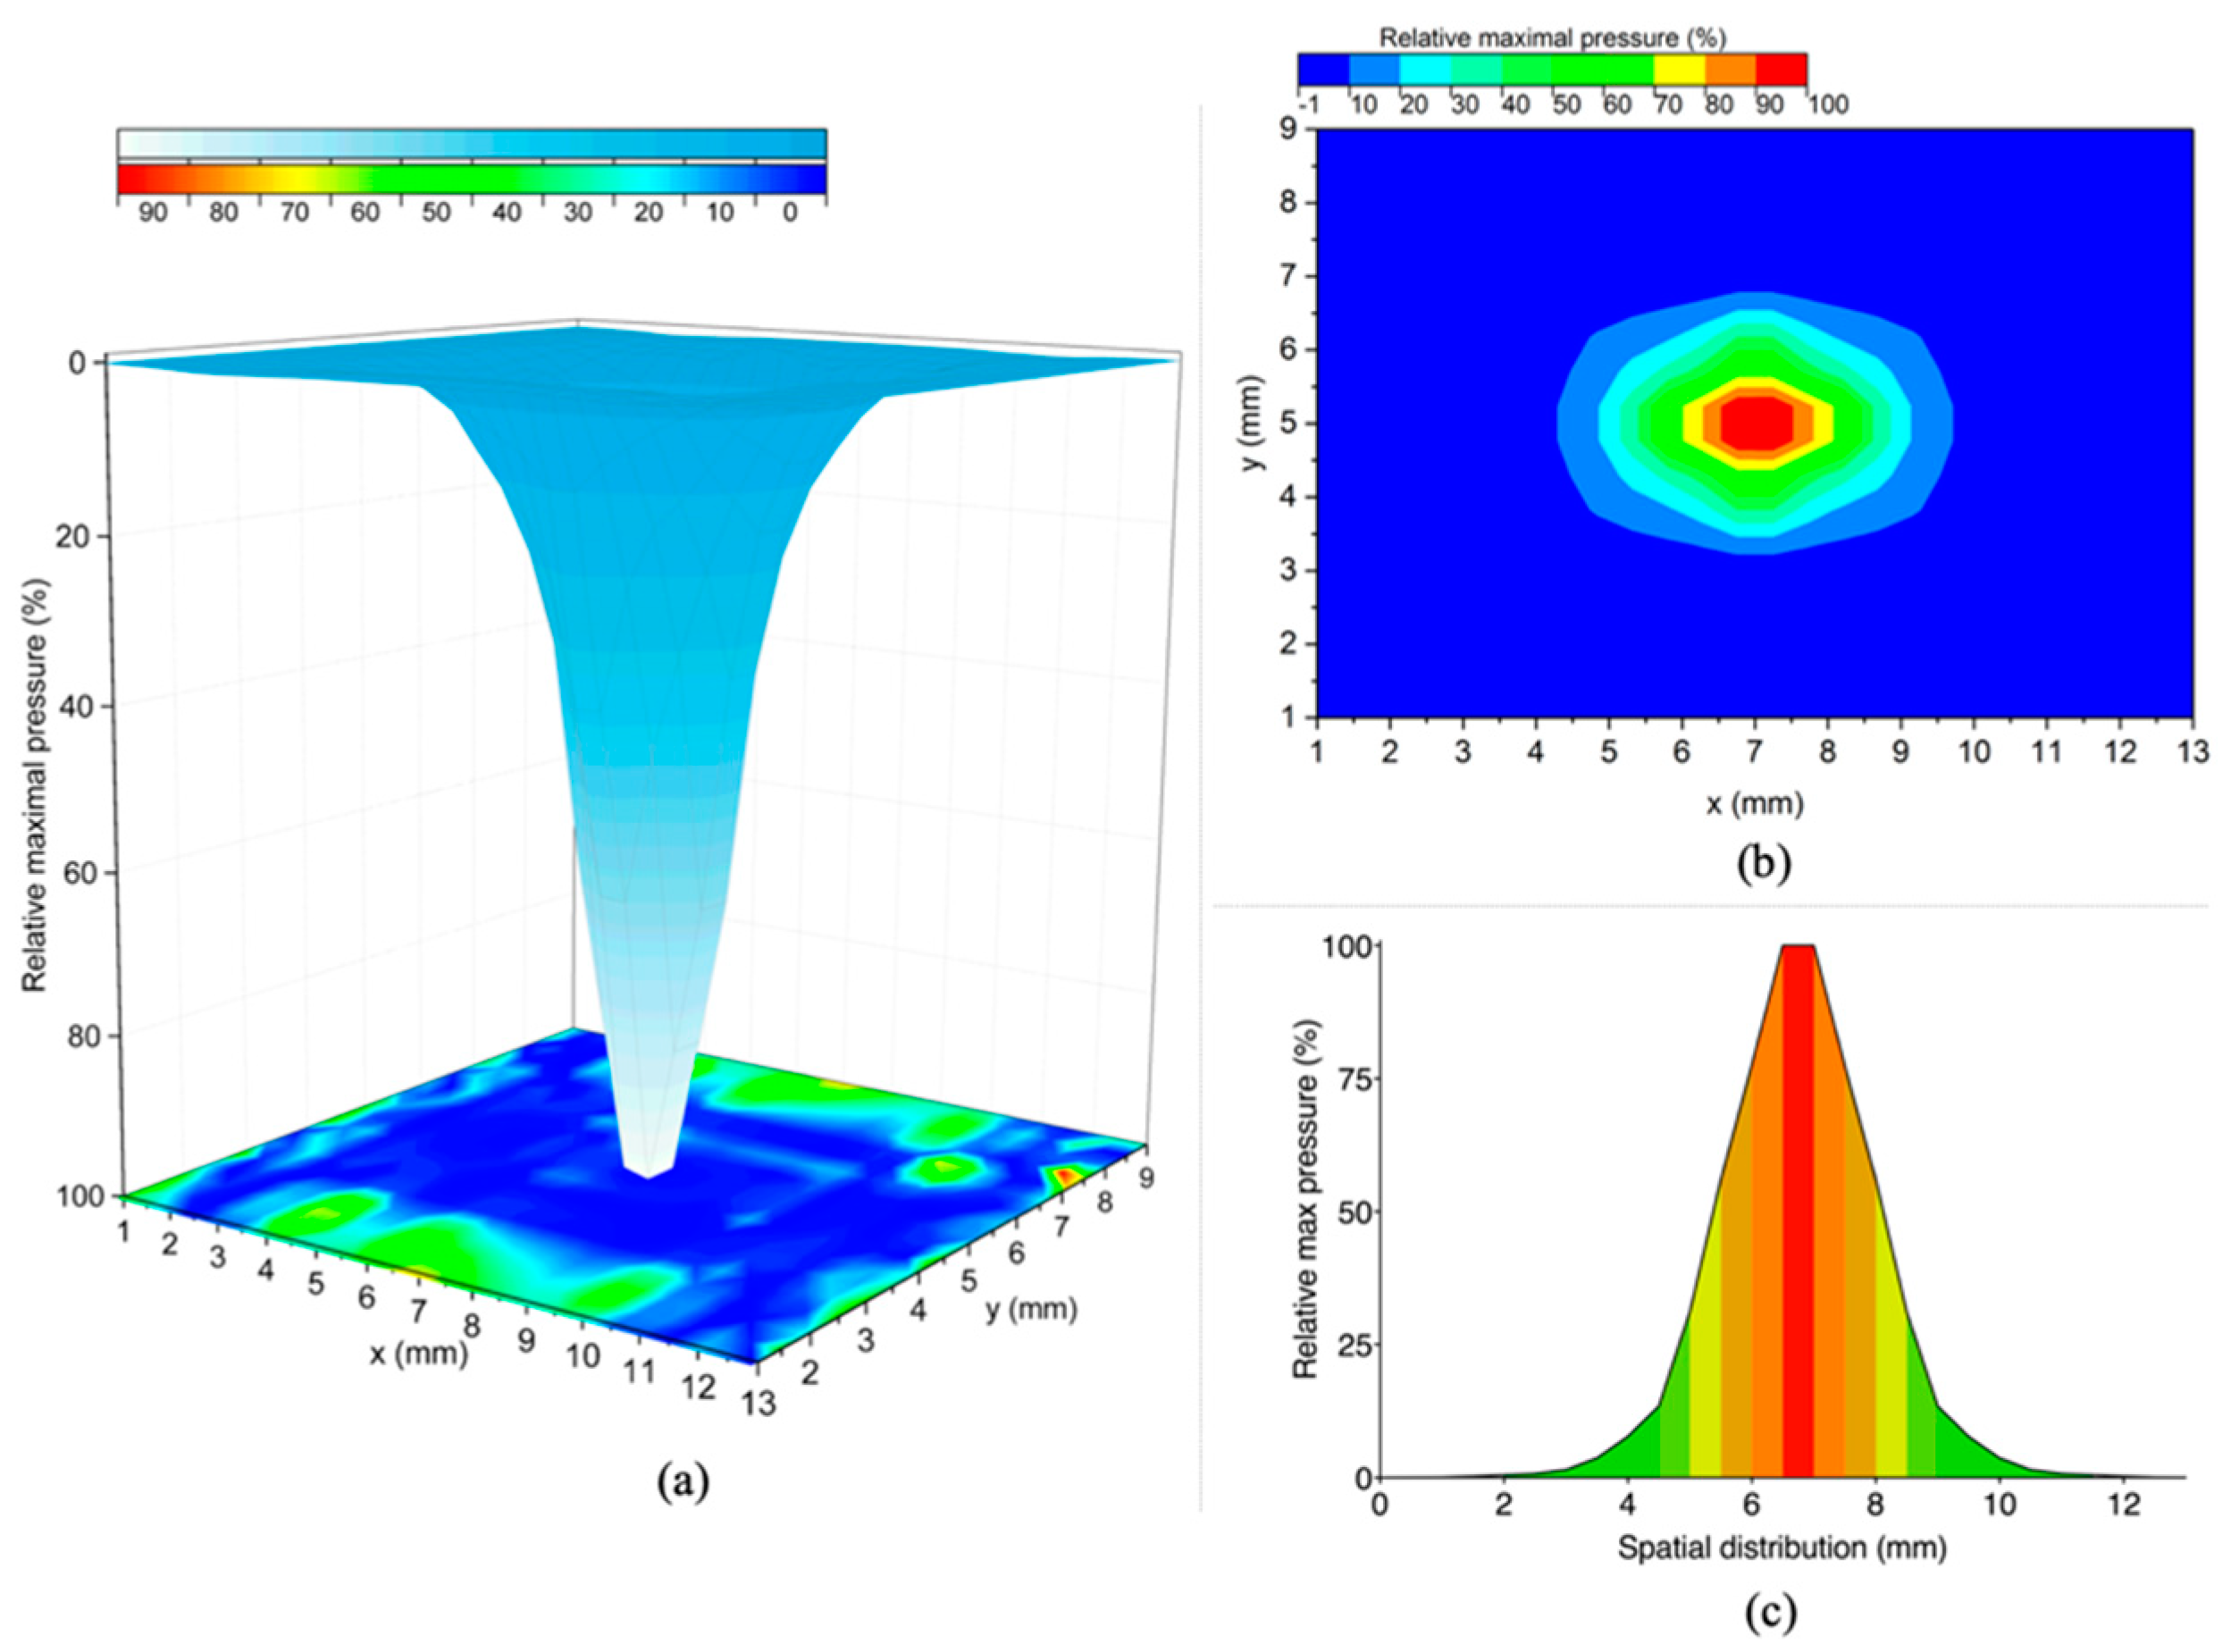
The maximum pressure at the central measurement point was found to be 96.4 ± 1.42 mmHg (95%CI 96.1 to 96.6 mmHg). The airflow pressure could be distinguished from the sensor noise within an area of 45.2 mm2, Figure 5a–c and Table 1. The airflow pressure was highly repeatable within the area affected (CoV 4.2%; 95%CI 3.9% to 4.4%).

3.2.2. Temporal Distribution

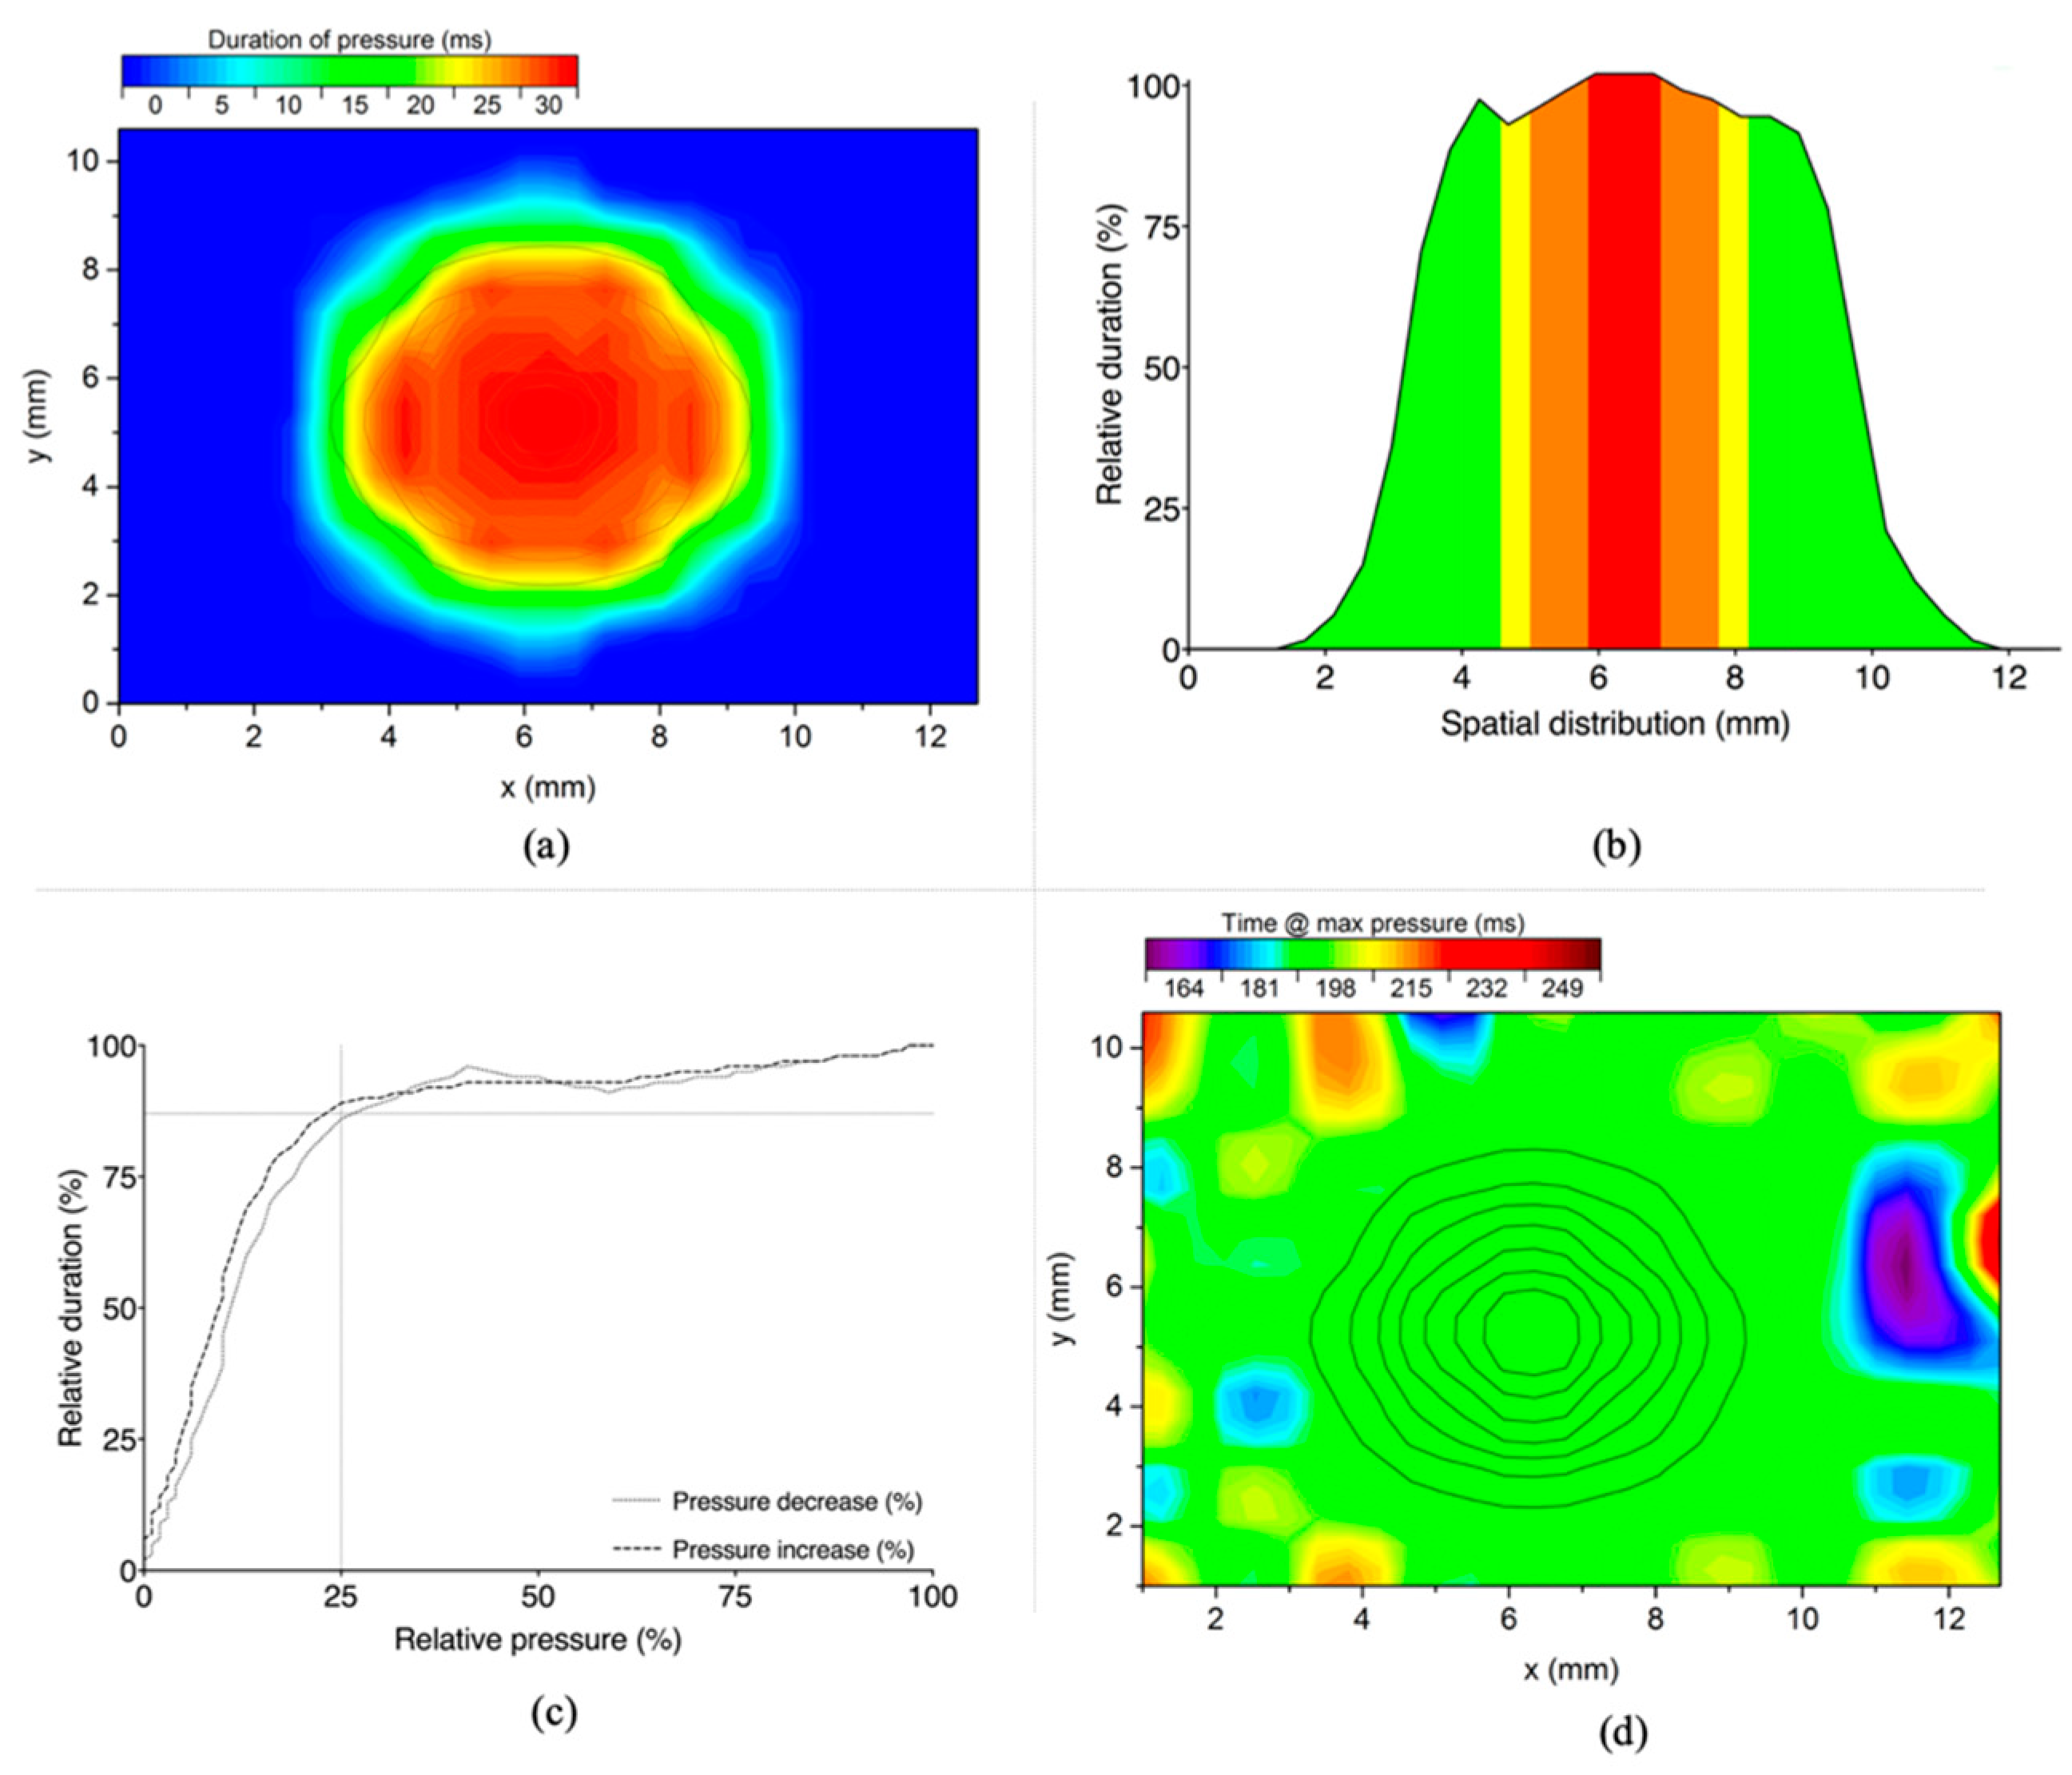
The duration of the airflow was 21.483 ± 0.2881 ms, (95%CI 21.427 to 21.539 ms), whilst the maximum pressure plateau (defined as 99% quantile) lasted for 1.317 ± 0.1116 ms (95%CI: 1.295 to 1.339 ms), Figure 6a,b. For pressures greater than 25% of the maximum, the pressure duration was highly consistent with a CoV of less than 5%, Figure 6c. The time point when the respective maximum pressure was recorded was highly consistent across the affected area (CoV 1.3%); the time point varied by 0.3 ms, Figure 6d.

3.2.3. Airflow Profile at the Object Plane of the CorvisST Scheimpflug Camera System

The maximum piston chamber pressure was detected at frame 70 measuring 182.86 mmHg, corresponding to the midpoint of the CorvisST analysis time of 140 frames. The mean difference of the piston chamber pressures detected by the CorvisST and by the oscilloscope was 0.2%.
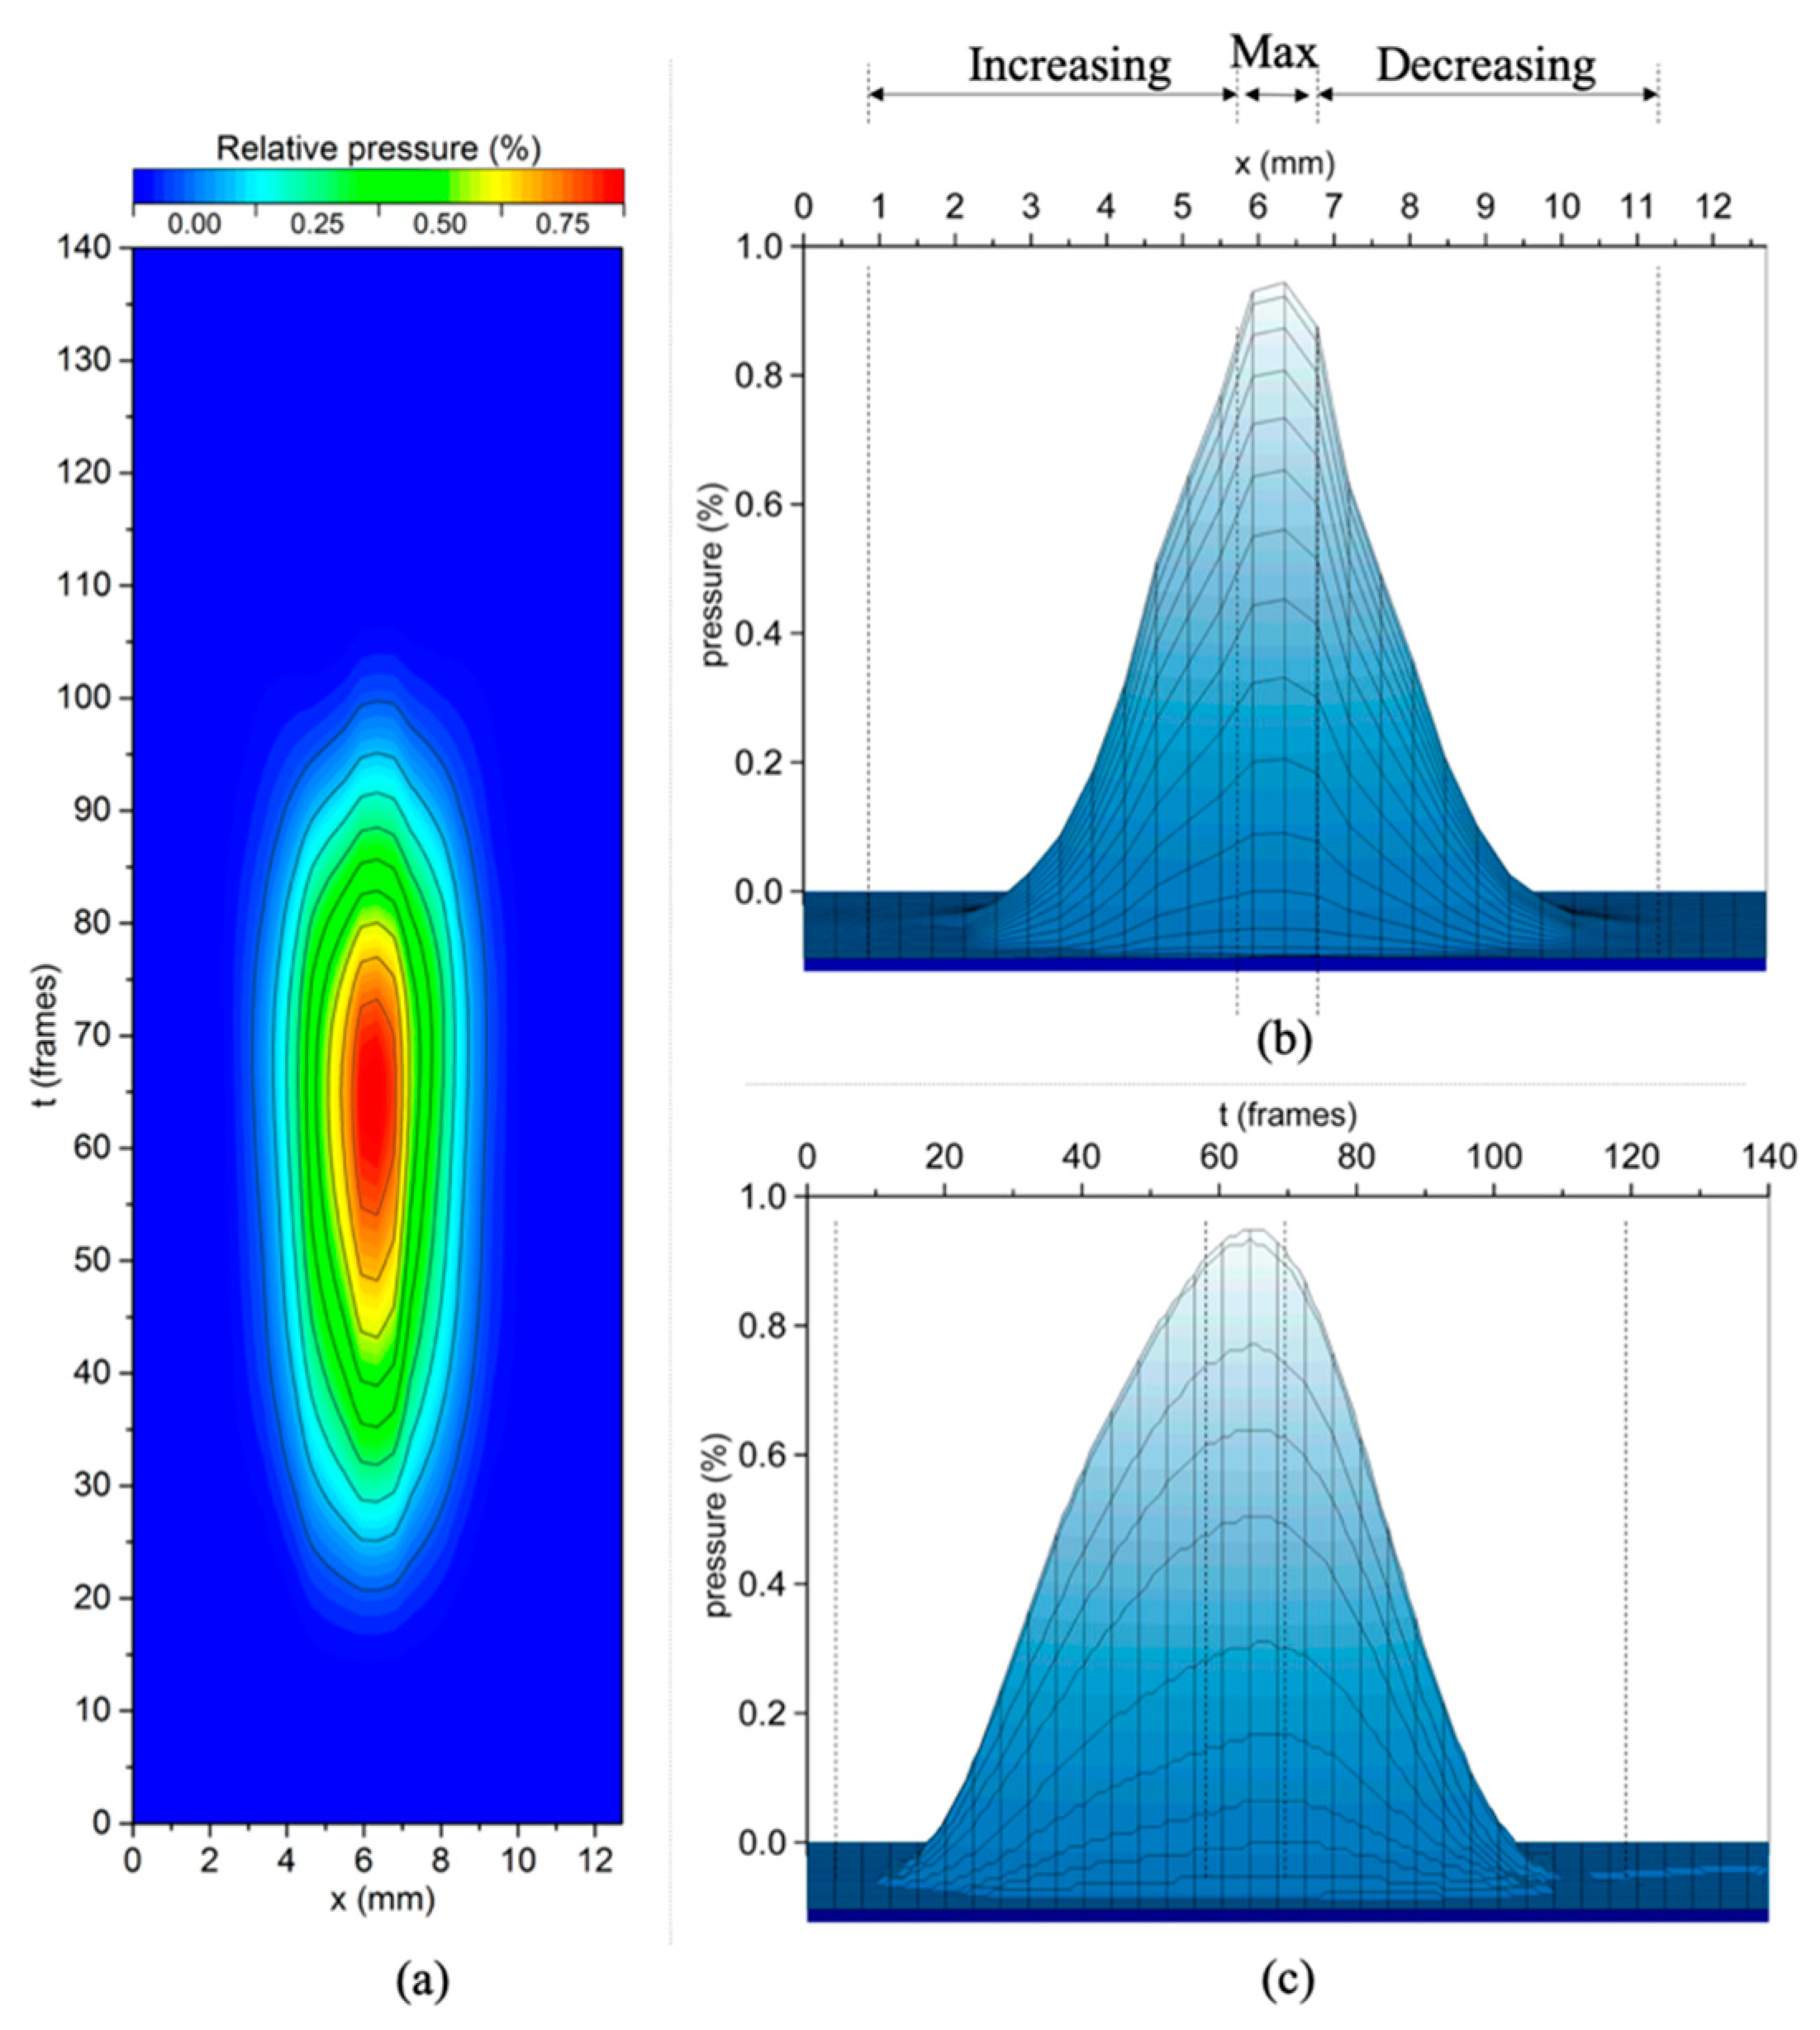
The airflow pressure extended to 7.2 mm along the x-axis; 90% of the maximum pressure was found to have a horizontal diameter of 1.2 mm. The sensor detected the maximum pressure at frame 65, and the airflow could be distinguished from the sensor noise for 93 frames, Table 2 and Figure 7a–c.

3.2.4. Comparison to Piston-Chamber Pressure

The maximum piston chamber pressure provided by the CorvisST and within LabVIEW was detected at frame 70 (16.166 ms), which corresponds to the midpoint of the CorvisST analysis time of 140 frames (32.332 ms). To extract the pressure readings of the piston chamber and the airflow pressure from the myDAQ, a frame range of 140 frames centred by the maximum piston chamber pressure was used. The procedure resulted in three different pressure readings with the same temporal resolution of 4330 Hz: first the piston chamber pressure provided by the CorvisST; second, the piston chamber pressure measured by myDAQ and the airflow pressure also recorded by the myDAQ.
The piston chamber pressures detected by the CorvisST and by the myDAQ had a mean difference of 0.2% over the whole measurement sequence. Thus, using the method described before, each airflow pressure measurement was assigned to a corresponding CorvisST frame, Figure 8a.
The maximum airflow pressure (at the pivotal point of the airflow cone) and the piston-chamber pressure were significantly different between frame 7 and 126 (p < 0.001), Figure 8b. The maximum airflow pressure at an 11 mm distance was detected at frame 65 (15.011 ms) by 96.4 ± 1.42 mmHg; the recorded piston chamber pressure had its maximal value at frame 70 measuring 182.86 mmHg. The FWHM for the piston chamber pressure was found to be 10.9 ms, and for the airflow pressure at an 11 mm distance, 15.2 ms.

3.3. ORA Airflow Pressure

The ORA measurements are automatically provided within a frame range of 400 frames. The maximum of the provided discrete piston chamber pressure was reached on average after 42.5% of the measurement period (between frame 168 and 172, 15.288 and 15.652 ms). Using a frequency of 11 kHz, the ORA analysing time period was equivalent to 36.360 ms.
The maximum airflow pressure of the ORA was 91.7 ± 0.72 mmHg (95%CI 91.2 to 92.1 mmHg) with a duration of 23.061 ± 0.1872 ms (95%CI 22.285 to 24.438 ms) applied to an area of 35 mm2, Figure 9a–c. The maximum pressure, defined as 99% quantile lasted for 1.182 ± 0.1659 ms (95% CI 1.149 to 1.212 ms).
The pressure decreased by 39.8% per millimetre distance from the centre towards the peripheral edges of the airflow. Within a diameter of 2.5 mm around the maximum, the pressure reduced by 80% of the maximum, Figure 9a–c.

3.4. Analytical Modelling

The maximum airflow pressures changed over time while the cross-section was approximately constant for both devices. The spatial and temporal distribution of the airflow pressures could be described by a Gaussian function, Equation (1). The curves fitted to the airflow pressure of both the CorvisST and ORA did not follow a normal distribution (p < 0.050). Comparing the two main meridians of the spatial distribution (t = t[pmax]) across the horizontal p(x) and vertical p(y) meridians for both devices show minor differences relative to the average pressure at the respective measurement location:
  • CorvisST Δp((px − py)/average(px, py)) = (0.6 ± 0.45)%;
  • ORA Δp((px − py)/average(px, py)) = (−0.4 ± 1.19)%.
Thus, for analytical modelling purposes, both airflow pressure profiles are assumed to be symmetrical in the 3D space over time.
p airflow ( t , a ) = p max ( t ) ·   e 2 · ( a a max ) w a 2
pairflow = Airflow pressure (mmHg)
t = Time (ms)
a = Spatial dimension (mm)
pmax = Maximum airflow pressure (mmHg)
w = Width (unit of a)

3.5. Comparison between the Central CorvisST and ORA Airflow Pressures

The ORA airflow measurement commenced at 0.693 ms and lasted for 23.061 ms, 2.5% longer than the CorvisST airflow. The maximum airflow pressure for the ORA was reached 1.155 ms before the CorvisST maximum, and it was 4.9% lower and more curved (skewness: CorvisST 0.549, ORA 0.657; kurtosis: CorvisST −1.322, ORA −1.113). The duration of the maximum pressure was shorter with the ORA (1.182 ± 0.1659 ms) when compared to the CorvisST (1.317 ± 0.1116 ms). The mean difference between the CorvisST and ORA airflow pressures was 2.6 ± 4.07 mmHg (95%CI from −5.5 to 10.6 mmHg), Figure 10. The FWHM for the maximum airflow pressure over time for the ORA was found to be 9.5 ms, whereas for the CorvisST it was 10.9 ms.

4. Discussion

Understanding the fundamental physical characteristics of the airflow pressures produced by non-contact tonometers is vital when interpreting measures of IOP and corneal biomechanics. The present study reports on the development of a robust methodology to investigate the temporal and spatial characteristics of the airflow pressure produced by non-contact tonometers.

4.1. CorvisST Airflow Pressure

In comparison to previous studies [21,22,23,24], the maximum pressure produced by the CorvisST was lower in both magnitude of pressure and duration. Regarding the temporal profile, the values determined in the present study showed a sharper change than suggested previously. Significant differences in the procedures and components used between studies are likely to contribute to the variation in results observed in the literature. Kling, Bekesi [21] also used a piezoresistive pressure sensor to investigate the airflow pressure. The preliminary investigation into the variability of the sensors revealed that peripheral air streams around the differential pressure sensor tube opening had a significant influence on the measured value, leading to an overestimation of the recorded value.
Metzler, Roberts [22,23] used a hot wire anemometer to assess the airflow velocity. However, the tenability of relating airflow velocities to pressure values is not comparable to this study given that the wire of the hot-wire anemometer is placed perpendicular to the airflow direction: Integration of measurements across the wire length (1–3 mm) can lead to an overestimation of the maximal stagnation pressure.
Numerical simulations are limited by the assumptions used during modelling. As such, in their simulation model, Bahr, Ali [24] assumed the velocity at the nozzle to be 80 m/s; e.g., the dynamic stagnation pressure of the airflow was 52.1 mmHg. It may be that the investigators used the values published by Grolman [15] describing the prototype of the non-contact tonometer, with an airflow velocity within the range of 83.3 to 111.1 m/s. The values reported by Grolman [15] appear to be underestimated; the studies found the velocity of the airflow at the nozzle to be much higher by over 100 m/s [23], 115 m/s [21] and 99.5 m/s in the present study. Using a smaller value leads to an underestimation of the pressure applied to the cornea.

4.2. ORA Airflow Pressure

Little is known of the temporal and spatial characteristics of the ORA airflow. Using a fast response pressure sensor with a micro-aperture and an opening of 0.25 mm, Luce [25] investigated the vertical and horizontal spatial pressure profile of the ORA. Regarding the spatial extent of the airflow, 50% of the maximum airflow was found to be within 2.9 mm with a CoV of 3%. Furthermore, the repeatability of the absolute airflow pressure within the central 3 mm zone was high (CoV 5%). In a separate study the duration of the airflow was reported to be approximately 20 ms, with a symmetrical profile for increase and decrease edges [4]. The findings in the present study are in concordance with Luce’s observations. However, the present investigation provides an in-depth understanding of the 3D dimension of the ORA airflow pressure.

4.3. Clinical Implications

When the CorvisST was first launched, it only described the dynamic corneal response to the air-puff [2]. However, over recent years there has been an increasing exploration and discussion about the use of the CorvisST to assess corneal biomechanics in-vivo [33,34]. The Biomechanical Index (CBI) is based on corneal thickness and dynamic corneal response and showing high sensitivity and specificity to distinguish between healthy and ectatic eyes [12]. A further development of the CBI was the Tomographic Biomechanical Index (TBI), which analyses the combination of data from the dynamic response, CBI and tomographic data. The TBI has been shown to detect ectatic diseases even in milder forms [35]. The latest development was the introduction of the biomechanically corrected IOP (bIOP) and the Stress–Strain Index (SSI). The bIOP has been shown to be less effected by corneal thickness and age than the original CorvisST IOP [36]. The SSI claims to determine the biomechanical properties of the human cornea in-vivo. For this, the piston chamber pressure, as provided by the CorvisST, the corneal thickness, bIOP and the dynamic corneal response are used [3]. The CBI, TBI and the SSI evaluate the corneal response caused by the applanation of the airflow pressure from the CorvisST. However, the parameters do not consider the actual airflow pressure nor the affected corneal area by this pressure. As shown in this study, the piston chamber pressure, and the airflow pressure at an 11 mm distance differ significantly. Therefore, for future modelling studies it is of significant importance to include the airflow pressure as present on the cornea.
The ORA determines the corneal biomechanical parameters from the piston chamber pressure at the point of the first and second applanation [25]. The corneal hysteresis (CH) is defined as the differences between the piston chamber pressure at applanation 1 and the piston chamber pressure at applanation 2. The corneal hysteresis as provided by the ORA was used to characterise the viscous damping of the corneal tissue. The corneal resistance factor (CRF) was developed empirically and claims to represent the overall resistance of the cornea against deformation [4]. Based on the results of this study, it can be assumed that the pressure applied to the cornea differs significantly from the piston chamber pressure in magnitude and shape. Studies on healthy eyes showed a high variation in those parameters [37,38,39,40,41,42,43,44,45,46,47,48,49,50,51,52]. The difference between the piston chamber pressure and the airflow pressure at an 11 mm distance can be one of the major factors contributing to such a diversity.

4.4. Comparison between the Airflow Pressures of the CorvisST and ORA

It is evident from the present study that there are significant differences in the temporal and spatial distribution of the CorvisST and ORA airflow pressure. The most distinct differences were the maximal pressure at an 11 mm distance, the pressure change during the increasing phase and the area affected. In total, the CorvisST airflow is stronger, shorter and of a higher magnitude than that of the ORA.
There have been numerous studies comparing the CorvisST and ORA [53,54,55,56]; it could be shown that to some extent CorvisST dynamic corneal response characteristics correspond to the ORA measures. However, comparisons between the two devices are limited as the pressure applicated to the cornea differs significantly. Furthermore, the CorvisST applies the same pressure to each eye, whereas the ORA applies a controlled increase in airflow pressure during the inward deformation of the cornea, followed by a defined decrease in pressure through the outward phase of the deformation [4,5].

4.5. Limitations

The pressure sensor used had an input depended on the measurement uncertainty. Due to the sensor noise, the maximum airflow pressures varied in the range of the uncertainty. To reduce the influence of the measurement uncertainty for each airflow pressure value, at least ten consecutive measurements were conducted and averaged. The novel measurement procedure described in this study had two main sources of random errors: the electrical components, sensor and digital oscilloscope, and the procedure to obtain spatially and distance distribution of the respective airflow. To minimise the random errors, the detected signal has undergone a smoothing procedure and the relative nozzle to sensor position was controlled by using real-time monitoring and capturing the position for each measurement. Additionally, environmental conditions such as temperature, humidity and noise level were kept as stable as possible. A systematic error of the measurement procedure was not detected.
The extrapolation of information obtained in this study to the situation on the human cornea is limited. Although a curved surface simulating the average healthy, adult cornea has been used, the real eye has a more complex structure. Influences from the tear film, lid aperture, eye lids and lashes as well as the positioning of the patient’s head have not been considered in this experimental set up.

5. Conclusions

For accurate interpretation of the clinical measurements produced by the CorvisST and ORA and to allow for a meaningful comparison of the results between the devices, a thorough understanding of the spatial and temporal characteristics of the tonometers’ airflow is vital. Using a high precision sensor and recording system for measuring low-level pressure of a short duration, the study presents novel data on the dimension, magnitude and duration of the airflow pressure generated by these devices. With the use of a custom designed mapping system, the investigation provides an insight into the size of the area affected during application of the pressure as well as its repeatability. In comparison to the ORA, CorvisST airflow was found to impact on a larger corneal area with greater strength and shorter duration. It is anticipated that the methodologies presented herein may provide a systematic means of assessing the tonometer airflow with the cornea, which is essential for the development of an analytical model to describe the changes in the viscoelastic properties of the cornea.

Author Contributions

D.O. designed and performed the experiments, derived the models, analysed the data and took the lead in writing the manuscript. D.J. supported the experimental set up and gave initial ideas to the sensor selection. P.J.B., H.B. supervised the project and reviewed the manuscript. All authors gave final approval for publication and agree to be held accountable for the work performed therein. All authors have read and agreed to the published version of the manuscript.

Funding

This work was supported by the University of Plymouth and a College of Optometrist Fellowship for H.B.

Institutional Review Board Statement

Not applicable.

Informed Consent Statement

Not applicable.

Data Availability Statement

The data presented in this study are available on request from the corresponding author.

Acknowledgments

Julie Soane, who always supported the work and had the most excellent ideas, independent on the matter. Paul Davey who provided his expertise to initially set up the experiment and allowed D.J. and D.O. to meet.

Conflicts of Interest

The authors declare no conflict of interest.

References

  1. Hon, Y.; Lam, A.K. Corneal deformation measurement using Scheimpflug noncontact tonometry. Optom. Vis. Sci. 2013, 90, e1–e8. [Google Scholar] [CrossRef] [PubMed]
  2. Esporcatte, L.P.G.; Salomao, M.Q.; Lopes, B.T.; Vinciguerra, P.; Vinciguerra, R.; Roberts, C.; Elsheikh, A.; Dawson, D.G.; Ambrosio, R., Jr. Biomechanical diagnostics of the cornea. Eye Vis. (Lond.) 2020, 7, 9. [Google Scholar] [CrossRef]
  3. Eliasy, A.; Chen, K.J.; Vinciguerra, R.; Lopes, B.T.; Abass, A.; Vinciguerra, P.; Ambrosio, R., Jr.; Roberts, C.J.; Elsheikh, A. Determination of Corneal Biomechanical Behavior in-vivo for Healthy Eyes Using CorVis ST Tonometry: Stress-Strain Index. Front. Bioeng. Biotechnol. 2019, 7, 105. [Google Scholar] [CrossRef] [Green Version]
  4. Luce, D.A. Determining in vivo biomechanical properties of the cornea with an ocular response analyzer. J. Cataract Refract. Surg. 2005, 31, 156–162. [Google Scholar] [CrossRef]
  5. Vantomme, M.; Pourjavan, S.; Detry-Morel, M. The range of the waveform score of the ocular response analyzer (ora) in healthy subjects. Bull. Soc. Belg. Ophtalmol. 2013, 332, 91–97. [Google Scholar]
  6. Zhao, Y.; Shen, Y.; Yan, Z.; Tian, M.; Zhao, J. Relationship among corneal stiffness, thickness, and biomechanical parameters measured by Corvis ST, Pentacam and ORA in keratoconus. Front. Physiol. 2019, 10, 740. [Google Scholar] [CrossRef] [PubMed]
  7. Wu, W.; Dou, R.; Wang, Y. Comparisons of the corneal biomechanics between low and high myopic eyes–a meta-analysis. Am. J. Ophthalmol. 2019, 207, 419–425. [Google Scholar] [CrossRef]
  8. Wang, L.; Zhang, J.; Li, T.; Zhang, X. Corneal Biomechanical Properties Characterization Using Air-jet Indentation Based Optical Coherence Tomography System (AIOCT). MATEC Web Conf. 2019, 256, 1–7. [Google Scholar] [CrossRef]
  9. Wallace, H.; Misra, S.; Li, S. Biomechanical changes in the cornea following cataract surgery: A prospective assessment with the Corneal Visualisation Scheimpflug Technology. Clin. Exp. 2019, 47, 461–468. [Google Scholar] [CrossRef] [PubMed]
  10. Wallace, H.; McKelvie, J.; Green, C. Corneal Curvature: The Influence of Corneal Accommodation and Biomechanics on Corneal Shape. Transl. Vis. Sci. Technol. 2019, 8, 5. [Google Scholar] [CrossRef] [PubMed]
  11. Wolffsohn, J.S.; Safeen, S.; Shah, S.; Laiquzzaman, M. Changes of corneal biomechanics with keratoconus. Cornea 2012, 31, 849–854. [Google Scholar] [CrossRef]
  12. Vinciguerra, R.; Ambrosio, R., Jr.; Elsheikh, A.; Roberts, C.J.; Lopes, B.; Morenghi, E.; Azzolini, C.; Vinciguerra, P. Detection of Keratoconus With a New Biomechanical Index. J. Refract. Surg. 2016, 32, 803–810. [Google Scholar] [CrossRef] [Green Version]
  13. Ziskin, M.C. Fundamental physics of ultrasound and its propagation in tissue. Radiographics 1993, 13, 705–709. [Google Scholar] [CrossRef] [Green Version]
  14. Fatt, I.; Weissman, B.A. Physiology of the Eye: An. Introduction to the Vegetative Functions; Elsevier Science: Amsterdam, The Netherlands, 2013. [Google Scholar]
  15. Grolman, B. A new tonometer system. Optom. Vis. Sci. 1972, 49, 646–660. [Google Scholar] [CrossRef]
  16. Dorronsoro, C.; Pascual, D.; Perez-Merino, P.; Kling, S.; Marcos, S. Dynamic OCT measurement of corneal deformation by an air puff in normal and cross-linked corneas. Biomed. Opt. Express 2012, 3, 473–487. [Google Scholar] [CrossRef] [PubMed] [Green Version]
  17. Elsheikh, A.; Joda, A.; Abass, A.; Garway-Heath, D. Assessment of the Ocular Response Analyzer as an Instrument for Measurement of Intraocular Pressure and Corneal Biomechanics. Curr. Eye Res. 2015, 40, 1111–1119. [Google Scholar] [CrossRef] [PubMed]
  18. Simonini, I.; Angelillo, M.; Pandolfi, A. Theoretical and numerical analysis of the corneal air puff test. J. Mech. Phys. Solids 2016, 93, 118–134. [Google Scholar] [CrossRef]
  19. Simonini, I.; Pandolfi, A. The influence of intraocular pressure and air jet pressure on corneal contactless tonometry tests. J. Mech. Behav. Biomed. Mater. 2016, 58, 75–89. [Google Scholar] [CrossRef]
  20. Ariza-Gracia, M.Á.; Wu, W.; Calvo, B.; Malvè, M.; Büchler, P.; Matas, J.F.R. Fluid–structure simulation of a general non-contact tonometry. A required complexity? Comput. Methods Appl. Mech. Eng. 2018, 340, 202–215. [Google Scholar] [CrossRef] [Green Version]
  21. Kling, S.; Bekesi, N.; Dorronsoro, C.; Pascual, D.; Marcos, S. Corneal viscoelastic properties from finite-element analysis of in vivo air-puff deformation. PLoS ONE 2014, 9, e104904. [Google Scholar] [CrossRef] [PubMed]
  22. Metzler, K.; Roberts, C.; Whitaker, S.; Lawrence, M.; Malik, J.; Bons, J. Modeling corneal response to an air puff using deformation data to derive Young’s modulus. In ARVO; Investigative Ophthalmology & Visual Science: Seatle, WA, USA, 2013; p. 1629. [Google Scholar]
  23. Metzler, K.; Roberts, C.; Whitaker, S.; Lawrence, M.; Malik, J.; Bons, J. The Influence of IOP, Corneal Stiffness, and Sclera on Corneal Deformation Response to an Air Puff Using the CorVis ST; The Ohio State University, Investigative Ophthalmology & Visual Science: Seatle, WA, USA, 2013. [Google Scholar]
  24. Bahr, N.; Ali, N.; Patel, D.; McGhee, C.; Hunter, P.; Ho, H. Modelling the Deformation of the Human Cornea Produced by a Focussed Air Pulse. Comput. Biomech. Med. 2015, 93–100. [Google Scholar]
  25. Luce, D. Air–jet temporal and spatial pressure properties of the reichert ocular response analyzer (ORA). Investig. Ophthalmol. Vis. Sci. 2005, 46, 5009. [Google Scholar]
  26. Asaoka, R.; Nakakura, S.; Tabuchi, H.; Murata, H.; Nakao, Y.; Ihara, N.; Rimayanti, U.; Aihara, M.; Kiuchi, Y. The Relationship between Corvis ST Tonometry Measured Corneal Parameters and Intraocular Pressure, Corneal Thickness and Corneal Curvature. PLoS ONE 2015, 10, e0140385. [Google Scholar] [CrossRef] [PubMed]
  27. Haustein, M.; Spoerl, E.; Pillunat, L. Correlation of Biomechanic Parameters Measured by Corvis ST (Oculus®) and by Ocular Response Analyzer (ORA, Reichert®). Investig. Ophthalmol. Vis. Sci. 2013, 54, 1626. [Google Scholar]
  28. Matsuura, M.; Hirasawa, K.; Murata, H.; Yanagisawa, M.; Nakao, Y.; Nakakura, S.; Kiuchi, Y.; Asaoka, R. The Relationship between Corvis ST Tonometry and Ocular Response Analyzer Measurements in Eyes with Glaucoma. PLoS ONE 2016, 11, e0161742. [Google Scholar] [CrossRef] [PubMed]
  29. Tejwani, S.; Shetty, R.; Kurien, M.; Dinakaran, S.; Ghosh, A.; Roy, A.S. Biomechanics of the cornea evaluated by spectral analysis of waveforms from ocular response analyzer and Corvis-ST. PLoS ONE 2014, 9, e97591. [Google Scholar] [CrossRef] [Green Version]
  30. Bergmanson, J.P.; Martinez, J.G. Size does matter: What is the corneo-limbal diameter? Clin. Exp. Optom. 2017, 100, 522–528. [Google Scholar] [CrossRef] [PubMed] [Green Version]
  31. Dubbelman, M.; Sicam, V.A.; Van der Heijde, G.L. The shape of the anterior and posterior surface of the aging human cornea. Vis. Res. 2006, 46, 993–1001. [Google Scholar] [CrossRef] [Green Version]
  32. Gatinel, D.; Haouat, M.; Hoang-Xuan, T. A review of mathematical descriptors of corneal asphericity. J. Fr. Ophtalmol. 2002, 25, 81–90. [Google Scholar]
  33. Francis, M.; Matalia, H.; Nuijts, R.; Haex, B.; Shetty, R.; Sinha Roy, A. Corneal Viscous Properties Cannot Be Determined From Air-Puff Applanation. J. Refract. Surg. 2019, 35, 730–736. [Google Scholar] [CrossRef]
  34. Abass, A.; Roberts, C.J.; Lopes, B.; Eliasy, A.; Vinciguerra, R.; Ambrósio, R.; Vinciguerra, P.; Elsheikh, A. Can the Corvis ST Estimate Corneal Viscoelasticity? J. Refract. Surg. 2020, 36, 346–348. [Google Scholar] [CrossRef] [PubMed]
  35. Ferreira-Mendes, J.; Lopes, B.T.; Faria-Correia, F.; Salomao, M.Q.; Rodrigues-Barros, S.; Ambrosio, R., Jr. Enhanced Ectasia Detection Using Corneal Tomography and Biomechanics. Am. J. Ophthalmol. 2019, 197, 7–16. [Google Scholar] [CrossRef] [PubMed]
  36. Sedaghat, M.R.; Momeni-Moghaddam, H.; Yekta, A.; Elsheikh, A.; Khabazkhoob, M.; Ambrosio, R., Jr.; Maddah, N.; Danesh, Z. Biomechanically-Corrected Intraocular Pressure Compared To Pressure Measured With Commonly Used Tonometers In Normal Subjects. Clin. Optom. (Auckl.) 2019, 11, 127–133. [Google Scholar] [CrossRef] [PubMed] [Green Version]
  37. Abitbol, O.; Bouden, J.; Doan, S.; Hoang-Xuan, T.; Gatinel, D. Corneal hysteresis measured with the Ocular Response Analyzer in normal and glaucomatous eyes. Acta Ophthalmol. 2010, 88, 116–119. [Google Scholar] [CrossRef]
  38. Del Buey, M.A.; Cristobal, J.A.; Ascaso, F.J.; Lavilla, L.; Lanchares, E. Biomechanical properties of the cornea in Fuchs' corneal dystrophy. Investig. Ophthalmol. Vis. Sci. 2009, 50, 3199–3202. [Google Scholar] [CrossRef] [PubMed]
  39. Chen, D.; Lam, A.K.; Cho, P. A pilot study on the corneal biomechanical changes in short-term orthokeratology. Ophthalmic Physiol. Opt. 2009, 29, 464–471. [Google Scholar] [CrossRef]
  40. Franco, S.; Lira, M. Biomechanical properties of the cornea measured by the Ocular Response Analyzer and their association with intraocular pressure and the central corneal curvature. Clin. Exp. Optom. 2009, 92, 469–475. [Google Scholar] [CrossRef]
  41. Kirwan, C.; O’Keefe, M. Corneal hysteresis using the Reichert ocular response analyser: Findings pre-and post-LASIK and LASEK. Acta Ophthalmol. 2008, 86, 215–218. [Google Scholar] [CrossRef]
  42. Shah, S.; Laiquzzaman, M.; Bhojwani, R.; Mantry, S.; Cunliffe, I. Assessment of the biomechanical properties of the cornea with the ocular response analyzer in normal and keratoconic eyes. Investig. Ophthalmol. Vis. Sci. 2007, 48, 3026–3031. [Google Scholar] [CrossRef] [Green Version]
  43. Gonzalez-Meijome, J.M.; Queiros, A.; Jorge, J.; Diaz-Rey, A.; Parafita, M.A. Intraoffice variability of corneal biomechanical parameters and intraocular pressure (IOP). Optom. Vis. Sci. Off. Publ. Am. Acad. Optom. 2008, 85, 457–462. [Google Scholar] [CrossRef] [PubMed]
  44. Kamiya, K.; Shimizu, K.; Ohmoto, F. Effect of aging on corneal biomechanical parameters using the ocular response analyzer. J. Refract. Surg. 2009, 25, 888–893. [Google Scholar] [CrossRef]
  45. Kaushik, S.; Pandav, S.S.; Banger, A.; Aggarwal, K.; Gupta, A. Relationship between corneal biomechanical properties, central corneal thickness, and intraocular pressure across the spectrum of glaucoma. Am. J. Ophthalmol. 2012, 153, 840–849.e842. [Google Scholar] [CrossRef] [PubMed]
  46. Kirwan, C.; O’keefe, M.; Lanigan, B. Corneal hysteresis and intraocular pressure measurement in children using the Reichert ocular response analyzer. Am. J. Ophthalmol. 2006, 142, 990–992. [Google Scholar] [CrossRef] [PubMed]
  47. Lam, A.; Chen, D.; Chiu, R.; Chui, W.-S. Comparison of IOP measurements between ORA and GAT in normal Chinese. Optom. Vis. Sci. 2007, 84, 909–914. [Google Scholar] [CrossRef] [PubMed]
  48. Lim, L.; Gazzard, G.; Chan, Y.-H.; Fong, A.; Kotecha, A.; Sim, E.-L.; Tan, D.; Tong, L.; Saw, S.-M. Cornea biomechanical characteristics and their correlates with refractive error in Singaporean children. Investig. Ophthalmol. Vis. Sci. 2008, 49, 3852–3857. [Google Scholar] [CrossRef] [Green Version]
  49. Lu, F.; Xu, S.; Qu, J.; Shen, M.; Wang, X.; Fang, H.; Wang, J. Central corneal thickness and corneal hysteresis during corneal swelling induced by contact lens wear with eye closure. Am. J. Ophthalmol. 2007, 143, 616–622. [Google Scholar] [CrossRef]
  50. Shen, M.; Wang, J.; Qu, J.; Xu, S.; Wang, X.; Fang, H.; Lu, F. Diurnal variation of ocular hysteresis, corneal thickness, and intraocular pressure. Optom Vis. Sci. 2008, 85, 1185–1192. [Google Scholar] [CrossRef]
  51. Song, Y.; Congdon, N.; Li, L.; Zhou, Z.; Choi, K.; Lam, D.S.; Pang, C.P.; Xie, Z.; Liu, X.; Sharma, A. Corneal hysteresis and axial length among Chinese secondary school children: The Xichang Pediatric Refractive Error Study (X-PRES) report no. 4. Am. J. Ophthalmol. 2008, 145, 819–826. e811. [Google Scholar] [CrossRef]
  52. Touboul, D.; Roberts, C.; Kérautret, J.; Garra, C.; Maurice-Tison, S.; Saubusse, E.; Colin, J. Correlations between corneal hysteresis, intraocular pressure, and corneal central pachymetry. J. Cataract Refract. Surg. 2008, 34, 616–622. [Google Scholar] [CrossRef]
  53. Ramm, L.; Herber, R.; Spoerl, E.; Raiskup, F.; Pillunat, L.E.; Terai, N. Intraocular pressure measurement using Ocular response analyzer, dynamic contour tonometer, and scheimpflug analyzer Corvis ST. J. Ophthalmol. 2019, 2019, 3879651. [Google Scholar] [CrossRef] [Green Version]
  54. Salouti, R.; Razeghinejad, R.; Masihpour, N.; Ghoreyshi, M.; Nowroozzadeh, M.H. Agreement in central corneal thickness measurement between Corvis ST and ocular response analyzer. Int. Ophthalmol. 2020, 40, 2563–2567. [Google Scholar] [CrossRef] [PubMed]
  55. Fujishiro, T.; Matsuura, M.; Fujino, Y.; Murata, H.; Tokumo, K.; Nakakura, S.; Kiuchi, Y.; Asaoka, R. The relationship between corvis ST tonometry parameters and ocular response analyzer corneal hysteresis. J. Glaucoma 2020, 29, 479–484. [Google Scholar] [CrossRef] [PubMed]
  56. Annette, H.; Kristina, L.; Bernd, S.; Mark-Oliver, F.; Wolfgang, W. Effect of central corneal thickness and corneal hysteresis on tonometry as measured by dynamic contour tonometry, ocular response analyzer, and Goldmann tonometry in glaucomatous eyes. J. Glaucoma 2008, 17, 361–365. [Google Scholar] [CrossRef] [PubMed]
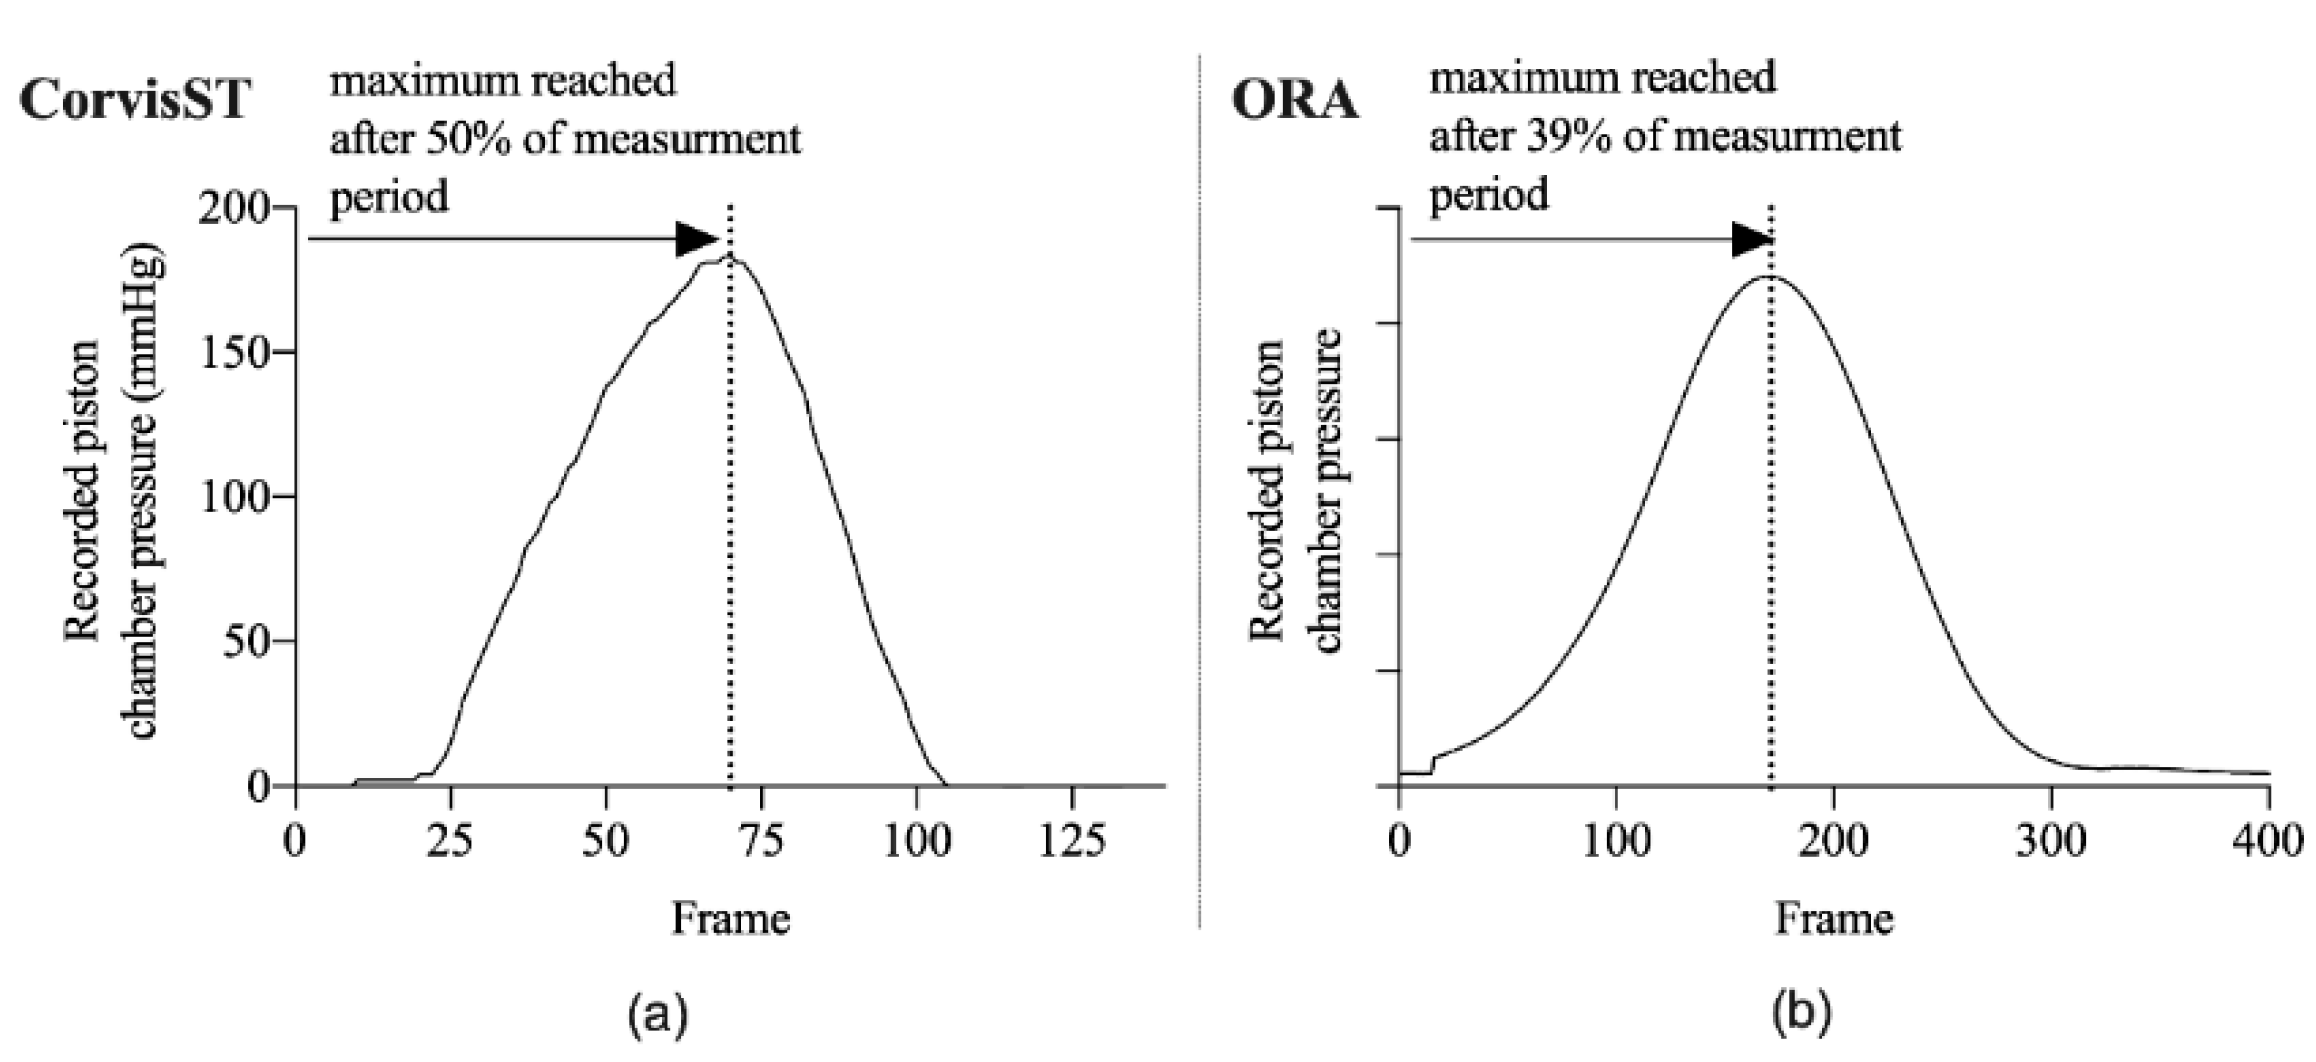
Figure 1. Piston chamber pressure of non-contact air-puff tonometer devices. (a) The CorvisST provides piston chamber pressure values over a period of 140 frames, (b) whilst the Ocular Response Analyser (ORA) provides this over 400 frames.
Applsci 11 02499 g001
Figure 2. The spatial distribution of the CorvisST airflow pressure was investigated using mapping grids (a) which were based on the dimension of the CorvisST screen capturing the sensor tube opening, (b) resulting in the development of two mapping grids with a resolution of 1 mm (m = 137 measurement points) and of 600 µm (m = 382 measurement points). Circles highlighted in yellow represent the image of the sensor tube opening on the CorvisST screen (a) and on the two mapping grids (b).
Applsci 11 02499 g002
Figure 3. Set-up for the investigation of the ORA airflow: (a) schematic view from above and (b) view from the front (c) from the side and (d) from above (1: pressure sensor; 2: ORA; 3 and 4: ruler; 5: movement apparatus; 6: camera).
Applsci 11 02499 g003
Figure 4. Final set-up to record the air puff of the CorvisST and the ORA: the pressure sensor (1), the rulers (2) and the movement apparatus (3) to align the tube opening to the respective device nozzle.
Applsci 11 02499 g004
Figure 5. Spatial distribution of the maximum airflow pressure of the CorvisST: (a) 3D map of the spatial distribution. The bottom contour map shows the covariance (CoV) of ten consecutive measurements at the respective locations. Low CoV is denoted by the blue colour, high CoV denoted by red. (b) The relative pressure values were divided by the magnitude into ten intervals of pressure. With increasing distance from the centre, the pressure level reduced. (c) The average spatial distribution profile highlights the distinct levels of pressures affecting the analysed area. The maximal airflow was detected centrally (red area).
Applsci 11 02499 g005
Figure 6. Time distribution of the maximum airflow pressure of the CorvisST: (a) Contour map shows the detected pressure duration. Short duration is denoted by the blue colour, long duration denoted by red. (b) The average temporal distribution profile highlights the distinct levels of maximal pressure affecting the analysed area. The maximum airflow pressure was detected centrally (red area). (c) The duration of pressures lower than 25% of the maximum where significantly shorter than the duration of higher pressures. (d) The time point when the maximum pressure was detected was consistent within the area of the pressure (within the black contour lines which represent the ten pressure levels).
Applsci 11 02499 g006
Figure 7. Relative airflow pressure at the central horizontal plane (a) 2D profile of the spatial and temporal distribution, which was separated (b) across the central horizontal plane (spatial distribution) and (c) over time (temporal distribution).
Applsci 11 02499 g007
Figure 8. Graphical analysis of the piston chamber pressure and the airflow pressure of the CorvisST. (a) Comparison between the piston chamber pressure detected by the CorvisST (orange) and piston chamber pressure recorded by the myDAQ (black). A maximum difference of 2.3% between the two pressure readings (dotted line below) was observed at frame 99 (22.869 ms). (b) Comparison between the piston chamber pressure recorded by CorvisST (orange) and the detected airflow pressure at the central measurement point (black).
Applsci 11 02499 g008
Figure 9. Spatial distribution of the ORA maximal airflow pressure (n = 10): (a) 3D map of the spatial distribution. The bottom contour map shows the CoV of ten consecutive measurements at the respective points. Low CoV is denoted by the blue colour, high CoV denoted by red. (b) The relative pressure values were divided into deciles. The maximum pressure (90 to 100%) was detected centrally in an area of 1 mm2. (c) The average spatial distribution profile highlights the distinct levels of pressures affecting the analysed area.
Applsci 11 02499 g009
Figure 10. Graphical analysis of the comparison between the CorvisST (blue) and ORA (green) airflow pressure over time with the respective 95%CI error bands (n = 10). The time of respective maximum is highlighted (vertical dotted lines). The differences (CorvisST -ORA) are shown in the diagram below.
Applsci 11 02499 g010
Table 1. Spatial distribution of the relative airflow pressure in increments of 10%.
Airflow Pressure (%)Area (mm2)Slope * (%/mm)R2
90–100% **0.8--
80–89%1.9−29.50.999
70–79%3.5−26.10.999
60–69%5.7−27.90.999
50–59%7.5−30.10.995
40–49%10.2−35.90.999
30–39%13.8−31.10.995
20–29%20.4−25.50.994
10–19%45.2−15.60.991
* Linear regression of the pressure relative to the maximum vs. the distance from the centre; ** peak radius of curvature: 0.115 mm.
Table 2. Temporal distribution of the relative airflow pressure at the central horizontal plane at 11 mm distance. Slopes were calculated by averages of the neighbourhood on the fitted curve.
Phase * Airflow Pressure (%)Duration (Frames)Slope (%)R2
Pressure free0.01 to 0.098 (1–9)>0.0000.949
(1) Increasing Slow0.09 to 4.528 (10–18)0.700.928
Sharp5.80 to 98.1442 (19–61)2.390.988
Maximum99.51 ± 0.4566 (62–68)<0.0000.002
(2) DecreasingSharp98.89 to 5.5431 (69–100)−3.130.995
Slow4.37 to 0.228 (101–109)−0.960.973
Pressure free0.22 to 0.0030 (110–140)>0.0000.974
* Second derivate of the graphical analysis of time distribution was used to distinguish between the distinct phases.
Publisher’s Note: MDPI stays neutral with regard to jurisdictional claims in published maps and institutional affiliations.