Abstract
A single-shot three-dimensional measuring method based on quadrature phase-shifting color composite grating projection is proposed. Firstly, three quadrature phase-shifting sinusoidal gratings are encoded in red (R), green (G), and blue (B) channels respectively, composed single- frame color composite grating. This color composite grating is projecting obliquely on the object by DLP. After that, the color camera which is placed in a specific location is used to capture the corresponding color deformed pattern and send it to the PC. Then, by color separation, the color deformed pattern is demodulated as the corresponding three-frame monochromatic deformed patterns with a shifted quadrature phase. Due to the existences of sensitivity differences and color crosstalk among the tricolor channels, we propose a gray imbalance correction method based on the DC component’s consistency approximation. By the established 3D reconstruction physical model, the measurement of 3D shape can be achieved. Many experimental results for static and moving objects prove the proposed method’s feasibility and practicability. Owing to the single-shot feature of the proposed method, it has a good application prospect in real-time and high-speed 3D measurement.
1. Introduction
In the past few decades, the optical three-dimensional (3D) shape measuring method with the structured light projection has an enormous application in face recognition, industrial inspection, and so on [1,2,3,4,5,6]. With the improvement of photoelectric device technology, it has an increased performance in some fields, such as modern industry [7] and medical treatment [8]. For measuring static objects, multiple-shot methods [9,10] have higher measurement accuracy than single-shot methods. However, the image quality will be degraded due to the vibration, environmental noise, and other interferences in the image shooting gap. The single-shot method [11] only needs one image and has less sensitivity to vibration noise. Many single-shot methods are proposed. Takeda et al. proposed the method of Fourier transform profilometry (FTP) [12,13] which can reconstruct the 3D shape by only one image. However, due to the filtering process, its measuring accuracy has some disadvantages in the actual measurement process. He et al. proposed a 3D measurement method with orthogonal composite grating aided by fringe contrast and background calibration [14]. The contrast and background of the demodulated deformed fringes can be calibrated by these ratio coefficients to achieve the measurement of 3D shape. Li et al. proposed a computer-generated Moiré Profilometry to get the 3D shape of the objects [15,16]. Wan et al. proposed a single-shot 3D measurement based on hue-height mapping [17]. This method calculated the phase with the hue information of the color fringe pattern pixels to obtain the height distribution. Huang P et al. proposed the method of single-shot color phase measuring profilometry (PMP) [18], a single-shot color grating whose major color components are designed as three sinusoidal fringes having a shifted phase of . When this color composite grating is used to measure objects, the image sensor captures a corresponding color deformed pattern and sends it to the PC to achieve 3D measurement. It may be introduced some errors by the existences of sensitivity differences and color crosstalk [17,18,19,20,21,22,23] among the tricolor channels in the measuring process, which are manifested in the inconsistency of the intensity of the tricolor components of the color deformed pattern. Many scholars have proposed corresponding correction algorithms to solve these problems of the existences of sensitivity differences and color crosstalk. For example, Cao Yiping et al. proposed a function of chroma transfer function (CTF) to improve tricolor measuring accuracy. Because the CTF can well calibrate the color crosstalk and the grayscale imbalance, this method successfully reduces the errors caused by the above issues in the fast phase measuring profilometry [24]. Pan Jiahui et al. proposed the method based on tricolor camera combined with a tricolor filter for the calibration of color crosstalk coefficients and the compensation of gray scale imbalance problems [25,26]. However, this method is too complex due to additional cameras and filters. Guangkai Fu et al. proposed a 3D measurement with the color binary grating [27]. This method may avoid the effect of color crosstalk by projecting the binary grating. However, because its binary grating projection requires filtering, its measuring accuracy is still insufficient compared to the sinusoidal grating projection.
A 3D measuring method with single-shot quadrature phase-shifting color composite grating projection is proposed. Three quadrature phase-shifting sinusoidal gratings are encoded into tricolor channels, respectively, to compose a frame of color composite grating. This color composite grating is projected obliquely on the object by DLP to get the corresponding color deformed pattern with a camera. Then, by color separating, this color deformed pattern is demodulated as the corresponding three frames of monochrome deformed patterns with the shifted phase of . Because this method is a non-full cycle equal-step phase-shifting algorithm, the sum of shifted phases within a cycle is . The background image is well exacted by the sum of red and blue components. A gray imbalance correction method based on the DC component’s consistency approximation is proposed to correct the image caused by the existences of sensitivity differences and color crosstalk. By the established 3D reconstruction physical model, the measurement of 3D shape can be achieved.
2. Principle
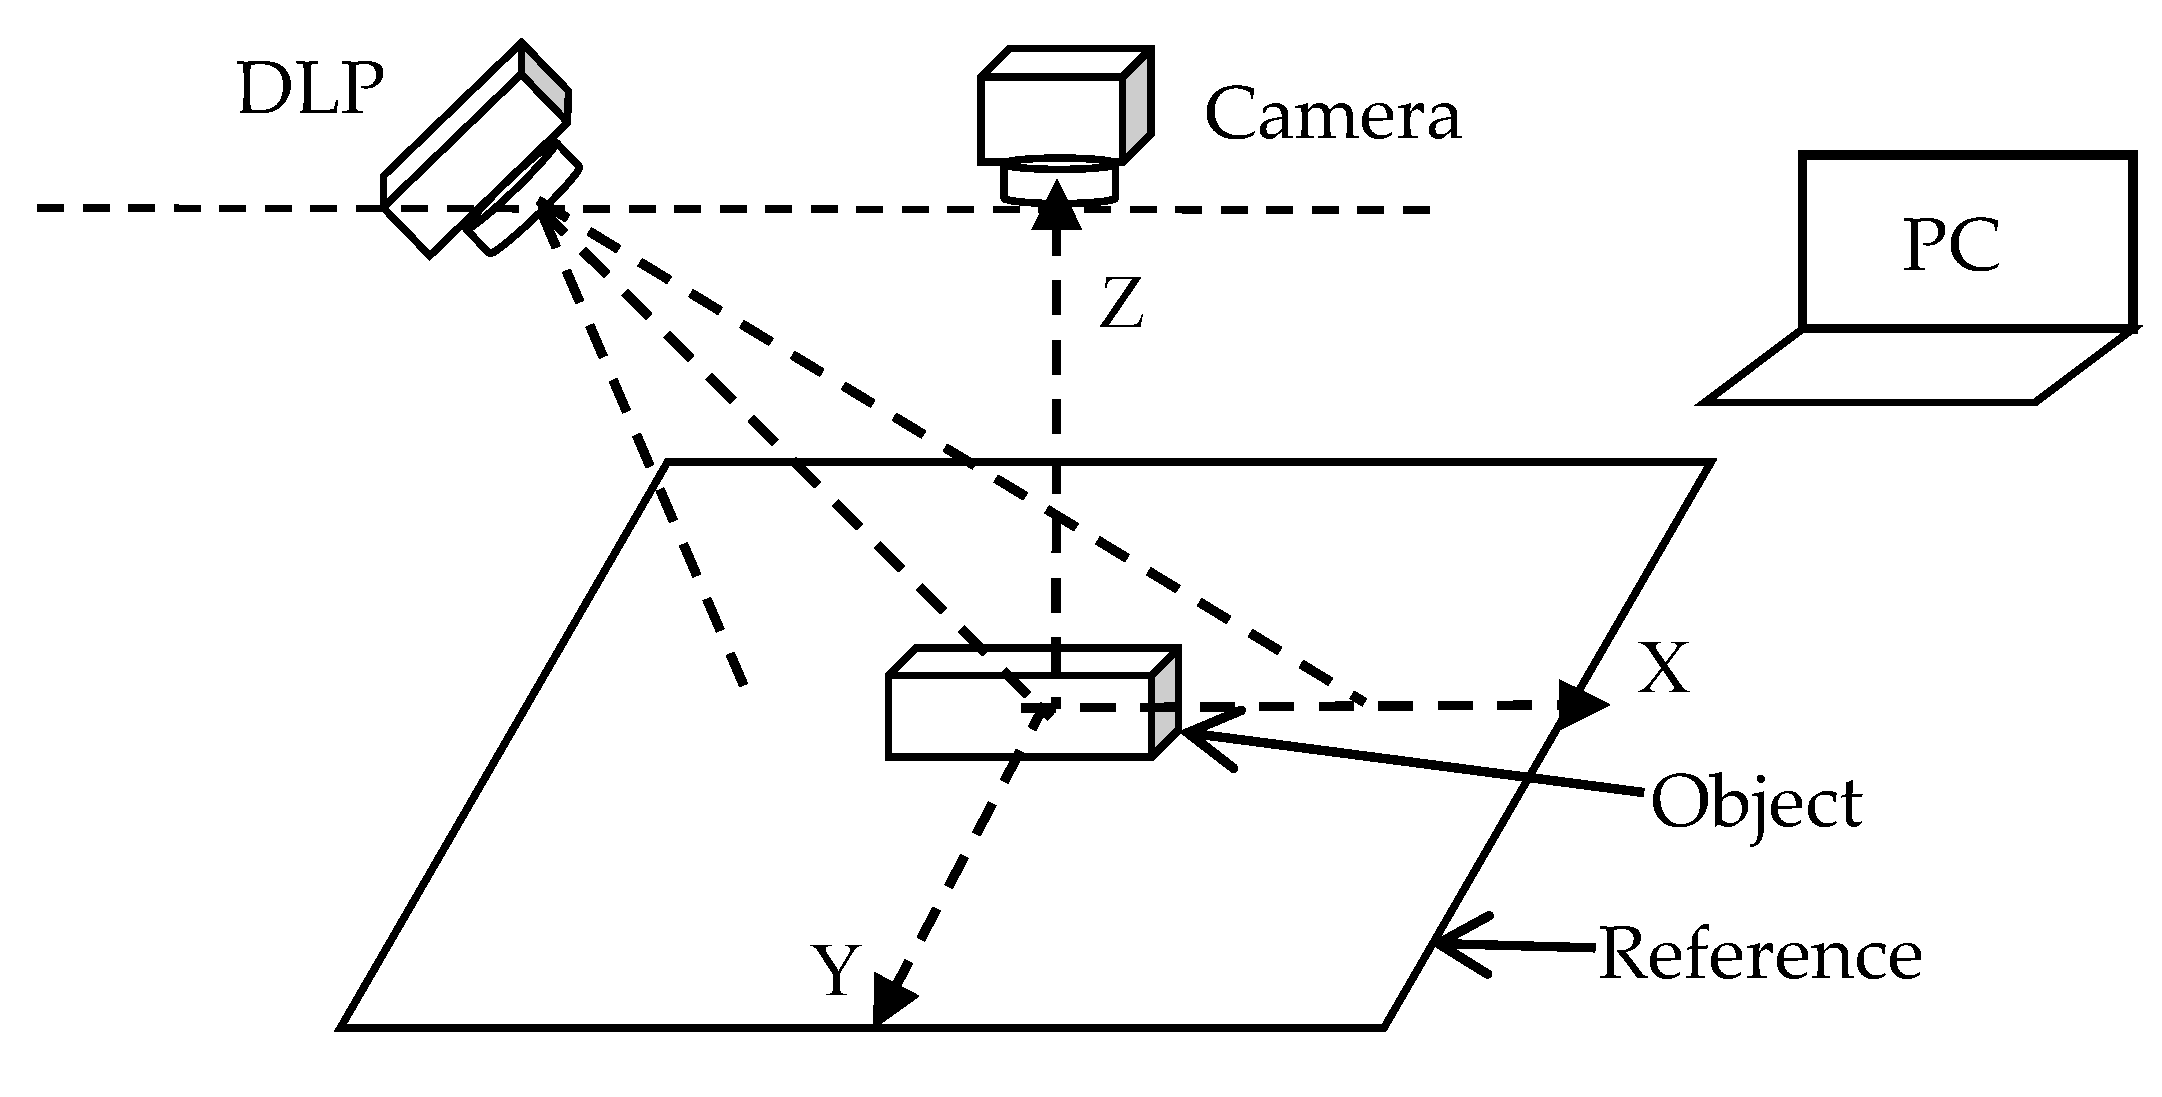
The schematic diagram of the optical 3D measurement with a grating projection is shown in Figure 1. DLP obliquely projects a frame of coded grating onto the object to be measured. The camera which is placed in a specific location captures the corresponding deformed pattern and sends it to the PC. The PC can effectively restore the 3D shape of objects with the corresponding algorithms.

Figure 1.
Schematic diagram of measurement principle.
2.1. The Phase Measuring Principle of the Traditional Color PMP
In the PMP of the traditional single-shot color grating projection, tricolor channels of the color grating are encoded with three sinusoidal gratings which have a shifted phase of . The captured corresponding color deformed pattern is expressed as:
where , , and can be expressed as:
with the pixel coordinates of the captured image. The DC component , the contrast , the frequency , and the modulated phase are parameters of the deformed pattern. can be calculated as:
2.2. The Phase Measuring Principle of Single-Shot Quadrature Phase-Shifting Color Composite Grating
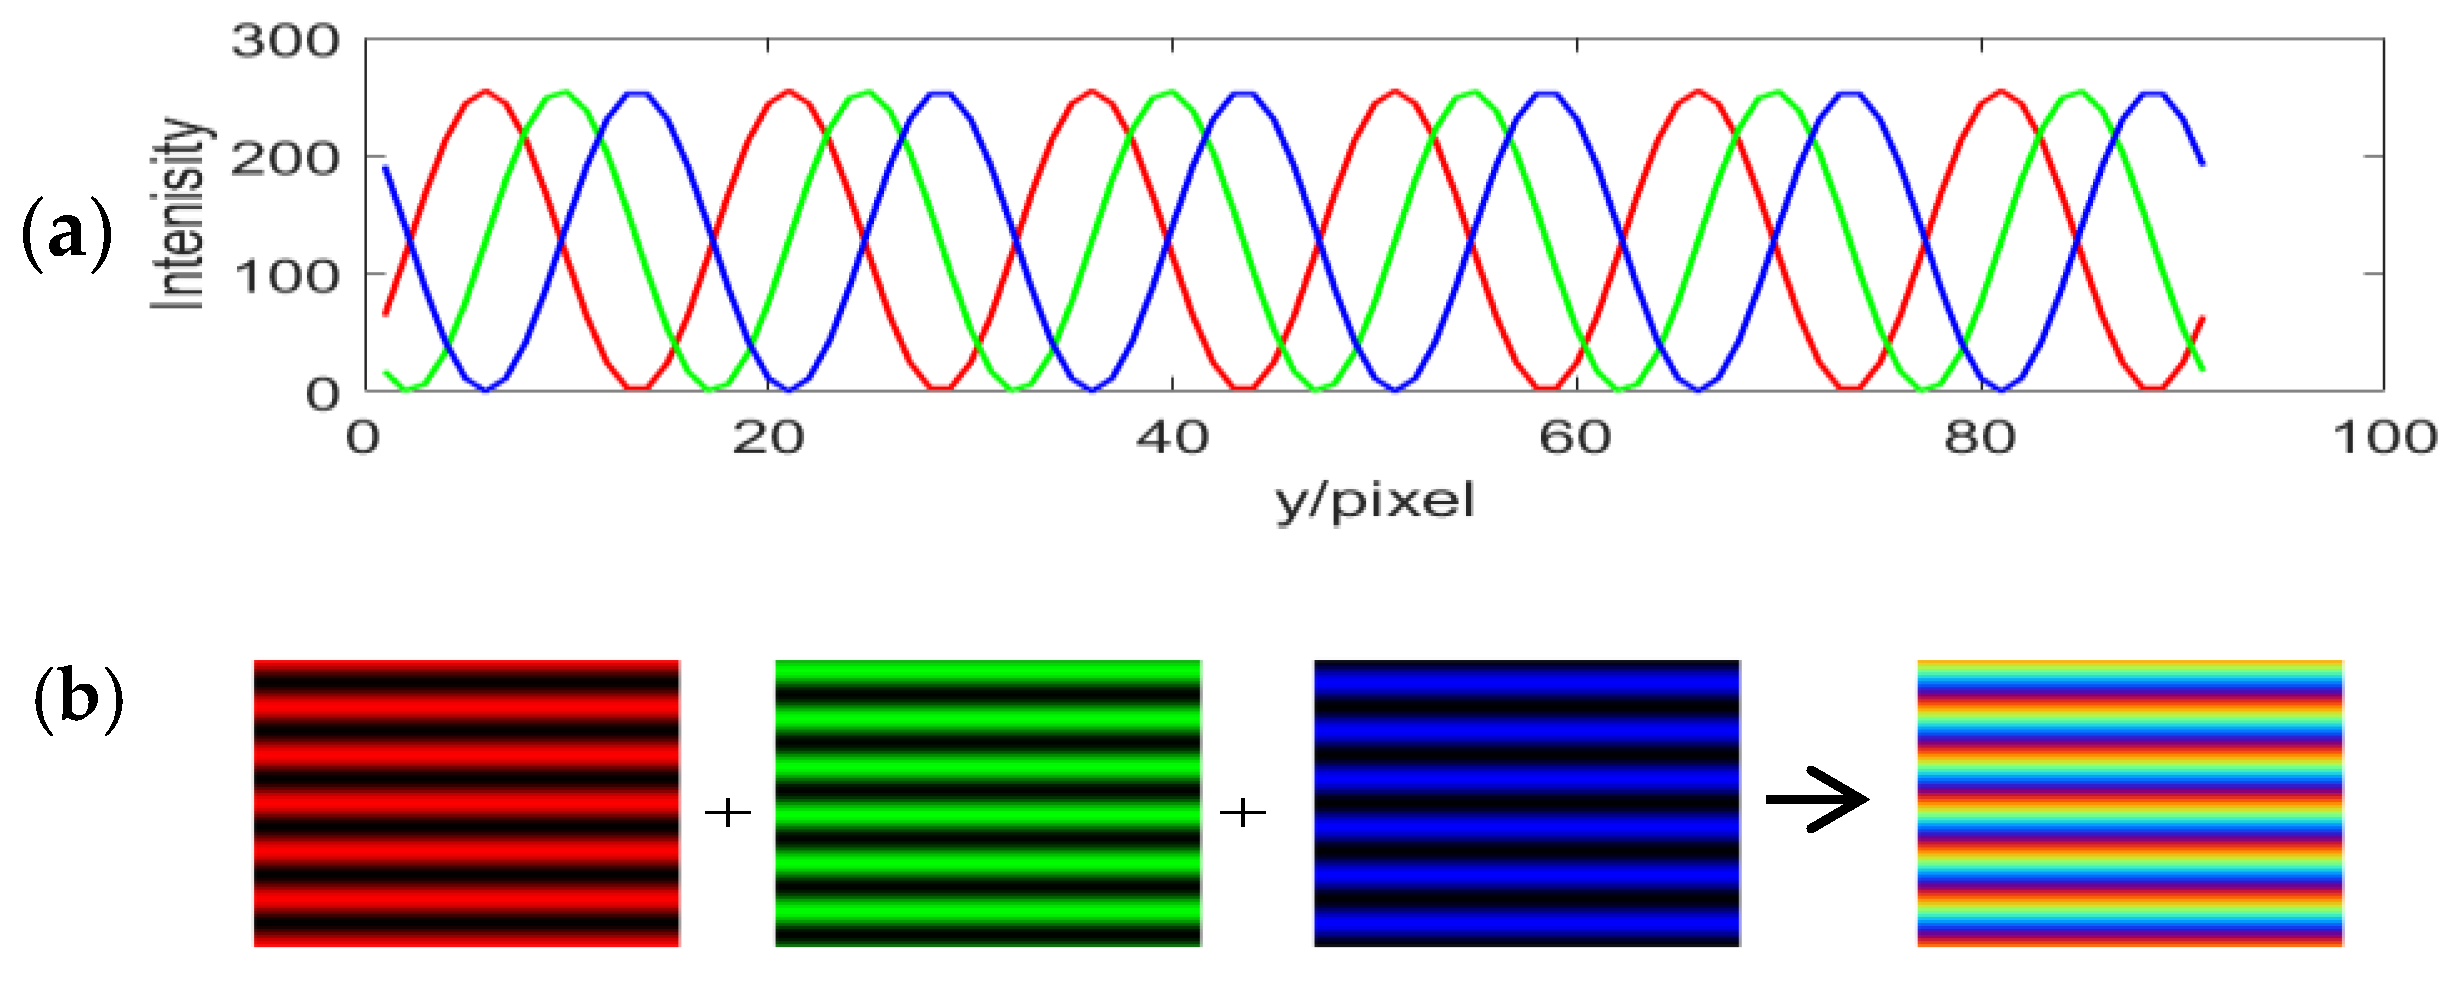
Figure 2 shows a single-shot quadrature phase-shifting color composite grating:
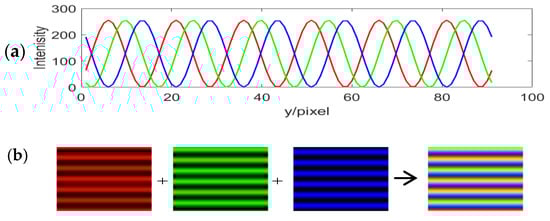
Figure 2.
The quadrature phase-shifting color composite grating: (a) intensity distribution of tricolor channels of the color composite grating pattern; and (b) the encoding process of the color composite grating pattern.
The three sinusoidal gratings designed with a shifted phase of , as shown in Figure 2a, are, respectively, encoded into the tricolor channels and compose a frame of the quadrature phase-shifting color composite grating, as shown in Figure 2b. The captured corresponding color deformed pattern obtained is expressed as:
where , , and are the intensity distribution of three components in the tricolor channels, respectively. Their mathematical model is expressed as:
is calculated as:
2.3. Gray Imbalance Correction Method
In the actual measurement process, these demodulated monochrome phase shifting deformed patterns have problems of gray imbalance due to the existences of sensitivity differences and color crosstalk among the three color channels, as mentioned in the Introduction, seriously affecting the measuring accuracy; thus, it is necessary to correct the above three-frame monochromatic deformed patterns.
The existences of sensitivity differences and color crosstalk are mainly generated by the inconsistency of white balance and spectral mismatch between the digital projector and CMOS camera. Therefore, the monochrome phase shifting deformed patterns demodulated by the captured single frame of color deformed pattern are used for coefficient compensation to make the three-frame monochrome phase shifting deformed patterns intensity distribution map closer to the same. The coefficient compensation method is proposed. First, the intensity of one component of the three-frame demodulated monochromatic deformed patterns is selected as the reference, and the other two components are multiplied by a compensation coefficient to make the intensity of the three components basically the same. Taking the green component as the benchmark here, the three-frame corrected monochrome deformed patterns are expressed as:
where , , and represent the intensity distribution diagrams of the tricolor channels after correction. and are the compensation coefficients, and are the offsets of the zero phase point of the monochromatic phase shifting deformed pattern, and is the intensity value of the zero phase point of the green component. They can be expressed as:
where , , and , respectively, represent the average of the peak values of each cycle of the row of monochromatic phase shifting deformed patterns of the tricolor channels. are the height and width of the image.
In the proposed measurement method, the numerator in the calculated truncated phase (Equation (6)) is the sum of the two components of the red and blue channels. According to Equation (5), it can be seen that the designed quadrature color composite grating has a phase shifting between the components in the red and blue channels, and the half sum of these components should be the background image, as shown in Equation (9):
Due to the existence of sensitivity differences and color crosstalk in the color deformed pattern, the half sum of the red and blue components may show volatility to some extent. According to the method of low-pass filtering, the Fourier spectrum of is acquired by Fast Fourier Transform. Through Gaussian filtering window, the zero-frequency components can be extracted by filtering out higher-order harmonic components of that Fourier spectrum. Then, this zero-frequency component is transformed by inverse Fourier transform to get a “uniform light field” which is closer to the actual value. Due to the influence of filtering, the high-frequency energy is removed and some errors are introduced. To reduce the error caused by filtering, a gray imbalance correction method based on the DC component’s consistency approximation is proposed. In this method, by the least square method, an evaluation function, is introduced to compare the similarity of two images, which is expressed as:
where is the square of the gray difference value of each pixel of the image between and . When takes the minimum value, is zero, which is expressed as:
The value of is calculated to be:
The half sum of red and blue can be calibrated as:
Thus, Equation (6) can be rewritten as:
Due to the arctan function, is wrapped and should be unwrapped to be [28]. In the same way, the corresponding unwrapped phase of the reference plane is acquired as and the phase that is caused by the height of measured object can be represented as:
Thus, by the phase-to-height mapping [29,30] shown as
the measurement of 3D shape is successfully achieved. , , and are the experiment system parameters obtained through calibration.
3. Experiments and Analysis
3.1. Experimental System
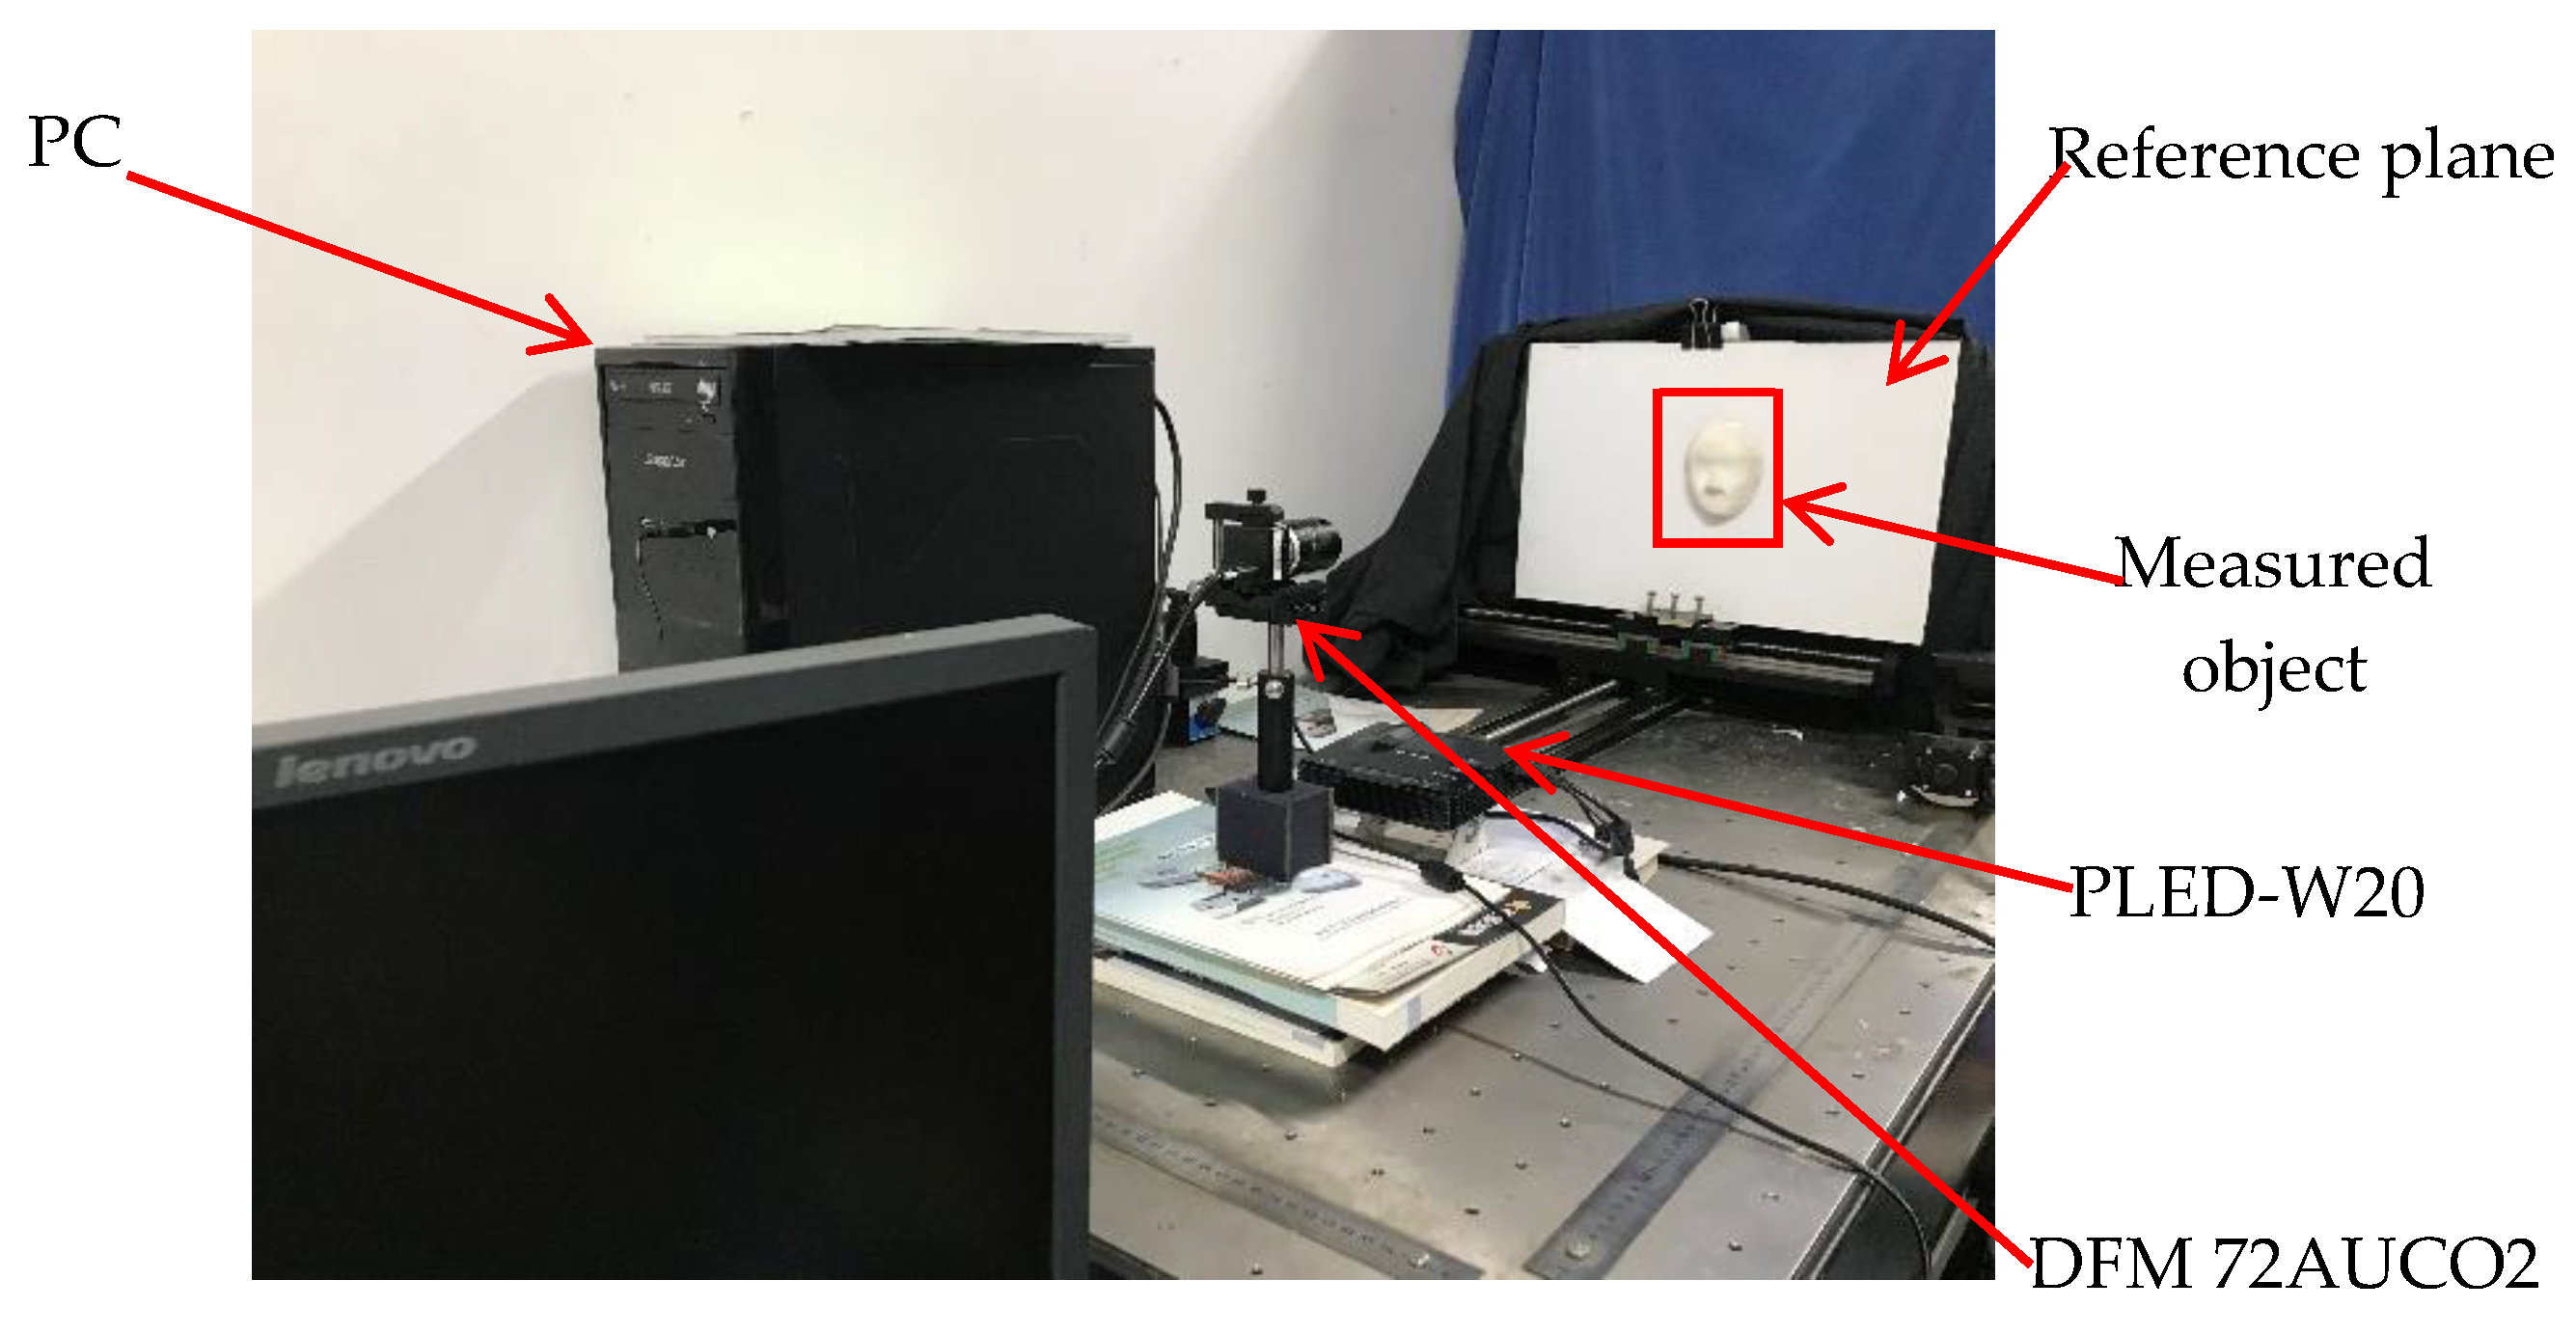
Using the experimental platform shown in Figure 3, we measured the 3D shape of many measured objects with the proposed method to verify its feasibility and validity in the actual measurement process. In this experimental platform, the digital light projector is PLED-W20 produced by ViewSonic, and the color camera is DFM 72AUCO2 with the imaging resolution of 1024 × 768 pixels.
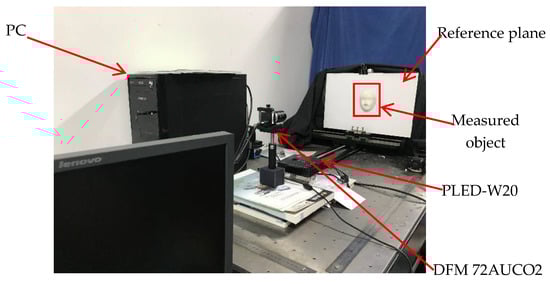
Figure 3.
Experimental system.
3.2. Experiments and Analysis
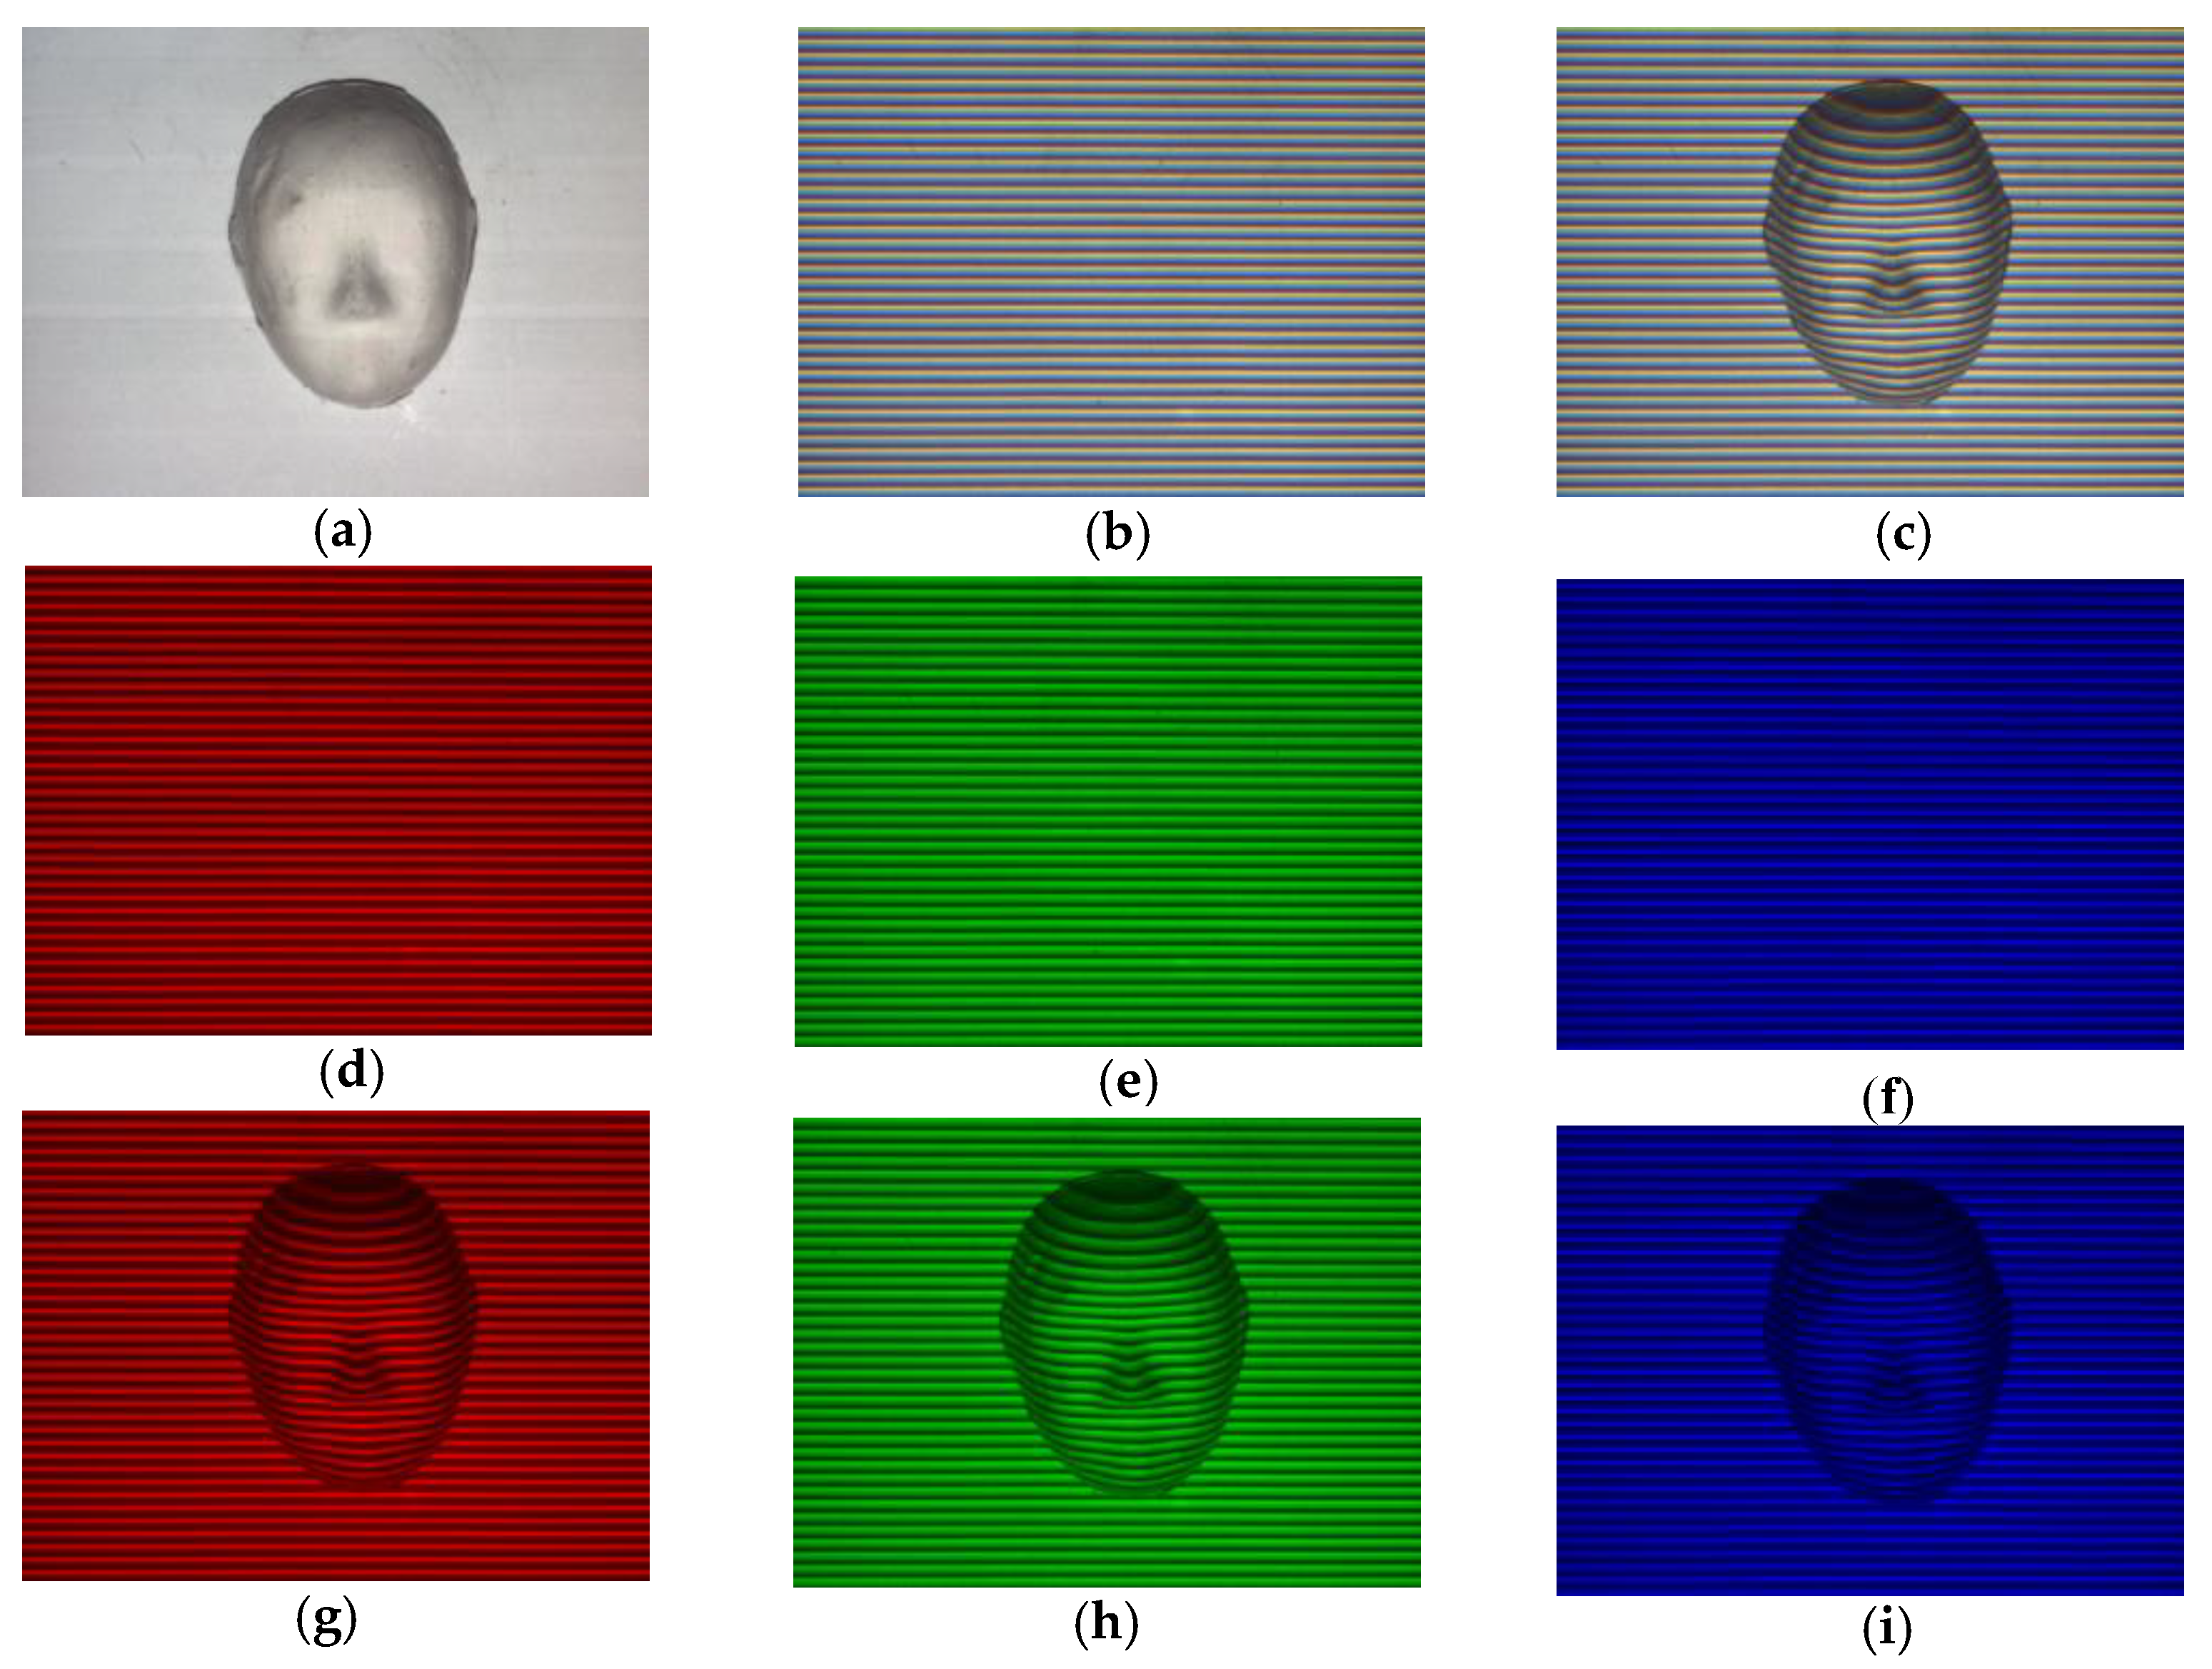
Many experiments measuring the 3D shape of many objects with the proposed method were carried out. Figure 4 shows one of the experimental results. Here, the face model shown in Figure 4a is used to be measured. Figure 4b shows the color fringe pattern that is caused by a reference plane, which is shown in Figure 3, captured by color camera, and the single-frame color deformed pattern of the measured object is shown in Figure 4c. The three-frame monochromatic fringe patterns demodulated in tricolor channels of the single-frame captured color fringe pattern are shown in Figure 4d–f and the three-frame monochromatic deformed patterns demodulated in tricolor channels of the single-frame captured color deformed pattern are shown as Figure 4g–i. Due to the overlapping among tricolor channels, the issues of the existence of sensitivity differences and color crosstalk are unavoidable. The experimental data show that the above issues exist and seriously introduce some errors in phase resolution. Thus, we need to correct the monochromatic phase-shifting deformed patterns before calculating the phase to reduce the errors introduced by the existences of sensitivity differences and color crosstalk.
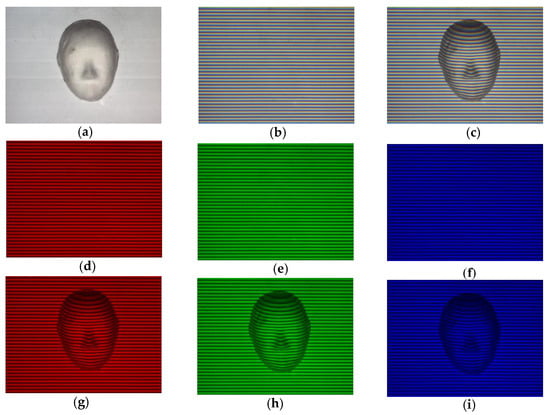
Figure 4.
Experimental data: (a) measured object; (b) color fringe pattern; (c) color deformed pattern; (d–f) the demodulated monochromatic fringe patterns of R, G, and B; and (g–i) the demodulated monochromatic deformed patterns of R, G, and B.
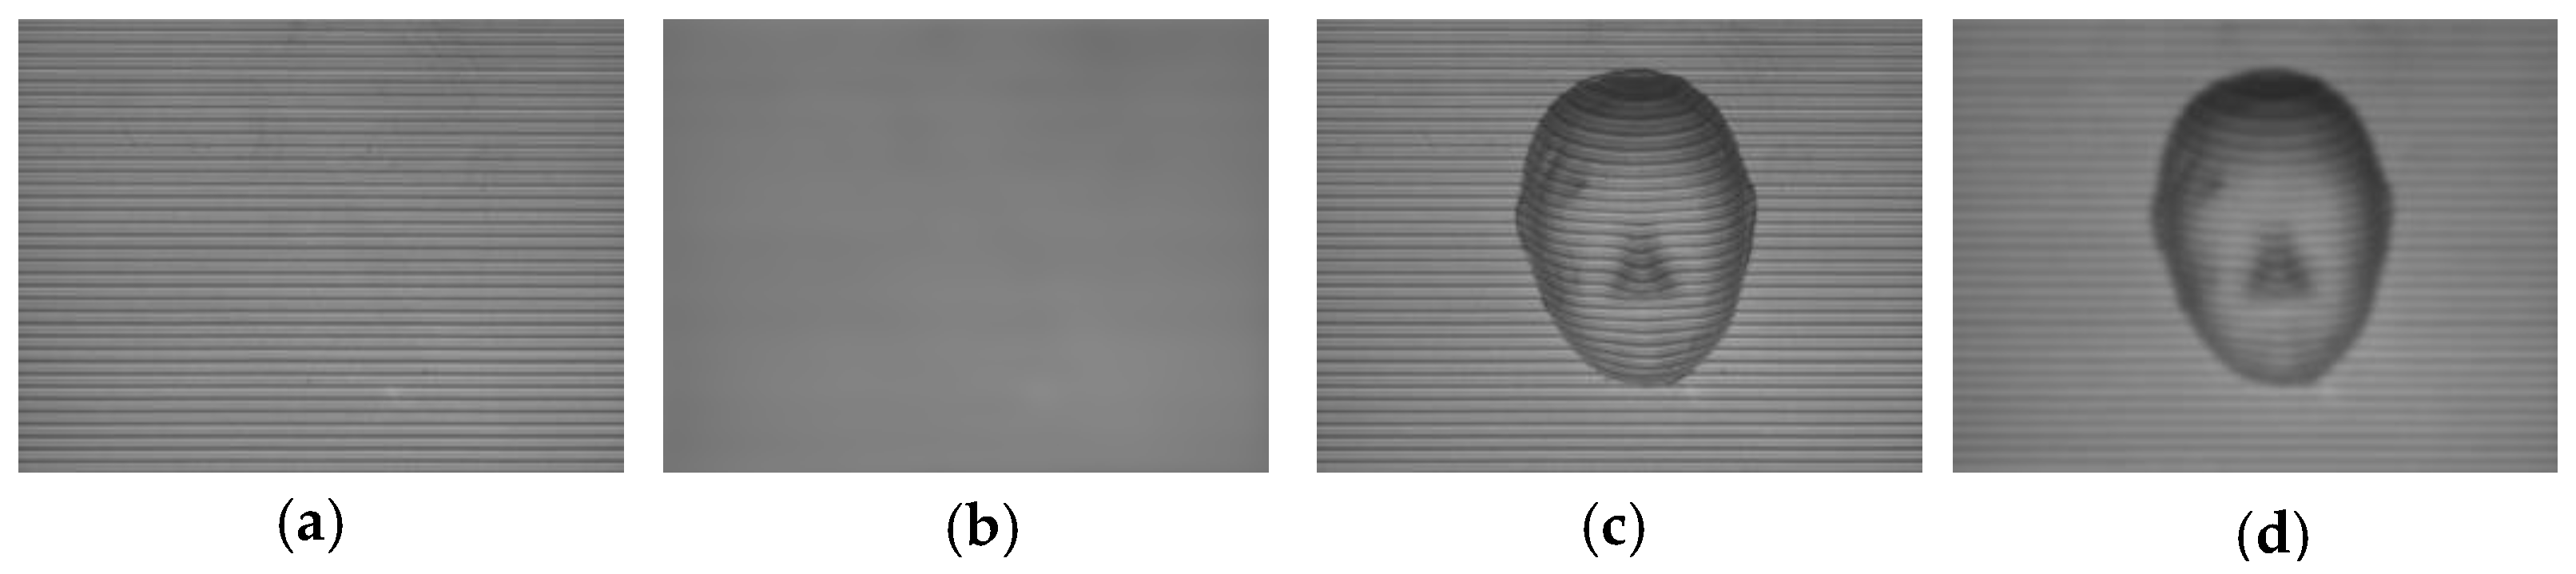
The existences of sensitivity differences and color crosstalk among these monochromatic phase-shifting deformed patterns are corrected by the proposed method. The reference plane background image before gray imbalance correction is shown in Figure 5a; the reference plane background image after gray imbalance correction is shown in Figure 5b; the background image of the measured object before gray imbalance correction is shown in Figure 5c; and the background image of the object after gray imbalance correction is shown in Figure 5d. After comparison and analysis, we found that, by using the proposed method to correct the background, the errors caused by the existence of sensitivity differences and color crosstalk are further reduced. It must be pointed out that some blurriness in the corrected background image of measured object is caused because of the filtering process. Therefore, the proposed method has some disadvantages in measuring sharp objects.
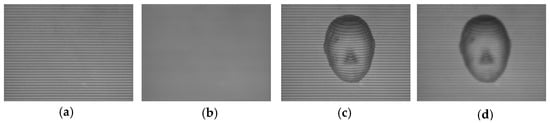
Figure 5.
Gray imbalance correction: (a) reference plane background image before correction; (b) reference plane background image after correction (c) background image of the measured object before correction; and (d) background image of the measured object after correction.
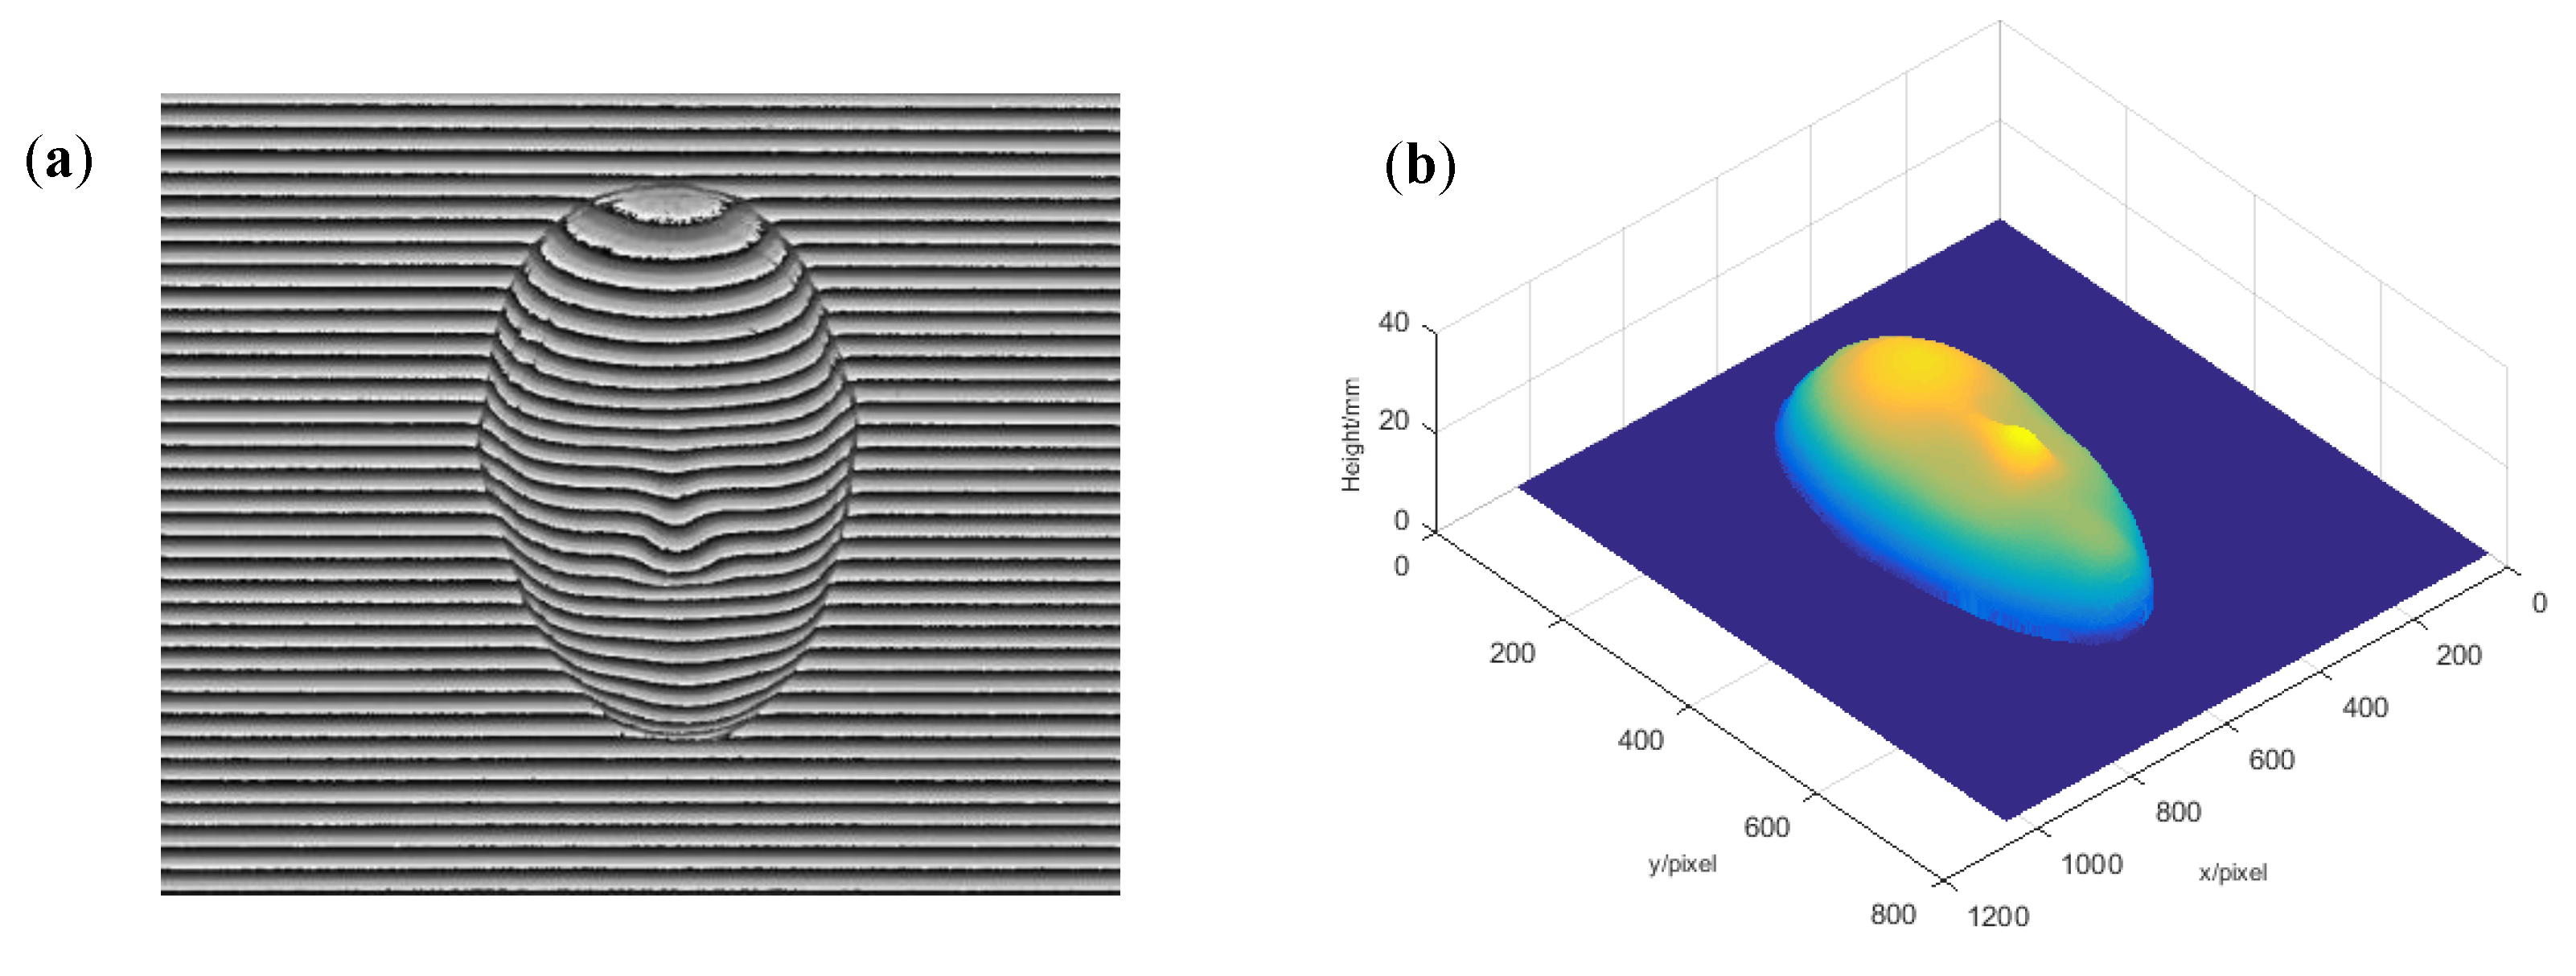
Figure 6a shows the corresponding wrapped phase calculated by these monochromatic deformed patterns after correction. The reconstructed result of the measured face model is shown in Figure 6b. It is clearly shown that the 3D shape of measured face model is well restored, and this reconstructed result proves the feasibility of the proposed method in measurement of 3D shape. The restored result by the eight-step PMP was chosen as the quasi-truth value to analyze measurement accuracy of the proposed method. Then, a comparison experiment between the traditional color PMP and the proposed method was carried out.

Figure 6.
The experimental results: (a) wrapped phase of measured object; and (b) reconstructed object.
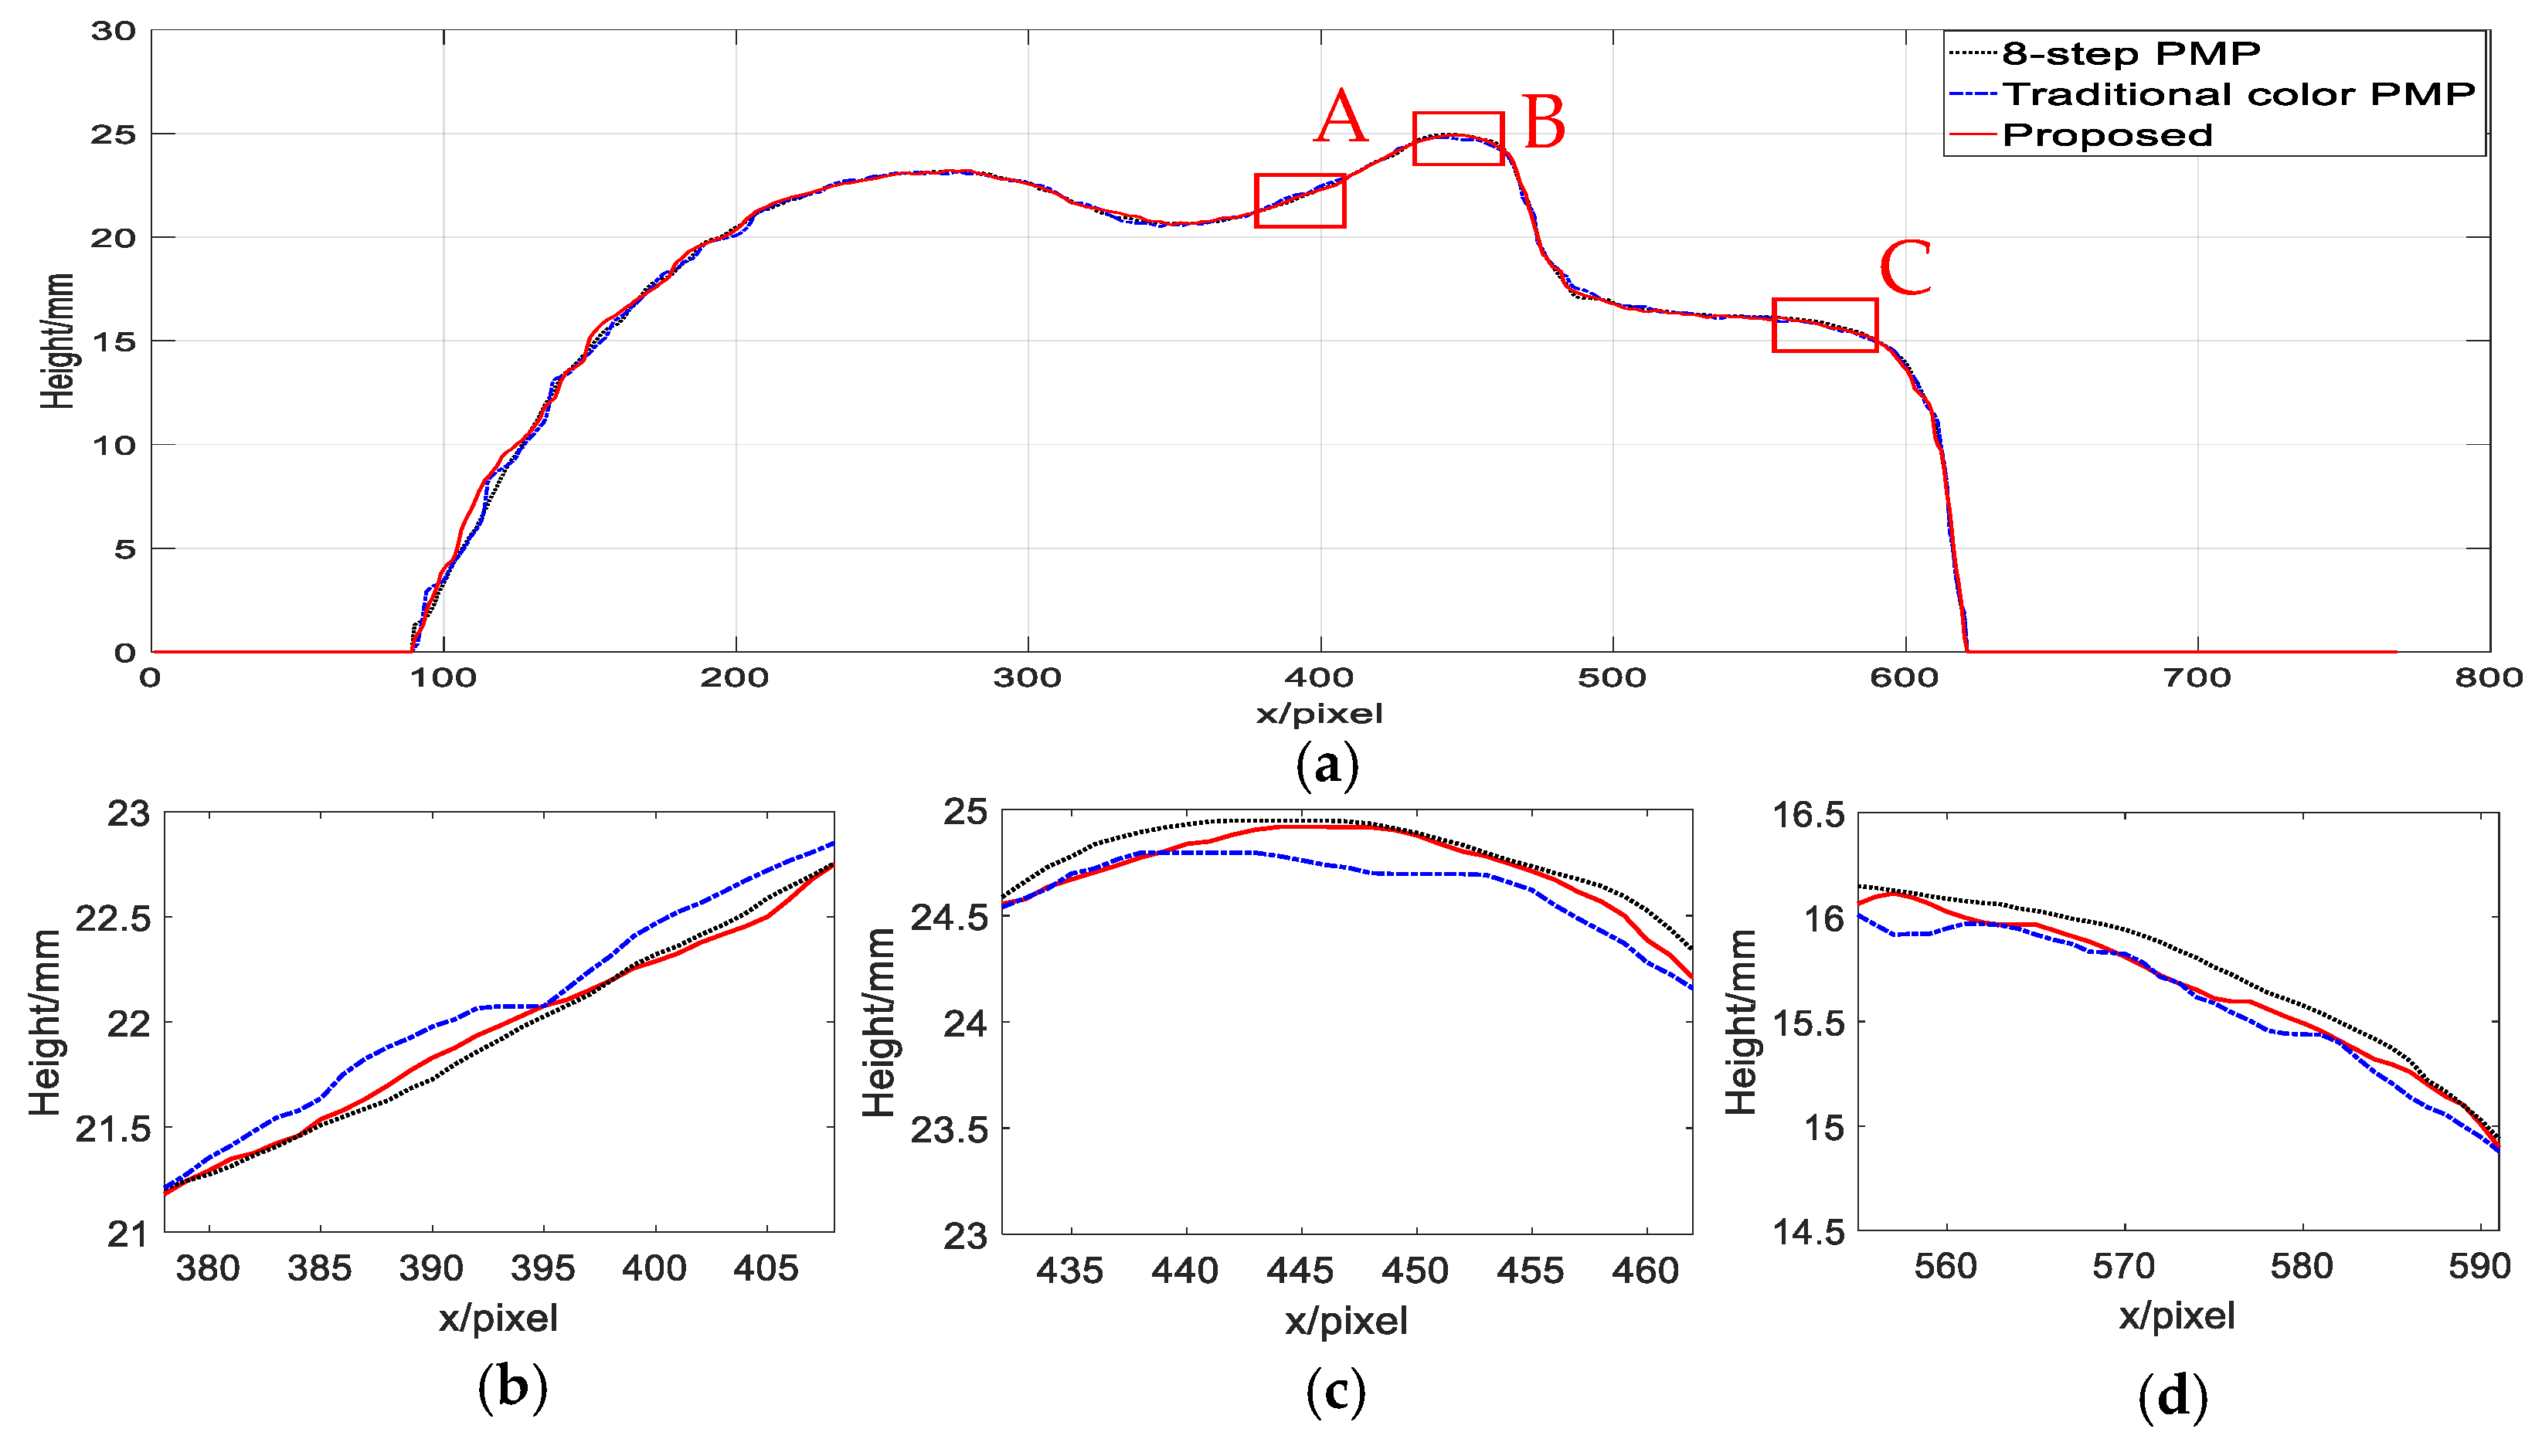
Figure 7 shows the 547th column data of the reconstructed result by these methods. The reconstructed result of measured face model by the eight-step PMP is shown as a dotted line in Figure 7. The reconstructed result of measured object by the traditional single-shot color PMP is shown as a chain line in Figure 7. The reconstructed result of measured object by the proposed method is shown as a solid line in Figure 7. It is obvious that the reconstructed 3D shapes of the measured object with all three methods are well achieved. As is known, the large-step PMP has very high efficiency and measuring accuracy. Therefore, we take the data reconstructed by eight-step PMP as the reference standard. By comparing and analyzing the data of Column 548, Lines 378–408, 432–462, and 555–591 shown in Regions A–C in Figure 7a, which are the “bridge of nose”, “tip of nose”, and “jaw” parts of the face model, the reconstructed details of the above area after correction by the method are closer to the reconstructed results by eight-step PMP than those of the traditional color PMP. The comparison experimental results show that the detail accuracy of the proposed method is better than that of the traditional color PMP.

Figure 7.
(a) The 547th column data of the reconstructed result; and (b–d) zooms in of Regions A–C in (a).
To further compare the measuring accuracy between the traditional single-shot color PMP and the proposed method, by the difference method, the restored result of the eight-step PMP was chosen as the quasi-truth value to calculate height error distribution of the above two methods. Figure 8a shows the height error distribution by traditional single-shot color PMP. Figure 8b shows the height error distribution by the proposed method. It is observed that the height error distribution of the proposed method is smaller than that of single-shot color PMP. To quantitatively compare and analyze the measurement errors of the traditional color PMP and the proposed method, the mean absolute error (MAE) and the root of mean square error (RMSE) of these methods are calculated. By traditional color PMP, the MAE is 0.2683 mm and the RMSE is 0.3453 mm. By the proposed method, the MAE is 0.1992 mm and the RMSE is 0.2546 mm. It is obvious that the measurement errors of the proposed method are smaller, and the measuring result is closer to that of the eight-step phase-shifting algorithm. The comparison of MAE and RMSE proves the validity of conclusions.
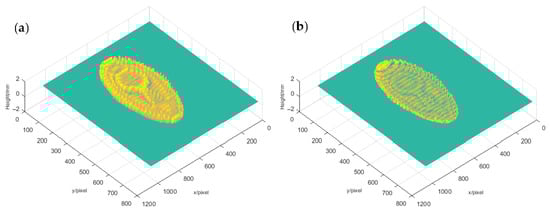
Figure 8.
Comparison height error distributions: (a) traditional color PMP; and (b) the proposed method.
The experiments and analysis sufficiently proved that the proposed method has a good feasibility and validity in the measurement of 3D shape. In this work, we use a set of complementary deformations to extract the background. Because it has a shifted phase between red and blue channels and the interplay of them is lower, the background image is obtained with smaller errors. These complementary deformed patterns can effectively suppress random errors in the measuring process due to the feature of inverse phase between the red and the blue channels. Therefore, the proposed method has better measuring accuracy than the method of single-shot color PMP after the gray imbalance correction. It must be pointed out that there are some shortcomings of the proposed method for measuring colored objects. Because the captured deformed pattern is also modulated by the color of the object, some errors are introduced to result in lower measurement accuracy. However, it is single-shot so that it has higher speed and less sensitivity to mechanical disturbances, and it also has a good application prospect in real-time measurement.
3.3. Real-Time Measurement
To show the real-time measuring practicality of the proposed method, many real-time measuring experiments were also carried out. Here, the real-time measurement of the moving gloved hand is taken as an example. Figure 9a–c shows the deformed patterns at States A–C from the real-time recorded video. Figure 9d–f shows the deformed patterns of G component after correction. The corresponding reconstruction results of the gloved hand are shown as Figure 9g–i, respectively. It is observed that the different states of the moving gloved hand can be well restored by the proposed method. The real-time experimental results prove the practicality of the proposed method in real-time measurement process. In the real-time measurement, the frame rate of the recorded video is only 30 fps with the video resolution of 640 × 480 pixels due to the performance limitation of the camera. Because of its single-shot feature, if a higher performance DLP and camera are adopted, the frame rate can be higher.
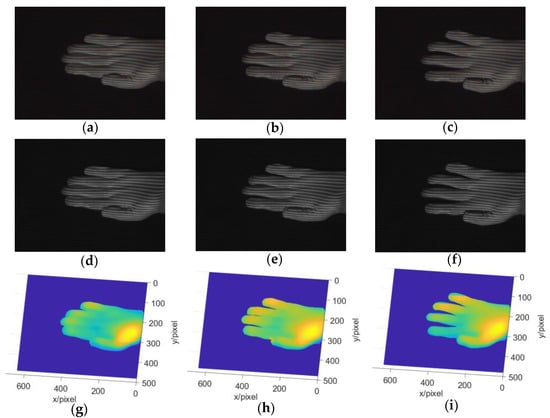
Figure 9.
Reconstructed results of real-time measuring at different states: (a–c) the deformed patterns in States A–C from the recorded video; (d–f) the deformed patterns of green component after correction; and (g–i) the corresponding reconstructed results of the gloved hand.
4. Conclusions
A single-shot 3D measuring method based on quadrature phase-shifting color composite grating projection is proposed. A corresponding physical model of 3D reconstruction is derived systematically. The existence of sensitivity differences and color crosstalk among the tricolor channels are effectively corrected. Many experimental results prove the practicality and validity of the proposed method. Compared with the traditional color PMP, the proposed method uses a set of complementary deformed patterns to extract a purer background. Therefore, the proposed method has the better measuring accuracy than the method of traditional single-shot color PMP. Owing to its single-shot feature, it also has a good application prospect in high speed and real-time measurement.
Author Contributions
Conceptualization, Y.C. and X.H.; methodology, Y.C.; validation, X.H., J.G. and Y.Z.; investigation, C.Y. and J.G.; resources, Y.C.; writing—original draft preparation, X.H.; writing—review and editing, Y.C. and X.H.; visualization, X.H.; and project administration, Y.C. All authors have read and agreed to the published version of the manuscript.
Funding
This work was supported by the Special Grand National Project of China (under grant No. 2009ZX02204-008).
Institutional Review Board Statement
Not applicable.
Informed Consent Statement
Not applicable.
Data Availability Statement
Data is contained within the article or supplementary material. The data presented in this study are available in A Single-Shot 3D Measuring Method Based on Quadrature Phase-Shifting Color Composite Grating Projection.
Conflicts of Interest
The authors declare no conflict of interest.
References
- Su, X.; Zhang, Q. Dynamic 3-D shape measurement method: A review. Opt. Lasers Eng. 2010, 48, 191–204. [Google Scholar] [CrossRef]
- Zhang, S. Recent progresses on real-time 3D shape measurement using digital fringe projection techniques. Opt. Lasers Eng. 2010, 48, 149–158. [Google Scholar] [CrossRef]
- Zhan, G.; Tang, H.; Zhong, K.; Li, Z.; Shi, Y.; Wang, C. High-speed FPGA-based phase measuring profilometry architecture. Opt. Express 2017, 25, 10553–10564. [Google Scholar] [CrossRef]
- Huang, P.S.; Zhang, C.; Chiang, F.-P. High-speed 3-D shape measurement based on digital fringe projection. Opt. Eng. 2003, 42, 163–168. [Google Scholar] [CrossRef]
- He, Y.; Cao, Y. A composite-structured-light 3D measurement method based on fringe parameter calibration. Opt. Lasers Eng. 2011, 49, 773–779. [Google Scholar] [CrossRef]
- Zhang, S. High-speed 3D shape measurement with structured light methods: A review. Opt. Lasers Eng. 2018, 106, 119–131. [Google Scholar] [CrossRef]
- Xu, J.; Xi, N.; Zhang, C.; Zhao, J.; Gao, B.; Shi, Q. Rapid 3D surface profile measurement of industrial parts using two-level structured light patterns. Opt. Lasers Eng. 2011, 49, 907–914. [Google Scholar] [CrossRef]
- Khan, D.; Shirazi, M.A.; Kim, M.Y. Single shot laser speckle based 3D acquisition system for medical applications. Opt. Lasers Eng. 2018, 105, 43–53. [Google Scholar] [CrossRef]
- Zuo, C.; Feng, S.; Huang, L.; Tao, T.; Yin, W.; Chen, Q. Phase shifting algorithms for fringe projection profilometry: A review. Opt. Lasers Eng. 2018, 109, 23–59. [Google Scholar] [CrossRef]
- Jeught, S.V.; Dirckx, J. Real-time structured light profilometry: A review. Opt. Lasers Eng. 2016, 87, 18–31. [Google Scholar] [CrossRef]
- Zhang, Z. Review of single-shot 3D shape measurement by phase calculation-based fringe projection techniques. Opt. Lasers Eng. 2012, 50, 1097–1106. [Google Scholar] [CrossRef]
- Takeda, M.; Mutoh, K. Fourier transform profilometry for the automatic measurement of 3-D object shapes. Appl. Opt. 1983, 22, 3977–3982. [Google Scholar] [CrossRef] [PubMed]
- Wu, Y.-C.; Cao, Y.-P.; Huang, Z.-F.; Lu, M.-T.; Chen, D.-L. Improved composite Fourier transform profilometry. Opt. Laser Technol. 2012, 44, 2037–2042. [Google Scholar] [CrossRef]
- He, Y.; Cao, Y. Three-dimensional measurement method with orthogonal composite grating aided by fringe contrast and background calibration. Opt. Eng. 2010, 49, 717–720. [Google Scholar] [CrossRef]
- Chengmeng, L.; Yiping, C.; Cheng, C.; Yingying, W.; Guangkai, F.; Yapin, W. Computer-generated moiré profilometry. Opt. Express 2017, 25, 26815. [Google Scholar]
- Li, C.; Cao, Y.; Wang, L.; Wan, Y.; Wang, Y. Real-time computer-generated moiré profilometry with adaptive filtering algorithm. Opt. Eng. 2020, 59, 034102. [Google Scholar] [CrossRef]
- Wan, Y.; Cao, Y.; Chen, C.; Fu, G.; Wang, Y.; Li, C. Single-shot real-time three dimensional measurement based on hue-height mapping. Opt. Commun. 2018, 416, 10–18. [Google Scholar] [CrossRef]
- Huang, P.; Hu, Q.; Jin, F.; Chiang, F. Color-encoded digital fringe projection technique for high-speed three-dimensional surface contouring. Opt. Eng. 1999, 38, 1065–1071. [Google Scholar] [CrossRef]
- Hu, Y.; Xi, J.; Chicharo, J.; Yang, Z. Blind color isolation for color-channel-based fringe pattern profilometry using digital projection. J. Opt. Soc. Am. A Opt. Image Sci. Vis. 2007, 24, 2372–2382. [Google Scholar] [CrossRef]
- Zhang, Z.; Towers, C.; Towers, D. Compensating lateral chromatic aberration of a colour fringe projection system for shape metrology. Opt. Lasers Eng. 2010, 48, 159–165. [Google Scholar] [CrossRef]
- Jiang, C.; Jia, S.; Dong, J.; Bao, Q.; Yang, J.; Lian, Q.; Li, D. Multi-frequency color-marked fringe projection profilometry for fast 3D shape measurement of complex objects. Opt. Express 2015, 23, 24152–24162. [Google Scholar] [CrossRef]
- Zhu, L.; Cao, Y.; He, D.; Chen, C. Grayscale imbalance correction in real-time phase measuring profilometry. Opt. Commun. 2016, 376, 72–80. [Google Scholar] [CrossRef]
- Ma, M.; Cao, Y.; He, D.; Chen, C.; Wan, Y. Grayscale imbalance correcting method based on fringe normalization in RGB tricolor real-time three-dimensional measurement. Opt. Eng. 2016, 55, 034102. [Google Scholar] [CrossRef]
- Cao, Y.; Su, X. RGB Tricolor Based Fast Phase Measuring Profilometry. In Proceedings of the SPIE/COS Photonics Asia, Photonics Asia Symposium 2002, Shanghai, China, 14–18 October 2002. [Google Scholar] [CrossRef]
- Pan, J.; Huang, P.S.; Chiang, F.-P. Color-encoded digital fringe projection technique for high-speed 3D shape measurement: Color coupling and imbalance compensation. In Proceedings of the SPIE Optics East, February 2004, Conference on Two- and Three-Dimensional Vision Systems for Inspection, Control and Metrology, Providence, RI, USA, 29–30 October 2003; Volume 5265, pp. 205–212. [Google Scholar] [CrossRef]
- Huang, P.S.; Pan, J.; Chiang, F.-P. Color phase-shifting technique for three-dimensional shape measurement. Opt. Eng. 2006, 45, 013602. [Google Scholar] [CrossRef]
- Fu, G.; Cao, Y.; Wang, Y.; Wan, Y.; Wang, L.; Li, C. Real-time three-dimensional shape measurement based on color binary fringe projection. Opt. Eng. 2019, 58, 044102. [Google Scholar] [CrossRef]
- Su, X.; Chen, W. Reliability-guided phase unwrapping algorithm: A review. Opt. Lasers Eng. 2004, 42, 245–261. [Google Scholar] [CrossRef]
- Song, W.; Su, X.; Cao, Y.; Xiang, L. Phase-height mapping and coordinate calibration simultaneously in phase-measuring profilometry. Opt. Eng. 2004, 43, 708–712. [Google Scholar] [CrossRef]
- Ma, Q.; Cao, Y.; Chen, C.; Wan, Y.; Fu, G.; Wang, Y. Intrinsic feature revelation of phase-to-height mapping in phase measuring profilometry. Opt. Laser Technol. 2018, 108, 46–52. [Google Scholar] [CrossRef]

Publisher’s Note: MDPI stays neutral with regard to jurisdictional claims in published maps and institutional affiliations. |
© 2021 by the authors. Licensee MDPI, Basel, Switzerland. This article is an open access article distributed under the terms and conditions of the Creative Commons Attribution (CC BY) license (http://creativecommons.org/licenses/by/4.0/).