Abstract
The increasing availability of data, gathered by sensors and intelligent machines, is changing the way decisions are made in the manufacturing sector. In particular, based on predictive approach and facilitated by the nowadays growing capabilities of hardware, cloud-based solutions, and new learning approaches, maintenance can be scheduled—over cell engagement and resource monitoring—when required, for minimizing (or managing) unexpected equipment failures, improving uptime through less aggressive maintenance schedules, shortening unplanned downtime, reducing excess (direct and indirect) cost, reducing long-term damage to machines and processes, and improve safety plans. With access to increased levels of data (and over learning mechanisms), companies have the capability to conduct statistical tests using machine learning algorithms, in order to uncover root causes of problems previously unknown. This study analyses the maturity level and contributions of machine learning methods for predictive maintenance. An upward trend in publications for predictive maintenance using machine learning techniques was identified with the USA and China leading. A mapping study—steady set until early 2019 data—was employed as a formal and well-structured method to synthesize material and to report on pervasive areas of research. Type of equipment, sensors, and data are mapped to properly assist new researchers in positioning new research activities in the domain of smart maintenance. Hence, in this paper, we focus on data-driven methods for predictive maintenance (PdM) with a comprehensive survey on applications and methods until, for the sake of commenting on stable proposal, 2019 (early included). An equal repartition between evaluation and validation studies was identified, this being a symptom of an immature but growing research area. In addition, the type of contribution is mainly in the form of models and methodologies. Vibrational signal was marked as the most used data set for diagnosis in manufacturing machinery monitoring; furthermore, supervised learning is reported as the most used predictive approach (ensemble learning is growing fast). Neural networks, followed by random forests and support vector machines, were identified as the most applied methods encompassing 40% of publications, of which 67% related to deep neural network with long short-term memory predominance. Notwithstanding, there is no robust approach (no one reported optimal performance over different case tests) that works best for every problem. We finally conclude the research in this area is moving fast to gather a separate focused analysis over the last two years (whenever stable implementations will appear).
1. Introduction
Learning is the most important thing that human beings do. An organism cannot properly animate itself without first learning how to [1]. At the same time, past knowledge and experience aid the decision-making process. We need to study, analyse, and use data systematically, but above all, wisely, in order to improve ourselves and while minimizing efforts. In the same way, industry is becoming ‘smarter’ by introducing local intelligence in equipment in the form of machine learning (ML). ML acquires knowledge to computers through observations and interacting with word. It uses artificial intelligence to build systems that automatically improve with experience and are able to extract the fundamental relations that govern the process [2]. ML makes use of big data, the expansion of the Industrial Internet of Things (IIoT), the availability of computing power, the development of cyber-physical systems, and superior decision capabilities required to manage today’s complex assets [3]. ML makes use of representation (classification), evaluation (scoring function), and optimization (search method). It cannot get something from nothing, but it applies the basic principle of getting more from less. ML generally improves with performances. On the counterpart, is makes use of artificial intelligence (as a branch of computer science) as the coding program (generally in the form of network) that can sense, reason, act and react to the external stimulus as biological entities. It learns an input/output map via back-propagation and optimization procedure [4]. Therefore, even though machine learning has been researched for decades, the application of artificial intelligence (AI) systems in industry and its associated operational assets is now advancing at a rapid pace. ML is supporting agile, lean, and energy-efficient manufacturing systems by combining human resources, automation, and data [5]. Given the availability of a big data pool, collecting from sensors attached to every aspect of a production line and its supporting services, data-driven optimisation can be implemented in manufacturing.
Data-driven approaches aim to construct abilities and intelligence on data [6]. When data are big, it requires technical, methodological (may be human and operational) skills to manage and properly decide value through mining. Manufacturing data support actions, including
- conducting sophisticated statistical analysis, using big data analytics and machine learning algorithms to make smarter business decisions;
- optimizing operational efficiency of manufacturing assets, enabling the use of autonomous vehicles, increase production speed, reduce test time and calibration, reduce supply chain forecasting errors and result in better product availability;
- improving after sales service and enable customisation of products;
- implementing energy management initiatives, uncover important insights, fine-tune product quality, reduce the risk of shipping non-conforming parts, develop prediction of the future behaviour of the systems, detect anomalies, identify defects, and uncover the root cause of problems.
Poor maintenance management can lead to non-negligible, economic, environmental, and social impacts. Those may alter the industrial sustainability [7]. The correct maintenance and management of physical assets could report positive effects in social and corporate sustainability [8]. Stakeholders recognize in maintenance, as well as on the educational and training and smartness of maintenance processes, the levers for life cycle sustainability. The type of maintenance process affects the assets and equipment as well as process efficiency. It, moreover, acts on safety performance, environmental damage, and energy and resource consumption [9]. Applying predictive maintenance (PdM) could boost equipment life cycle and quality [10], minimize human effort, optimise supply, and enable the management of reliability and errors, losses, wastage, and costs, thereby increasing the overall equipment effectiveness (OEE) [11]. At the moment, real-time and proactive maintenance requires real-time sensing and extensive data collection, and it is mostly the evolutionary step of condition-based maintenance [7].
PdM is showing great potential when guided by an ML algorithm, which works in the domain of artificial intelligence. The effectiveness of ML is measured by its ability to rapidly handle big data. Using ML we can “interpret” complex processes, assets, and data. ML can give direct access from machines to a large number of sample data. In agent-based implementations, code is included inside the internal machine engine in order to detect patterns and trends while triggering alarms and stoppages based on tasks, products, and boundaries. Rather than programming computers to be smart by hand-coding software routines with a specific set of instructions to accomplish a particular task, ML examines the relationship between a data record and the labelled output (e.g., failures) and then creates a data-driven model to report future outcomes. This can recognize patterns from historical events and can forecast or prevent failures based on learnings from specific breakdown of root causes. Cloud-based AI systems continuously learn from alerts. In this way, it results in performance optimization and consequent increases in machine availability. Comparing an AI-based approach to traditional condition monitoring or more classical maintenance strategies, such as usage-based exchange, a considerable improvement can be expected due to better failure prediction.
ML algorithms are being applied to a broad range of problems or applications in the manufacturing domain. They can generally used to enlarge and extract prediction while mitigating the difference in training and test sets. They generally contain an evolution of the condition-based maintenance [12]. Open source, pre-made beta tools are widely available on the internet, further promoting adoption. However, they suffer problems with virtual prototyping and data collection. Supervised and unsupervised learning, inductive logic programming, clustering, reinforcement learning, Bayesian networks, and decision tree learning are some major proposals for ML.
There is no clear border between ML and deep learning (DL). In the most basic terms, DL is a probability-based decision system. Analysing the dataset, DL constructs the probability network by making statements, decisions, or predictions with a risk or more “certain” outcome projection. This study analysed the recent literature on ML applications for PdM to construct patterns and guidelines for situational intelligence, performance improvement, and reliability improvement in smart manufacturing [13].
The question of what is the best ML for PdM comes from what best fits the data and objective [14,15]. Classifying the maintenance strategies in order to increase complexity, it is possible to recognize strategies for (i) Corrective or Reactionary Maintenance (CM or RM). In CM or RM the asset operates on breaking-down followed by maintenance activities with the aim of speedily restoring; this procedure passively acts after failure to detect and repair. According to ISO 13306:2010, CM maintenance is carried out after fault recognition and is intended to put an item into a state in which it can perform a required function. It is also referred to as run-to-failure maintenance, in which you cannot run without spare parts. It is the simplest maintenance approach used on constant failure rate. Moreover, it is the least effective one, in relation to the cost of interventions and the associated downtime after failure [16]. (ii) Preventive Maintenance (PM). PM anticipates breakdowns so that they can be managed and failures can be reduced. According to ISO 13306:2010, PM is carried out at predetermined intervals or according to prescribed criteria and intended to reduce the probability of failure or the degradation of the functioning of an item. Adjustments, replacements, renewals, and inspections are organized based on planning and scheduled tasks. If planned, the machine is periodically inspected, and the identified parts are replaced based on a timetable. (iii) Proactive Reliability Maintenance (PRM) aims at determining the root failure causes, collecting measures, and performing corrective actions to avoid service stoppage [17]. It aims to anticipate failures or defects before they occur. It is defined in ISO 13306:2010 as an active preventive maintenance that can be carried out while the item is functioning. (iv) With a Condition-Based Maintenance approach (CBM), anomalies are identified and resolved prior to functional failure based on sensor signal monitoring. Maintenance is performed only when equipment problems have been registered. According to ISO 13306:2010, CBM is a preventive maintenance that includes a combination of condition monitoring and/or inspection and/or testing, analysis, and the ensuing maintenance actions.
The condition-based monitoring approach calculates potential degradations and effective program maintenance. CBM points on data in order to get maintenance decisions. Vibration and pressure signals are generally used as the signals in monitoring. CBM intelligently avoids any unnecessary maintenance tasks in predicting interventions. CBM technologies significantly reduce the cost of maintenance and improve operational safety. PdM can be considered a CBM smart release that measures the condition of the equipment, forecasts possible failures and stoppages, and, consequently, proceeds in action to avoid any ramifications of failure. It acts on the role of a reliability centred maintenance (RCM), plant asset management system (PAM), and total productive maintenance (TPM) [18].
As this research area is an active one, a number of other reviews were identified in related fields. Merkt reviewed maintenance approaches with applicability in the industrial environment. They found that literature did not inform as to which new AI technology based on ML methods and techniques is influencing and changing the maintenance approaches in the industrial setup [19]. Carvalho et al. reviewed the use of ML techniques in PdM applications [20]. The goal was to identify if ML was being applied in this field rather than to look at the selection of ML techniques to best serve PdM. Long over this paper, we considered situations where input of learning is collected in multiple data gathered from factory for digital twin applications [21,22]. This paper reports a systematic mapping [23] of the machine learning technologies for predictive maintenance in smart manufacturing. It quantifies its role in literature to identify trends in research and usage. Its main aim is to assist new researchers in the identification of ML techniques for potential application the PdM field. In recent times, with the consolidating of Industry 4.0 and smart manufacturing [24], different proposals have appeared with predictive maintenance framework and, above all, systematic review analysis. Kiangala and Wang in 2020 proposed a predictive maintenance framework, developing fault classification based on machine learning, with application for motor conveyors. In this work, a principal component classification was applied to improve the effectiveness of fault diagnosis [25]. Ruiz-Sarmiento et al. in 2020 analysed predictive maintenance initiatives in the production of a high-quality hot rolling process. They applied Bayesian filter and machine learning to estimate machine degradation and plan maintenance initiatives [26]. Zhang et al., in 2019, analysed data-driven methods for PdM in the context of automatic washing equipment. They concluded about the importance of data mining and data amount for forecasting error affordability. Accuracy over different ML approaches was discussed [27]. A state-of-the-art analysis about industrial IoT devices and cyber-physical system cases related to maintenance was reported in the work of Rubio et al. in 2019. They remarked the importance of automatic fault classification for smart maintenance detection [28]. In the last year, the trend of interest—but still open issue—about predictive maintenance initiatives was certified by various proposals investigating state-of-the-art challenges. Zonta et al., 2020, classified and catalogued current challenges and limitations in predictive maintenance remarking the importance of a taxonomy—and clear strategy identification—for engineering domains in the context of I4.0 [29]. Moreover, Dalzochio et al., 2020, discussed the newest (last 3 years) published research proposals in the area of predictive maintenance. They mostly concluded ML methods applied to PdM are generally related to a specific domain (equipment) with no global vision on factory assessment. Identification of an optimal strategy and quality of results depends on equipment and machines and on the possibility of extrapolation based on data features [30]. The state-of-the-art initiatives on PdM for pump systems and thermal power plants were discussed in the work of Olesen et al., 2020. They focused on experimental-based proposals while reporting about ML performances on remaining useful lifetime estimation, based on features extraction [31]. They concluded that for the success on ML in PdM a knowledge-based classification/intervention is required.
Moreover, the international roadmap for devices and systems [32] remarked the actual design of devices for heterogeneous system integration (particularly in the field of semiconductor industry) to support information collection and digital manufacturing interacting with product, process, people, and the environment [33,34,35,36].
The requirement of a systematic vision for PdM initiatives is the objective of the work of Carvalho et al., 2020 [20]. This work mostly focuses more on equipment and methodology analysis/clusterisation. In the work of Siahpour et al., 2020 [35], the authors proposed a deep learning based cross-sensor approach for integrating multiplace location data to machinery fault diagnosis. The authors applied a deep convolutional neural network and unsupervised parallel data for conditional domain adaptation. In the proposal of Lee et al., 2020 [36], the use of intelligent digital twin was used for product design and development, machine and equipment health monitoring, and product support and services for smart manufacturing initiatives [37,38,39].
We finally conclude the research in this area is moving fast and requires a focused investigation over the last two years.
2. Research Methodology
Systematic literature studies, including both reviews and maps, have emerged as a formal and well-structured approach to synthesize evidence and thus allow researchers to come to an understanding of the status of a research area [40]. A systematic map builds a classification scheme in the field of interest, which fundamentally quantifies publications and categorizes research types while providing a visual map of trends. It provides an approach that facilitates a great breadth of investigation, while sacrificing depth.
2.1. Mapping the Process
Figure 1 illustrates the mapping process providing a visual workflow. The mapping process extracts from a database—constructed from research questions and keywords selection—relevant features on ML to PdM for SM (ML2PdM4SM). Selected papers are classified using keywords, and a set of inclusion and exclusion criteria for core consistency is included. Relevant papers were further analysed to classify the research content. Finally, the screened papers were aggregated, categorized, and mapped in order to answer the research questions [41].
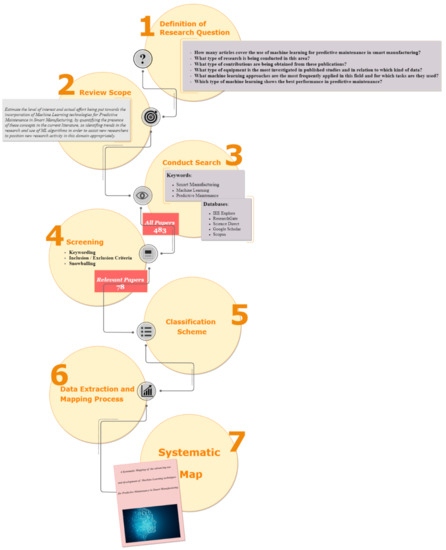
Figure 1.
The systematic mapping process.
2.2. Research Questions
The role of research questions (RQs) is to select and classify publications by quantifying the presence of main concepts in the current literature. Prominent use and the application of machine learning technologies for predictive maintenance in smart manufacturing have been investigated. Therefore, a cluster of ML techniques, its application, and main results are discussed. The six RQs are as follows:
- RQ1.
- How many articles cover the use of machine learning for predictive maintenance in smart manufacturing?
The amount of interest in this area, from 2013 to 2019 (early included), was illustrated by quantifying the sources of literature in the field and assuming the publication rate as an indicator, in order to estimate the trend.
- RQ2.
- What type of research is being conducted in this area of ML techniques for PdM in SM?
The maturity level was formulated. It is assumed that simulation without an industrial test bed may be indicative of a developing effort. On the contrary, complete maturity would exhibit a larger number of studies where solution results have been commented.
- RQ3.
- What type of contributions are resulting from publications?
An effort was made to understand the specific challenges by analysing the obtained output in publications and by classifying the output in terms of contribution. This question may further help in identifying gaps or trends in the research field. It was assumed that early research efforts may focus on architecture, model, framework, process, or methodologies, whereas more mature research may propose tools.
- RQ4.
- What class of equipment is a candidate to be mapped for smart manufacturing, and what is the relation between equipment and type of data under investigation?
The specific research approaches that support challenges for manufacturing industries were identified. Therefore, by classifying industrial equipment and components, it is possible to provide consistency of ML in handling degradation and fault prediction, estimation of remaining useful life (RUL), detection quality, performance and health monitoring, and reliability and risk analysis based on different types of data sets.
- RQ5.
- What machine learning approaches are the most frequently applied for PdM and for which tasks are they widely used?
The most prominent ML technologies for PdM in SM were identified as well as the specific tests for which they were used. Thus, the latest advancements in relevant areas are highlighted and commented on.
- RQ6.
- Which type of ML approach shows the best performance in PdM?
Successful performances in ML for PDM in SM were reviewed in order to suggest future (incoming) research directions.
2.3. Scientific Database Search
The database was extracted from IEEE Xplore, ResearchGate, Science Direct, Google Scholar, and Scopus. Keywords were identified and grouped on synonymous search terms (Table 1). A PICO (population, intervention, comparison, and outcome) approach was used including the following: population as specific role, category, application area, or industry group; intervention as the methodology, tool, technology, or procedure; comparison to identify the different strategies that have been used until now; measurable outcome for quantification of key success. The Mendeley reference management tool was used to remove duplicates and manage multiple references. Publications from 2013 to 2018 (early 2019) were selected assuming that only pioneering (because of the level of maturity in technology) approaches were published before 2013. Terms selection was defined in order to widely include concepts (like for example prognostic and health management (PHM) under the category “terms” identification of predictive maintenances) that was used in combination with techniques and monitoring perspectives).

Table 1.
Main database for research criteria.
2.4. Screening the Publication Content
The database was populated by searching keywords in the title and abstract. Exclusion and inclusion criteria were manually applied after a cursory analysis (Table 2). The screening process was organized in three steps to make the selection more agile and accurate. The first step aimed at including only the papers in which at least two of the selected keywords were matched in the title. The resulted publications were filtered (step 2) based on a deeper understanding of the abstract and conclusion sections. Exclusion was then again applied manually based on the content of analysis, significance in methodology, and the coherence with the RQs.
Table 2.
Inclusion and exclusion criteria for selection of relevant papers.
Thus, relevant papers in the database were obtained. These were selected to conduct backward snowball sampling. It was used (step 3) as a reference list to identify additional papers to be included. This database was then studied by full-text reading.
3. Data Extraction and Documentation
For each publication in the database the following information was extracted: publication title, authors, year, geographical area, research and contribution type, component investigated as per case study, sensor data monitored, task performed, machine learning strategy, and method applied. We designed a code to extract headings from the selected proposal. We implemented the Latent Dirichlet Allocation to analyze text and mine for probabilities of words [42]. For each publication in the database, we read the proposal in order to cluster the strategy and method applied. Each publication was classified as either “evaluation research” or “validation research” (see Table 3 for details). These categories are further divided into subcategories as per Figure 2.
Table 3.
Type of research included.
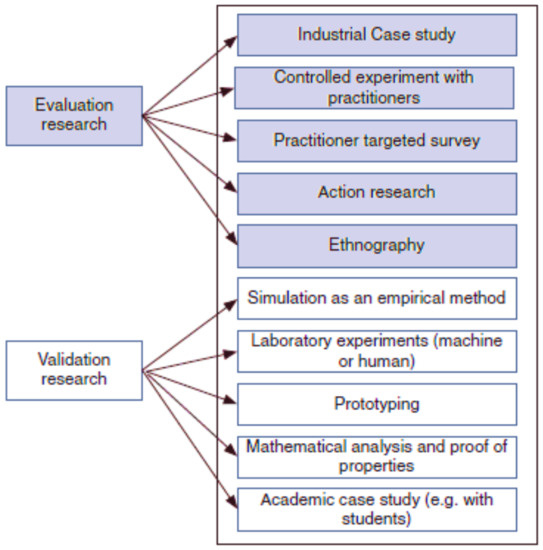
Figure 2.
Classification of research methods.
Reports containing a survey, case study, controlled experiment, action research, ethnography, simulation, prototyping, and mathematical (software engineering state of art analysis) were included.
To classify the type of contribution, the qualitative research method known as key-wording was chosen. The abstract of each publication was reviewed to identify the main keywords, over the declared, that described the research output of the paper. Research labelled as theory or platform [43] was excluded in this phase. Table 4 provides a summary of each type of research contribution. Furthermore, each publication used in the study was classified in the type of contribution.
Table 4.
Classification of type of contribution [8].
This study sought to highlight the amount of interest, the current maturity level, pertinent trends in the literature, and the focus of the research shown in a new and pervasive research area, as the application of the advanced techniques of machine learning for predictive maintenance in smart manufacturing. In particular, the study presented some machine learning techniques for predictive maintenance to highlight the advantages of their application to improve situational intelligence, performance, and reliability in smart manufacturing. The research questions led the adopted systematic mapping process, to help other researchers in the field to analyze research directions and identify interesting needs and perspectives in the field. The systematic mapping was carried out by gathering high-level knowledge from 78 publications, deemed relevant for the study, according to the aforementioned inclusion/exclusion criteria. An upward trend was identified in publications for smart manufacturing of PdM; in particular, in the last two years, a fivefold growth in publications was recorded after a trough in 2016. It was found that 40% of research evidenced a study related to deep learning methods; these are considered an innovative trend in machine learning in recent years [44]. USA and China led the publication provenance of the selected papers, possibly due to the policy lead initiatives in these countries. It was also observed that there were an equal number of evaluation and validation studies available in this area, this being a symptom of a research area being not yet mature, but in rapid growth. In addition, the majority of models and methodologies were identified as contribution types. However, in 2017–2018 the superiority in publications of tools revealed a growing interest in applications. This mapping study was conducted also to review the progress in this field, through the identification of a research set from the relevant papers for the study. Publications were included that presented an implementation of a proposed solution tested on open source simulated data set or an evaluation of it in a real industrial case study. As a result of this study, existing classes of machine learning approaches and methods were identified and characterized in relation to the investigated equipment and the related monitored data. It was found that vibration is the major factor monitoring signal for machinery analysis [45]. It compares as the most used data set for all types of equipment analysed [46]. Furthermore, the most used approach was supervised learning, although ensemble learning is gaining importance. Neural networks, followed by random forests and support vector machines, were identified as the most applied methods. Neural networks accounted for 40% of the publications, of which 67% related to deep neural network with long short-term memory as the majority. However, as discussed, there was no one algorithm found that worked best for every problem.
3.1. Type of Equipment and Sensor Data
In order to highlight the main application areas of ML techniques for PdM, components and equipment were classified by analysing the evaluation or validation approach that the authors reported. Table 5 shows the different types of equipment investigated in relation to specific monitored data sets.
Table 5.
Real-world system components investigated and their measurable sensor data [11].
The manufacturing machinery category included proposals with data related to CNC tools, devices, industrial equipment for different production, swivels and valves, reactors, hard drive, refrigeration [47] and cold-storage systems (RCSS), and heating, ventilation and air conditioning (HVAC) [48]. The semiconductor manufacturing process included wafer fabrication, ion beam etching, and ion-source tungsten filament breakdown [49]. The rotary machines category included degradation of bearings [50,51], gas circulator (GC) units used in the advanced gas-cooled reactor, and rotary machines in plant fan mills plates. Studies on exhaust fan, mill, and furnace fan; degradation of bearings of gas or wind turbine [52]; turbofan and induction motor [53], aircraft, and diesel engine [54,55]; and transformer short-circuit (considered in Electrical and Electronic) were also categorised.
3.2. Machine Learning Approaches and Tasks
Machine learning models are data-driven learning methods used to train software to make generalized predictions from historical data. These models have the ability to automatically learn how to solve problems of different natures and with different dimensionality values, from hundreds of input features to just a few [12]. ML-based PdM can be divided into the following main classes: (i) Supervised is the task of inferring a function from labelled training data. Knowledge on failures is included in the modelling dataset; (ii) Unsupervised is where logistic and/or process information are available, but maintenance related data do not exist, the observations have no “labels”; hence, an algorithm is used to identify hidden patterns in the input variables [4]; (iii) Semi-supervised learning uses unlabelled examples to help learn the probability distribution over the input space and jointly optimizes the prediction over the labelled and unlabelled examples [13]. This is becoming popular in the recent research. (iv) Reinforcement learning can combine the learning and acting phases simultaneously into on-line learning and gives a self-optimizing feature. It uses data to learn about an optimal relationship (for a given objective), either between the input and the decision or the input and the performance index.
Sub categories of several data driven models in ML are identified as follows: (a) Ensemble learning are meta-algorithms that attempt to decreasing variance. It aims to do this by biasing data while improving predictions using bagging, boosting, and stacking methods [14]; (b) Inductive learning involves an algorithm for decision map and rule-based learning; (c) Instance-based learning is a class of inductive learning. It generates classification predictions using specific instances on local approximation. Instance-based learning algorithms do not maintain a set of abstractions derived from specific instances [15].
However, many researchers engaged in machine learning have promoted recent developments like Deep Learning (DL), as revolutionary inventions that will have a transformative effect. DL has emerged as a promising computational technique for dynamic system prediction due to its enhanced capability to characterize the system complexity [56], overcoming the shortcomings of those traditional methods [57]. It is a ML technique that learns multiple levels of representations in deep architectures. The traditional neural networks are less effective in handling the unlabelled data that are often encountered in real life. Deep architectures incorporate both unsupervised pre-training and supervised fine-tuning strategies to construct the learning models [58]. DL over the class of artificial intelligence systems allows automatic processing of data. It works towards highly non-linear and complex feature abstraction via a cascade of multiple layers, instead of handcrafting the optimum feature representation of data with domain knowledge. In this perspective, the contraposition that was used between deep learning category vs. the others is suitable.
Moreover, the PdM instances can be formulated as follows: (i) Classification problem, which aims to determine the probability of a part failing before n numbers of parts are processed; (ii) Regression problem in which it is predicting the time remaining until the next failure is expected to occur, called RUL [6]. Both the categories are under supervised learning class; (iii) Clustering is generally listed under the unsupervised approach as the results are a collection of data items split between similarity and dissimilarity categories [59]. The following high-level schematics, Figure 3 and Figure 4, were defined, matching different classification schemes presented in the literature [60,61,62,63,64]. Different and multiple names for the literature were found and grouped as per RQ5 into data-driven models (blue blocks), learning approaches (grey blocks), and learning modes (light green blocks). Across learning class, it is possible to identify different supervised categories. Those encompass the supervised, semi-supervised, reinforced, inductive, instance-based and unsupervised approaches in learning (grey color). They can implement NNs-based methodology with some probability-based tests (for features extraction). You should generally make use of multiple learning algorithms to obtain better predictive performance (those are under the class of machine learning approaches based on data) [65]. Learning is used to extract classification, prediction, function approximation, and features clustering. Semi-supervised learning represents a middle ground between supervised and unsupervised algorithms. They operate on data mostly unlabelled and can make use of learning models as for its two grounded categories.
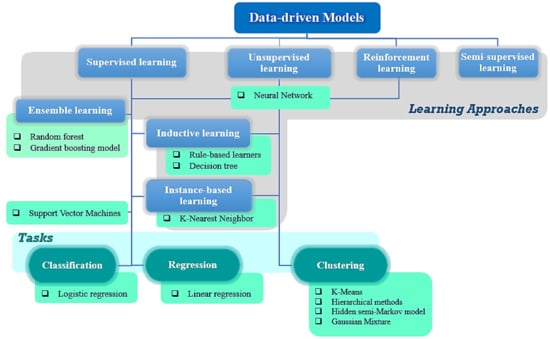
Figure 3.
Classification of machine learning approaches, methods, and tasks (learning approaches (grey blocks) and learning modes (light green blocks)).
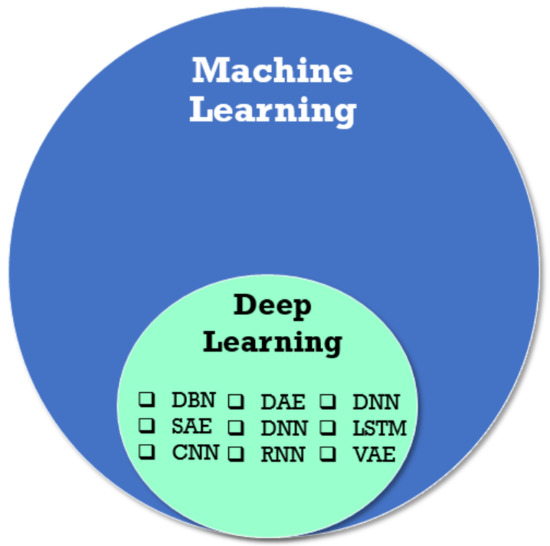
Figure 4.
Deep Learning methods.
3.3. Machine Learning Methods
The following methods were identified for the ML category, based on successful applications: (A) Random forest (RF), which is an example of parallel ensemble method. It operates by constructing a set of decision trees. Training and outcomes make use of the mean prediction of the individual trees. The objective in parallel methods is to exploit independence between the base learners, as the error can be reduced dramatically by averaging. Otherwise, in sequential ensemble methods, the base learners are generated sequentially, and the objective is to exploit the dependence between them. The overall performance can be boosted by weighing previously mislabelled examples with higher loads; (B) Gradient Boosting Methods (GBM) differ from RF in the order and way the trees are built [66]. In GBM new trees (constructed one at time, these are not in forest composition) help to correct errors made by previously trained trees; (C) In Support Vector Machine (SVM), as a supervised learning machine approach, the input variables, arranged in separate columns, constitute an n-dimensional space [67]. A hyperplane is selected to separate the inputs in classes. SVMs are usually employed in combination with Kernel Methods (KM) to further enhance performance in classification using non linearity. (D) In the Decision Tree Method (DTM), a tree (top down structure) is constructed as a predictive structure. The branches of this tree illustrate the outcome of the decisions taken; (E) in Rule Based Learning (RBL) the network of decisions can be converted in rules. They work on memory and matching schemes to evaluate conflict and to decide how to proceed in learning. (F) The k Nearest Neighbour (k-NN) classifies objects of instances based on the nearest values with respect to features. It requires computation of distances between samples [68]; (G) Linear (LiR) tries to estimate real values based on continuous variables, while (H) Logistic Regression (LR) estimates estimate discrete values based on given set of independent variables. In simple words, it predicts the probability of occurrence of an event by fitting data to a logit function [63]. (I) Gaussian Mixture Model (GMM) is known as a non-parametric method of density estimation [68]. The unknown parameters are estimated by maximizing the log-likelihood, using the expectation-maximization algorithm [69]. Therefore, an instance is assigned to cluster with a probability amount [70]. Under the clustering approach over the main unsupervised class there are (J1) Hierarchical Methods (HM) (divided in agglomerative and divisive). They work on a bottom-up or a top-down strategy (depending on the type) starting from one object for a cluster or from all objectives in one cluster. It iteratively agglomerates or subdivides clusters until termination conditions are satisfied. HMs are generally contraposed to (J2) Fuzzy Unordered Rule Induction Algorithm (FURIA) that produces better decision boundaries between different classes over fuzzy logic rules [18]. (L) Hidden Semi-Markov Decision Process model (SMDP) is utilized to represent the deteriorating process of machines, due to the generally distributed sojourn time and the unobservable underlying stochastic process on deteriorating quality states [71].
Specific ML applications make use of neural networks. Artificial neural network (ANN) tries to adapt to the information flow of the biological learning scheme. Different types of applications of ANNs include Back Propagation Neural Network (BPNN), Adaptive Neuro-Fuzzy Inference System (ANFIS), Bayesian Neural Network (BNN), Probabilistic Neural networks (PNNs), and Generalized Regression Neural Networks (GRNNs) as a feed-forward category [30].
The BPNN algorithm adjusts the connection weights based on the gradient descent method where the squared error is minimized in the direction of the greatest improvement [72]. BPNN suffers a large number of iterations to converge to the desired solution.
ANFIS is an integration of ANNs and fuzzy logic principles, which makes it possible to utilize the benefits of both in a single framework [73]. Probabilistic neural network involves one-pass learning implemented directly in the learning structure. In the regression schema, dependence between layer decisions is arranged.
BNNs comprise a probabilistic model and neural network. They try to identify direct dependencies between statistical variables. These are represented in the form of a directed acyclic graph (DAG) and a set of node probability tables (NPTs) [74]. GRNNs are memory-based networks of the probabilistic class in a feed-forward approach. They estimate continuous variables as in standard regression techniques in a conditional expectation [75].
Feed Forward Back propagation Neural Network (FFBPNN) over the main category of a probabilistic network is an iterative process operation, in which the input patterns are fed into the input layer of the system. Each hidden layer makes the computation, and it forwards the next active layer in the network until the output layer. The output layer computes the errors based on the observed outcomes and desired level. These errors will then be back-propagated by using the back-propagation formula, from the output layer through the hidden layers and finally reach the input layer. The learning process terminates whenever the total error is within an acceptable level or whenever the limit of the number of iterations has been reached [76].
The Restricted Boltzmann Machine (RBM), as elements of the probabilistic class, is an energy-based parallel constraint network that consists of a layer of binary hidden units and a layer of binary visible units without interconnections between both visible/visible and hidden/hidden units [43].
An innovative trend of the last number of years focused on Deep Neural Networks (DNNs) (Figure 4, inspired from [77]). Deep learning is the evolution of machine learning. It technically continues to analyze data based on NNS while structuring algorithm in layers. They are applied in systems that require human or artificial “thought”. Essentially, DNNs involve feeding a computer system with data. They can be used to make decisions about other data. Data are fed across neural networks as per ML in SM. These networks (logical constructions) ask multiple binary true/false questions, or extract a numerical value, for every bit of data that pass through them. They classify data according to response. DNN can identify failures, if populated by historical data, and the amount is in the complexity of the system.
The most commonly used deep architectures are Deep Belief Networks (DBN) and Convolutional Neural Networks (CNN).
DBN is a feasible method for fault diagnosis and prognosis whenever targeting condition is beyond the historical data. In addition, it also manifests the ability to discover the discriminative information about failures when there is large input dimensionality. DBN architectures of structured Restricted Boltzmann Machines (RBMs) are probabilistic generative models. Those learn the joint probability distribution of training data without using data labels. Once the structure of a DBN is determined, the goal for training is to learn the weights and biases between layers.
CNN consists of multiple layers of hierarchy with some layers of feature representations (feature maps) and classification of type of conventional neural networks. Due to the ability to learn complex and robust representation via a convolutional layer, local patterns in raw data are extracted and subsequently build complex patterns for machine health monitoring through stacking convolutional layers [9].
Echo State Networks (ESNs) are a kind of recurrent neural network that arises from the so-called “reservoir computing approaches” [78]. By stacking memory cells, information of previous inputs are stored in the output with weights, carried by cell state, which makes Long Short-Term Memory (LSTM) an outstanding tool to mimic time series [79].
Auto Encoder (AE) is an unsupervised learning algorithm that extracts features from input data without labelling information [80]. It generally consists of two parts including encoder and decoder. The encoder type compresses data when dealing inputs of high dimensionality by mapping variables in the hidden layer. The decoder reconstructs approximation in inputs. Supposing the activation function is a linear function and there are fewer hidden layers than the dimensionality of input data, then the linear auto encoder is similar to a principle component analysis (PCA). Several variants of AE have been developed: Denoising Auto Encoder (DAE) is an extension version of the basic auto encoder, which is trained to reconstruct the stochastically corrupted input data by adding isotropic Gaussian and by forcing the hidden layer to explore robust features; Sparse Auto Encoder (SAE) imposes sparse constraints on the hidden layers while imposing activation closing to zero. This is used for fault diagnosis and intelligent fault signature. Variational Auto Encoder (VAE) is a deep generative architecture constructing a probability distribution for a latent variable. It generates new input data by sampling distribution. Currently, the generative model is widely used for reliability and risk analysis [81].
To evaluate the performance of the models, the most important metrics in publications are accuracy, precision, recall, F-measure, mean square error, mean absolute percentage error, and the failure capture rate, or in machine learning terms the true positive rate. The latter one is generally analysed next to true negative rate (i.e., percentage of assets that will not fail and the model will predict them correctly) as we can reach a complete true positive rate whenever all occurring failures are predicted but we are able to gain information about risky assets [82].
The current proposal is performing, as per relevant literature review, a comparison of main class of ML. We are focusing on specific performance, but in the specific applicability with the intent to construct a round mat per choosing the right approach for the right asset. The best evolution or validation studies are than selected for a specific asset in a particular content.
In answering RQ6 methods, the learning algorithm or models are used as synonymous and alternative in the filtering database.
4. Results
The systematic map shown in Figure 5 was used to select relevant papers in the field of analysis. A total of 483 publications were originally selected using keywords and main sources as per RQs.
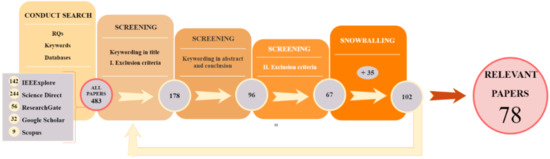
Figure 5.
A breakdown of the screening process.
Basing on exclusion criteria I, 205 papers were considered out from the domain of search. The remaining papers were then submitted to keywords screening test, according to a Latent Dirichlet allocation analysis of text in the abstract and conclusion. A total of 82 papers were then rejected basing on exclusion criteria II. They resulted in 67 articles of relevance matching. The snowballing method was finally used to extract the references from each of these publications. We screened referenced papers to conclude about inclusion or rejection in the database. Finally, 78 relevant papers constituted the database for answering RQs and to conclude about the role of ML techniques for PdM. The references paper are available in the Table A1.
- RQ1.
- How many articles cover the use of machine learning for predictive maintenance in smart manufacturing?
An upward trend was observed in publications between 2013 and 2018 (Figure 6). A quite stable trend was revealed in the published literature about ML for PdM before 2016. Since 2017, an increase in interest in research about the topic was apparent with a fivefold increase noted in 2017, and ever-increasing output continuing in 2018 and early months of 2019.
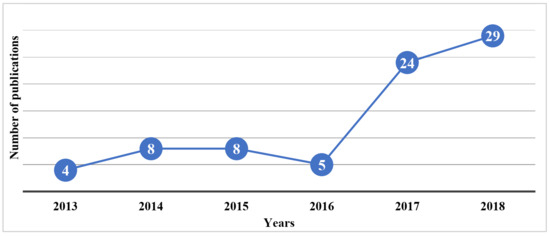
Figure 6.
Publications over the years.
Figure 7 further analysed this trend by differentiating between ML and DL terms. Papers were highlighted by focusing on the DL approach or those applying DL methods. The growth in publications was especially registered in the last two years, after a downfall in 2016, and in 2017–2018 their number was exactly one-third of the total.
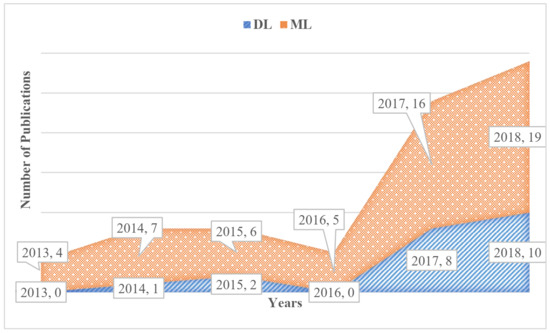
Figure 7.
Trend in deep learning publications.
An interesting result relates to the provenance map of publication (from the first author location) as displayed in Figure 8. The highest number of publications about ML for PdM was from USA, with 21 papers, then China with 13 papers, Italy 8, Germany 7, India 6, Sweden and Spain 4, and U.K. 3. A single paper was published from each of Turkey, Ireland, Australia, Taiwan, Korea, Kazakhstan, Switzerland, Bulgaria, Brazil, Israel, Greece, Japan, Mexico, Norwegian, Serbia, Thailand, and Austria.
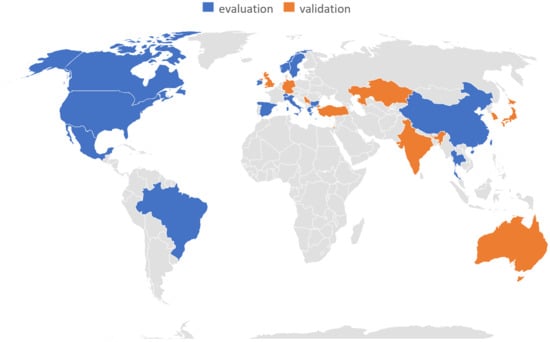
Figure 8.
Geographical provenance of publications—evaluation and validation as per main analysis.
- RQ2.
- What type of research is being conducted in this area of ML techniques per PdM in SM?
Figure 9 reports on the type of research. There is a perfect sub-division of the analysed papers between evaluation-based proposal and validation reports. Evaluation is mainly based on an advanced research approach that is trying to explore consequences, benefits, and drawbacks within the industrial case test. The 39 validation reports provided, generally, conceptual analysis and solutions over a simulation test mainly based on open source data sets.
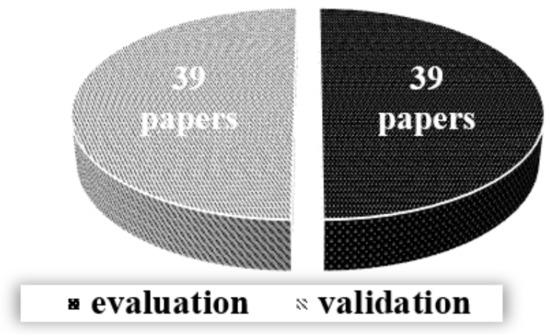
Figure 9.
Presence of research types.
Figure 10 displays the distribution of the type of research. In 2015, 2016, and 2017 there was a prevalence of validation-based studies. In 2018 a significant rise in evaluation proposal was reported as consequence of the presence real industrial applications.
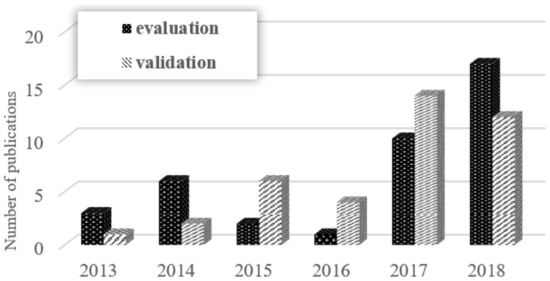
Figure 10.
Popularity of research types by year (stable reports until early 2019).
- RQ3.
- What type of contributions are resulting from publications?
The type of contribution is reported in Figure 11 over the 78 papers. The contributions to the field mainly consisted of models. Many proposed ML algorithms to predict equipment reliability or failure. The majority of ML-based publications were of methodology proposal for diagnostic, anomaly detection, and prediction [83]. Twelve publications reported about conceptual framework platforms that describe architecture for software implantation [84,85]. Early research efforts focused on tool proposal, and just one publication was in the area of process mapping. All proposals started by analysing the production process to discover correlations between sensor data from equipment. Data were collected and generally stored in a local cloud [86]. The learning part of the PdM technique was implemented for system’s monitoring, prediction of quality in products, and scheduling decisions for flexible maintenance of equipment.
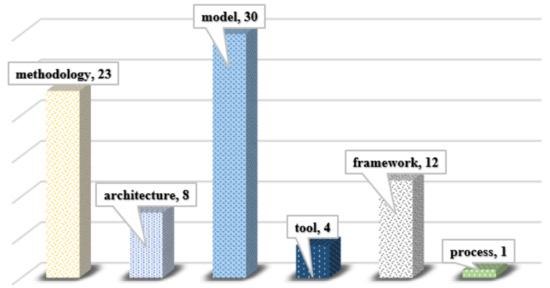
Figure 11.
Comparison of contribution type.
Figure 12 illustrates the distribution of publications. A growing interest manifested in the last 2 years in which the publication of at least one paper for each category was evident.
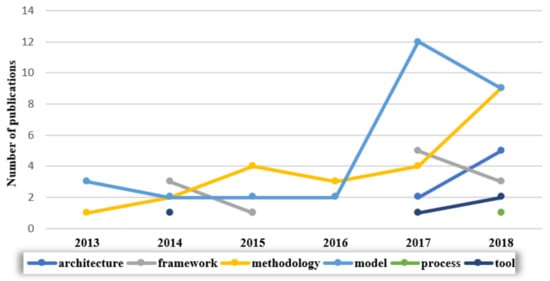
Figure 12.
Trend in publication by contribution type.
- RQ4.
- Whatclass of equipment is a candidate to be mapped for smart manufacturing and what is the relation between equipment and type of data under investigation?
Seventy of 78 papers reported about using PdM while applying ML. This included both validations (with simulations on open source test data set) and evaluations (with proposed real industrial applications). Figure 13 reports about the type of equipment and process where successful learning efforts were registered. Manufacturing machinery was the most prominent area of manufacturing for this ML application, followed by motor and rotary machines. The most relevant sector making use of ML was semiconductor manufacturing.
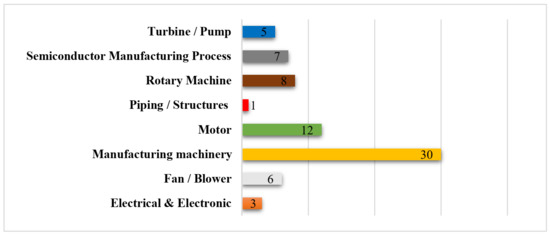
Figure 13.
Number of publications for each case study.
Forty-two papers presented, in case study, solutions for prediction of equipment degradation. They all specified the type of source data monitored (Figure 14). Vibration analysis was the most used type of data for machine learning. Acoustic signals were also commonly combined in data with force, torque, and speed values [87,88]. Dimensional data and surface roughness, energy consumption, voltage, and current measurement were monitored for manufacturing machinery components [89]. Few papers reported on the use of thermal data or digital images and magnetic emissions.
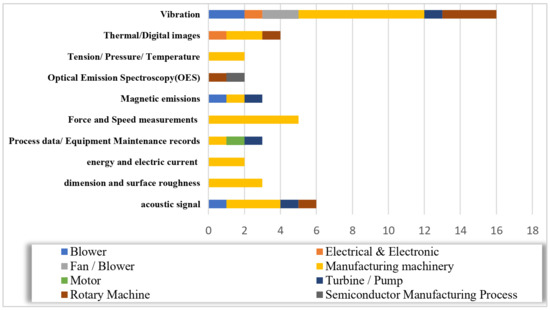
Figure 14.
Comparison of investigated equipment and type of monitored data.
- RQ5.
- What machine learning strategy is the most frequently applied for predictive maintenance and for which tasks is it setting?
Figure 15 reports on the type of ML algorithm most prevalent within the literature in the database. Supervised learning was the most common (53%) type of algorithm as reported by the literature. Eighteen percent of the literature reported ensemble methods; 11% in the class of unsupervised as well as inductive approach; 3% of application reported about a semi supervised implementation; 2% were the implementation of reinforcement and instance-based techniques.
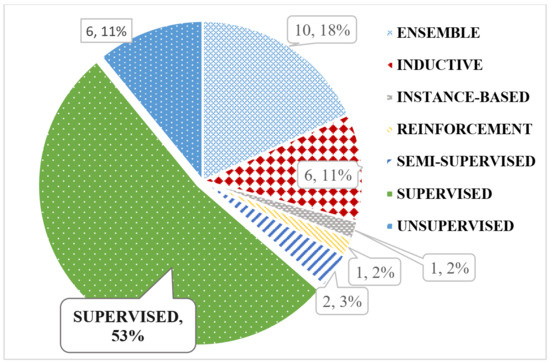
Figure 15.
Popularity of machine learning approach types.
Fifty-five of the 78 papers compared different ML approaches in order to demonstrate the superiority of the method put forward. Figure 16 shows the comparison of different machine learning approaches and tasks.
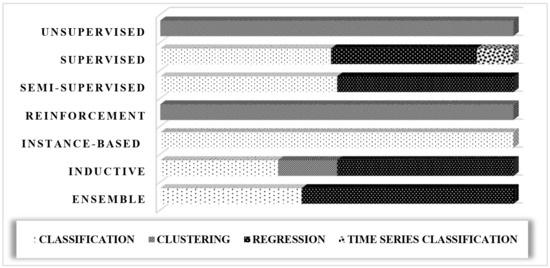
Figure 16.
Comparison of different machine learning approaches and tasks.
The supervised approach reported successful implementation for classification of rough data, time series classification [90], and regression components [91]. The semi-supervised and ensemble approaches can be used for both classification and regression, while the reinforced approach is only used for clustering [92]. Instance-based approach reported successful application in classification. Inductive learning approaches was the only one that manifested consistent application for classification, regression, and clustering.
The relation between application area for prediction and the type of learning approach is reported in Figure 17. In dealing with fault prediction for electrical and electronic components, semiconductor manufacturing process equipment, rotary machines, and piping structures, the use of supervised learning is put forward. Manufacturing machinery components can be investigated using different learning modes. In this case, the supervised approach was widely applied with no evidence of semi-supervised proposals. Analysing motor components, turbines, and pumps, there was generally the possibility to use different types of learning approaches. Motors make use of unsupervised, semi-supervised, and supervised (major evidence) learning. Turbines make use of supervised, unsupervised, and inductive approaches. Fans and blowers applied unsupervised and supervised learning strategies.
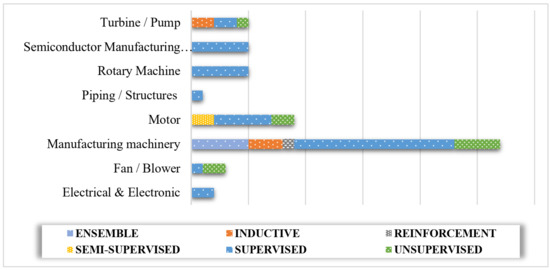
Figure 17.
Types of machine learning approaches used for each type of investigated equipment.
- RQ6.
- Which machine learning strategy is the most frequently applied for predictive maintenance and for which tasks is it setting?
Eighty-two machine learning methods were selected for analysis. Several papers reported successful implementation of algorithms matched with ensemble approaches. This is reported in tests as the best solution for prediction in specific problems. Figure 18 displays how the popularity of ML for PDM in SM was gaining a rising trend over the analysis period.
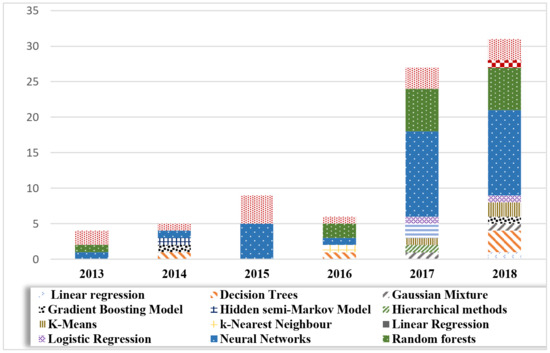
Figure 18.
Popularity of machine learning methods by year.
At least one successful ML application was published each year for support vector machine algorithms and neural networks. These two approaches were the only ones reported in 2015. In 2014 and 2016 few applications, characterized by different methods, were presented. The growing interest in ML resulted (see data for 2017 and 2018) in a diversification of methods, with multi-methods composition not evident. Notwithstanding, NNs remained the most prominent sources of learning methods. Thirty-three algorithms of 82 proposed neural network implantations, 15 for random forests algorithms, and 14 for SVM, with 75% of publications based on these methods alone. Figure 19 displays the percentage of learning methods over the case history. A relevant portion was assigned to decision trees, linear regression, and k-Means methods.
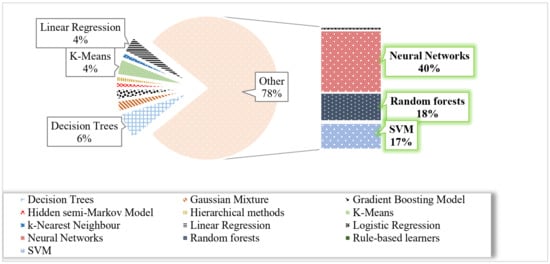
Figure 19.
Percentages for each class of learning methods.
Forty percent of publications (36 different papers) reported about NNS. The most significant contribution was from DL algorithms (highlighted with green clouds in Figure 20). DL for ML constituted 67% (24 proposed methods) of all NNs case test. With 22%, long short-term memory covered the prominent class of NNs methods. There was a 19% usage of deep neural network and an 11% of convolutional neural network. Artificial neural networks and Bayesian neural networks were implemented in 8% of publications.
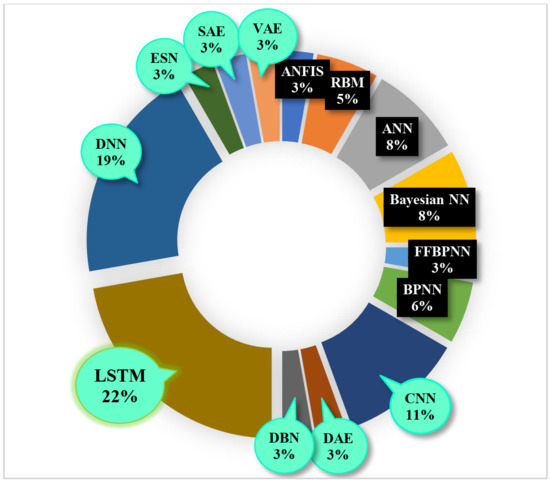
Figure 20.
Popularity of neural network algorithms.
Figure 21 reports about the machine learning methods utilized for each type of investigated equipment. While analysing piping equipment, there was just one proposal covering the application of liner regression [93]. Electrical and electronic equipment reported three successful applications of linear regression and neural network algorithms. Data from fan and blower, motor, and semiconductor manufacturing processes are studied through SVMs, random forests, and neural networks. Turbines and pumps reported a proposal for k-nearest neighbour and rule-based learners. Manufacturing machinery, as asserted before, can generally report varying data sources, and the most disparate methods for learning.
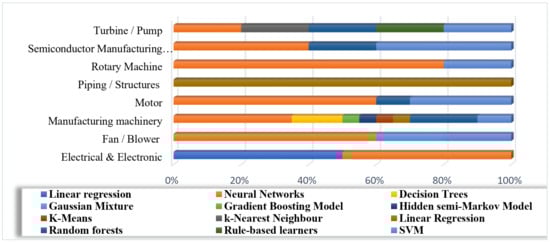
Figure 21.
Relation between machine learning methods and type of investigated equipment.
5. Discussion
RQ1.
RQ1 wants to assess the level of interest in machine learning techniques for predictive maintenance. At present, thanks to technological innovation, ML4PdM reported an exponential growth in publications over the last 5 years. The years 2007–2016 registered the following: the economic collapse of the oil market for Japan and Russia; Italy struggled with problems with banks and internal debt; an economic crisis affected Spain; Australia and U.K. manufacturing sectors declined; and in 2015–2016 China’s stock market crashed. It included the market turbulence, which culminated in the devaluation of the yuan, slowing growth in the GDP of China, a fall in petroleum prices. Moreover, Greece was faced with the default in June 2015; October 2014 registered the effects of the end of quantitative easing in the United States and a sharp rise in bond yields in early 2016. Finally, in June 2016, there was the United Kingdom European Union membership referendum, in which Brexit was voted upon. Dangerous trends that have manifested themselves in the world economy include falling prices of raw materials, double-digit competitive devaluations in emerging countries, and consequent massive flight of capital [94]. These economic collapses confirmed by the interest in restructuring the cost components while using artificial intelligence (AI), big data, and analytic in deep learning (40% of the analysed publications) arrangement for predictive and self-teaching systems.
It was also observed that the USA and China are showing leadership in publications. The potential reason for this could be the policy initiatives in these countries, i.e., Smart Manufacturing Leadership Coalition (SMLC) and China 2025.
SMLC is a national non-profit focused on transforming U.S. manufacturing through democratizing access to real-time data. SMLC is proposing a U.S. Public–Private Partnership Program and “Framework for Revitalizing American Manufacturing”. That provides a comprehensive approach to transform manufacturing plants, their supply chains including of education and knowledge, transportation, and stable capital markets. More in detail, SMLC is developing the nation’s first open platform and marketplace for real-time data analytics and industrial competition for manufacturing. This infrastructure will enable manufacturers to access real-time data for strategic decisions. The architecture is not an Internet of Things, but an Internet of Manufacturing that allows solutions to be connected and applied through an open framework. On the other side, “CHINA 2025” is the oriental response to the European “Industry 4.0”. It is the attempt to promote manufacturing innovation in China. The seven-step program of “CHINA 2025” focuses on artificial intelligence, biotechnology, and robotics. Its “Made in China 2025” strategy aims at mastering design, software, and production, building the right pool of talent. It targets a combination of high-tech sectors and infrastructure. It focuses on building powerful and competitive industries, building stable legal and economic institutions, maintaining a sustainable macro environment, establishing the right partnership, and division of responsibilities between private and public sectors.
RQ2.
RQ2 arose from the need to assess the maturity level of ML4PdM. The prevalence of validation research approach, based on theoretical models, with no details in test beds and implementation, would have been synonymous with immature research area. This would be one which requires the development of theory to support forthcoming applications. On the contrary, most of the studies reviewed related to real industry test beds. This is indicative of a research area at an already promising level. The perfect division of the 78 papers into two types of research in association with the exponential growth in the topic of research revealed the importance of the area, but it is still not mature, due to the still high proportion of validation output.
RQ3.
This question arose with the purpose of understanding the approaches used to find solutions in predictive maintenance for manufacturing equipment thanks to the advancing machine learning techniques. More low-level approaches, framework, architectures, and especially mathematical models and methodology are proposed in the reviewed literature. This is a signal of early research efforts in the area; however, some toolboxes [95] for the implementation of data-driven approaches in various manufacturing settings are developing, as a signal of growing interest in applicable solutions [96]. In particular, Susto et al., 2014 [97], proposes a PdM tool that allows a flexible maintenance scheduling decision support system. It employs machine learning and regularized regression methods, by iteratively exploiting the new information as it becomes available from newly processed components to refine remaining useful life estimates and associated costs and risks [98,99]. Another example could be the industrial partner ProphecySensorlytics that deployed an Android mobile app, called OnSpot, based on SpotCheck, a prototype system that uses well-regularized deep neural networks to analyze sound, vibrational, and magnetic emissions of industrial machinery to provide non-invasive machine diagnostics, both for fault detection and to meter the day-to-day mode of operation of the machinery [100,101].
RQ4.
Failure of manufacturing equipment due to performance degradation of certain components can be evaluated, and their degradation can be predicted through early condition monitoring and data analysis. This can be achieved through data acquisition from sensors, which have become smarter, smaller, easier to implement in existing systems, and cheaper and more reliable [102]. A sensor converts physical values into electrical values (voltage, current or resistance). Usually, one sensor measures one mechanical value, for example, the mechanical values of acceleration, pressure, flow, torque, and force [103]. With this mechanical value, one can interpret the vibration data, acoustic data, temperature [104], humidity, weather, altitude, etc., and show a summary of the components and the mechanical values acquired [34]. Therefore, this question aimed to discover the most researched applications in smart manufacturing for predictive maintenance and the most monitored type of sensor data utilized. With 30 papers, the results highlight manufacturing machinery as the most discussed topic in publications, particularly in relation to the availability of vibration signal monitoring. In fact, manufacturing machinery is the heart of a smart manufacturing with the aim being to prevent failures before they occur, thus avoiding loss of production, quality, downtime and cost; it was also the most comprehensive topic individuated in the study. When mechanical equipment sets fail, the vibration phenomenon is obvious and universal. The equipment produces vibration as long as it is running, and any change in each part will have an impact on the vibration signal. Vibration signal contains the most abundant information, and the measurement is more convenient. Vibration signal is the result of the interaction of various factors with irregular characteristics, such as chaos, typing, nonlinear, and data are multi-scale [38].
RQ5.
This question arose from the interest in highlighting the most relevant machine learning approaches used for predictive maintenance and linking each of them with the tasks for which they are employed. The analysis evoked by the output charts highlights supervised learning, applied for classification, as the most commonly used approach for prediction through machine learning techniques.
The supervised models can be used to find insights from the data, and the subsequent use of prognostics [105] and forecasting [106] will make sure that the production process runs efficiently with minimal costs incurred for maintenance and reduce product quality degradation [107].
Supervised Learning is a machine learning paradigm for acquiring the input/output relationship information of a system based on a given set of paired input/output training samples. As the output is regarded as the label of the input data or the supervision, an input/output training sample is also called labelled training data, or supervised data. As commented from an interview with Geoffrey Hinton, almost all the economic value created by neural networks has been through supervised learning, while unsupervised learning is going to be absolutely crucial. What has worked over the last ten years or so is also supervised learning.
Moreover, the predictive maintenance problem through supervised learning methods can be formulated in two ways. The first is to formulate the PdM as classification problems to determine the probability of a part failing before n numbers of wafers (for example) are processed. The second is to formulate it as regression problem where one would predict the time remaining until the next failure is expected to occur. The most used is evident to be classification, especially for manufacturing machinery [108].
RQ6.
This question aimed to classify the different types of best-performing machine learning methods in terms of: prediction accuracy; precision; recall; minimum variance and root-mean-squared and mean absolute error. They aim to be used in evaluation and validation studies for prediction of different smart manufacturing equipment degradation. The resulting charts show neural network methods as the leader, followed by random forests and SVMs. All of these show a growing trend in the last 5 years and significant successful applications in manufacturing. Deep neural networks were pointed out as more relevant application methods, highlighting LSTM as the most promising algorithm used for predictive maintenance applications in smart manufacturing.
However, the popularity of neural networks has to face the need of large volumes of training data, and this has limited their use for industrial applications where representative, labelled data might be difficult or costly to acquire. The deep learning based methods were at the forefront, bringing greatly improved analysis and recognition abilities but, at the same time, slowing down the running speed, as these methods require a lot of computation [109]. With the rapid development of smart industry, people invest their maximum effort on reducing manpower by deploying vision sensors in each manufacturing line and empowering them with the ability of autonomous defect detection, which results in a hugely increased data size [110]. Moreover, the improved methods of regularization allow deeper neural networks also to potentially be trained with smaller amounts of labelled data, bringing industrial applications within reach. The two most important aspects of modern neural networks are regularization and data abstraction [40].
Therefore, it is also important to underline that in machine learning, there is something called the “No Free Lunch” theorem. It states that no one algorithm works best for every problem, and it is especially relevant for supervised learning (i.e., predictive modelling) [111]. There are many factors at play, such as the size, quality, and nature of data; the available computational time; the urgency of the task; and what you want to do with the data [112]. As a result, many different algorithms should be tailored for each problem, while using a hold-out “test set” of data to evaluate performance and select the winner. Of course, the algorithms tried must be appropriate for the selected problem, which is where picking the right machine learning task comes in.
Mitigation of Threats to Validity
The process of systematic mapping is not infallible, and there are indeed a number of threats to the validity of this study. Possible threats for validity are, for example, publication bias, as negative or new and controversial views may not be published (theoretical validity); poorly designed data extraction forms and recording of data (descriptive validity); potential researcher bias in the selection of studies and reporting of the data (theoretical validity); the quality of the sample of studies obtained with respect to the targeted population (theoretical validity); generalizability of the results of the mapping, which includes within the population (internal generalizability) and between different populations (external generalizability); the reliability of the conclusions drawn in relation to the data collected, e.g., due to a possible bias of the researchers in the interpretation of that data [9]. To this end, every effort was made to mitigate potential risks throughout the process. The study was prone to threats in all stages, prevention of which are described below.
The choices relating to the search criteria were driven by the agreed scope of the research, the research questions that needed to be answered, the PICO criteria, as well as the relevance of papers returned from testing various search combinations. However, there could be the risk that these have restricted the discovery of papers that did not meet the search criteria. Although based on the sophistication of the search facilities in modern digital databases and the competence and experience of researchers in the field with which we were confronted, we could suggest that the risk of omitting relevant papers was at least minimised. Digital databases were selected using prior knowledge relating to engineering and technology research, as well as noting prominent databases used in closely related fields; even if not all digital repositories were included in the study, snowballing was conducted, and there is also a realistic chance that different types of digital repositories would have provided a level of redundancy. While other databases enabled the construction of searches to interrogate titles, abstracts, and keywords using Boolean logic (as concerned Google Scholar), specifying an appropriate search string was necessary, limiting the search to titles that including the following combinations of keywords: “Smart” AND “Machine Learning” AND “Predictive”.
This has returned a manageable number of publications. The criteria defined for inclusion and exclusion in this study were deemed to be aligned with the scope of the study. The main search terms chosen were restricted to the area of interest, but many synonymous terms were considered acceptable. Irrelevant papers were scanned thoroughly before rejecting them. To avoid uncertainty or rejection of relevant papers by only scanning ambiguous abstracts and conclusions, papers were read fully and checked twice to ensure reliability. While scanning papers, extracting incomplete information was prevented by simultaneously building a detailed schematic structure in Excel, related to the research questions, of each paper. The results of the classification process and conclusions included research efforts focusing on systematic mapping. The research presented in this paper provided a broad first review of research relating to the advanced use in smart manufacturing of machine learning techniques for predictive maintenance. This study aims to promote a better understanding of a new and pervasive area that brings many benefits to the industrial environment. In particular, several fundamental research questions that are relevant to current efforts were answered, while also providing a platform for further research and investigation in this field. For any empirical study the discussion of validity threats is of importance and is a quality criterion for study selection.
6. Conclusions
This study sought to highlight the amount of interest, the current maturity level, pertinent trends in the literature, and the research focus shown in a new and pervasive research area, as the application of the advanced techniques of machine learning for predictive maintenance in smart manufacturing. In particular, the study presented some machine learning techniques for predictive maintenance to highlight the advantages of their application to improve situational intelligence, performance, and reliability in smart manufacturing. The research questions led the adopted systematic mapping process, which would help other researchers in the field to analyze research directions and identify interesting needs and perspectives in the field, by gathering high-level knowledge from 78 publications, deemed relevant for the study, according to inclusion/exclusion criteria. A mapping study provides an approach that facilitates an investigation of great breadth, while sacrificing depth, and is a formal and well-structured approach to synthesising material.
In the state-of-the-art analysis there is, generally, unclear use of machine learning terms. As appears frequently in conference proposals, authors generally refer to the artificial intelligence approach as a machine learning identification, or they generally call the method (neural networks) to describe the learning procedure. There is wide access to statistical (pre-filtering) methodology in order to extract learning performances. The main limitation in this case is data access. Exploration is (we can firmly affirm) greatly lacking on machine learning for predictive maintenance. The available online databases are frequently used for testing. Sometimes, the digital twin module—mainly in the manufacturing process perspective—acts as feeding element (generating a back control loop). The industrial evolution (mainly in the semiconductor industry) and IoT fast growth is here supporting PdM with integrating (testing) solutions. In this case, cost and integration (whenever not designed a priori) are the main issues.
Considering the social relevance of sustainable manufacturing, the impact of maintenance processes and performances on sustainability (with its economic and environmental dimension) emerges as a key strategy for business dimensions. Sustaining equipment during the operations, while supporting process and reducing the industrial impact on economy and society (may be using cyber-physical entities on twin sets), requires intelligent use of the learning machines. An upward trend was pointed out in publications for smart manufacturing of PdM; in particular, in the last two years a fivefold growth in publications was recorded after a trough in 2016. Forty percent of research evidenced a study related to deep learning methods; these are considered an innovative trend in machine learning in the last years. USA and China led the publication provenance of the selected papers, probably due to the policy lead initiatives in these countries. It was also observed that an equal number of evaluation and validation studies were available in this area, this being a symptom of a research area not yet mature but in rapid growth. In addition, the majority of models and methodologies as contribution types was highlighted, but in 2017–2018 the superiority in publications of tools revealed a growing interest in applications. This mapping study was conducted also to review the progress in this field, through the identification of a research set, from the relevant papers for the study, both including publications that have presented an implementation of a proposed solution tested on an open source simulated data set or an evaluation of it in a real industrial case study. As result of this study, existing classes of machine learning approaches and methods were identified and characterized in relation to the investigated equipment and the related monitored data. It was also evident that more interest in manufacturing machinery monitoring was occurring through vibration signals, the most used data set for all types of equipment analysed; furthermore, the most used approach was supervised learning, and ensemble learning is gaining importance. Neural network, followed by random forest and support vector machine, was identified as the most applied method, which addressed 40% of the publications, of which 67% related to deep neural network with long short-term memory as the winner. However, as it was discussed, there could be no one algorithm that works best for every problem.
One major note is this proposal does not include recent (last two year) data as they are moving quickly toward a huge set that requires different and detailed investigations. It is our intent to discuss in the future those using the digital twin basis of analysis.
Author Contributions
Conceptualization, F.F. and K.B.; Methodology, F.F., A.L. and K.B., analysis and writing original draft, M.N.; implementation, M.N., F.F. and K.B.; validation and reporting, M.N., A.L., F.F., K.B.; funding acquisition, F.F. All authors have read and agreed to the published version of the manuscript.
Funding
The state of art analysis in this paper is part of the activities carried out in the context of the PROMPT Project (Decision Support Platform for Process and Product Maintenance) funded by Italian Ministry of Education, Universities and Research MIUR (PON 2014-2020-ARS01_01046).
Data Availability Statement
Data sharing not applicable. No new data were created or analyzed in this study.
Conflicts of Interest
The authors declare no conflict of interest.
Appendix A
In this section we included the referenced papers with characterization of type of research and type of contribution as per the elaborated tables. We remarked that these data ended at 2018, while we included proposals sent before 2018 but were accepted in early 2019.
Table A1.
Table of referenced papers clusterized per year (basing on principal author geographical provenience), Type of research and Type of contribution.
Table A1.
Table of referenced papers clusterized per year (basing on principal author geographical provenience), Type of research and Type of contribution.
| Year of Publication | Geographical Provenience | Type of Research | Type of Contribution | |
|---|---|---|---|---|
| [Koprinkova-Hristova] | 2013 | Bulgaria | evaluation | methodology |
| [Liu et al.] | 2013 | China | evaluation | model |
| [Schopka et al.] | 2013 | Germany | validation | model |
| [Susto et al.] | 2013 | Ireland | evaluation | model |
| [Wang et al.] | 2014 | China | validation | methodology |
| [Susto et al.] | 2014 | Taiwan | evaluation | tool |
| [de Souza et al.] | 2014 | Brazil | evaluation | methodology |
| [Li et al.] | 2014 | China | validation | model |
| [Kejela et al.] | 2014 | Norway | evaluation | model |
| [Lee, Kao et al.] | 2014 | United States | evaluation | framework |
| [Kroll et al.] | 2014 | Germany | evaluation | framework |
| [Lechevalier et al.] | 2014 | United States | evaluation | framework |
| [Cheng et al.] | 2015 | United States | validation | framework |
| [Munirathinam] | 2015 | India | validation | methodology |
| [Susto, Schirru et al.] | 2015 | Italy | evaluation | methodology |
| [Zhao et al.] | 2015 | China | validation | model |
| [Jahnke] | 2015 | Germany | validation | model |
| [Bluvband et al.] | 2015 | Israel | validation | methodology |
| [Sayed et al.] | 2015 | United Kingdom | validation | architecture |
| [Martín-díaz et al.] | 2015 | Spain | evaluation | methodology |
| [Wu et al.] | 2016 | United States | validation | model |
| [Jennings et al.] | 2016 | United States | validation | methodology |
| [Durbhaka and Selvaraj] | 2016 | India | validation | model |
| [Liao et al.] | 2016 | United States | validation | methodology |
| [Bosse] | 2016 | Germany | evaluation | methodology |
| [Mathew et al.] | 2017 | India | validation | model |
| [Aydin and Guldamlasioglu] | 2017 | Turkey | validation | model |
| [Diaz-Rozo et al.] | 2017 | United States | validation | architecture |
| [Luo et al.] | 2017 | China | evaluation | framework |
| [Siryani et al.] | 2017 | United States | validation | framework |
| [Jiang et al.] | 2017 | Australia | validation | framework |
| [Cline et al.] | 2017 | United States | evaluation | model |
| [Shi et al.] | 2017 | Canada | evaluation | model |
| [DiBiano and Mukhopadhyay] | 2017 | United States | evaluation | tool |
| [Ameeth and Aditya] | 2017 | India | evaluation | model |
| [Li et al.] | 2017 | Japan | validation | model |
| [Wu et al.] | 2017 | United States | validation | methodology |
| [Jinsong et al.] | 2017 | China | evaluation | model |
| [Satta et al.] | 2017 | Italy | validation | framework |
| [Guo et al.] | 2017 | China | evaluation | architecture |
| [Dong and Zhou] | 2017 | United States | validation | framework |
| [Uhlmann et al.] | 2017 | Italy | validation | model |
| [Costello et al.] | 2017 | United Kingdom | evaluation | model |
| [Alsina et al.] | 2017 | Italy | evaluation | model |
| [Irfan et al.] | 2017 | China | evaluation | methodology |
| [Canizo et al.] | 2017 | Spain | validation | methodology |
| [Mathew, Luo et al.] | 2017 | China | validation | model |
| [Li] | 2017 | China | validation | methodology |
| [Ahmad et al.] | 2017 | United States | validation | model |
| [Butte et al.] | 2018 | India | evaluation | model |
| [Zhang et al. (a)] | 2018 | China | evaluation | methodology |
| [Amrunthnah and Gupta] | 2018 | United States | evaluation | methodology |
| [Lærum] | 2018 | Norway | validation | tool |
| [Cho et al.] | 2018 | Switzerland | evaluation | architecture |
| [Ahmad et al.] | 2018 | South Korea | validation | model |
| [Abdurrahman and ElifNurdan] | 2018 | Turkey | evaluation | architecture |
| [Amruthnath and Gupta (b)] | 2018 | United States | validation | methodology |
| [Ye] | 2018 | United Kingdom | validation | model |
| [Vasilić et al.] | 2018 | Serbia | validation | methodology |
| [Oh et al.] | 2018 | Thailand | evaluation | framework |
| [Sezer et al.] | 2018 | Mexico | evaluation | process |
| [Susto et al.] | 2018 | Italy | evaluation | methodology |
| [Ren et al.] | 2018 | China | validation | framework |
| [Zhang et al. (b)] | 2018 | United States | evaluation | methodology |
| [Hundman et al.] | 2018 | United States | evaluation | methodology |
| [Kumar et al.] | 2018 | United States | validation | framework |
| [Kolokas et al.] | 2018 | Greece | evaluation | methodology |
| [Paolant et al.] | 2018 | Sweden | evaluation | architecture |
| [Lejon et al.] | 2018 | Sweden | evaluation | methodology |
| [Amihai et al.] | 2018 | Germany | validation | model |
| [Lindström] | 2018 | Sweden | evaluation | model |
| [Kulkarni et al.] | 2018 | United States | validation | model |
| [Nalbach et al.] | 2018 | Germany | evaluation | architecture |
| [Techane et al.] | 2018 | Taiwan | validation | model |
| [Flath and Stein] | 2018 | Germany | evaluation | tool |
| [Gandhi et al.] | 2018 | Sweden | evaluation | architecture |
| [Bagheri et al.] | 2018 | Kazakhstan | validation | model |
| [Kohli] | 2018 | United States | validation | model |
References
- Groumpos, P.P. Deep Learning vs. Wise Learning: A Critical and Challenging Overview. IFAC-Pap. 2016, 49, 180–189. [Google Scholar] [CrossRef]
- Goodfellow, I.; Bengio, Y.; Courville, A. Deep Learning; MIT Press: Cambridge, MA, USA, 2016. [Google Scholar]
- Gandhi, K.; Schmidt, B.; Ng, A.H.C. Towards data mining based decision support in manufacturing maintenance. Procedia Cirp 2018, 72, 261–265. [Google Scholar] [CrossRef]
- Lee, J.; Davari, H.; Singh, J.; Pandhare, V. Industrial Artificial Intelligence for Industry 4.0-Based Manufacturing Systems. Manuf. Lett. 2018, 18, 20–23. [Google Scholar] [CrossRef]
- Sharp, M.; Ak, R.; Hedberg, T. A survey of the advancing use and development of machine learning in smart manufacturing. J. Manuf. Syst. 2018, 48, 170–179. [Google Scholar] [CrossRef] [PubMed]
- Alsina, E.F.; Chica, M.; Trawiński, K.; Regattieri, A. On the use of machine learning methods to predict component reliability from data-driven industrial case studies. Int. J. Adv. Manuf. Technol. 2018, 94, 2419–2433. [Google Scholar] [CrossRef]
- Franciosi, C.; Di Pasquale, V.; Iannone, R.; Miranda, S. Multi-stakeholder perspectives on indicators for sustainable maintenance performance in production contexts: An exploratory study. J. Qual. Maint. Eng. 2020. [Google Scholar] [CrossRef]
- Duran, O.; Duran, P.A. Prioritization of physical assets for maintenance and production sustainability. Sustainability 2019, 11, 4296. [Google Scholar] [CrossRef]
- Franciosi, C.; Iung, B.; Miranda, S.; Riemma, S. Maintenance for sustainability in the industry 4.0 context: A scoping literature review. IFAC PapersOnLine 2018, 51, 903–908. [Google Scholar] [CrossRef]
- Nalbach, O.; Linn, C.; Derouet, M.; Werth, D. Predictive Quality: Towards a New Understanding of Quality Assurance Using Machine Learning Tools. In Business Information Systems; Abramowicz, W., Paschke, A., Eds.; Springer: Cham, Switzerland, 2018; Volume 320. [Google Scholar]
- Wang, J.; Ma, Y.; Zhang, L.; Gao, R.X.; Wu, D. Deep learning for smart manufacturing: Methods and applications. J. Manuf. Syst. 2018, 48, 144–156. [Google Scholar] [CrossRef]
- Zheng, H.W. A new intelligent fault identification method based on transfer locality preserving projection for actual diagnosis scenario of rotating machinery. Mech. Syst. Signal Process. 2020, 135, 106344. [Google Scholar] [CrossRef]
- Cho, S.; May, G.; Tourkogiorgis, I.; Perez, R.; Lazaro, O.; de la Maza, B. A hybrid machine learning approach for predictive maintenance in smart factories of the future. IFIP Adv. Inf. Commun. Technol. 2018, 536, 311–317. [Google Scholar]
- Putnik, G. Scalability in manufacturing systems design and operation: State-of-the-art and future developments roadmap. CIRP Ann. Manuf. Technol. 2013, 62, 751–774. [Google Scholar] [CrossRef]
- Lee, Y.T.; Kumaraguru, S.; Jain, S.; Robinson, S.; Helu, M.; Hatim, Q.Y. A classification scheme for smart manufacturing systems’ performance metrics. Smart Sustain. Manuf. Syst. 2017, 1, 52. [Google Scholar] [CrossRef] [PubMed]
- Susto, G.A.; Schirru, A.; Pampuri, S.; McLoone, S.; Beghi, A. Machine learning for predictive maintenance: A multiple classifier approach. IEEE Trans. Ind. Inform. 2015, 11, 812–820. [Google Scholar]
- Lee, J.; Kao, H.A.; Yang, S. Service innovation and smart analytics for Industry 4.0 and big data environment. Procedia Cirp 2014, 16, 3–8. [Google Scholar] [CrossRef]
- Kumar, A.; Shankar, R.; Thakur, L.S. A big data driven sustainable manufacturing framework for condition-based maintenance prediction. J. Comput. Sci. 2018, 27, 428–439. [Google Scholar] [CrossRef]
- Merkt, O. On the use of predictive models for improving the quality of industrial maintenance: An analytical literature review of maintenance strategies. In Proceedings of the 2019 Federated Conference on Computer Science and Information Systems (FedCSIS), Leipzig, Germany, 1–4 September 2019; pp. 693–704. [Google Scholar]
- Carvalho, T.P.; Soares, F.A.A.M.N.; Vita, R.; da Francisco, P.R.; Basto, J.P.; Alcalá, S.G.S. A systematic literature review of machine learning methods applied to predictive maintenance. Comput. Ind. Eng. 2020, 1, 1–12. [Google Scholar] [CrossRef]
- Sezer, E.; Romero, D.; Guedea, F.; MacChi, M.; Emmanouilidis, C. An industry 4.0-enabled low cost predictive maintenance approach for SMEs: A use case applied to a cnc turning centre. In Proceedings of the 2018 IEEE International Conference on Engineering, Technology and Innovation (ICE/ITMC), Stuttgart, Germany, 17–20 June 2018; pp. 1–8.
- Kohli, M. Using machine learning algorithms on data residing in SAP ERP application to predict equipment failures. Int. J. Eng. Technol. 2018, 7, 312–319. [Google Scholar] [CrossRef]
- Petersen, K.; Feldt, R.; Mujtaba, S.; Mattsson, M. Systematic Mapping Studies in Software Engineering. Pediatr. Neonatol. 2017, 58, 484–489. [Google Scholar]
- Paolanti, M.; Romeo, L.; Felicetti, A.; Mancini, A.; Frontoni, E.; Loncarski, J. Machine Learning approach for Predictive Maintenance in Industry 4.0. In Proceedings of the 2018 14th IEEE/ASME International Conference on Mechatronic and Embedded Systems and Applications (MESA), Oulu, Finland, 2–4 July 2018; pp. 1–6.
- Kiangala, K.S.; Wang, Z. An E_ective Predictive Maintenance Framework for Conveyor Motors Using Dual Time-Series Imaging and Convolutional Neural Network in an Industry 4.0 Environment. IEEE Access 2020, 8, 121033–121049. [Google Scholar] [CrossRef]
- Ruiz-Sarmiento, J.-R.; Monroy, J.; Moreno, F.-A.; Galindo, C.; Bonelo, J.-M.; Gonzalez-Jimenez, J. A predictive model for the maintenance of industrial machinery in the context of industry 4.0. Eng. Appl. Artif. Intell. 2020, 87, 103289. [Google Scholar] [CrossRef]
- Zhang, W.; Yang, D.; Wnag, H. Data-Driven Methods for Predictive Maintenance of Industrial Equipment: A Survey. IEEE Syst. J. 2019, 13, 2213–2227. [Google Scholar] [CrossRef]
- Ta, E.M.; Dionisio, R.P.; Torres, P.M.B. Industrial IoT devices and cyber-physical production systems: Review and use case. Lect. Notes Electr. Eng. 2019, 505, 292–298. [Google Scholar]
- Zonta, T.; da Costa, C.A.; da Rosa Righi, R.; de Lima, M.J.; da Trindade, E.S.; Li, G.P. Predictive maintenance in the Industry 4.0: A systematic literature review. Comput. Ind. Eng. 2020, 150, 106889. [Google Scholar] [CrossRef]
- Dalzochio, J.; Kunst, R.; Pignaton, E.; Binotto, A.; Sanyal, S.; Favilla, J.; Barbosa, J. Machine learning and reasoning for predictive maintenance inIndustry 4.0: Current status and challenges. Comput. Ind. 2020, 123, 103298. [Google Scholar] [CrossRef]
- Olesen, F.; Shaker, H.R. Predictive Maintenance for Pump Systems and Thermal Power Plants: State-of-the-Art Review, Trends and Challenges. Sensors 2020, 20, 2425. [Google Scholar] [CrossRef]
- Factory Integration. International Roadmap for Devices and Systems: 2020. IEEE 2020. Available online: https://irds.ieee.org/images/files/pdf/2020/2020IRDS_BC.pdf (accessed on 2 March 2021).
- Woschank, M.; Rauch, E.; Zsifkovits, H. A Review of Further Directions for Artificial Intelligence, Machine Learning, and Deep Learning in Smart Logistics. Sustainability 2020, 12, 3760. [Google Scholar] [CrossRef]
- Cai, H.; Feng, J.; Zhu, F.; Yang, Q.; Li, X.; Lee, J. Adaptive virtual metrology method based on Just-in-time reference and particle filter for semiconductor manufacturing. Measurement 2021, 168, 108338. [Google Scholar] [CrossRef]
- Siahpour, S.; Li, X.; Lee, Y. Deep learning-based cross-sensor domain adaptation for fault diagnosis of electro-mechanical actuators. Int. J. Dyn. Control 2020, 8, 1054–1062. [Google Scholar] [CrossRef]
- Lee, J.; Azamfar, M.; Singh, J.; Siahpour, S. Integration of digital twin and deep learning in cyber-physical systems: Towards smart manufacturing. IET Collab. Intell. Manuf. 2020, 2, 34–36. [Google Scholar] [CrossRef]
- Zhao, R.; Yan, R.; Chen, Z.; Mao, K.; Wang, P.; Gao, R.X. Deep learning and its applications to machine health monitoring. Mech. Syst. Signal Process. 2019, 115, 213–237. [Google Scholar] [CrossRef]
- Liao, L.; Jin, W.; Pavel, R. Prognosability Regularization for Prognostics and Health. Assessment. 2016, 63, 7076–7083. [Google Scholar]
- Amihai, I.; Pareschi, D.; Gitzel, R. Modeling machine health using gated recurrent units with entity embeddings and k-means clustering. In Proceedings of the 2018 IEEE 16th International Conference on Industrial Informatics (INDIN), Porto, Portugal, 18–20 July 2018; pp. 212–217. [Google Scholar]
- Petersen, K.; Vakkalanka, S.; Kuzniarz, L. Guidelines for conducting systematic mapping studies in software engineering: An update. Inf. Softw. Technol. 2015, 64, 1–18. [Google Scholar] [CrossRef]
- O’Donovan, P.; Leahy, K.; Bruton, K.; O’Sullivan, D.T.J. Big data in manufacturing: A systematic mapping study. J. Big Data 2015, 2, 1–22. [Google Scholar] [CrossRef]
- Prihatini, P.M.; Suryawan, I.K.; Mandia, I.N. Feature extraction for document text using Latent Dirichlet allocation. J. Phys. Conf. Ser. 2018, 953, 012047. [Google Scholar] [CrossRef]
- Bosse, S. Structural Monitoring with Distributed-Regional and Event-based NN-Decision Tree Learning Using Mobile Multi-Agent Systems and Common Java Script Platforms. Procedia Technol. 2016, 26, 499–516. [Google Scholar] [CrossRef][Green Version]
- Lærum, K.H. A study of Machine Learning for Predictive Maintenance Computer Science. 2018. Available online: https://ntnuopen.ntnu.no/ntnu-xmlui/bitstream/handle/11250/2568871/19478_FULLTEXT.pdf?isAllowed=y&sequence=1 (accessed on 2 March 2021).
- Bagheri, M.; Zollanvari, A.; Nezhivenko, S. Transformer Fault Condition Prognosis Using Vibration Signals over Cloud Environment. IEEE Access 2018, 6, 9862–9874. [Google Scholar] [CrossRef]
- Kolokas, N.; Vafeiadis, T.; Ioannidis, D.; Tzovaras, D. Forecasting faults of industrial equipment using machine learning classifiers. In Proceedings of the 2018 Innovations in Intelligent Systems and Applications (INISTA), Thessaloniki, Greece, 3–5 July 2018. [Google Scholar]
- Kulkarni, K.; Devi, U.; Sirighee, A.; Hazra, J.; Rao, P. Predictive Maintenance for Supermarket Refrigeration Systems Using only Case Temperature Data. Proc. Am. Control Conf. 2018, 2018, 4640–4645. [Google Scholar]
- Satta, R.; Cavallari, S.; Pomponi, E.; Grasselli, D.; Picheo, D.; Annis, C. A dissimilarity-based approach to predictive maintenance with application to HVAC systems. arXiv 2017, arXiv:1701.03633. [Google Scholar]
- Susto, G.A.; Terzi, M.; Beghi, A. Anomaly Detection Approaches for Semiconductor Manufacturing. Procedia Manuf. 2017, 11, 2018–2024. [Google Scholar] [CrossRef]
- Ahmad, W.; Khan, S.A.; Kim, J.-M. A hybrid prognostics tech- nique for rolling element bearings using adaptive predictive models. IEEE Trans. Ind. Electron. 2018, 65, 1577–1584. [Google Scholar] [CrossRef]
- Techane, A.W.; Wang, Y.-F.; Weldegiorgis, B.H. Rotating Machinery Prognostics and Application of Machine Learning Algorithms: Use of Deep Learning with Similarity Index Measure for Health Status Prediction. In Proceedings of the Annual Conference of the Prognostics and Health Management Society, Philadelphia, PA, USA, 24 September 2018. [Google Scholar]
- Canizo, M.; Onieva, E.; Conde, A.; Charramendieta, S.; Trujillo, S. Real-time predictive maintenance for wind turbines using Big Data frameworks. In Proceedings of the 2017 IEEE International Conference on Prognostics and Health Management (ICPHM), Dallas, TX, USA, 19–21 June 2017; pp. 70–77. [Google Scholar]
- Martín-Díaz, I.; Duque-Perez, O.; Romero-Troncoso, R.; Morinigo-Sotelo, D. Supervised Diagnosis of Induction Motor Faults: A Proposed Methodology for an Improved Performance Evaluation. In Proceedings of the 2015 IEEE 10th International Symposium on Diagnostics for Electrical Machines, Power Electronics and Drives (SDEMPED), Guarda, Portugal, 1–4 September 2015; pp. 359–365. [Google Scholar]
- Durbhaka, G.K.; Selvaraj, B. Predictive maintenance for wind turbine diagnostics using vibration signal analysis based on collaborative recommendation approach. In Proceedings of the 2016 International Conference on Advances in Computing, Communications and Informatics (ICACCI), Jaipur, India, 1–24 September 2016; pp. 1839–1842. [Google Scholar]
- Aydin, O.; Guldamlasioglu, S. Using LSTM networks to predict engine condition on large scale data processing framework. In Proceedings of the 2017 4th International Conference on Electrical and Electronic Engineering (ICEEE), Ankara, Turkey, 8–10 April 2017; pp. 281–285. [Google Scholar]
- Chen, Y.E. A System Approach to Implementation of Predictive Maintenance with Machine Learning. Massachusetts Institute of Technology. Ph.D. Thesis, Massachusetts Institute of Technology, Cambridge, MA, USA, 2018. [Google Scholar]
- Zhang, J.; Wang, P.; Yan, R.; Gao, R.X. Deep Learning for Improved System Remaining Life Prediction. Procedia Cirp 2018, 72, 1033–1038. [Google Scholar] [CrossRef]
- Ahmad, S.; Lavin, A.; Purdy, S.; Agha, Z. Unsupervised real-time anomaly detection for streaming data. Neurocomputing 2017, 262, 134–147. [Google Scholar] [CrossRef]
- Amruthnath, N.; Gupta, T. A Research Study on Unsupervised Machine Learning Algorithms for Fault Detection in Predictive Maintenance. In Proceedings of the 2018 5th International Conference on Industrial Engineering and Applications (ICIEA), Singapore, 26–28 April 2018; pp. 355–361. [Google Scholar]
- Jahnke, P. Machine Learning Approaches for Failure Type Detection and Predictive Maintenance. Tech. Univ. Darmstadt 2015, 19, 83. [Google Scholar]
- Wuest, T.; Weimer, D.; Irgens, C.; Thoben, K.-D. Machine learning in manufacturing: Advantages, challenges, and applications. Prod. Manuf. Res. 2016, 4, 23–45. [Google Scholar] [CrossRef]
- Dey, A.; Learning, A.S. Machine Learning Algorithms: A Review. Int. J. Comput. Sci. Inf. Technol. 2016, 7, 1174–1179. [Google Scholar]
- Kumar, N.; Sharma, D. A Review on Machine Learning Algorithms, Tasks and Applications Laptop security system View project Handwritten Gurmukhi Character Recognition System. Int. J. Adv. Res. Comput. Eng. Technol. 2017, 6, 1323–2278. [Google Scholar]
- Sharp, M. Introduction to Machine Learning. J. Manuf. Syst. 2018, 101, 1–6. [Google Scholar]
- Vasilić, P.; Vujnović, V.; Popović, N.; Marjanović, A.; Marjanović, Ž. Adaboost algorithm in the frame of predictive maintenance tasks. In Proceedings of the 2018 23rd International Scientific-Professional Conference on Information Technology (IT), Zabljak, Montenegro, 19–24 February 2018; pp. 1–4. [Google Scholar]
- Mathew, V.; Toby, T.; Singh, V.; Rao, B.M.; Kumar, M.G. Prediction of Remaining Useful Lifetime (RUL) of turbofan engine using machine learning. In Proceedings of the 2017 IEEE International Conference on Circuits and Systems (ICCS), Thiruvananthapuram, India, 20–21 December 2017; pp. 306–311. [Google Scholar]
- Oh, Y.G.; Ransikarbum, K.; Busogi, M.; Kwon, D.; Kim, N. Adaptive SVM-based real-time quality assessment for primer-sealer dispensing process of sunroof assembly line. Reliab. Eng. Syst. Saf. 2018, 184, 202–212. [Google Scholar] [CrossRef]
- Amruthnath, N.; Gupta, T. Fault Class Prediction in Unsupervised Learning using Model-Based Clustering Approach. In Proceedings of the 2018 International Conference on Information and Computer Technologies (ICICT), DeKalb, IL, USA, 23–25 March 2018; pp. 5–12. [Google Scholar]
- Li, X. Remaining Useful Life Prediction of Bearings Using Fuzzy Multimodal Extreme Learning Regression. Int. Conf. Sens. Diagn. Progn. Control 2017, 1, 499–503. [Google Scholar]
- Diaz-Rozo, J.; Bielza, C.; Larrañaga, P. Machine Learning-based CPS for Clustering High throughput Machining Cycle Conditions. Procedia Manuf. 2017, 10, 997–1008. [Google Scholar] [CrossRef]
- Wang, X.; Wang, H.; Qi, C.; Sivakumar, A.I. Reinforcement learning based predictive maintenance for a machine with multiple deteriorating yield levels. J. Comput. Inf. Syst. 2014, 10, 9–19. [Google Scholar]
- Luo, M.; Yan, H.C.; Hu, B.; Zhou, J.H.; Pang, C.K. A data-driven two-stage maintenance framework for degradation prediction in semiconductor manufacturing industries. Comput. Ind. Eng. 2015, 85, 414–422. [Google Scholar] [CrossRef]
- Cheng, F.L.; Qu, Q. A case-based data-driven prediction framework for machine fault prognostics. In Proceedings of the 2015 IEEE Energy Conversion Congress and Exposition (ECCE), Montreal, QC, Canada, 20–24 Septemper 2015; pp. 3957–3963. [Google Scholar]
- Siryani, J.; Tanju, B.; Eveleigh, T.J. A Machine Learning Decision-Support System Improves the Internet of Things’ Smart Meter Operations. IEEE Internet Things J. 2017, 4, 1056–1066. [Google Scholar] [CrossRef]
- Li, J. Hard drive failure prediction using classification and regression trees. In Proceedings of the 44th Annual IEEE/IFIP International Conference on Dependable Systems and Networks, Atlanta, GA, USA, 23–26 June 2014; pp. 383–394. [Google Scholar]
- Munirathinam, S.; Ramadoss, B. Feed Forward Backpropagation Neural Network Model to Predict Remaining Useful Life Estimation of Ion Implant Tool. Int. J. Eng. Technol. 2015, 15, 64–72. [Google Scholar]
- Chang, C.-W.; Lee, H.-W.; Liu, C.-H. A Review of Artificial Intelligence Algorithms Used for Smart Machine Tools. Inventions 2018, 3, 41. [Google Scholar] [CrossRef]
- Koprinkova-Hristova, P. Reinforcement Learning for Predictive Maintenance of Industrial Plants. Inf. Technol. Control 2013, 11, 21–28. [Google Scholar] [CrossRef][Green Version]
- Hundman, K.; Constantinou, V.; Laporte, C.; Colwell, I.; Soderstrom, T. Detecting Spacecraft Anomalies Using LSTMs and Nonparametric Dynamic Thresholding. In Proceedings of the 24th ACM SIGKDD international conference on knowledge discovery & data mining, London, UK, 19–23 August 2018; pp. 387–395. [Google Scholar]
- Ren, L.; Sun, Y.; Cui, J.; Zhang, L. Bearing remaining useful life prediction based on deep autoencoder and deep neural networks. J. Manuf. Syst. 2018, 48, 71–77. [Google Scholar] [CrossRef]
- Jiang, P.; Maghrebi, M.; Crosky, A.; Saydam, S. Unsupervised Deep Learning for Data-Driven Reliability and Risk Analysis of Engineered Systems. In Handbook of Neural Computation, 1st ed.; Elsevier Inc.: Amsterdam, The Netherlands, 2017. [Google Scholar]
- Cline, B.; Niculescu, B.D.; Huffman, R.S. Predictive Maintenance Applications for Machine Learning. Chin. J. Chem. 2017, 27, 1569–1574. [Google Scholar]
- Kroll, B.; Schaffranek, D.; Schriegel, S.; Niggemann, O. System modeling based on machine learning for anomaly detection and predictive maintenance in industrial plants. In Proceedings of the 2014 IEEE Emerging Technology and Factory Automation, Barcelona, Spain, 16–19 September 2014. [Google Scholar]
- Lechevalier, D.; Narayanan, A.; Rachuri, S. Towards a domain-specific framework for predictive analytics in manufacturing. In Proceedings of the 2014 IEEE International Conference on Big Data (Big Data), Washington, DC, USA, 27–30 Octocber 2014; pp. 987–995. [Google Scholar]
- Sayed, M.S.; Lohse, N.; Søndberg-Jeppesen, N.; Madsen, A.L. SelSus: Towards a reference architecture for diagnostics and predictive maintenance using smart manufacturing devices. In Proceedings of the 2015 IEEE 13th International Conference on Industrial Informatics (INDIN), Cambridge, UK, 22–24 July 2015; pp. 1700–1705. [Google Scholar]
- Wu, D.; Jennings, C.; Terpenny, J.; Kumara, S. Cloud-based machine learning for predictive analytics: Tool wear prediction in milling. In Proceedings of the 2016 IEEE International Conference on Big Data (Big Data), Washington, DC, USA, 5–8 December 2016; pp. 2062–2069. [Google Scholar]
- Liu, S.; Hu, Y.; Li, H.; Lu, C.; Zhang, H. Machinery condition prediction based on wavelet and support vector machine. J. Intell. Manuf. 2017, 28, 1045–1055. [Google Scholar] [CrossRef]
- Jinsong, B.; Yuan, G.; Xiaohu, Z.; Jianguo, Z.; Xia, J. A Data Driven Model for Predicting Tool Health Condition in High Speed Milling of Titanium Plates Using Real-Time SCADA. Procedia Cirp 2017, 61, 317–322. [Google Scholar] [CrossRef]
- Schopka, U. Practical aspects of virtual metrology and predictive maintenance model development and optimization. In Proceedings of the ASMC 2013 SEMI Advanced Semiconductor Manufacturing Conference, Saratoga Springs, NY, USA, 14–16 May 2013; pp. 180–185. [Google Scholar]
- Guo, Y.; Wu, Z.; Ji, Y. A Hybrid Deep Representation Learning Model for Time Series Classification and Prediction. In Proceedings of the 2017 3rd International Conference on Big Data Computing and Communications (BIGCOM), Chengdu, China, 10–11 August 2017; pp. 226–231. [Google Scholar]
- Lindström, J. Predictive Maintenance for a Wood Chipper Using Supervised Machine Learning. 2018. Available online: https://pdfs.semanticscholar.org/aa68/1b38ee1e9caae921f8a4589e560a9e2d447e.pdf?_ga=2.57831786.1777101615.1615205525-1148404372.1615205525 (accessed on 2 March 2021).
- Dong, W.; Zhou, M.C. A Supervised Learning and Control Method to Improve Particle Swarm Optimization Algorithms. IEEE Trans. Syst. Man Cybern. Syst. 2017, 47, 1135–1148. [Google Scholar] [CrossRef]
- Shi, F.; Liu, Y.; Liu, Z.; Li, E. Prediction of pipe performance with ensemble machine learning based approaches. J. Intell. Fuzzy Syst. 2018, 34, 3845–3855. [Google Scholar] [CrossRef]
- Langcake, S. Conditions in the Manufacturing Sector–June Quarter 2016. Available online: https://www.rba.gov.au/publications/bulletin/2016/jun/pdf/bu-0616-4.pdf (accessed on 2 March 2021).
- Flath, C.M.; Stein, N. Towards a data science toolbox for industrial analytics applications. Comput. Ind. 2018, 94, 16–25. [Google Scholar] [CrossRef]
- Susto, G.A.; McLoone, S.; Pagano, D.; Schirru, A.; Pampuri, S.; Beghi, A. Prediction of integral type failures in semiconductor manufacturing through classification methods. In Proceedings of the 2013 IEEE 18th Conference on Emerging Technologies & Factory Automation (ETFA), Cagliari, Italy, 10–13 September 2013; pp. 31–34. [Google Scholar]
- Susto, G.A. An adaptive machine learning decision system for flexible predictive maintenance. IEEE Int. Conf. Autom. Sci. Eng. 2014, 2014, 806–811. [Google Scholar]
- Jennings, C.; Member, S.; Wu, D.; Terpenny, J. Forecasting obsolescence risk and product lifecycle with machine learning. IEEE Trans. Comp. Packag. Manuf. Technol. 2016, 6, 1428–1439. [Google Scholar] [CrossRef]
- Zhang, J.; Wang, P.; Yan, R.; Gao, R.X. Long short-term memory for machine remaining life prediction. J. Manuf. Syst. 2018, 48, 78–86. [Google Scholar] [CrossRef]
- DiBiano, R.; Mukhopadhyay, S. Automated diagnostics for manufacturing machinery based on well-regularized deep neural networks. Integration 2017, 58, 303–310. [Google Scholar] [CrossRef]
- Abdurrahman, P.; ElifNurdan, P. A nocel scheme for accurate remaining useful life prediction for undustrial IoTs by using deep nerual netwrok. Int. J. Artif. Intell. Appl. 2018, 9, 17–25. [Google Scholar]
- Uhlmann, E.; Laghmouchi, A.; Geisert, C.; Hohwieler, E. Decentralized Data Analytics for Maintenance in Industrie 4.0. Procedia Manuf. 2017, 11, 1120–1126. [Google Scholar] [CrossRef]
- Lejon, E.; Kyösti, P.; Lindström, J. Machine learning for detection of anomalies in press-hardening: Selection of efficient methods. Procedia Cirp 2018, 72, 1079–1083. [Google Scholar] [CrossRef]
- Irfan, U.; Fan, Y.; Rehanullah, K.; Ling, L.; Haisheng, Y.; Bing, G. Predictive Maintenance of Power Substation Equipment by Infrared Thermography Using a Machine-Learning Approach. Energies 2017, 10, 1987. [Google Scholar]
- Costello, J.J.; West, G.M.; McArthur, S.D.J. Machine learning model for event-based prognostics in gas circulator condition monitoring. IEEE Trans. Reliab. 2017, 66, 1048–1057. [Google Scholar] [CrossRef]
- Mathew, J.; Luo, M.; Pang, C.K. Regression kernel for prognostics with support vector machines. In Proceedings of the 2017 22nd IEEE International Conference on Emerging Technologies and Factory Automation (ETFA), Limassol, Cyprus, 12–15 September 2017; pp. 1–5. [Google Scholar]
- Ameeth, K.; Aditya, S. Machine Learning for Predictive Maintenance of Industrial Machines using IoT Sensor Data. In Proceedings of the 2017 8th IEEE International Conference on Software Engineering and Service Science (ICSESS), Beijing, China, 24–26 November 2017. [Google Scholar]
- Butte, S.; Prashanth, A.R.; Patil, S. Machine Learning Based Predictive Maintenance Strategy: A Super Learning Approach with Deep Neural Networks. In Proceedings of the 2018 IEEE Workshop on Microelectronics and Electron Devices (WMED), Boise, ID, USA, 20–22 April 2018; pp. 1–5. [Google Scholar]
- Bluvband, Z.; Porotsky, S. RUL prognostics and critical zone recognition for suspended time-series. In Proceedings of the 2015 IEEE Conference on Prognostics and Health Management (PHM), Austin, TX, USA, 22–25 June 2015; pp. 1–5. [Google Scholar]
- Li, L.; Ota, K.; Dong, M. Deep Learning for Smart Industry: Efficient Manufacture Inspection System with Fog Computing. IEEE Trans. Ind. Inform. 2018, 14, 4665–4673. [Google Scholar] [CrossRef]
- Kejela, G.; Esteves, R.M.; Rong, C. Predictive Analytics of Sensor Data Using Distributed Machine Learning Techniques. In Proceedings of the 2014 IEEE 6th International Conference on Cloud Computing Technology and Science, Singapore, 15–18 December 2014; pp. 626–631. [Google Scholar]
- De Souza, D.L.; Granzotto, G.M.H.; de Almeida, M.; Oliveira-Lopes, L.C. Fault Detection and Diagnosis Using Support Vector Machines—A SVC and SVR Comparison. J. Saf. Eng. 2014, 3, 18–29. [Google Scholar] [CrossRef]


Publisher’s Note: MDPI stays neutral with regard to jurisdictional claims in published maps and institutional affiliations. |
© 2021 by the authors. Licensee MDPI, Basel, Switzerland. This article is an open access article distributed under the terms and conditions of the Creative Commons Attribution (CC BY) license (http://creativecommons.org/licenses/by/4.0/).