Article

Strengthening Effect of the External Prestressing Method That Simulated a Deterioration Bridge

1
Advanced Composites Research Center, Korea Institute of Civil Engineering and Building Technology, 283, Goyang-daero, Ilsanseo-gu, Goyang-si 10223, Korea
2
Future Infrastructure Research Center, Korea Institute of Civil Engineering and Building Technology, 283, Goyang-daero, Ilsanseo-gu, Goyang-si 10223, Korea
*
Author to whom correspondence should be addressed.
Appl. Sci. 2021, 11(6), 2553; https://doi.org/10.3390/app11062553
Submission received: 10 February 2021 / Revised: 11 March 2021 / Accepted: 11 March 2021 / Published: 12 March 2021

Abstract

:
Various methods for strengthening existing structures have been developed owing to the increase in human and property damages caused by the deterioration of structures. Among the various reinforcing methods, the external prestressing method increases the usability and safety of a structure by directly applying tension to the weak tensile area that suffers the greatest deflection during the structure usage. The external prestressing method is advantageous in reducing cracks caused by the introduced tension and restoration of the deflection. Since the strengthening method is applied to deterioration bridges, the strengthening effect is affected by the condition of the existing structure. However, studies on the strengthening effect according to the degree of deterioration are insufficient. Therefore, the behavior according to the strengthening status was analyzed, and the strengthening effect was identified in this study by simulating the deteriorated bridge, reducing the compressive strength and reinforcement quantity, and conducting a four-point loading test. As a result of the experiment, a reinforcement effect of 215% crack load, 161% yield load, and the difference in behavior according to the reinforcement parameters were confirmed.

1. Introduction

Concrete structures gradually deteriorate owing to material degradation, excessive and increasing traffic load, and environmental factors. The usability and safety of the structures are affected by the degraded performance [1,2,3]. In fact, cases of collapse of deteriorated bridge structures have been reported [4,5,6], and various strengthening methods have been proposed for restoring and improving performance along with widespread awareness of the importance of structure maintenance [7,8,9,10,11,12,13,14,15,16,17,18].
Among the various strengthening methods, the external prestressing method improves the load carry capacity by applying tension directly to the outside of the structure. It has the advantage of reducing cracks, which prevents corrosion of the reinforcing bars and facilitates displacement recovery [17]. To verify the strengthening effect of the external prestressing method, Oh et al. and Lee et al. additionally introduced an external prestress force to a real bridge and compared the performance improvement effect [17,19]. Han et al. developed a girder strengthening method that simultaneously applies the external prestressing and bonding methods [20]. Naaman et al. conducted an experiment to evaluate the ultimate stress in unbonded prestressing tendons [21,22,23], and Ozkul et al. conducted a study on the strengthening effect of the external prestressed PSC I girder and the shape of the prestressing tendon [24].
Various studies have been carried out so far, but existing studies do not consider the degree of damage to the structure or only consider the existence of cracks to determine the reinforcing effects and effects of old structures. In addition, the external prestressing method has a limitation in that it is difficult to confirm the reinforcement effect of the actual bridge because the difference in stiffness before cracking is not large depending on whether or not it is reinforced [25,26,27,28,29,30,31,32,33].
Herein, the behavior according to the strengthening status was analyzed, and the strengthening effect was examined by conducting a four-point loading test on the specimen to which the non-strengthening and external prestressing method was applied. This was done to examine the strengthening effect of the external prestressing method according to the deterioration by considering the structural deterioration as a reduction of the compressive strength of concrete and the reinforcement quantity.

2. Experimental Program

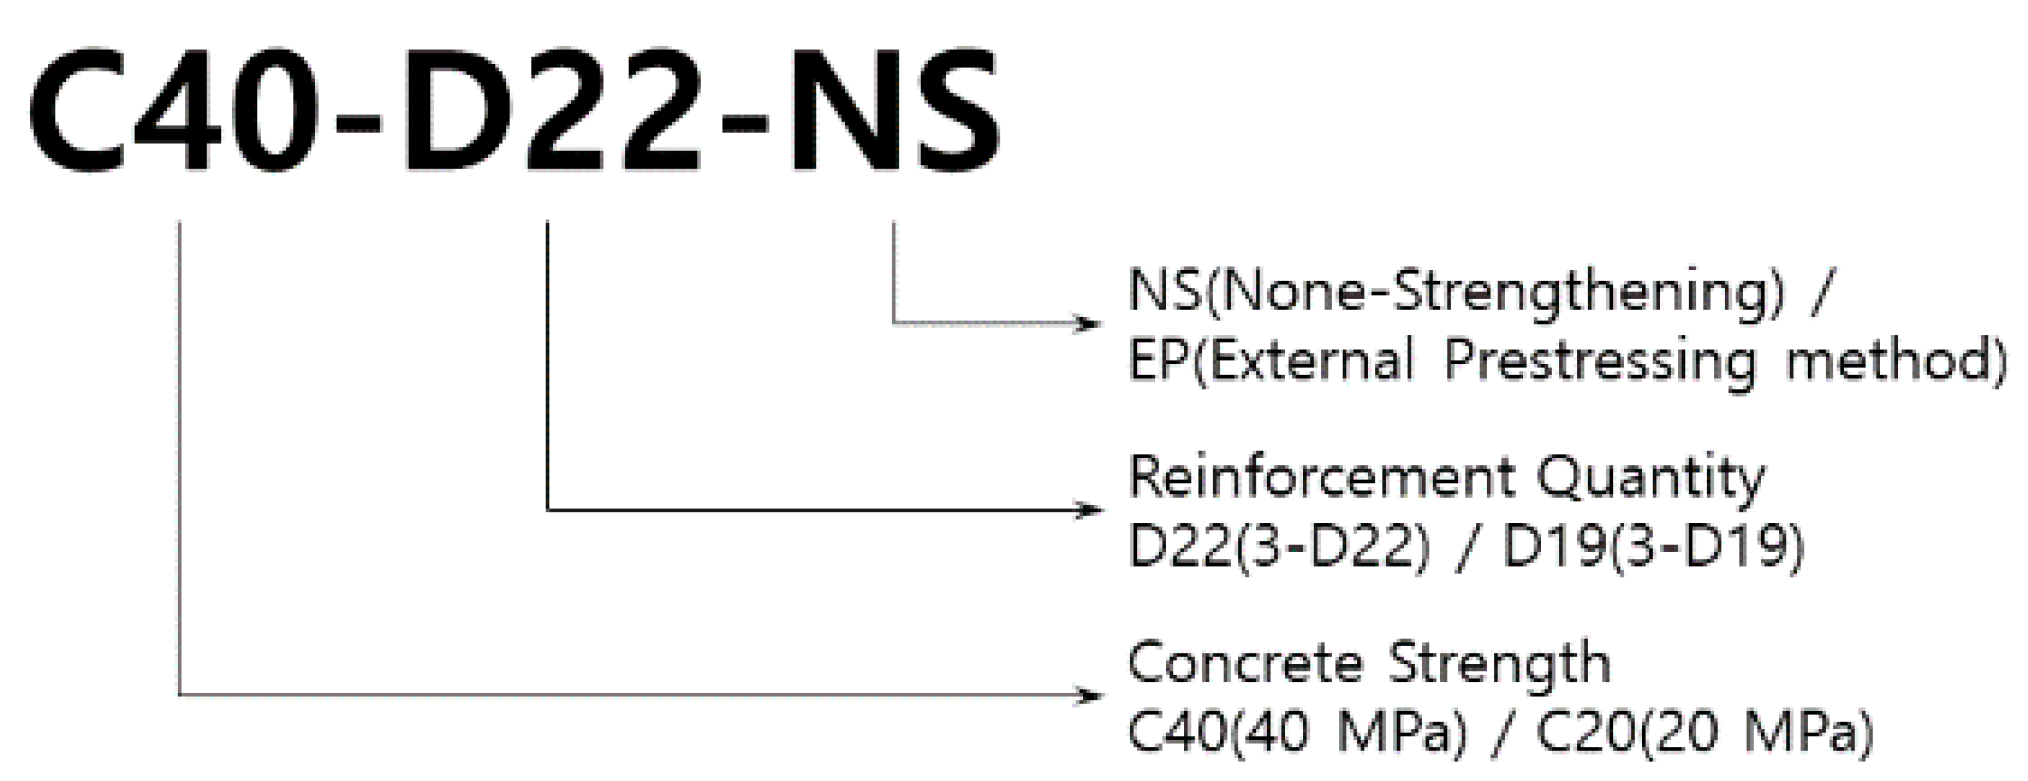
2.1. Experimental Method and Content

The concrete compressive strength and reinforcement quantity were the main variables in this study. The experiment was conducted by fabricating 8 specimens with a rectangular cross section of a total length of 6.4 m, span of 6100 mm, width of 400 mm, and height of 600 mm, as shown in Figure 1. The rebar used in the experiment was grade 40 (yield strength 400 MPa). For the reference specimen, the concrete compressive strength was 40 MPa, and three bars of 22 mm in diameter were arranged for tensile reinforcement (3-D22; D denotes the diameter of the rebar). A closed stirrup of D10 reinforcement was placed to prevent shear failure during loading, and a 3-D22 compression reinforcement was used to induce tensile failure. To reflect the deterioration degree of the structure, the case in which the concrete compressive strength of 20 MPa and the tensile reinforcement 3-D19 were respectively reflected was set as a variable (see Table 1). Further, the strengthening effect was examined through the loading tests of the non-strengthened and strengthened specimens, respectively. The names of the specimens indicated the concrete compressive strength, reinforcement quantity, and strengthening status, as shown in Figure 2. The concrete used in the experiment was examined through the strength of the specimen, Schmidt hammer, and core, and the concrete compressive strength experimental values according to days reached the target values of 20 and 40 MPa at the time of strengthening and experimenting, as shown in Figure 3. The solid line in Figure 3 represents the calculated concrete compressive strength over time, which is an important variable in the experiment; therefore, various methods were used to verify the exact strength through experiments. The concrete compressive strength test was carried out by manufacturing cylinder specimens, and the average of the measured values of each of the three test specimens was used in the test results.

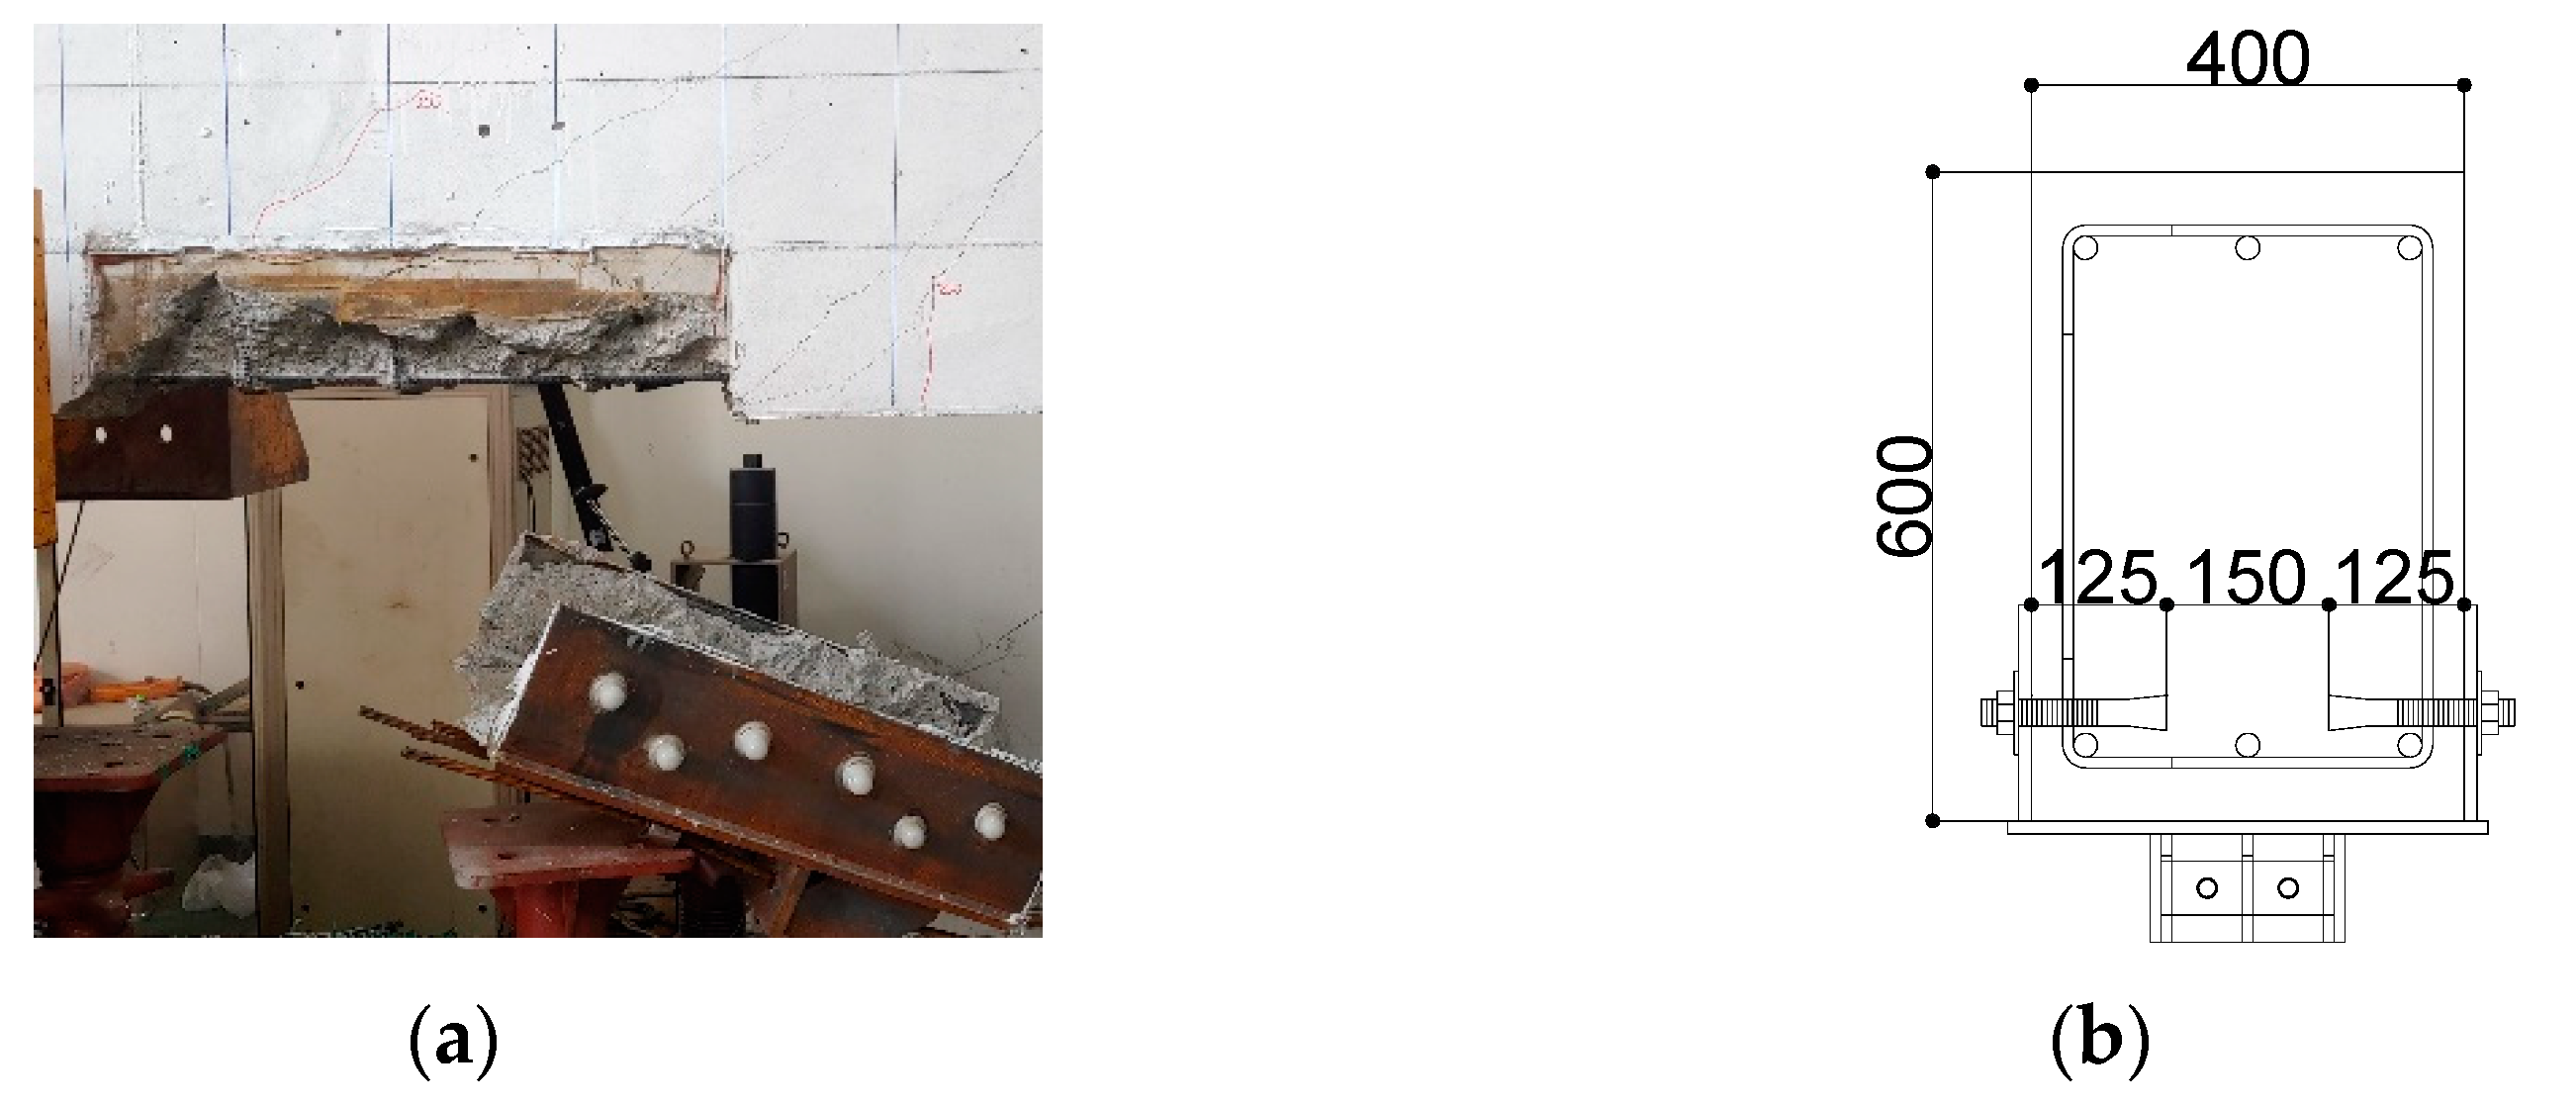
2.2. Strengthening of Specimen

The specimen was strengthened by applying the process of a specialized company that performs strengthening work of real structures to identify problems in the design and construction of the current strengthening method. As for the design problem, there were limitations in that only up to the introduced prestress force of the external prestressing tendon was reflected in the anchorage design despite the need to design the anchorage up to the point of failure of the structure or the tensile strength of the prestressing tendon. This is necessary because sections other than the anchorage are unbonded, and all loads are concentrated on the anchorage in the external prestressing method. For smooth strengthening, the anchor plate was constructed by turning the specimen upside down so that the bottom plate could face upwards. The detailed shape of the anchor plate is shown in Figure 4. The anchorage was constructed by using M16 anchor bolts and was installed sequentially by drilling anchor bolts, installing the bottom anchor plate, drilling the side anchor bolts, installing the side anchor plate, and welding the bottom and side anchor plates, as shown in Figure 5. However, some anchors were only buried 60 mm owing to interference with the internal reinforcement, even though the used M16 anchor bolts required a drilling depth of 125 mm and an anchorage depth of 100 mm. Side anchor bolts that were not considered in the design were additionally installed for the construction.
All specimens were installed with two strands of outer prestressing tendon of diameter of 12.7 mm, and prestress forces of 100 kN and 50 kN were introduced to each of the 49 MPa and 20 MPa specimens, respectively. A strain gauge was installed on individual strands to examine the prestressing force introduced during prestress. As the external prestressing method uses unbonded prestressing tendons, there is no loss due to friction during the loss of prestressed concrete. Only loss due to the contraction of concrete from the subsequent prestressing of prestressed tendon and wedge type anchorage slip loss occur. In addition, although prestress losses may occur owing to the slip of the entire anchorage because of the nature of the external prestressing method, they were not considered. This is because the maximum displacement of the anchorage during prestress was measured to be 0.02 mm, which was smaller than the slip of the wedge type anchorage of 3–6 mm proposed in the design criteria. However, as shown in Table 2, the prestressing force introduced into the external tendon was measured to be 56–82%, presumably owing to prestress losses occurring during the jacking process. In the case of the external prestressing method, as it is unbonded, it is judged as the effect of setting loss and elastic shortening excluding friction loss. However, in the case of strengthening the actual structure, it is very difficult to directly measure the prestressing force using a strain gauge, so it is necessary to carefully check whether the design prestressing force is introduced.

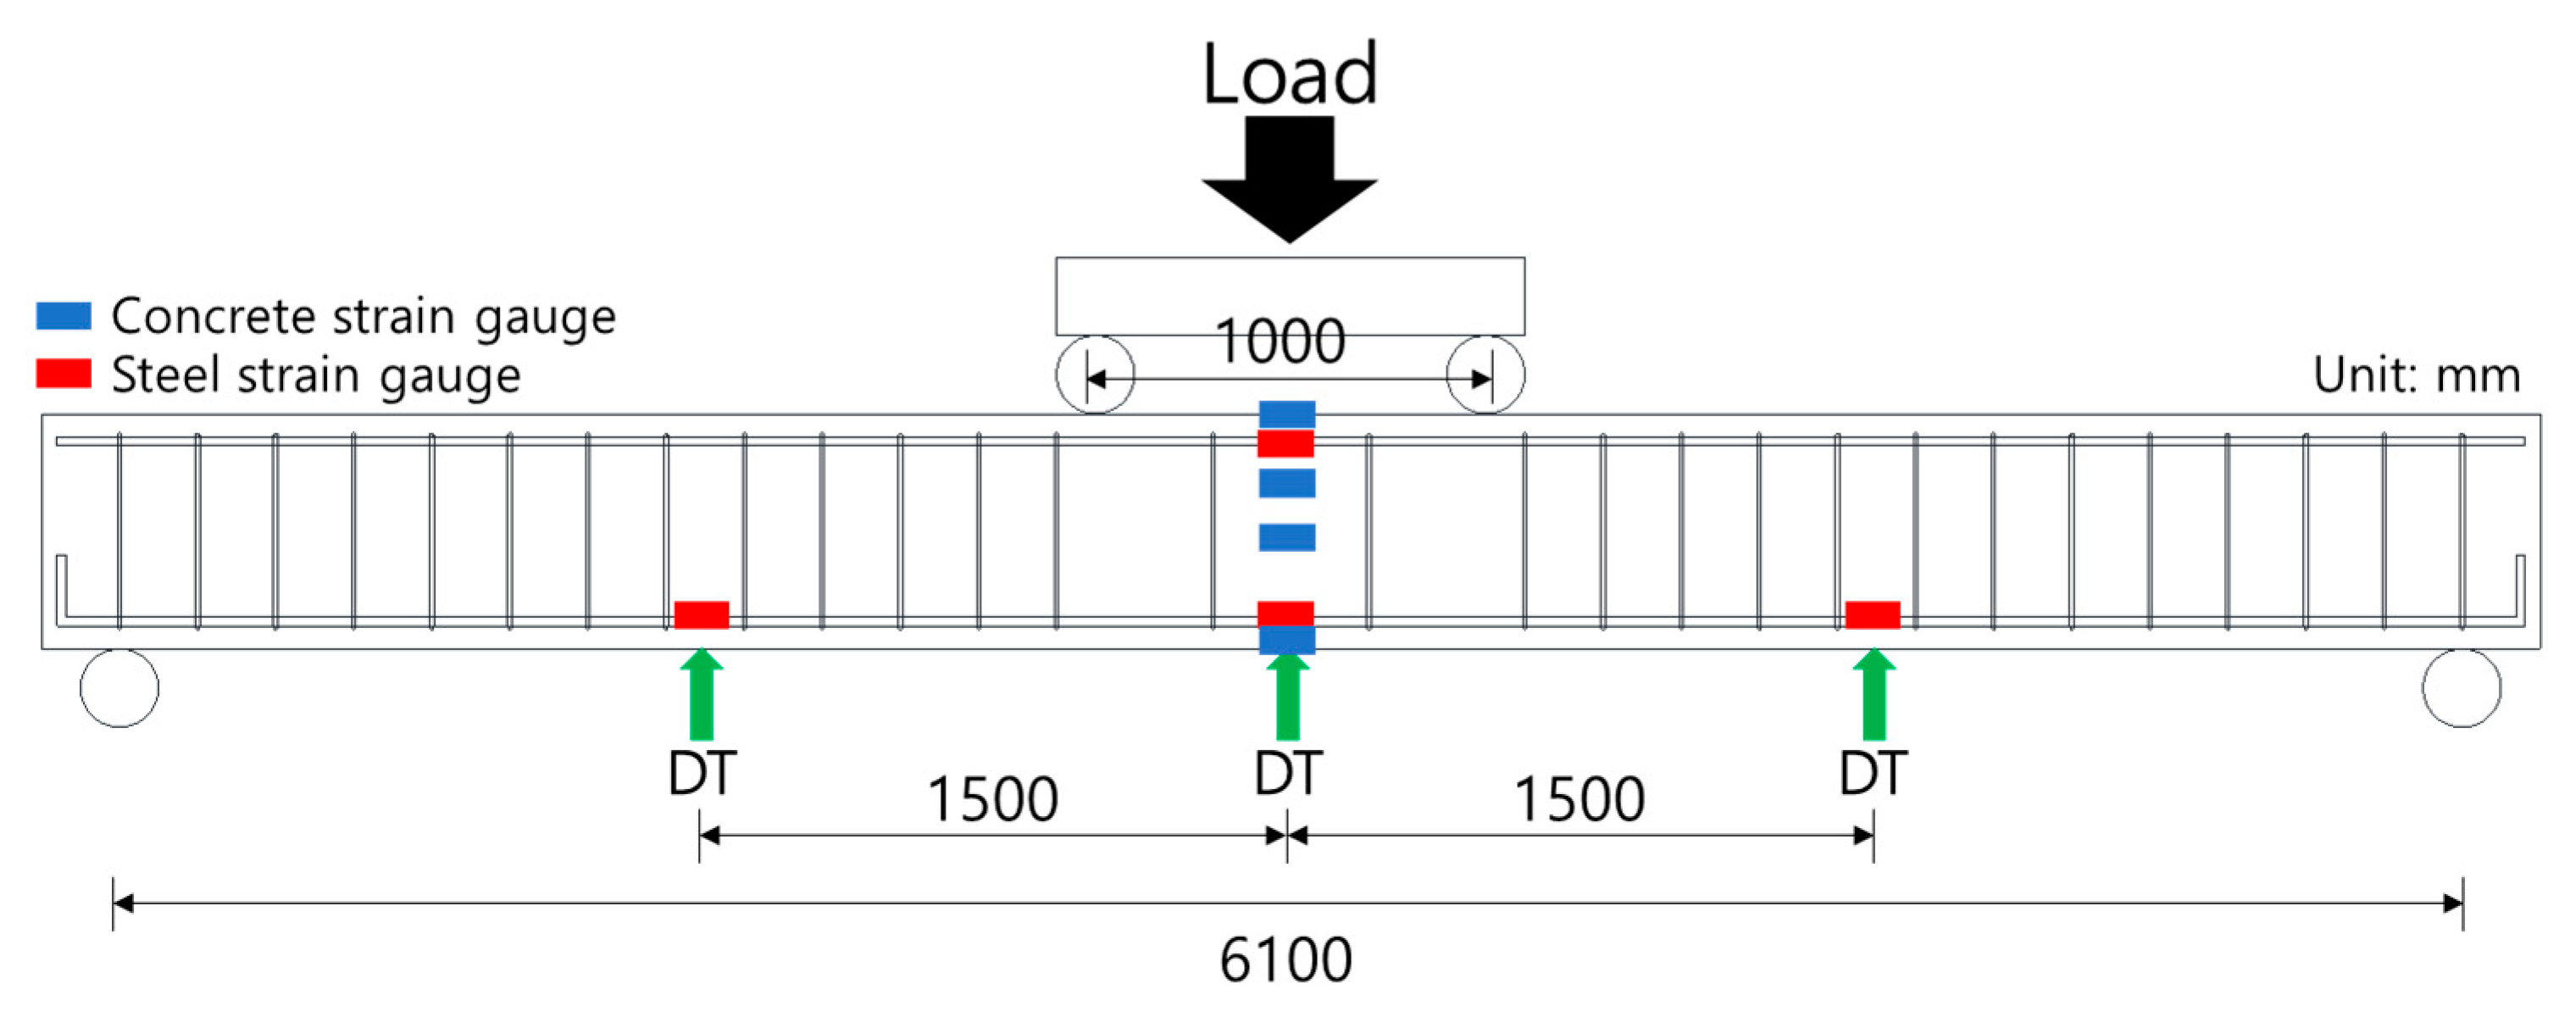
2.3. Measurement and Loading Method
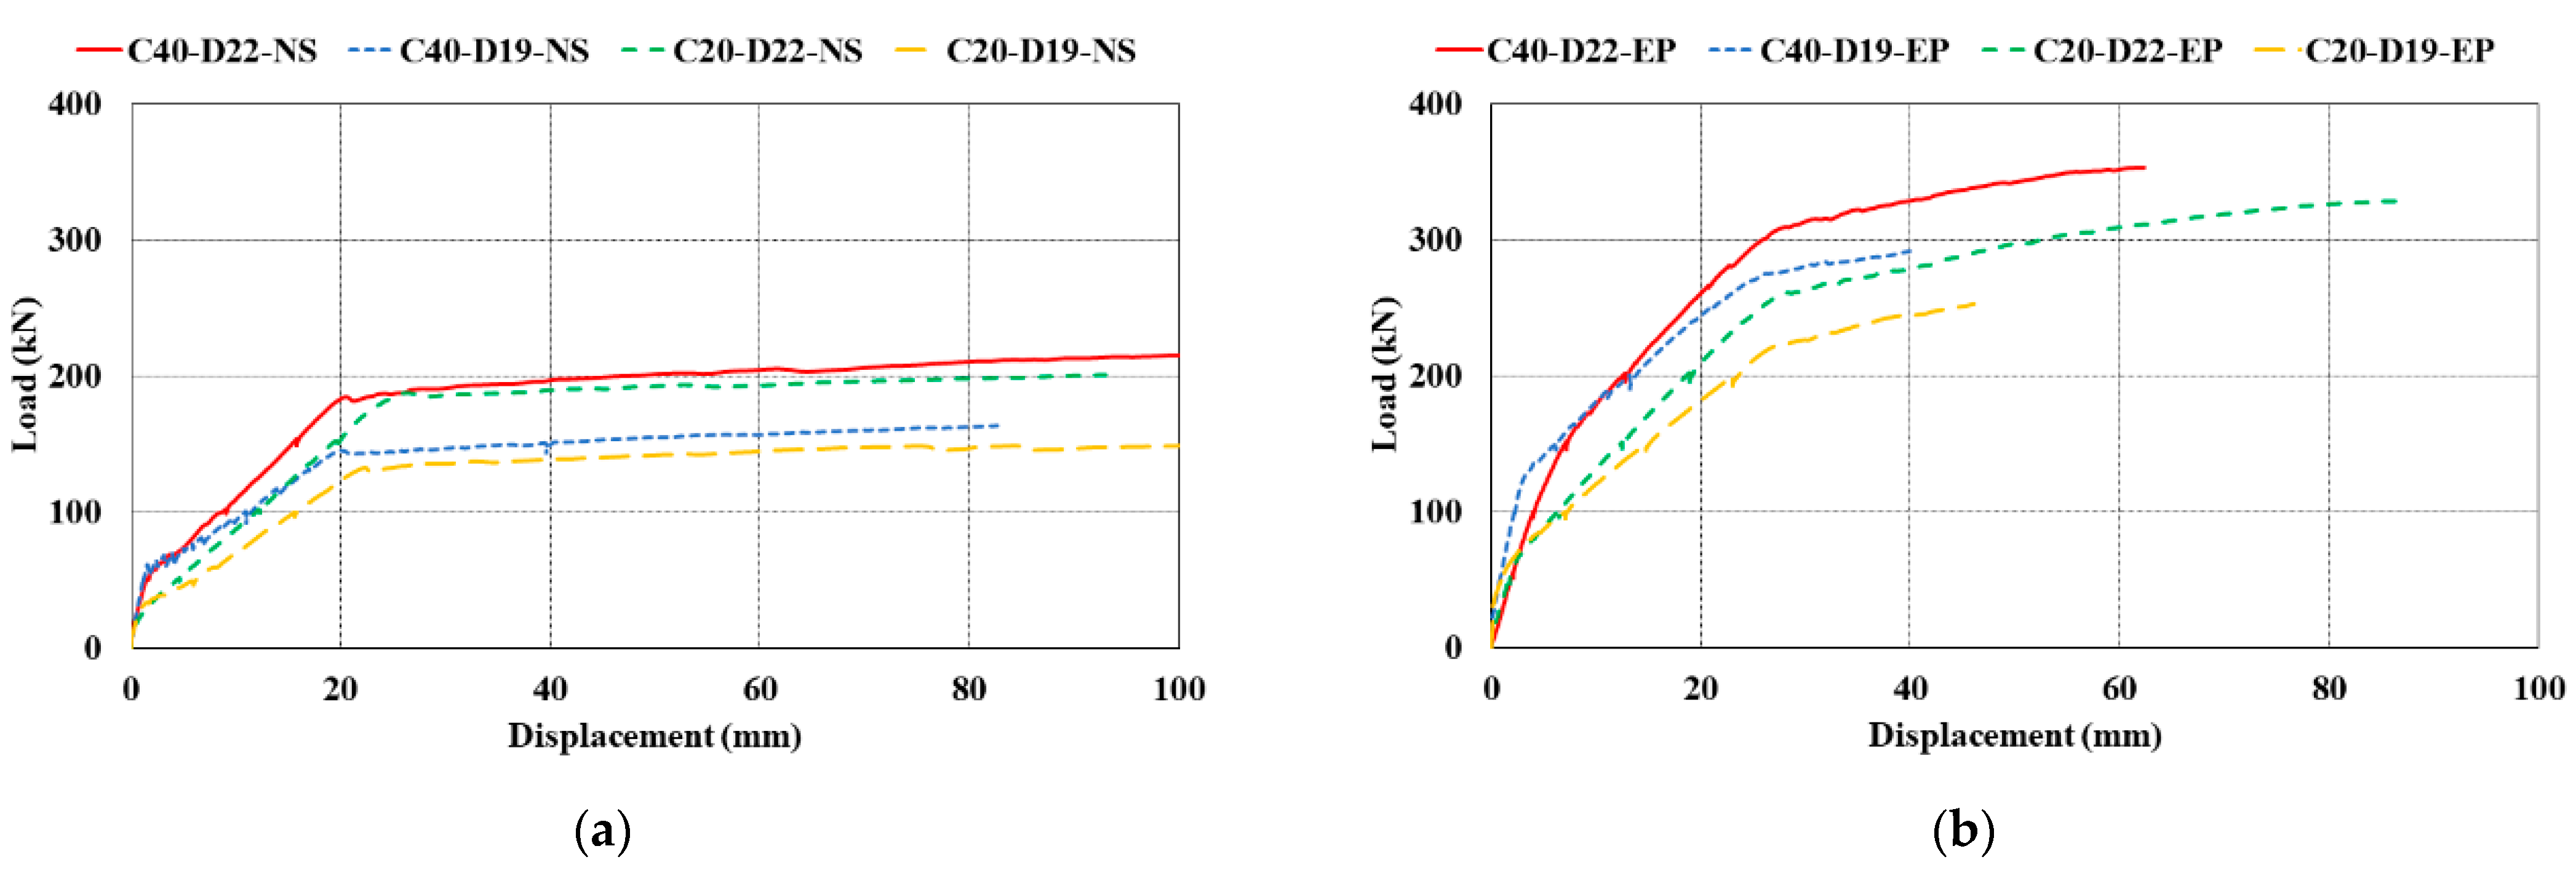
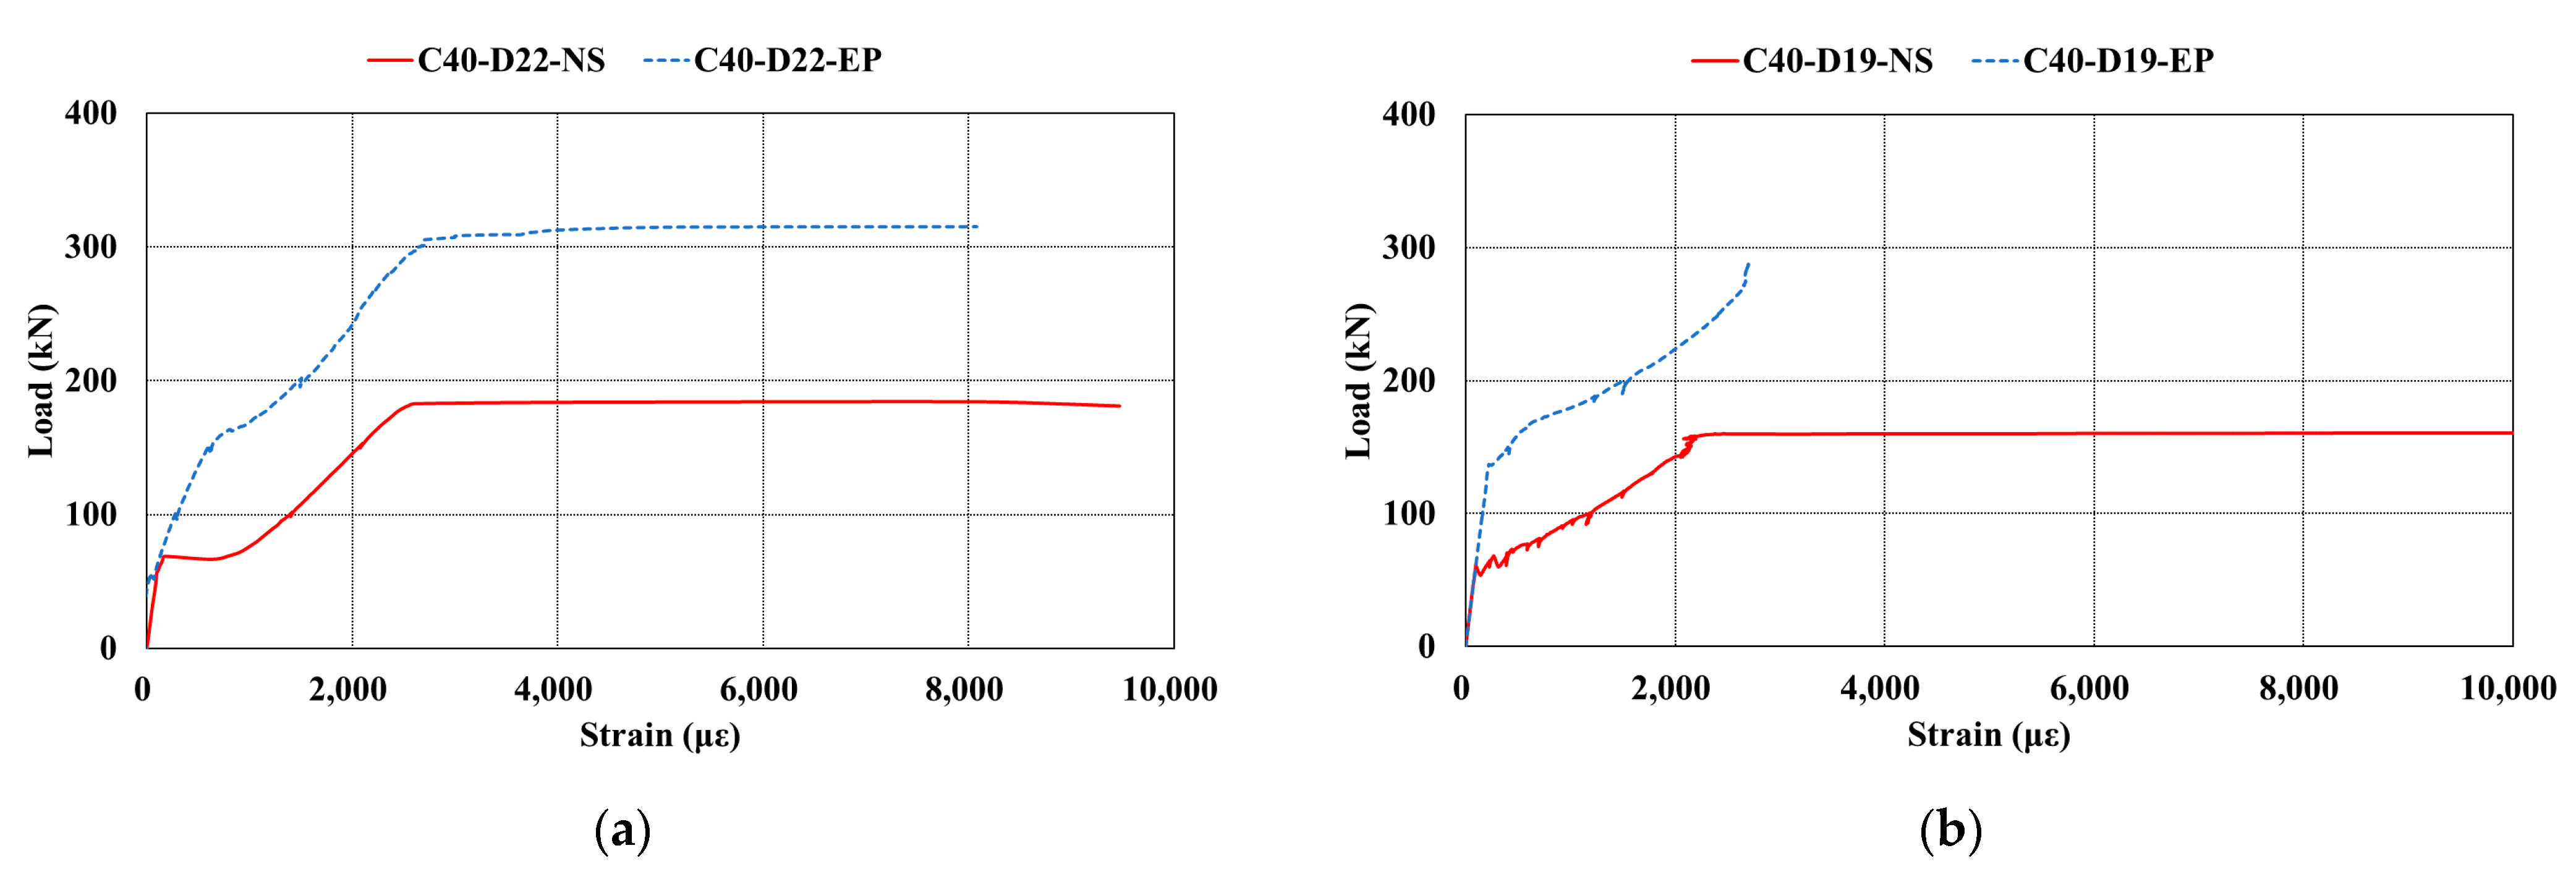
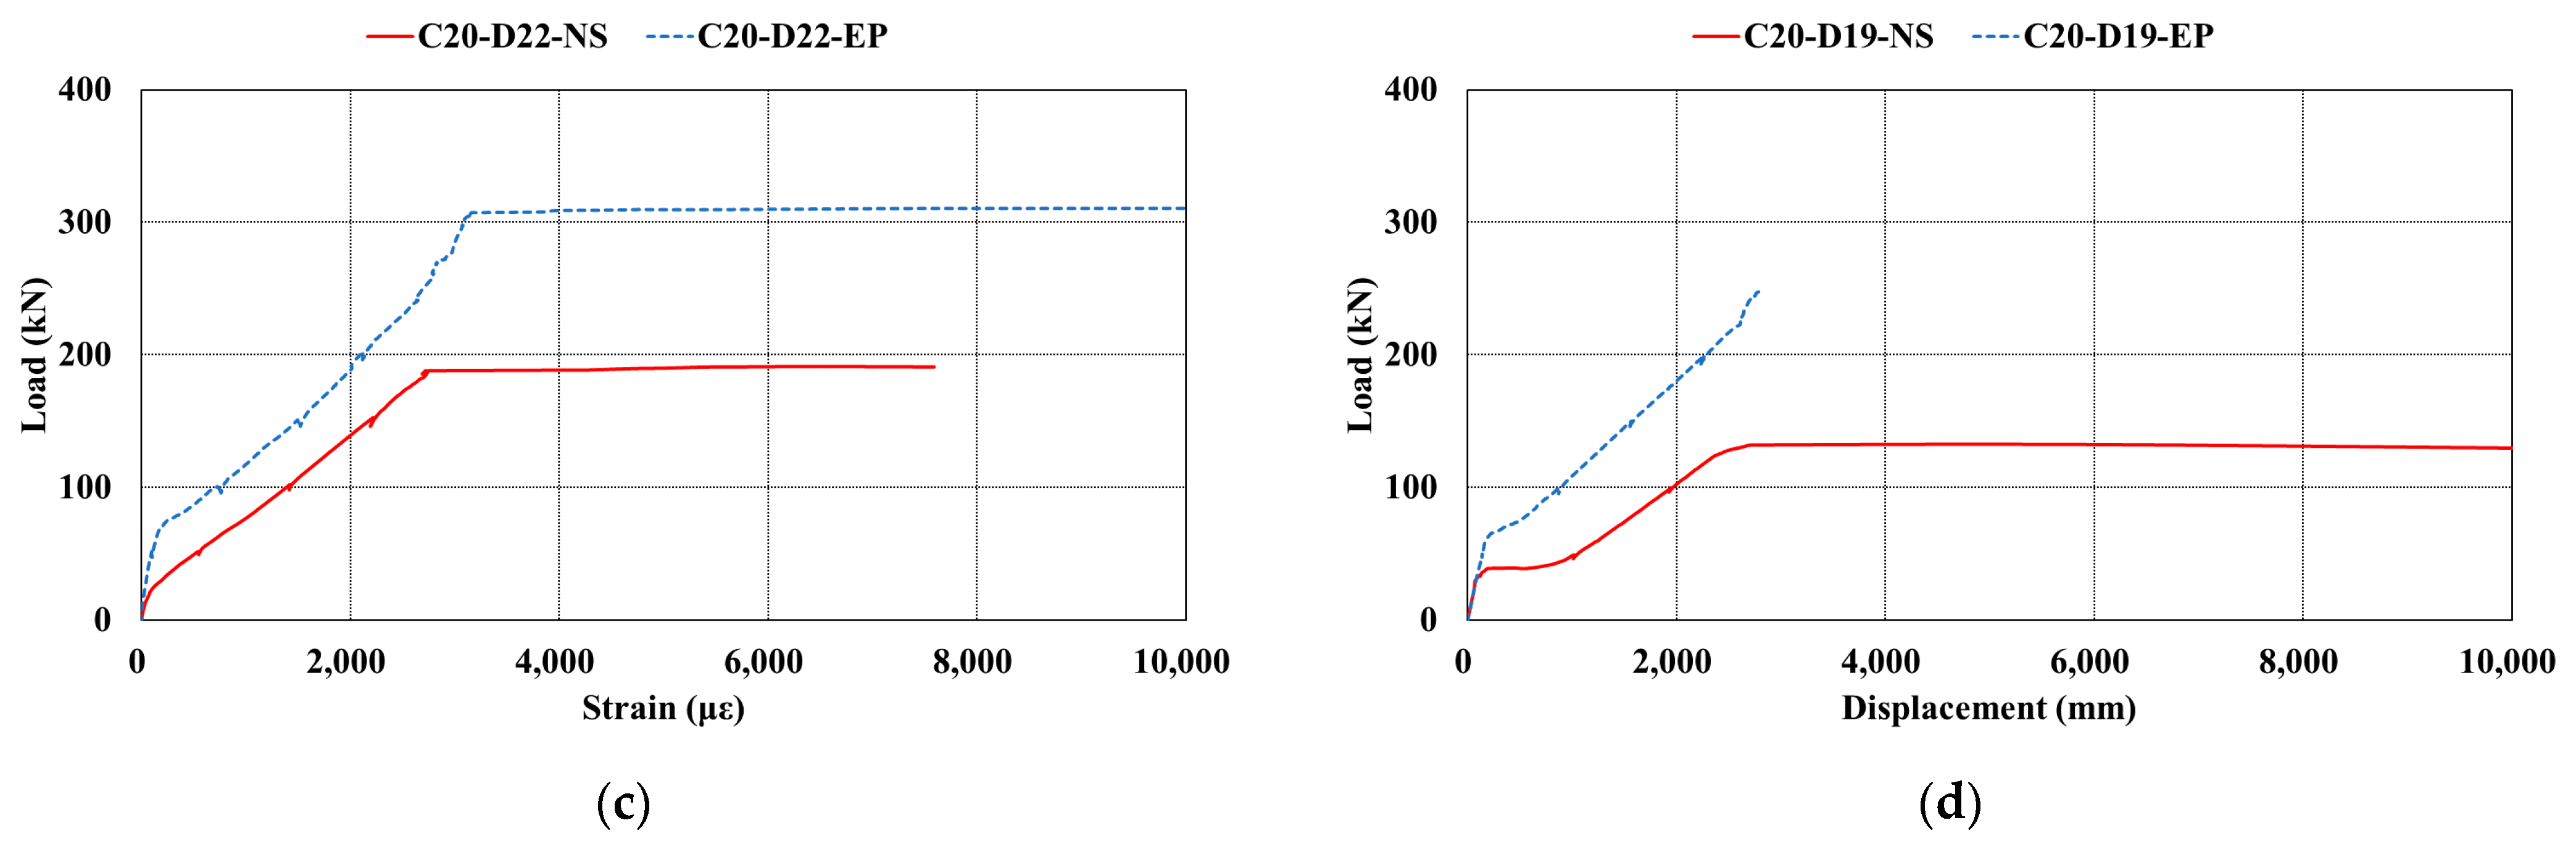
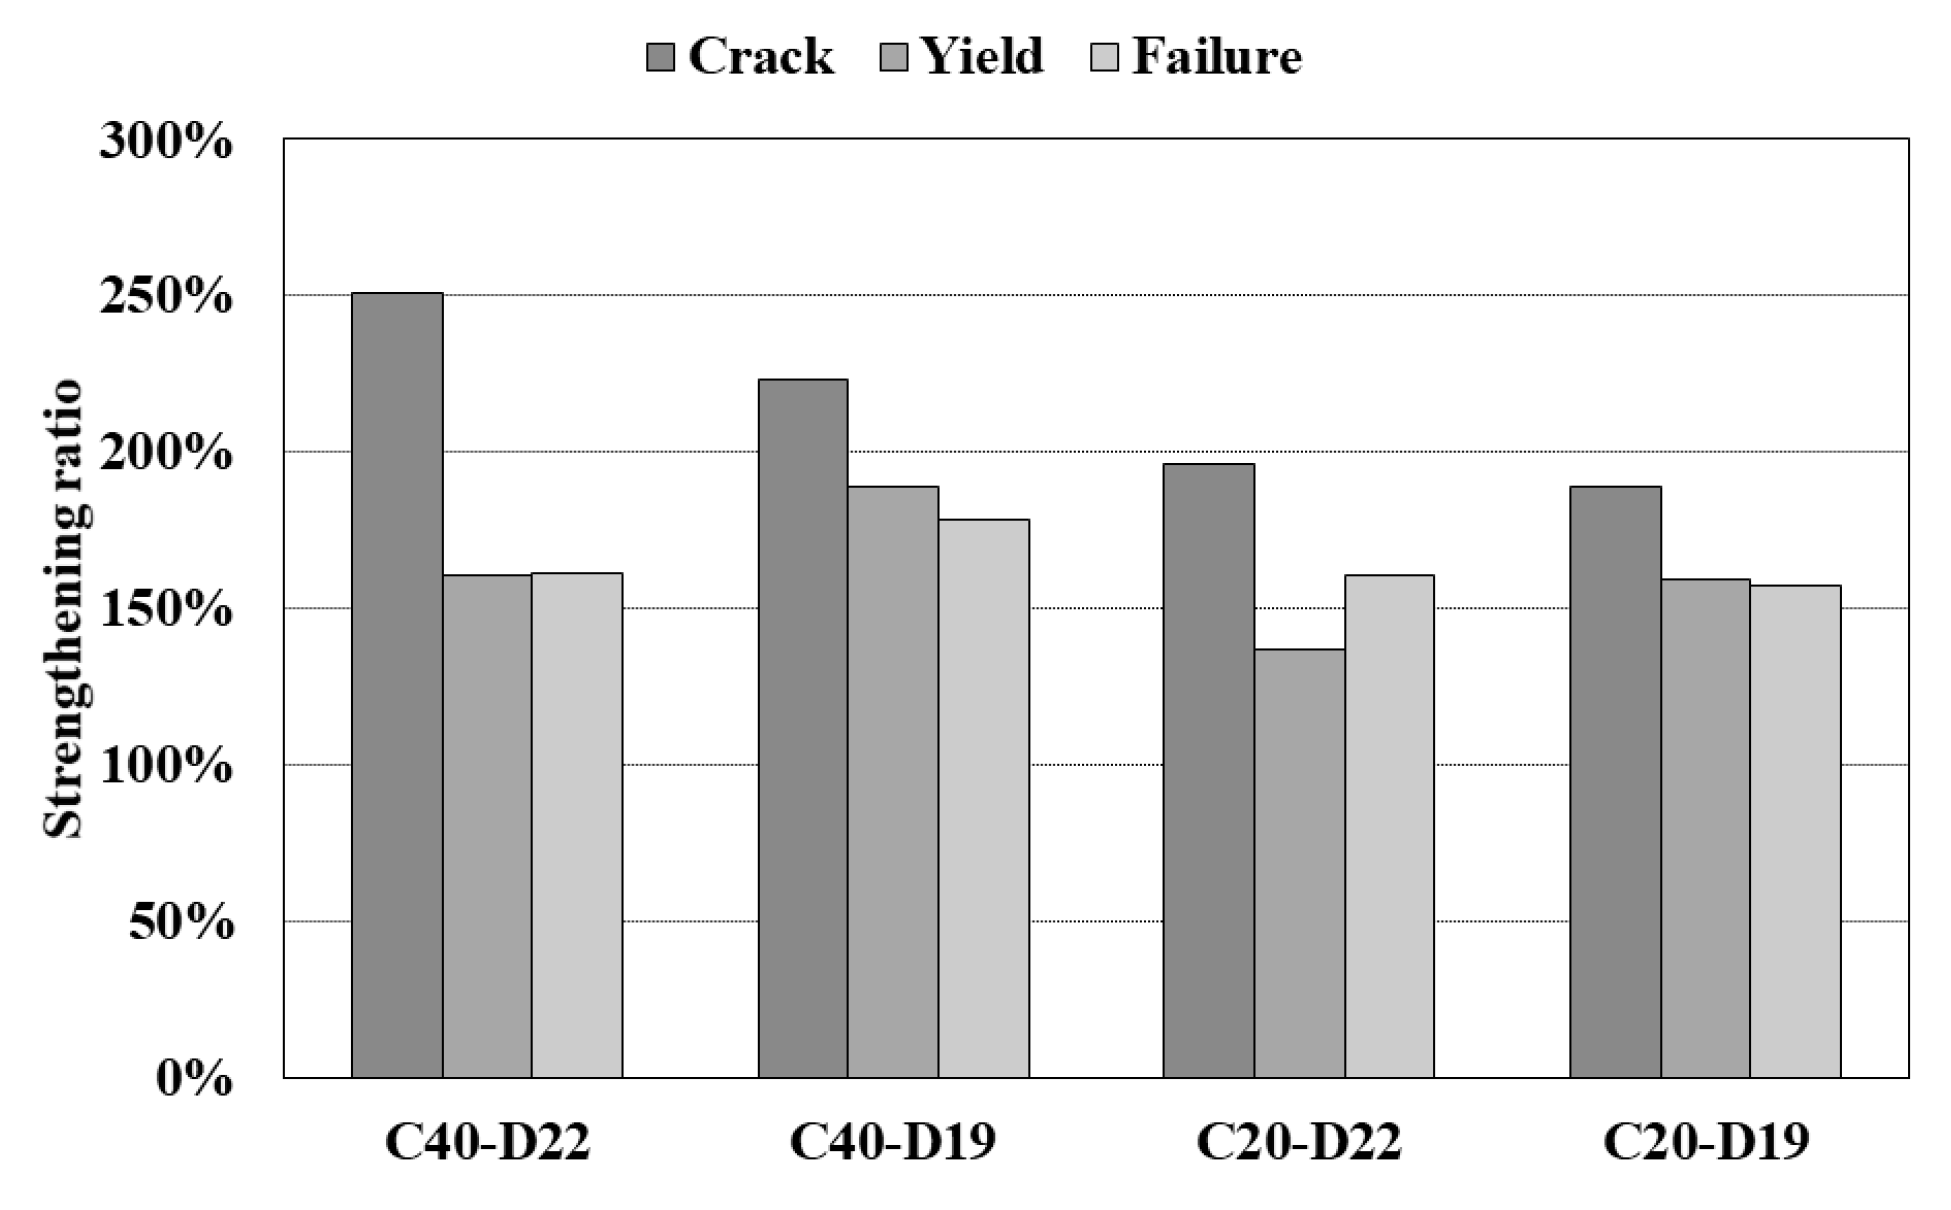
A four-point loading test was performed by using a 2000 kN class UTM to examine the strengthening effect. The average length of the beam span is 6100 mm and employs a boundary condition of simple beams using hinges and rollers.
It was loaded at a speed of 0.03 mm/sec up to the initial 30 mm through the displacement control method for safety and was then loaded at a speed of 0.1 mm/sec to the point of failure. Meanwhile, the load was set so that the length of the pure bending zone is 1 m with a width of 500 mm from the middle of the specimen to both sides. A total of 6 reinforcement strain gauges were installed including one on the upper part and four on the lower part of the specimen at the middle of the span, and one each in the lower parts of the specimen of a 1/4 span, as shown in Figure 6. Four concrete strain gauges were installed according to the height at the middle of the span. Displacement gauges were installed to measure the deflection of the specimen at 1/4 points on either side of the middle of the span.

3. Test Result

As the load increased, crack, yield, and failure occurred in stages. The crack load is the load in which a crack occurs due to an abnormality in the tensile strength of the concrete at the bottom of the specimen as deflection increases. The yield load is the load at which the reinforcing bar yields after the crack is transferred from the concrete to the reinforcing bar. The failure load is the load when the structure is completely destroyed, e.g., anchorage dropout.
The crack load was calculated theoretically at the point where the stress of concrete generated at the bottom of the beam reaches the modulus of rupture of the concrete, as shown in Equation (1). The load was converted through the moment–load relationship of a simple beam with two loads [34].
M c r = f r I g / y t
where, M c r denotes the crack moment, f r denotes the modulus of rupture, I g denotes the moment of inertia, and y t denotes the distance from the center axis of the section to the tensile edge.
The yield load was calculated at the point where the reinforcement strain on the tensile side reached the yield strain of 2000 με, while the neutral axis was considered assuming that the section remains plane. Then, the strain rates of concrete and compression reinforcement were calculated.
According to the failure shape, the non-strengthened specimen showed a typical form of flexural failure through compressive failure after the tensile reinforcement yielding, as shown in Figure 7a. The test was terminated owing to the detachment of the anchorage resulting from the failure of the surrounding concrete and the overturning of anchorage after yielding, as shown in Figure 7b. The prestress force was lost even after the load was removed, and the deflection was not recovered. The anchorage detachment occurred because the sufficient shear force was not secured as some anchor bolts did not reach the anchorage depth (see Section 2.2). Moreover, the number of anchor bolts was only designed for introducing the prestressing force due to the increase in the size of the anchorage and the number of anchor bolts, even though it needs to be designed according to the stress that the anchorage needs to bear until member failure. In addition, in the case of post-installed anchors, the center spacing and edge distance of 6 times or over of the anchor diameter need to be secured. However, the center spacing of anchor bolts was at a minimum of 70 mm, which did not satisfy the central spacing regulations, as shown in Figure 4a. Additionally, the side anchor bolts constrained the concrete cover and detached together with the anchorage, as shown in Figure 8a, which is determined to be the result of the reduction of the section of concrete due to the anchor bolts inserted from the left and right sides of the same height, as shown in Figure 8b. This is considered to have been caused by the narrow width of the specimen compared to the thick lower flange of the general bridge. The crack, yield, and failure loads of the specimen are summarized in Table 3, and the load–displacement relationship is shown in Figure 9. The load–displacement relationship of the non-strengthened specimen without strengthening is shown in Figure 9a, and a similar load–displacement relationship was shown according to the arrangement of tensile reinforcement regardless of the concrete compressive strength. The crack load of the 20-MPa specimen with low concrete compressive strength was lower than that of the 40-MPa specimen, and the 3-D19 specimen with small reinforcement quantity had a lower yield strength than that of the 3-D22 specimen. The behavior was similar depending on the reinforcement quantity after yielding, and it was found that the strength and stiffness of the non-strengthened RC beam was controlled by the reinforcement quantity rather than the concrete strength.
In the case of the strengthened specimen, the crack load of the 20-MPa specimen with low concrete compressive strength was lower than that of the 40-MPa specimen, as in the non-strengthened specimen shown in Figure 9b. Moreover, the 3-D19 specimen with a small reinforcement had a lower yield strength than that of the 3-D22 specimen.
Only the crack and yield loads were analyzed as it was difficult to examine the failure load, which exhibits the maximum strengthening performance, owing to the failure of the anchorage in the strengthened specimen. Nevertheless, the increase in the crack and yield loads was examined before and after strengthening through the relationship between the load and strain rate of the tension reinforcement in the middle of the span, as shown in Figure 10.
In addition, the effect of increasing the stiffness of external prestressing was unexpected as the difference in stiffness before and after strengthening prior to cracking was insignificant. It will also be difficult to examine the strengthening effect prior to cracking in the case of strengthening of a real bridge as estimating the crack load is challenging. The strengthening effect examined through the ratio of the experimental results of the strengthening to the experimental results of the non-strengthening of the crack load, yield load, and ultimate strength is as shown in Figure 11.
In the case of the external prestressed specimen, the crack load increased by 215%, and the yield load increased by 161% on average compared to the non-strengthened specimen. The effect of increasing the crack load of the 40-MPa specimen with a large reinforcement quantity was greater than that of the 20-MPa specimen. The strengthening effect of the yield load was higher when the reinforcement quantity was smaller under the same concrete standard compressive strength although the strengthening effect of the crack load was greater when the reinforcement quantity was larger under the same concrete strength. In addition, it was determined that the strengthening effect was initially affected by the concrete strength.

4. Conclusions

The external prestressing effect was experimentally verified in this study by assuming the reduction of the concrete compressive strength and reinforcement quantity as the deterioration degree of the structure. The following conclusions were drawn.
(1) The anchor bolt center spacing and edge distance regulations were not observed, and sufficient anchorage depth suggested in the design regulations was not secured when installing an anchorage of the external prestressing method. Therefore, anchor bolts need to be properly managed and supervised in the design and construction stages when applying the external prestressing method.
(2) As a result of examining the load–displacement relationship of the non-strengthened specimen, the crack load of the 20-MPa specimen with low concrete compressive strength was lower than that of the 40-MPa specimen. Further, the strength and stiffness of the non-strengthened RC beam were more influenced by the reinforcement quantity than the concrete strength because the 3-D19 specimen, which had small reinforcement quantity, exhibited a lower yield strength than the 3-D22 specimen.
(3) Although the strengthening effect was found to be 215% for the crack load and 161% for the yield load on average according to the external prestressing status, it was difficult to examine the strengthening effect prior to cracking as the stiffness values before and after strengthening were similar. The strengthening effect was found to be greater when the strength of the concrete was higher for the crack load and when the reinforcement quantity was smaller for the yield load according to the deterioration degree.
(4) Unexpected behavior was found in the external prestressing method, such as premature failure in areas that were not considered during design and construction. Therefore, further study is required to solve these problems in the future.

Author Contributions

Conceptualization, S.-H.K. and J.-S.P.; methodology, S.-H.K. and J.-S.P.; software, S.-H.K. and J.-Y.K.; validation, S.-H.K.; J.-Y.K.; formal analysis, S.-H.K.; investigation, W.-T.J.; resources, S.-H.K. and W.-T.J.; data curation, S.-H.K.; writing—original draft preparation, S.-H.K.; writing—review and editing, S.-H.K. and J.-S.P.; visualization, S.-H.K.; supervision, J.-S.P.; project administration, J.-S.P.; funding acquisition, J.-S.P. All authors have read and agreed to the published version of the manuscript.

Funding

This research was funded by the Smart Civil Infrastructure Research Program for the Ministry of Land, Infrastructure and Transport of the Korean Government, grant number 17SCIP-B128496-01.

Institutional Review Board Statement

Not applicable.

Informed Consent Statement

Not applicable.

Data Availability Statement

The data presented in this study are available on request from the corresponding author.

Acknowledgments

This research was supported by a grant (17SCIP-B128496-01) from the Smart Civil Infrastructure Research Program funded by the Ministry of Land, Infrastructure and Transport of the Korean government.

Conflicts of Interest

The author declares no conflict of interest.

References

  1. Jung, W.T.; Park, J.S.; Kang, J.Y.; Park, H.B. Strengthening effect of prestressed near-surface-mounted CFRP tendon on reinforced concrete beam. Adv. Mater. Sci. Eng. 2018, 2018, 9210827. [Google Scholar] [CrossRef] [Green Version]
  2. Park, H.B.; Park, J.S.; Kang, J.Y.; Jung, W.T. Fatigue behavior of concrete beam with prestressed near-surface mounted CFRP reinforcement according to the strength and developed length. Materials. 2019, 12, 51. [Google Scholar] [CrossRef] [Green Version]
  3. Jung, W.T.; Park, J.S.; Kang, J.Y.; Keum, M.S. Flexural behavior of concrete beam strengthened by near-surface mounted CFRP reinforcement using equivalent section model. Adv. Mater. Sci. Eng. 2017, 2017, 9180624. [Google Scholar] [CrossRef] [Green Version]
  4. Kim, S.H.; Park, S.Y.; Park, Y.H.; Jeon, S.J. Friction characteristics of post-tensioning tendons in full-scale structures. Eng. Struct. 2019, 183, 389–397. [Google Scholar] [CrossRef]
  5. Kim, S.H.; Park, S.Y.; Jeon, S.J. Long-term characteristics of prestressing force in post-tensioned structures measured using smart strand. Appl. Sci. 2020, 10, 4084. [Google Scholar] [CrossRef]
  6. Potson, R.W.; Frank, K.H.; West, J.S. Enduring strength. Civil. Eng.-ASCE 2003, 73, 58–63. [Google Scholar]
  7. Lee, H.Y.; Jung, W.T.; Chung, W.S. Field test of an old RC bridge before and after NSM strengthening. Comp. Struct. 2018, 202, 793–801. [Google Scholar] [CrossRef]
  8. Lee, H.Y.; Jung, W.T.; Chung, W.S. Flexural strengthening of reinforced concrete beams with pre-stressed near surface mounted CFRP systems. Comp. Struct. 2017, 163, 1–12. [Google Scholar] [CrossRef]
  9. Lee, H.Y.; Jung, W.T.; Chung, W.S. Post-tension near-surface-mounted strengthening systems of full-scale PSC girders. Constr. Build. Mater. 2017, 151, 71–82. [Google Scholar] [CrossRef]
  10. Lee, H.Y.; Jung, W.T.; Chung, W. Post-tension near-surface mounted strengthening system for reinforced concrete beams with changes in concrete condition. Compos. Part B Eng. 2019, 161, 514–529. [Google Scholar] [CrossRef]
  11. Jung, W.T.; Park, J.S.; Kang, J.Y.; Keum, M.S.; Park, Y.H. Flexural behaviour of RC beams strengthened with prestressed CFRP NSM tendon using new prestressing system. Int. J. Polym. Sci. 2017, 2017. [Google Scholar] [CrossRef] [Green Version]
  12. Herbrand, M.; Classen, M. Shear tests on continuous prestressed concrete beams with external prestressing. Struct. Concr. 2015, 16, 428–437. [Google Scholar] [CrossRef]
  13. Pisani, M.A. Behaviour under long-term loading of externally prestressed concrete beams. Eng. Struct. 2018, 160, 24–33. [Google Scholar] [CrossRef]
  14. Senthil, R.; Manisekar, R. Ultimate flexural behaviour of externally prestressed new beams and distressed beams. J. Eng. Sci. Technol. 2015, 10, 461–484. [Google Scholar]
  15. Kaur, H.; Singh, J. A review on external prestressing in concrete. Int. Res. J. Eng. Technol. 2017, 4, 1801–1805. [Google Scholar]
  16. Li, Y.Y.; Guo, B.; Liu, J. Research on reinforced concrete beam enlarged cross section method experiment and finite element simulation. Appl. Mech. Mater. 2014, 638, 208–213. [Google Scholar] [CrossRef]
  17. Lee, B.J.; Park, J.K.; Kim, M.Y.; Shin, H.M.; Park, C.H. Experimental study on flexural behavior of PSC I girder and the effect of external prestressing. J. Korea Concr. Inst. 2007, 19, 755–762. [Google Scholar]
  18. Xue, W.; Tan, Y.; Peng, F. Experimental study on damaged prestressed concrete beams using external post-tensioned tendons. ACI Struct. J. 2020, 117, 159–168. [Google Scholar] [CrossRef]
  19. Oh, B.H.; Kim, K.S. Ultimate behavior and load distribution characteristics of prestressed concrete girder bridge. J. KSCE 2001, 21, 761–771. [Google Scholar]
  20. Han, M.Y.; Park, S.K. A strengthening method of PSC girder using external prestressing and glass fiber reinforcement. J. Korea Concr. Inst. 1999, 19, 387–395. [Google Scholar]
  21. Naaman, A.E.; Burns, N.H.; French, C.; Gamble, W.L.; Mattock, A.H. Stresses in unbonded prestressing tendons at ultimate: Recommendation. ACI Struct. J. 2002, 99, 518–529. [Google Scholar]
  22. Naaman, A.E.; Aldhairi, F.M. Stress at ultimate in unbonded post-tensioning tendon: Part 1-Evaluation of the state of the art. ACI Struct. J. 1991, 85, 641–650. [Google Scholar]
  23. Naaman, A.E.; Aldhairi, F.M. Stress at ultimate in unbonded post-tensioning tendon: Part 2-Proposed methodology. ACI Struct. J. 1991, 88, 683–690. [Google Scholar]
  24. Ozkul, O.; Nassif, H.; Tanchan, P.; Harajli, M.H. Rational approach for prediction stress in beams with unbonded tendons. ACI Struct. J. 2008, 105, 338–347. [Google Scholar]
  25. Kim, S.H.; Park, J.S.; Jung, W.T.; Kim, T.K.; Park, H.B. Experimental study on strengthening effect analysis of a deteriorated bridge using external prestressing method. Appl. Sci. 2021, 11, 2478. [Google Scholar] [CrossRef]
  26. Carin, L.; Jose, A.; John, E.; Michael, E. Field measurements of prestress losses in external tendons. ACI Struct. J. 1996, 93, 596–601. [Google Scholar]
  27. Carin, L.; Michael, E.; David, M.; John, E. Stresses in external tendons at ultimate. ACI Struct. J. 2005, 102, 206–213. [Google Scholar]
  28. Aparicio, A.C.; Ramos, G.; Casas, J.R. Testing of externally prestressed concrete beams. Eng. Struct. 2002, 24, 73–84. [Google Scholar] [CrossRef]
  29. Russell, B.W.; Burns, N.H. Measured transfer lengths of 0.5 and 0.6 in. strands in pretensioned concrete. PCI J. 1996, 41, 44–65. [Google Scholar] [CrossRef]
  30. Shenoy, C.V.; Gregory, C.F. Structural tests of 27-year-old prestressed concrete bridge beams. PCI J. 1991, 36, 80–90. [Google Scholar] [CrossRef]
  31. Pessiki, S.; Kaczinski, M.; Wescott, H.H. Evaluation of effective prestress force in 28-year-old prestressed concrete bridge beams. PCI J. 1996, 41, 78–89. [Google Scholar] [CrossRef]
  32. Tabatabai, H.; Dickson, T.J. Structural evaluation of a 34-year-old precast post-tensioned concrete girder. PCI J. 1993, 38, 50–63. [Google Scholar] [CrossRef]
  33. Harajli, M.H.; Mabsout, M.E.; Al-Hajj, J.A. Response of externally post-tensioned continuous members. ACI Struct. J. 2002, 99, 671–680. [Google Scholar]
  34. Nilson, A.H. Design of Prestressed Concrete, 2nd ed.; John Wiley & Sons, Inc.: Hoboken, NJ, USA, 1987; pp. 255–277. [Google Scholar]
Figure 1. Specimen specifications (unit: mm): (a) non-strengthened specimen and (b) strengthened specimen.
Applsci 11 02553 g001
Figure 2. Name of specimen.
Applsci 11 02553 g002
Figure 3. Concrete compressive strength.
Applsci 11 02553 g003
Figure 4. Detail of anchor plate (unit: mm): (a) bottom plate and (b) side plate.
Applsci 11 02553 g004
Figure 5. Anchorage installation step: (a) bottom plate anchor hole drilling; (b) side plate anchor hole drilling; (c) anchor bolt construction; and (d) bottom and side plate welding.
Applsci 11 02553 g005
Figure 6. Load and sensor position.
Applsci 11 02553 g006
Figure 7. Failure shape: (a) non-strengthened specimen and (b) strengthened specimen.
Applsci 11 02553 g007
Figure 8. Detachment of anchorage and anchor bolt installation shape (unit: mm): (a) detachment of anchorage and (b) anchor bolt installation in section.
Applsci 11 02553 g008
Figure 9. Load–displacement relationship: (a) non-strengthened specimen and (b) strengthened specimen.
Applsci 11 02553 g009
Figure 10. Load–strain relationship: (a) C40-D22 specimen; (b) C40-D19 specimen; (c) C20-D22 specimen; and (d) C20-D19 specimen.
Applsci 11 02553 g010aApplsci 11 02553 g010b
Figure 11. Comparison of strengthening effects.
Applsci 11 02553 g011
Table 1. Experimental variables.
No. Name of SpecimenConcrete Compressive Strength (MPa)Reinforcement Quantity D (mm)-eaStrengthening Status
1C40-D22-NS4022-3-
2C40-D19-NS4019-3-
3C20-D22-NS2022-3-
4C20-D19-NS2019-3-
5C40-D22-EP4022-3External prestressing
6C40-D19-EP4019-3External prestressing
7C20-D22-EP2022-3External prestressing
8C20-D19-EP2019-3External prestressing
Table 2. Results of introducing external prestress force.
No. Name of SpecimenDesign Pe (kN)Measured Pe(kN)
T1T2
5C40-D22-EP10082 (82%)78 (78%)
6C40-D19-EP10069 (69%)69 (69%)
7C20-D22-EP5032 (64%)28 (56%)
8C20-D19-EP5033 (66%)35 (70%)
Table 3. Experimental results.
No. Name of SpecimenCrack (Pcr, kN)Yield (Py, kN)Failure (Pu, kN)
DesignMeasuredDesignMeasuredDesignMeasured
1C40-D22-NS52.753.9 (102%)162.7188.9 (116%)182.1217.1 (119%)
2C40-D19-NS52.757.7 (109%)116.4143.1 (123%)127.3163.5 (128%)
3C20-D22-NS33.930.9 (91%)161.0184.9 (115%)165.6200.6 (121%)
4C20-D19-NS33.931.2 (92%)115.7134.4 (116%)118.9155.4 (131%)
5C40-D22-EP97.1135.3 (139%)272.4303.1 (111%)250.9350.2 (140%)
6C40-D19-EP103.7128.9 (124%)235.2270 (115%)205.7291.4 (142%)
7C20-D22-EP55.860.7 (109%)241.3253.6 (105%)247.1322.3 (130%)
8C20-D19-EP58.958.9 (100%)200.0214.3(107%)200.2244.9 (122%)
Publisher’s Note: MDPI stays neutral with regard to jurisdictional claims in published maps and institutional affiliations.

