1. Introduction
Wood is a natural inhomogeneous anisotropic material with discontinuities due to defects as, for example, pitch pockets, branches and fibre twist. When used for building construction, the original material undergoes multistage sorting and processing [
1,
2,
3]. These processes, and if applied gluing, allow for a compensation of the defects, resulting in smoother and consequently better material properties [
4,
5]. In addition, subsequent geometry changes due to an adjustment of the equilibrium moisture can be reduced [
6]. The drawback regarding these products is that the production process is accompanied by many subtractive machining operations. The yield rate sinks to 25–35% within the processing of the tree trunk into the finished building component. Consequently, good mechanical properties and advantageous behaviour regarding geometric deformations are the opposite of a low yield of the raw material.
Compared to other construction materials, timber has advantageous properties regarding the CO
2 footprint as it is able to store part of the CO
2 that was absorbed within the growing phase of the trees. Nevertheless, the energy for transport and processing is still mainly produced by burning fossil fuels. Apart from that, wood is a growing natural material with superior properties but a limited resource. Thus, the growth rate combined with sustainable forestry limits maximum harvesting. In Austria, for example, according to the Austrian Research Centre for Forests, 46.2% of the total country area is covered with wood with still a rising trend. Nevertheless, the increasing use of wood currently necessitates an import percentage of 40%. Many literature sources refer to the possibility of buildings to be a serious sink of CO
2, called the building sink effect (BSE) [
7,
8]. However, within an objective view, the share of the stored CO
2 compared to the human-caused CO
2 is currently significantly below 1% [
9]. Thus, an increased use of wood has a positive but limited influence on the CO
2 balance but, in any case, only if it goes along with sustainable forestry. Unfortunately, contrary examples do not confirm this basic need. In [
10], for example, an abrupt increase in the harvested forest area over Europe after 2015 is described. To sum up this discussion, if timber is used as a construction material, minimisation of the quantity of material is a basic requirement.
Based on these facts, it can be clearly shown that structural optimisation of building components is of the highest importance for efficient use of wood. Unfortunately, this basic principle is being ignored by the wood construction industry in industrialised countries. These countries currently clearly focus on saving costs rather than natural resources, since material costs are low in comparison to the high costs for personnel. Elements produced using industrialised manufacturing processes are cheaper and are therefore preferred by construction companies over resource-saving but more complicated structures. A specific example is the extensive use of cross-laminated timber as mass-produced construction material for the use as plate girders. Wooden trusses, for example, are rarely implemented nowadays and have been replaced by plate girders due to economic reasons, even though the material yield rate is comparatively lower [
11].
The aim of the authors is to industrialise the design and production process of wood structures in order to allow for more efficient usage of valuable wood, while still being economically feasible. The authors have split the research development into three subprocesses: (1) optimisation of the geometry of supporting structures, (2) optimisation of joints and (3) optimisation of the production technology and the interface between computer-aided design (CAD) and computer-aided manufacturing (CAM). (1) and (2) are addressed in this paper. A detailed presentation of structural optimisation, load-bearing mechanisms of joints, as well as the full-scale load-bearing behaviour of the introduced structures will be published separately.
Regarding material use, the authors focus within the presented strategy on solely using wood for all construction parts, including connections. This has three major, quantifiable, benefits: (1) reduction of costs since steel parts have a major impact on the total costs of timber trusses, (2) improvement of the ecologic impact as steel production and processing consumes considerably more energy (currently mostly produced by using fossil fuels) and (3) improvement of fire resistance as steel parts heat up and have therefore a negative impact on the load-bearing behaviour [
12,
13].
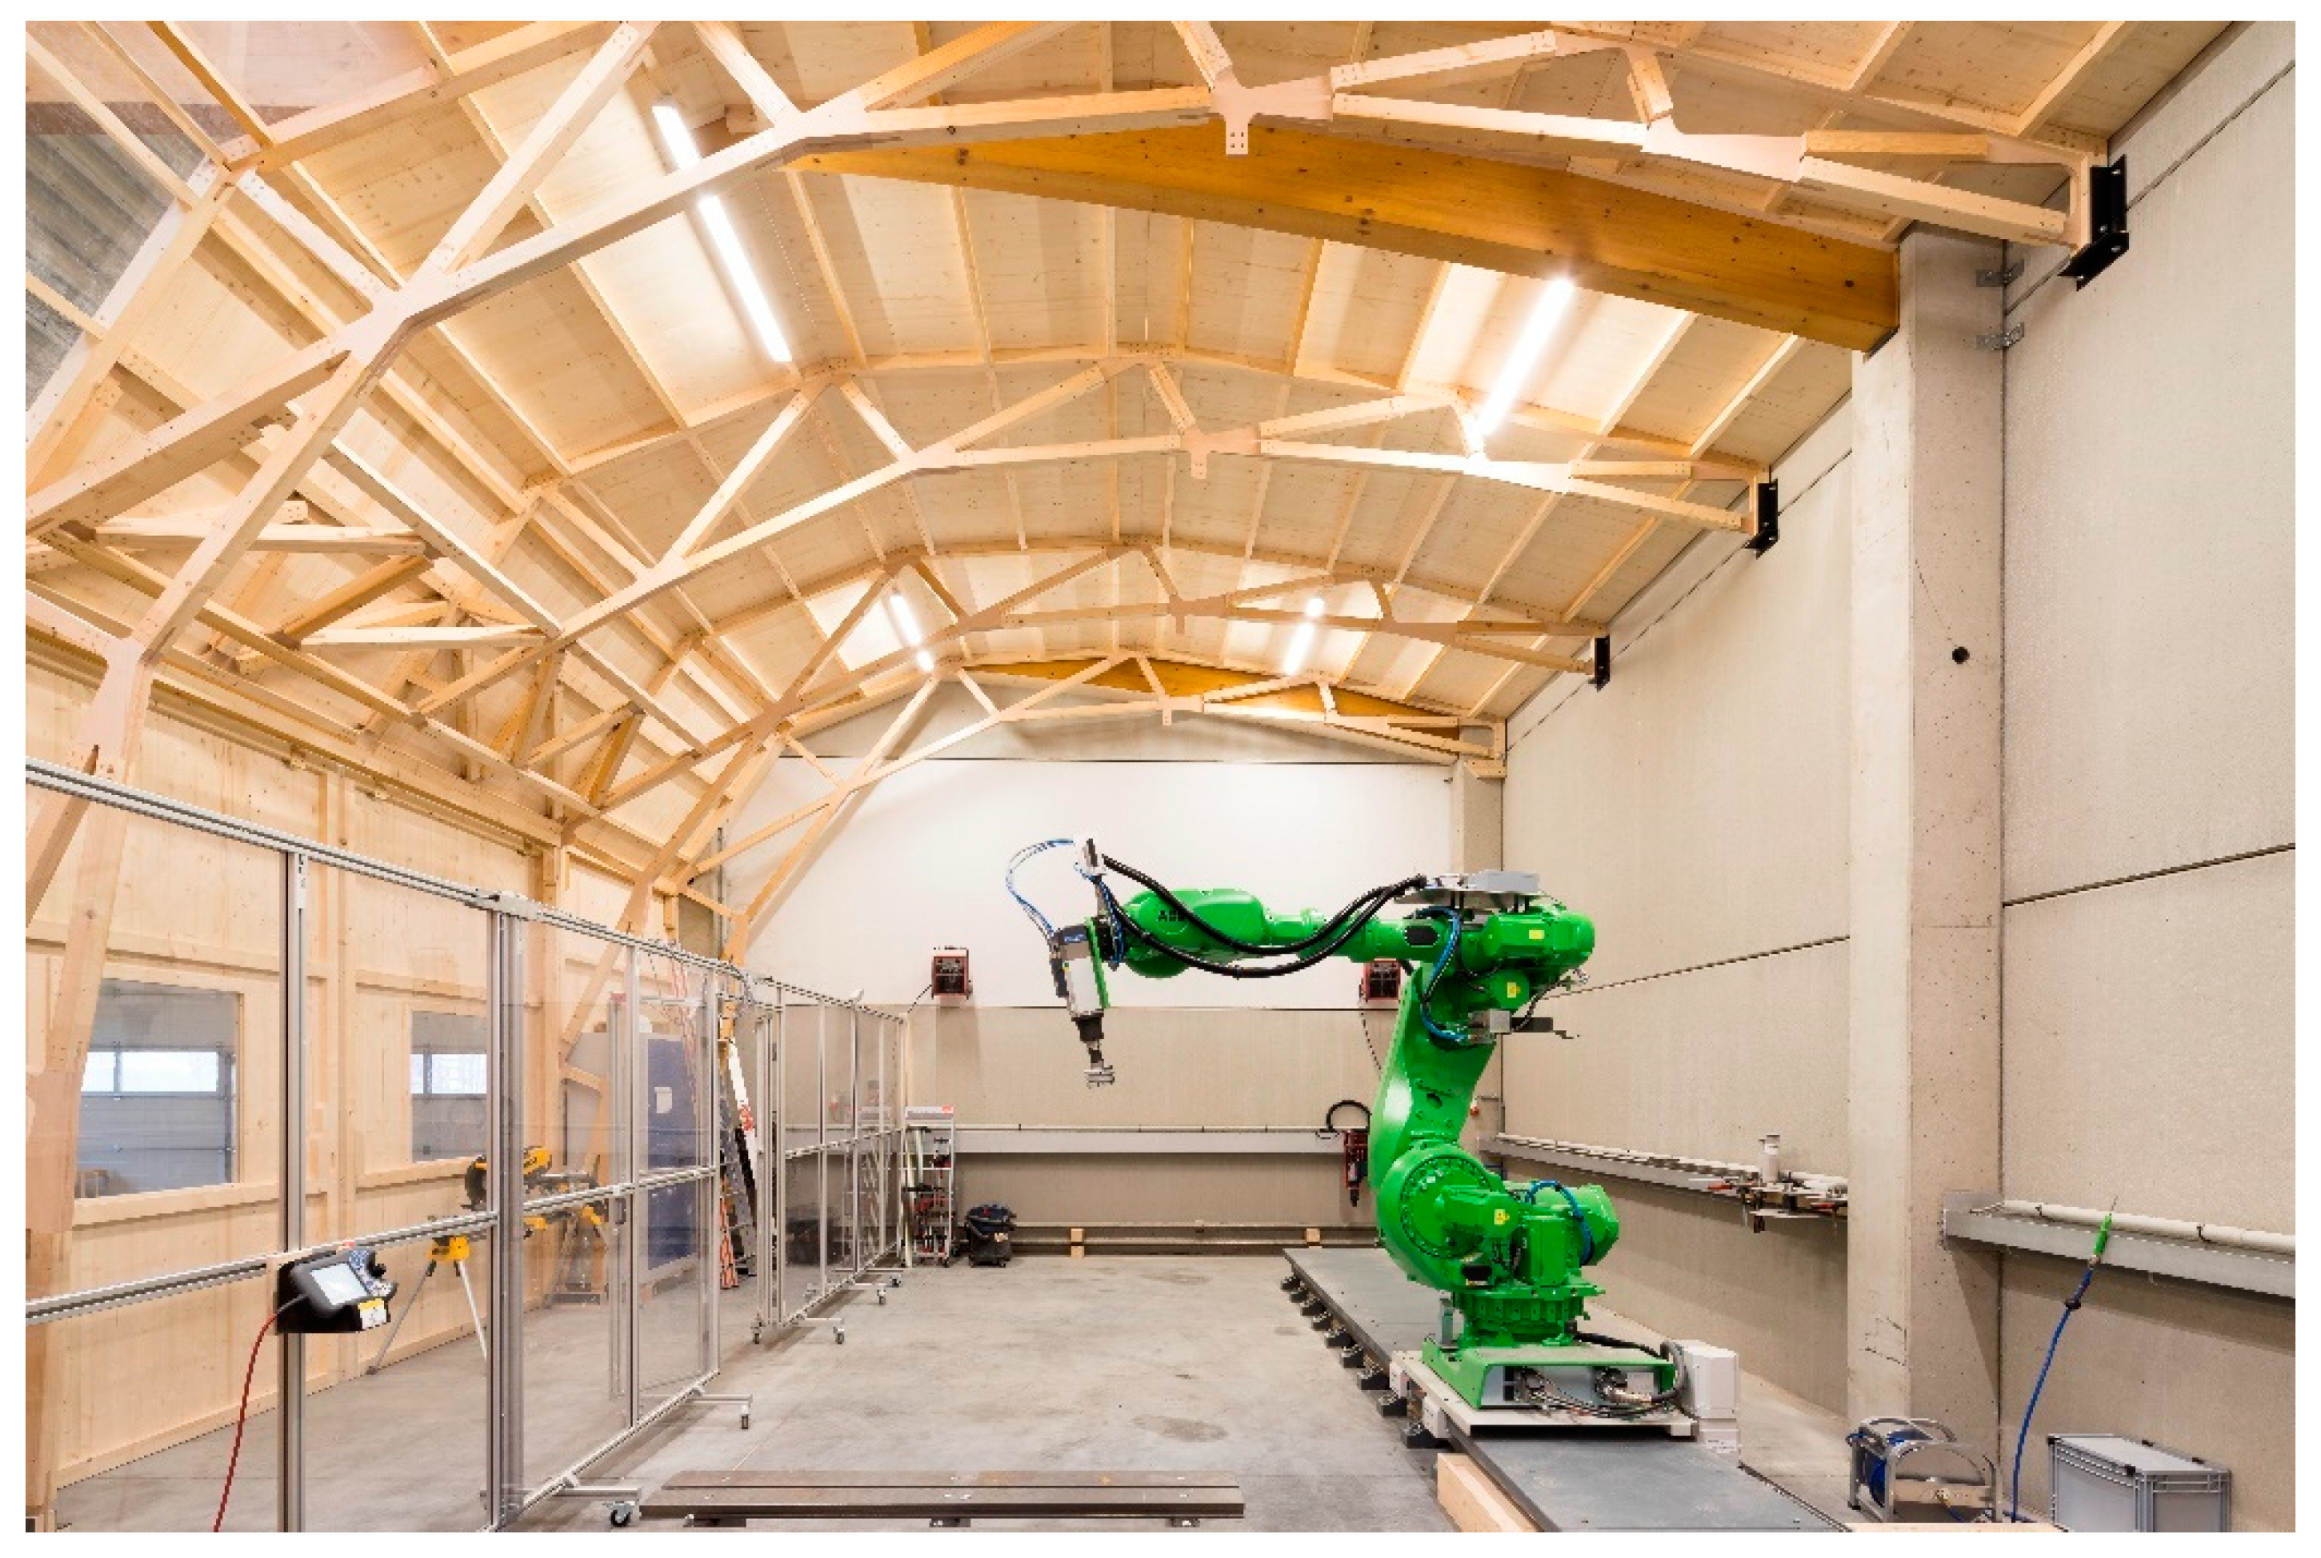
BOKU Vienna recently set up a new robot laboratory intended for investigations of different numerical controlled subtractive and additive manufacturing processes. The housing of the robot laboratory was part of the current research strategies and serves as a case study.
2. Parametric Design and Optimisation
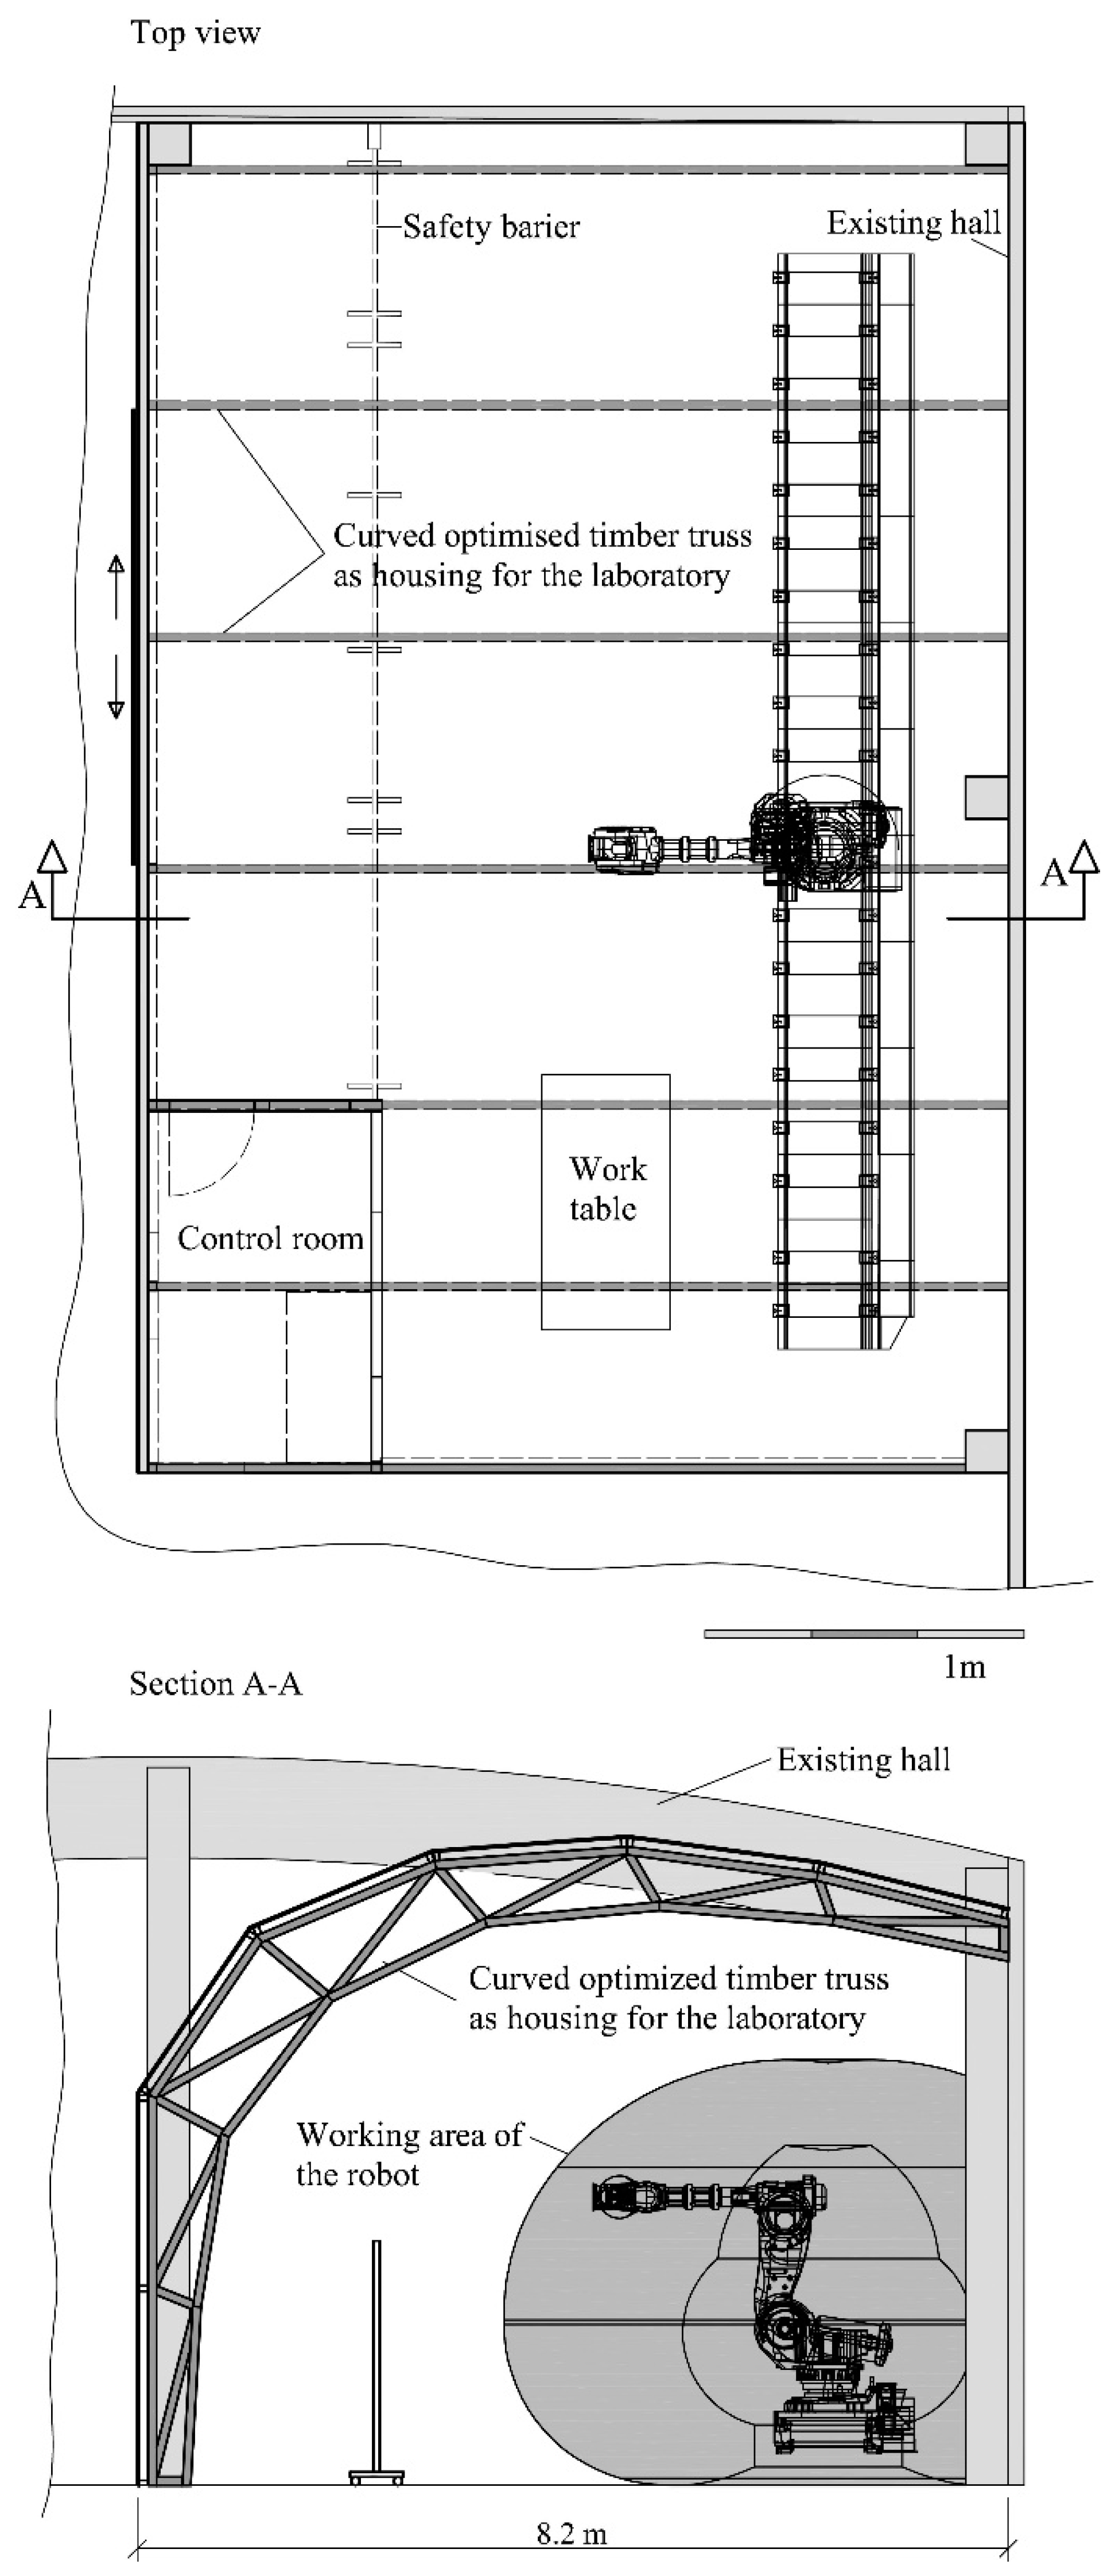
The fundamental idea for the new robot laboratory was the robot arm, which was set up first to build its own housing. The shape of the housing was designed according to the working area of the robot, as shown in Section A-A of
Figure 1. The main supporting structure was executed as a curved truss solely made from wood without using any steel components. To design the construction, the plug-in Grasshopper [
14] of the CAD software Rhinoceros [
15] was used. Based on available known optimisation strategies, the built-up parametric model was used for the optimisation of the truss. The following parameters were defined as variables: number of subdivisions, distance between subdivisions, alignment of diagonal members and cross section of the members of the truss. The main goal of optimisation was to minimise the mass (and in general the environmental impact), while still obtaining the desired load-bearing behaviour.
2.1. Grasshopper Evolutionary Algorithm Galapagos
Grasshopper’s evolutionary solver Galapagos was used to determine the most efficient truss by varying the previously mentioned geometric parameters. A similar application with focus on the optimisation of a truss frame subjected to wind is described in [
16]. The use of the basic tool set for the optimisation of trusses is also explained in [
17]. The optimisation strategy of the solver is based on the principle of genetic evolution and consists of five steps to optimise a so-called fitness value [
18]. The fitness value represents the numerical parameter that can be optimised by the solver. The goal is to either minimise or maximise the fitness value. In this project, a simple, single-objective optimisation was applied, with only one numerical value being optimised in the calculation process at a time.
Here, the five optimisation steps of the evolutionary solver are briefly explained. (1) An initial population (different trusses) is randomly assembled by the algorithm from the single slider variables. (2) The fitness values of the resulting trusses are evaluated and qualitatively ranked according to their performance. (3) In the next step, trusses are chosen by the algorithm according to a determined selection procedure for further analysis. (4) The variables of the selected trusses are then recombined similar to genetic reproduction in order to obtain better solutions for the structure. (5) Steps (3) and (4) are repeated until one of the three abort criteria (calculation time exceeded, no improvement, best result achieved) is reached.
2.2. Optimisation Strategy and Dimensioning According to EC 5
The aim of the optimisation was to achieve the lowest-possible wood consumption, while maintaining the same static load-bearing capacity and complying with the requirements regarding serviceability (deformation). The internal forces of the structure were calculated using the plug-in Karamba3D [
19]. The static calculations were conducted according to Eurocode 5 (EN1995-1-1:2019-06-01) and the current Austrian application document within a separately integrated self-programmed tool-box. In addition to the calculation of the deformation of the truss, buckling and cross-section analysis were carried out. The calculation focused on the individual truss members based on a 2D model that prohibits any global buckling of the structure (the nodes were modelled in 2D and therefore fixed out of plane). The truss nodes were assumed to be ideally rotatable as a conservative assumption. The later chosen knot design represents a semi-rigid joint.. The influence on the global load-bearing behaviour and therefore on the optimisation was assumed to be low as preparatory tests showed that the joint design, especially the tensile behaviour, is decisive for the maximum load-bearing capacity of the truss. A ductile failure occurs in the connection, as the small-scale experiments presented below show. Large deformations are visible before failure. An additional torsion has only a minor influence on the ultimate load-bearing behaviour of the connection. This proves that the chosen calculation approach is adequate for this approach. The final truss design was also cross-checked with the conventional finite-element-modelling software Rstab (Dlubal). A full-scale test also showed very good accordance between the calculation and the actual behaviour. If stability is decisive for the maximum load-bearing behaviour, more investigations are required.
2.3. Reference Model
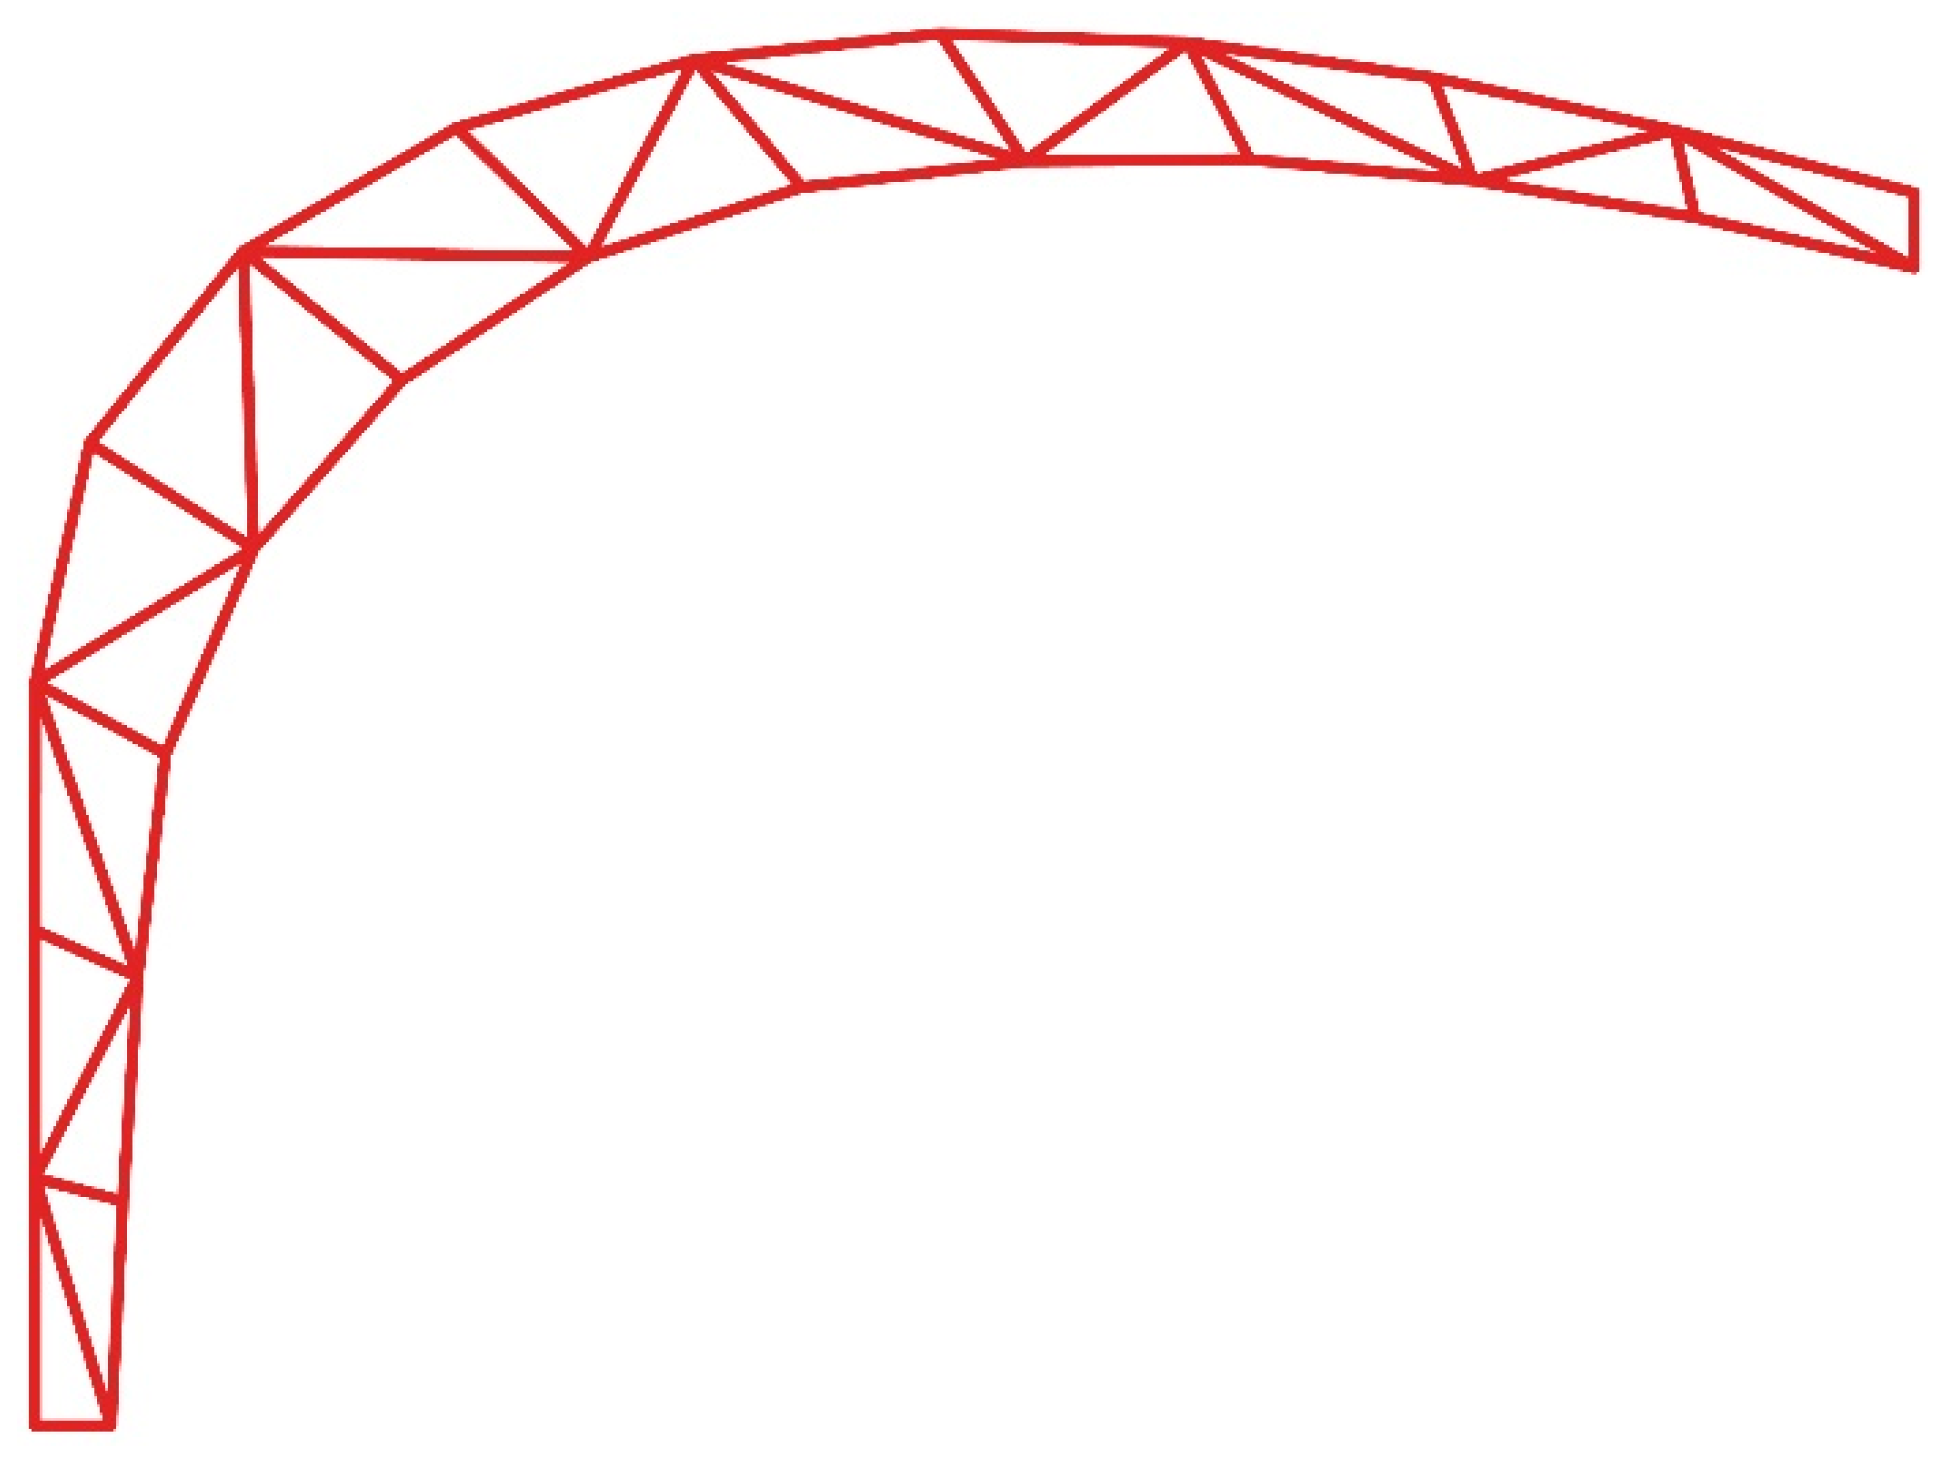
In the beginning, a first version of the truss, as shown in
Figure 2, was conceptualised based on the authors’ engineering know-how. The predefined floor area, the existing roof of the hall as well as the working area of the robot served as boundary conditions. The mentioned first truss design was used as a reference model for all the results of the optimisation. It consisted of 12 segments, alternating diagonal struts and regular spacing between the subdivisions.
2.4. Boundary Conditions
The geometry of the truss was determined by the available area in the existing hall where the robot laboratory is located. It spans from the middle of the hall, where it is fixed directly to the floor, to a support attached to the wall at a height of 4.92 m, resulting in a horizontal truss span of 8.20 m.
The geometry of the upper and lower chords is affected by several boundary conditions. The accessibility to the robot laboratory through a 3.20-m-high sliding door made it necessary for the upper chord to be vertical up to that height. The upper part of the truss, on the other hand, had to follow the shape of the existing glulam beam of the roof construction of the hall. Based on these limitations, the authors decided to focus on the optimisation of the inner structure as well as the cross section of the truss itself. Consequently, the global geometry was not part of the optimisation, and the geometries of the upper and lower chords were set as fixed curves.
The applied loads for the supporting structure consisted of the dead weight plus the load of the board panelling with 1 kN/m, which was applied to the truss at the nodes as concentrated forces. The truss is situated inside a machine hall; therefore, weather effects like snow and wind are neglected. An additional load of 3 kN was applied between 2.00 and 3.20 m from the existing machine hall wall (the wall to which the right nodes of the trusses are attached). This load is also introduced into the truss via a node and is intended to allow the attachment of cables of possible future experimental set-ups.
2.5. Optimisation Results
The results are summarised in
Table 1. Depending on which fitness value is defined and which parameters are released for optimisation, different truss configurations are generated.
The early optimisation processes were calculated with deformation as the fitness value. For these calculations, the value was set to be as low as possible. The results were very stiff trusses, with deformations smaller than 5 mm, a value of less than one-sixth of the limit of 32 mm according to Eurocode 5 (EN1995-1-1:2019-06-01). The resulting material savings of 1.4% were not considered as relevant improvements. Ultimately the deformation was only improved from 7 to 5 mm.
The next attempt was optimising the structure using the maximum absolute normal force (both compression and tensile forces) as the fitness value of the algorithm. The compression forces were considerably reduced (−22%), while the tensile forces decreased only slightly (−6%). The detailed values can be found in
Table 1. The goal of achieving an optimal structure through the minimisation of the occurring normal forces in all struts and chord members of the truss resulted in a mass reduction of 6.7%.
The optimisation was most successful when the fitness value was set as the total mass of the construction, which is directly proportional to the wood consumption. This resulted in a significant reduction of 14.9% compared to the reference model.
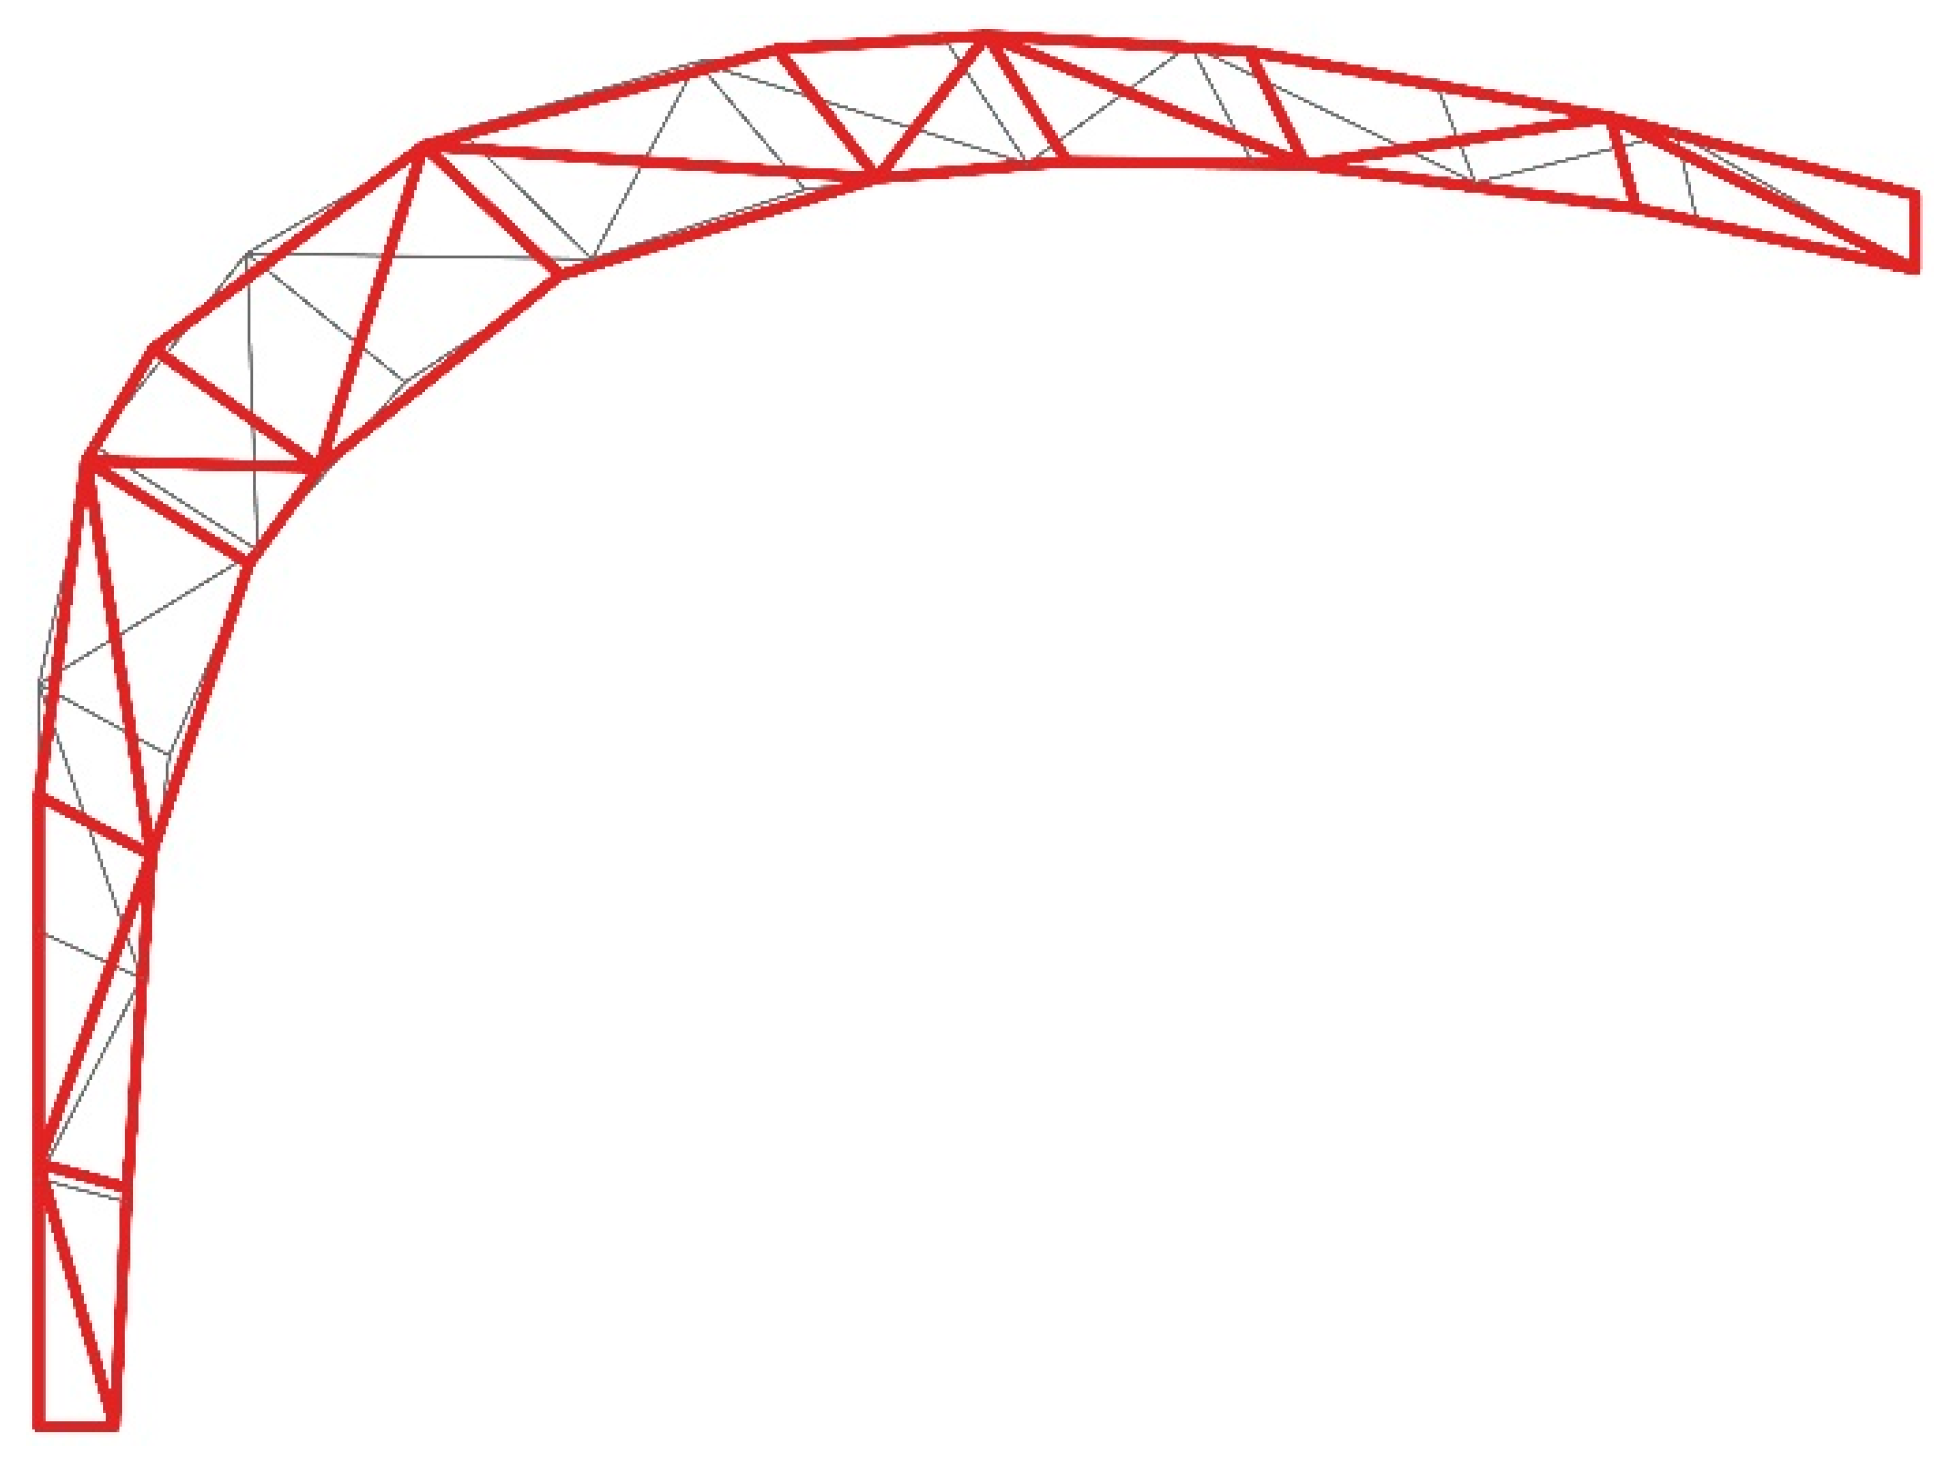
Only chosen variables were released within the optimisation for the truss configuration of the housing. The distance between the divisions was defined evenly in order to meet aesthetic requirements.
Figure 3 shows a truss with uneven distribution of the subdivisions. In addition, the cross section of the chords and struts was set to 80 × 80 mm
2 in regard to the envisaged node configuration.
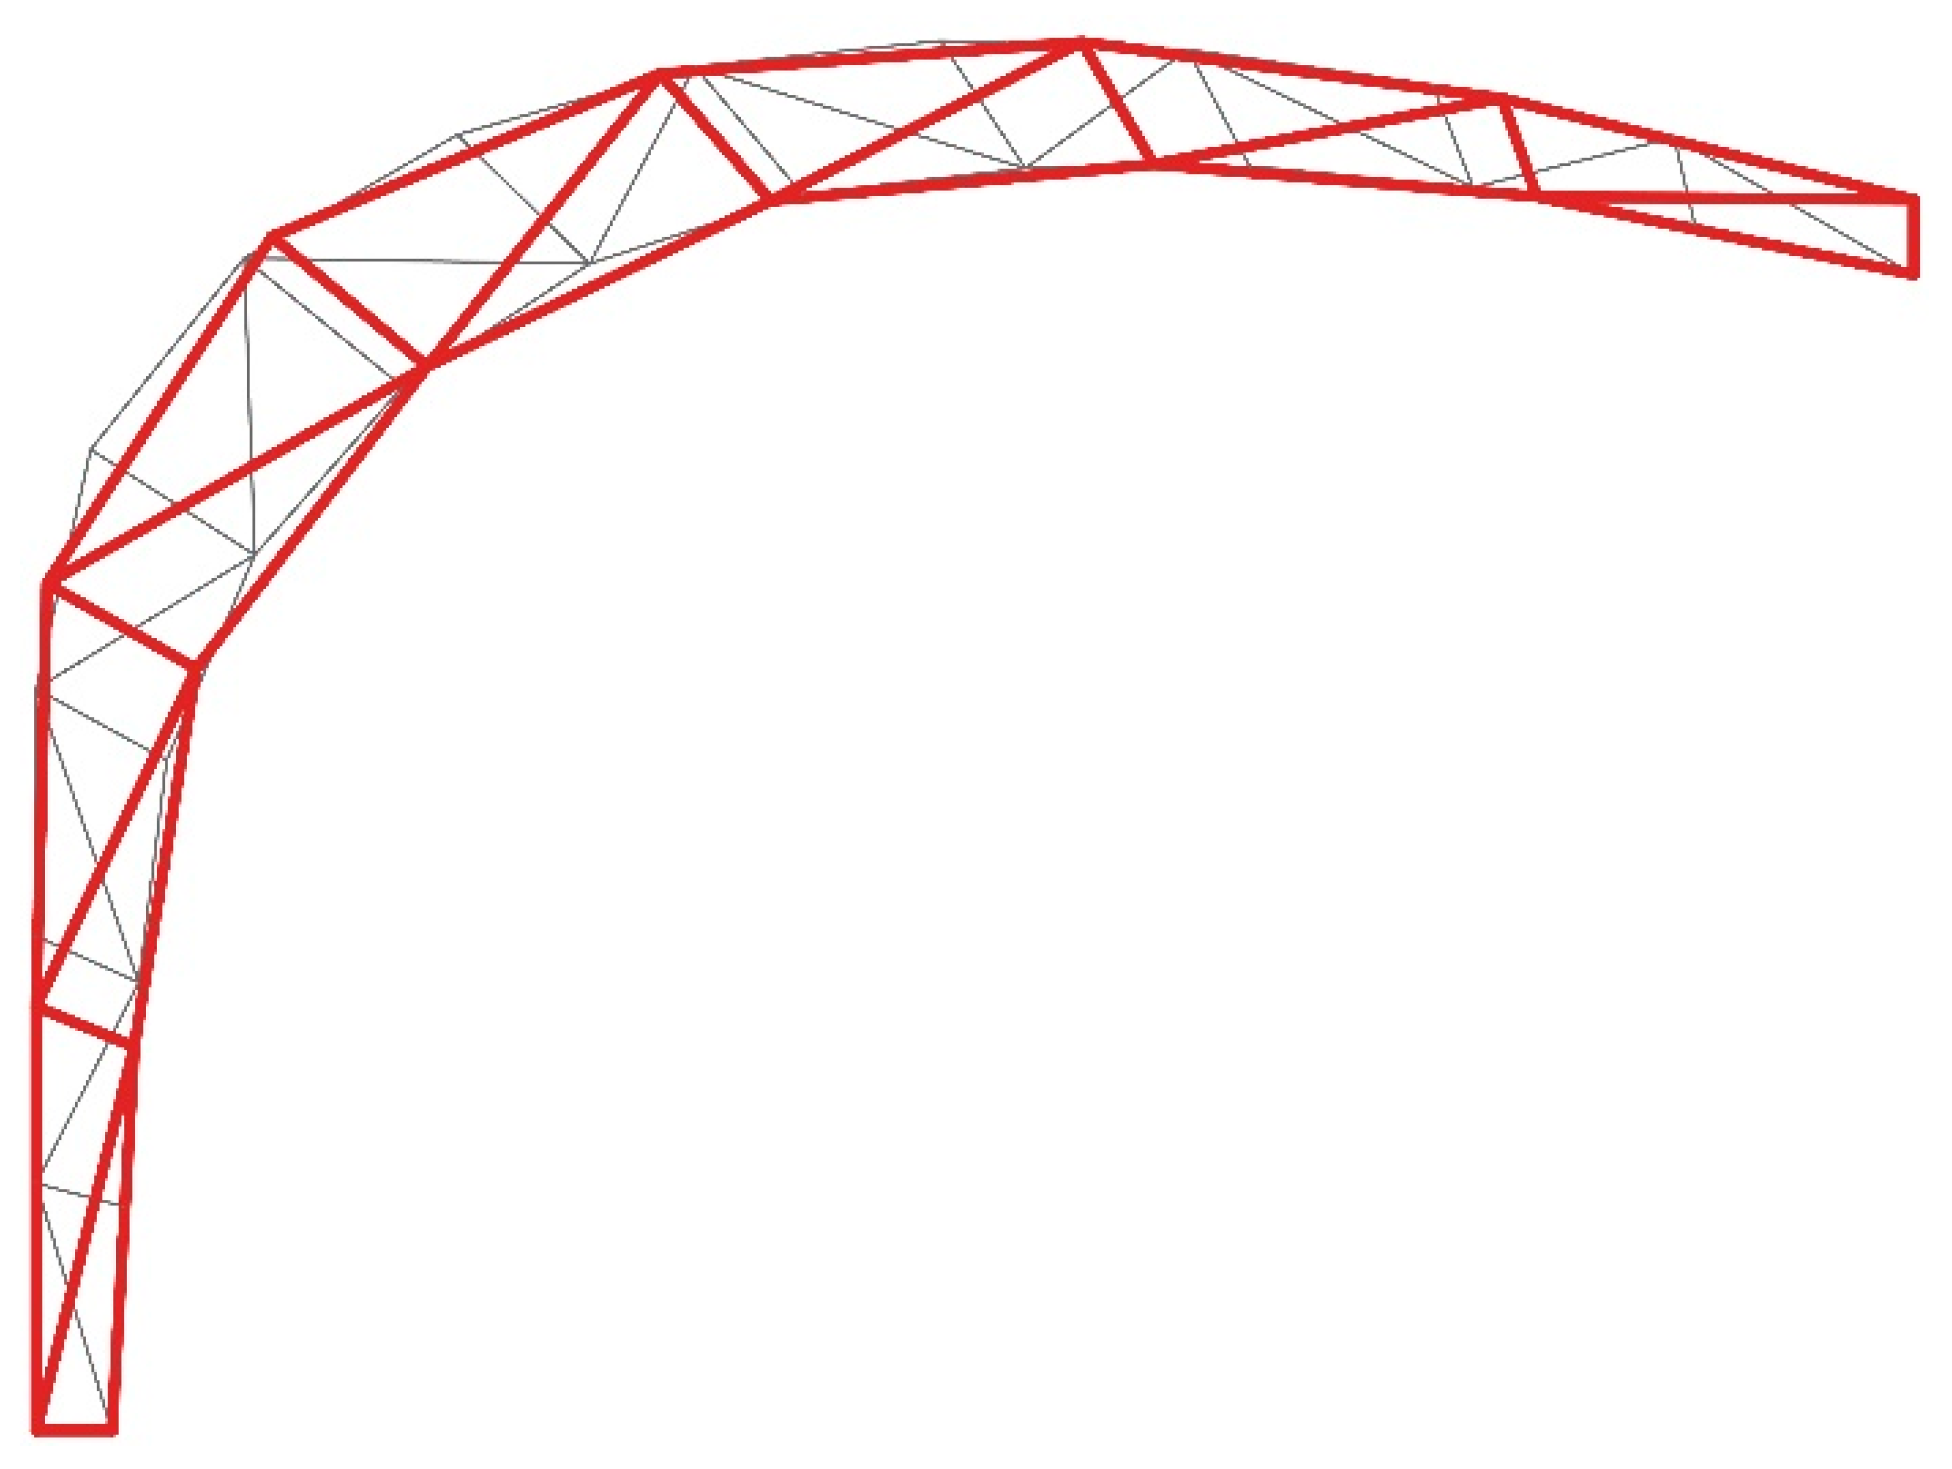
For the final implementation of the housing, shown in
Figure 1 and
Figure 4, a truss with 7 segments, regular spacing between the subdivisions and free diagonal member arrangement was defined, requiring 129.4 kg of timber, 18.1 kg less than the reference model.
If the entire truss structure is calculated on a pure theoretical basis, without the consideration of node configurations, the environmental impact can be reduced even further. By allowing the algorithm to change the cross-sectional dimensions of the chords and struts, a reduction of 60% in material consumption is possible. For this case, the truss would need more subdivisions, use smaller cross sections and have a total weight of 59.3 kg for the 8.20 m span.
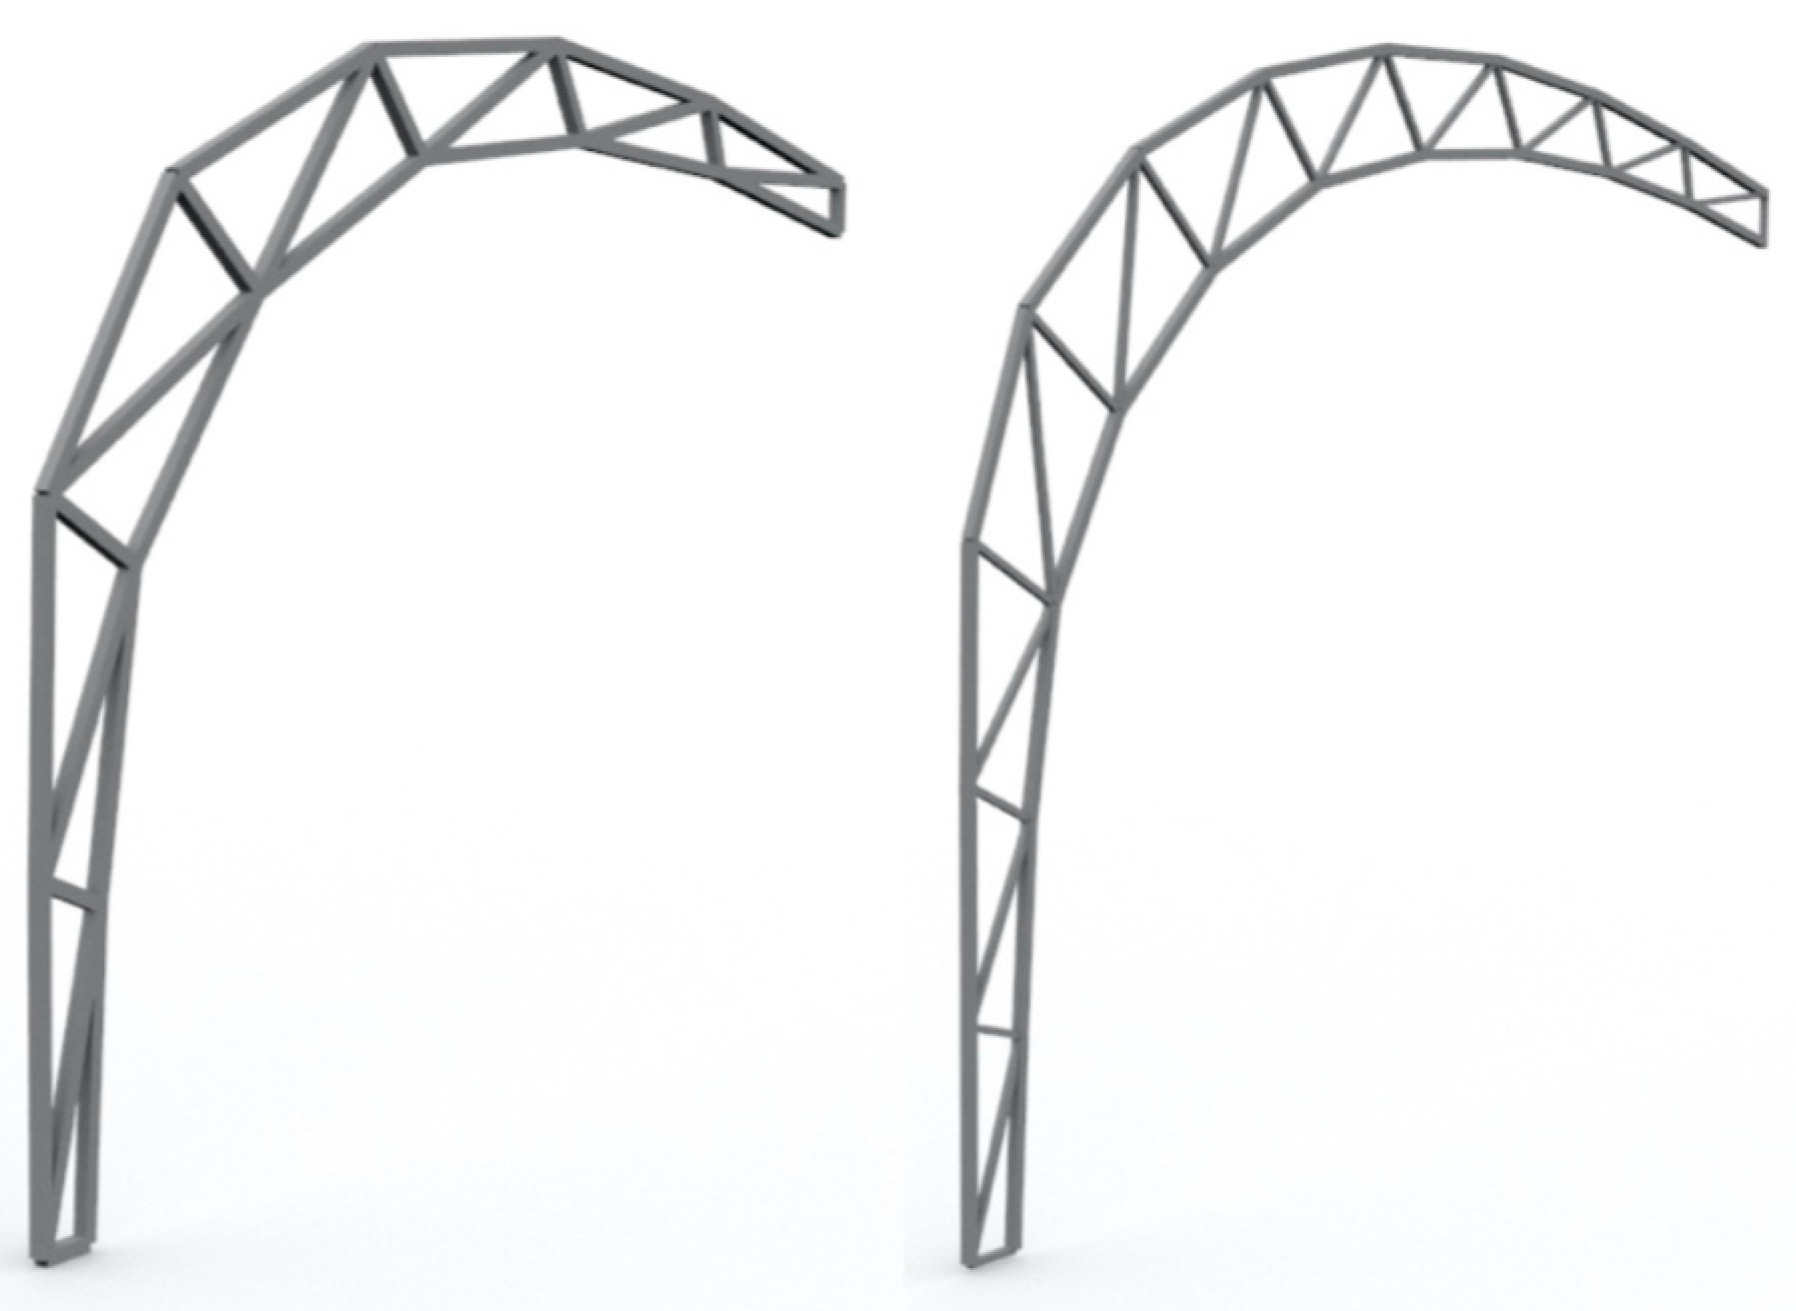
Figure 5 shows a comparison of a solution with cross section of 80 × 80 mm
2 and 7 subdivisions and the result of the rather theoretical optimisation allowing for optimisation of the cross section, leading to 11 subdivisions and cross sections of 60 × 60 mm
2 and 40 × 40 mm
2 (inner struts).
3. Joining of the Truss Members
The load-bearing behaviour of timber trusses is affected by the material properties, the geometry and the joint performance in particular. Therefore, a special focus is set on the investigation of the load-bearing behaviour of joints. The main defined requirement of the research is to transfer loads without using any steel elements. Derived from the research presented in [
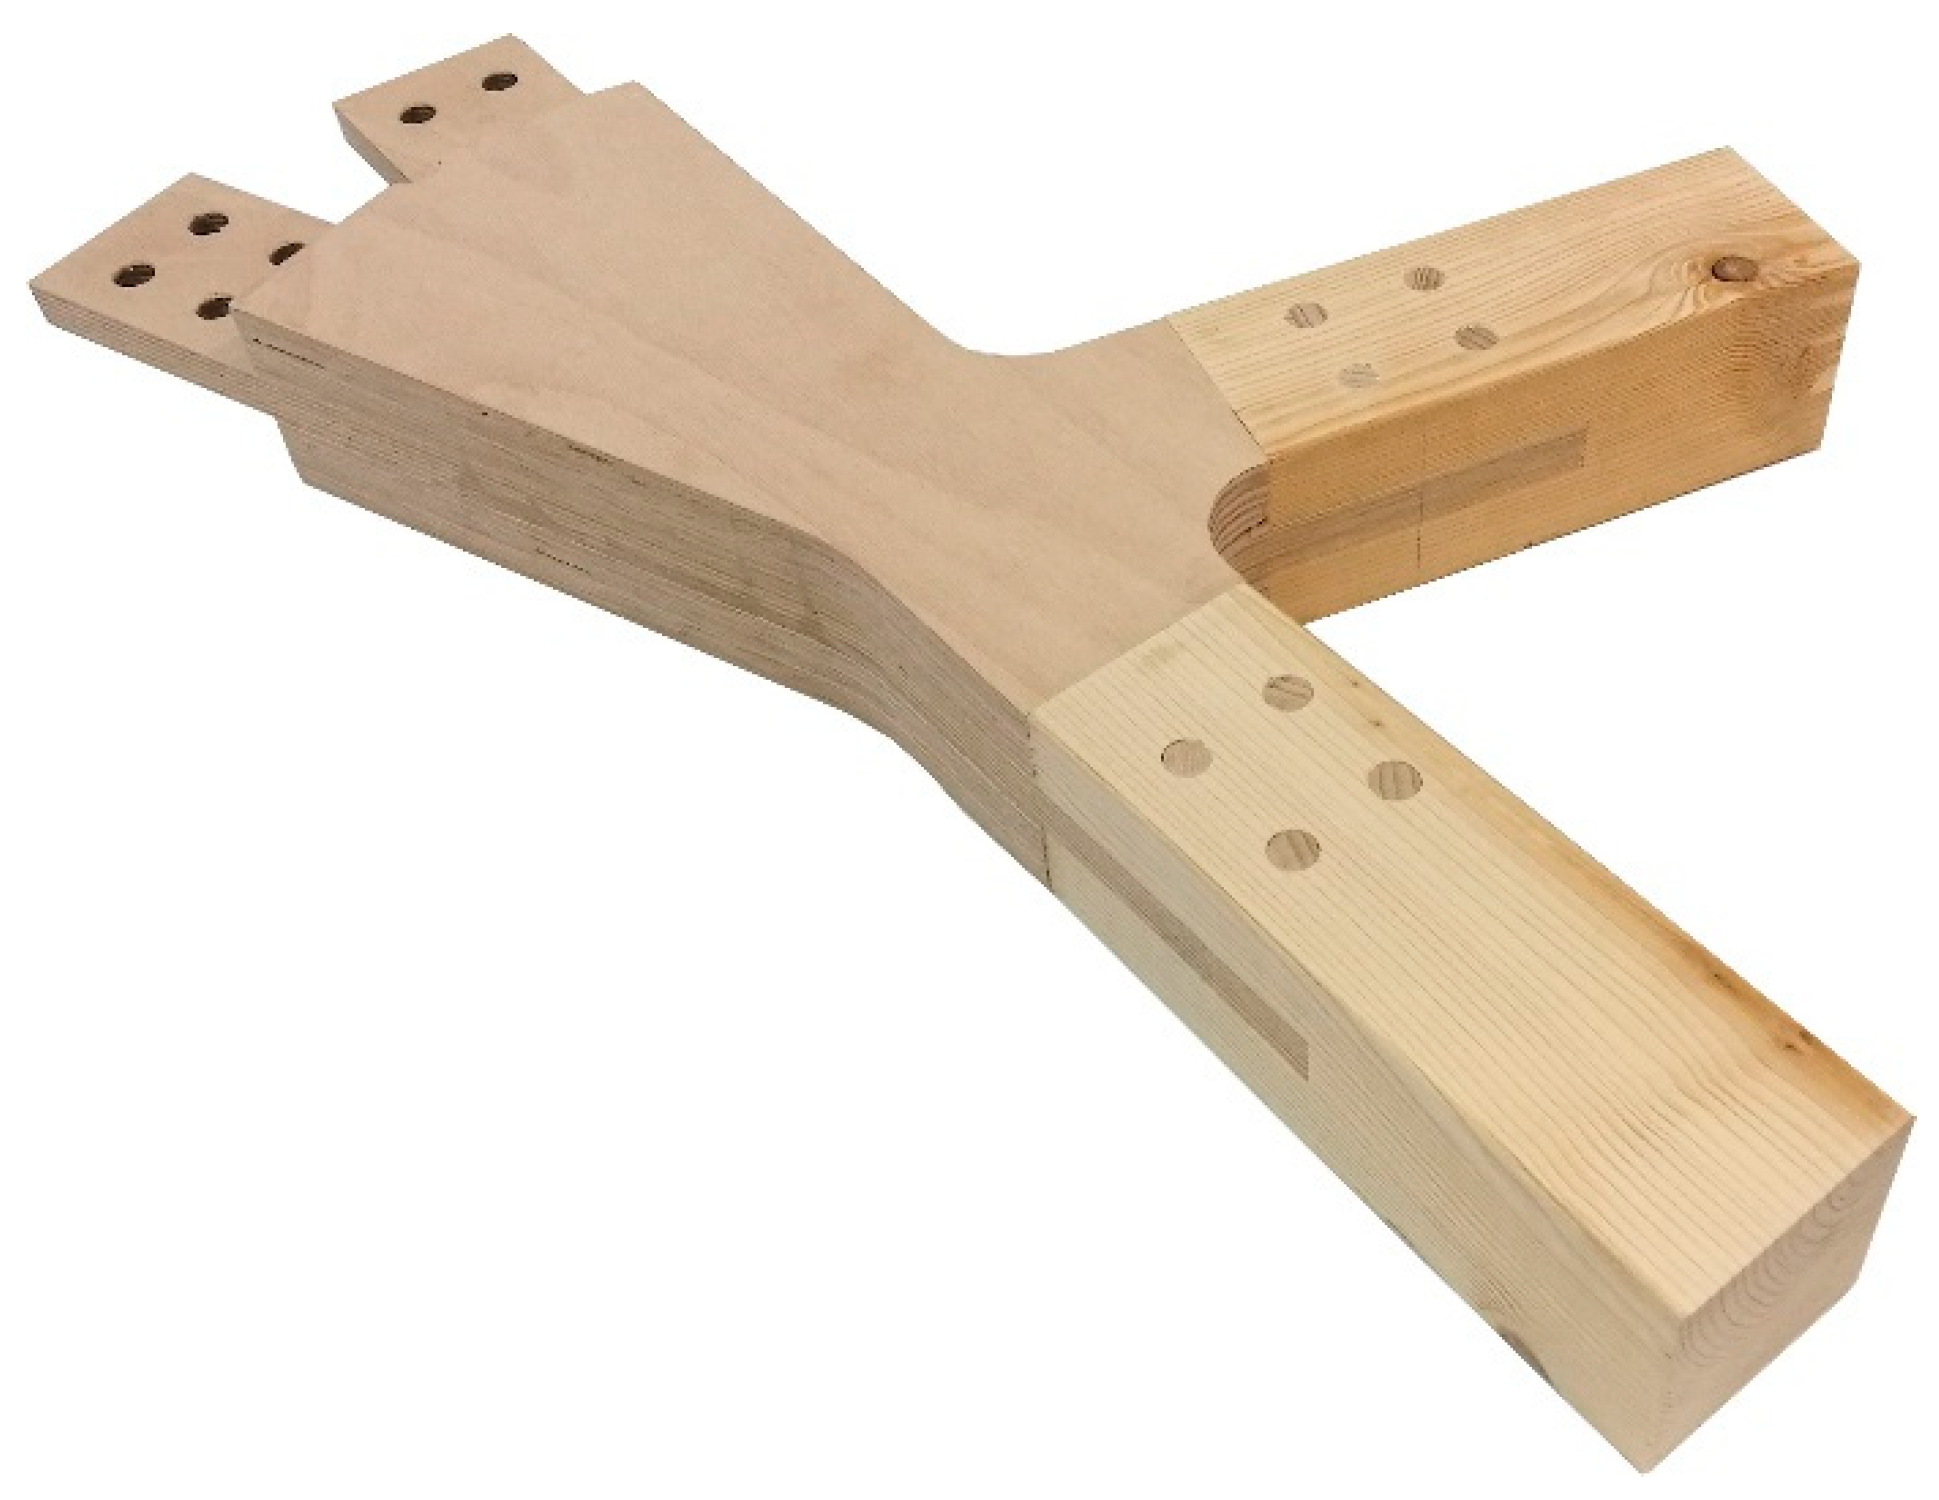
20], a node element with smooth appearance, which can easily be produced for the joining of truss members at different angles, is used. The authors chose plywood panels, which are notched into truss members and fixed with wooden pegs. This allows for the transfer of compression and tensile forces in the joint.
Most of the research with timber dowels focuses on historical constructions, as described in [
21,
22,
23,
24]. The use of timber pegs is additionally investigated in [
25,
26]. Different test methods for wooden peg connections are investigated in [
27], and a new yield model for wooden dowel connections is proposed in [
28]. However, detailed investigations for multi-row dowel connections focusing on different wood species are not available.
Therefore, the authors performed compression as well as tensile tests on the all-wood connections in order to find the optimal design and wood species and to investigate the occurring load-bearing mechanisms.
3.1. Design of the Wood–Wood Connections
For the above-mentioned curved optimised truss, spruce (C24) with a cross section of 80 × 80 mm
2 was chosen for all truss members, making this the first boundary condition for the joint design. Due to manufacturing tolerances, however, the cross sections of all provided specimens turned out to be 78 × 78 mm
2. The node elements (plates) were made from plywood panels and were inserted into the truss members and fixed with wooden pegs. According to [
29], the spacing of the pegs in the direction of force was chosen with three times the peg diameter (3d). As the cutting depth for notching the truss member for the plywood panel was limited, due to the manufacturing process, to 115 mm, the diameter of the pegs was set to 14 mm. The combination of all geometric boundary conditions resulted in a total of four pegs per connection.
3.2. Experimental Investigations of Different Wooden Pegs under Tension
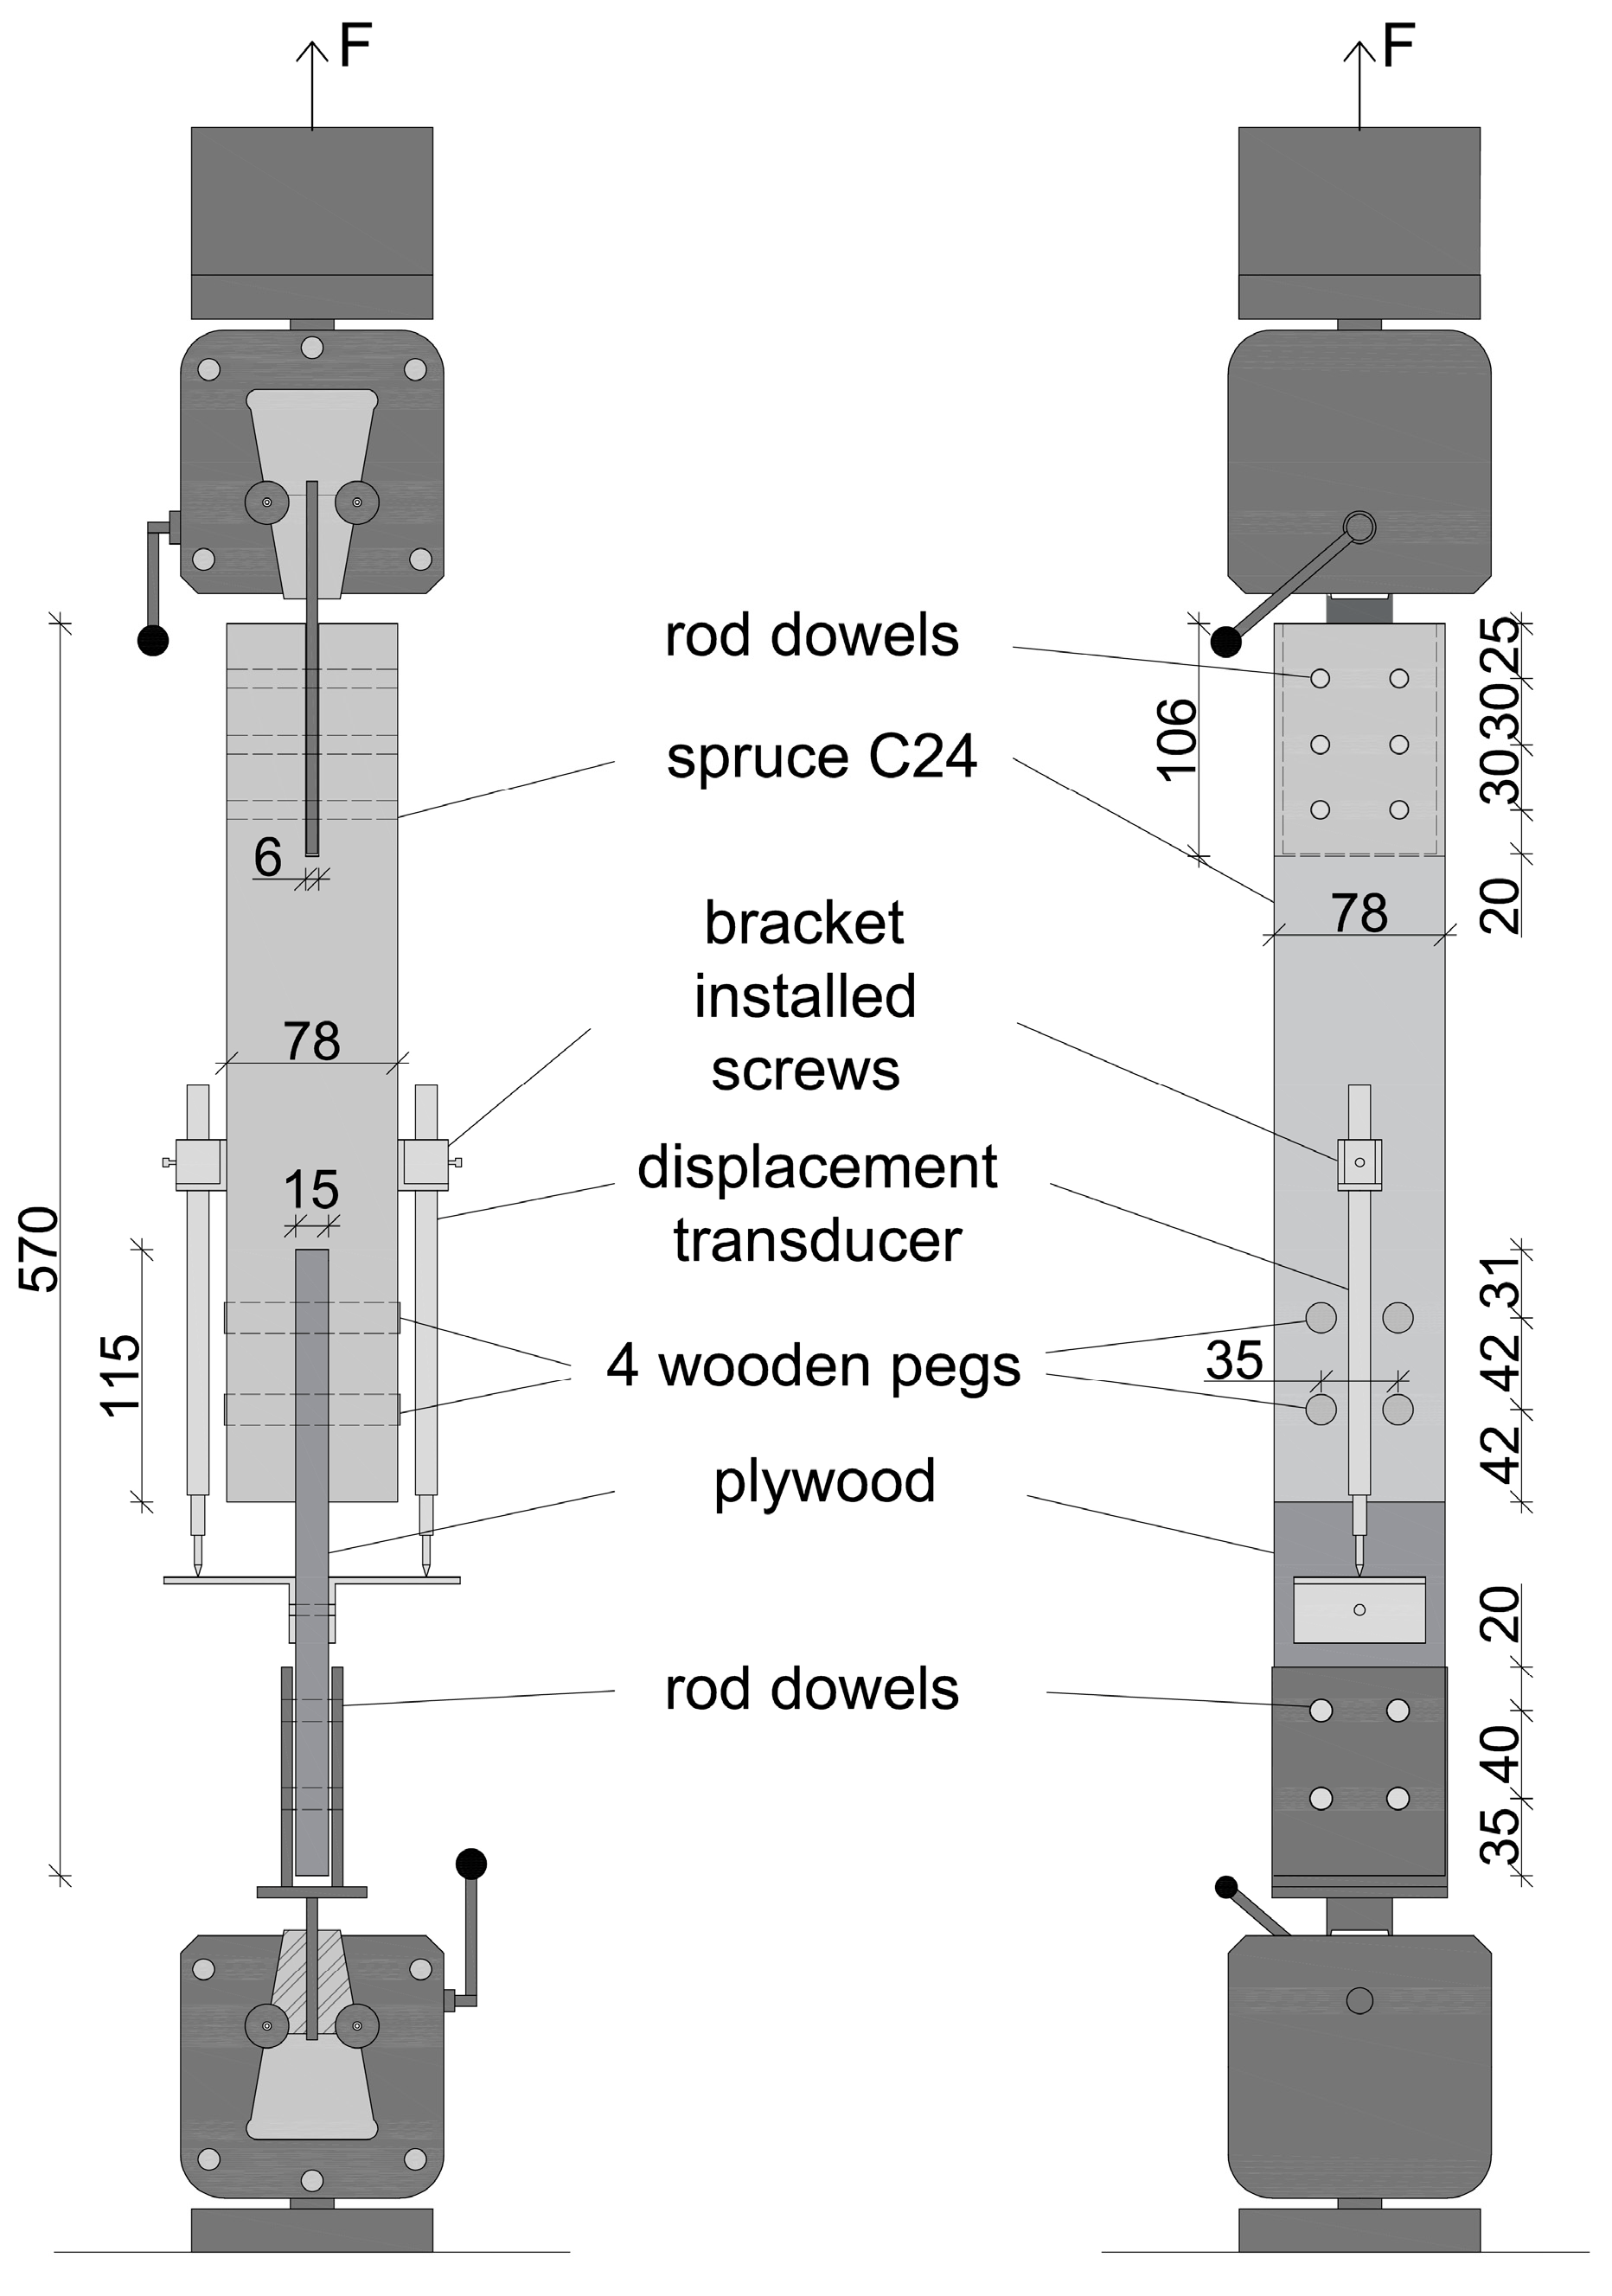
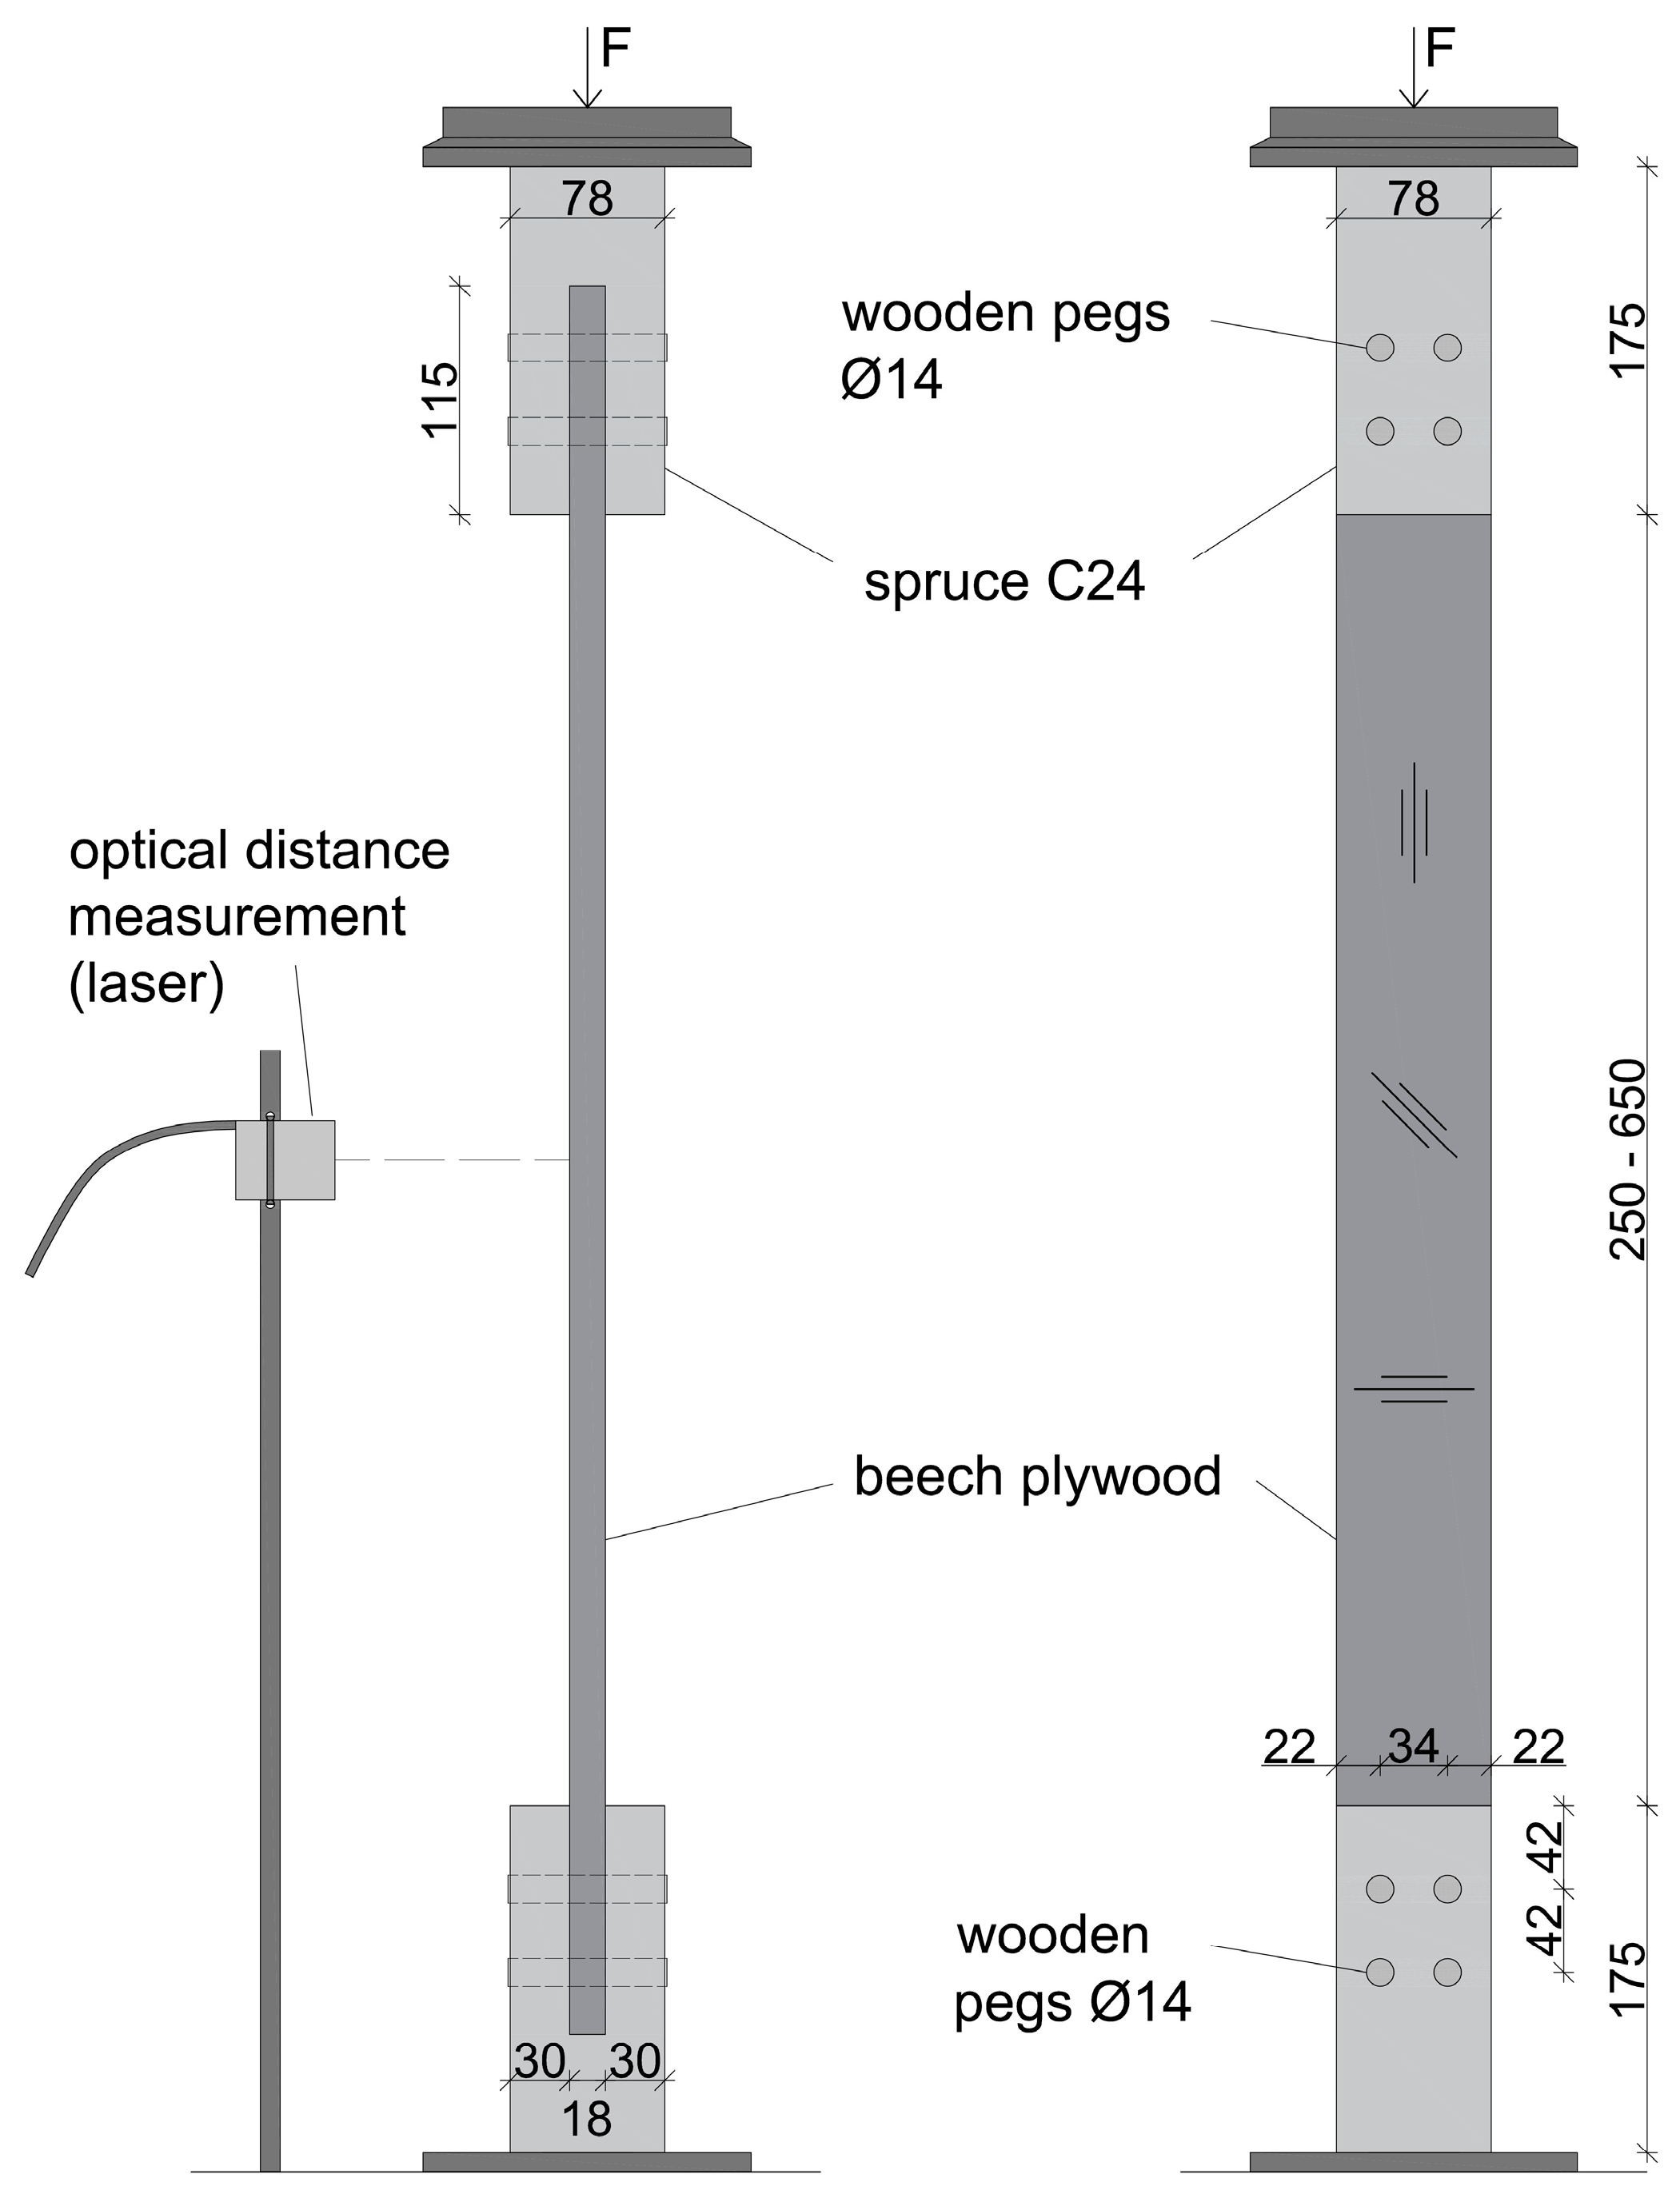
In the first experimental test series, the influence of the wood species of the pegs on the mechanical behaviour of the connection was investigated. Thus, the authors manufactured (using the robot for cutting and milling) and tested a total of nine configurations of the tensile connection (with three specimens each). The test set-up is shown in
Figure 6. A uniaxial hydraulic testing machine by Walter+Bai was used with a maximum load of 63kN. The loading speed was chosen at 0.5 mm/min in the beginning for thermo ash and ash and was increased to 1 mm/min for all other configurations. The force was measured with a load cell integrated in the testing machine, and the displacement was measured with two displacement transducers mounted at the spruce member and the plywood plate (see
Figure 6).
According to [
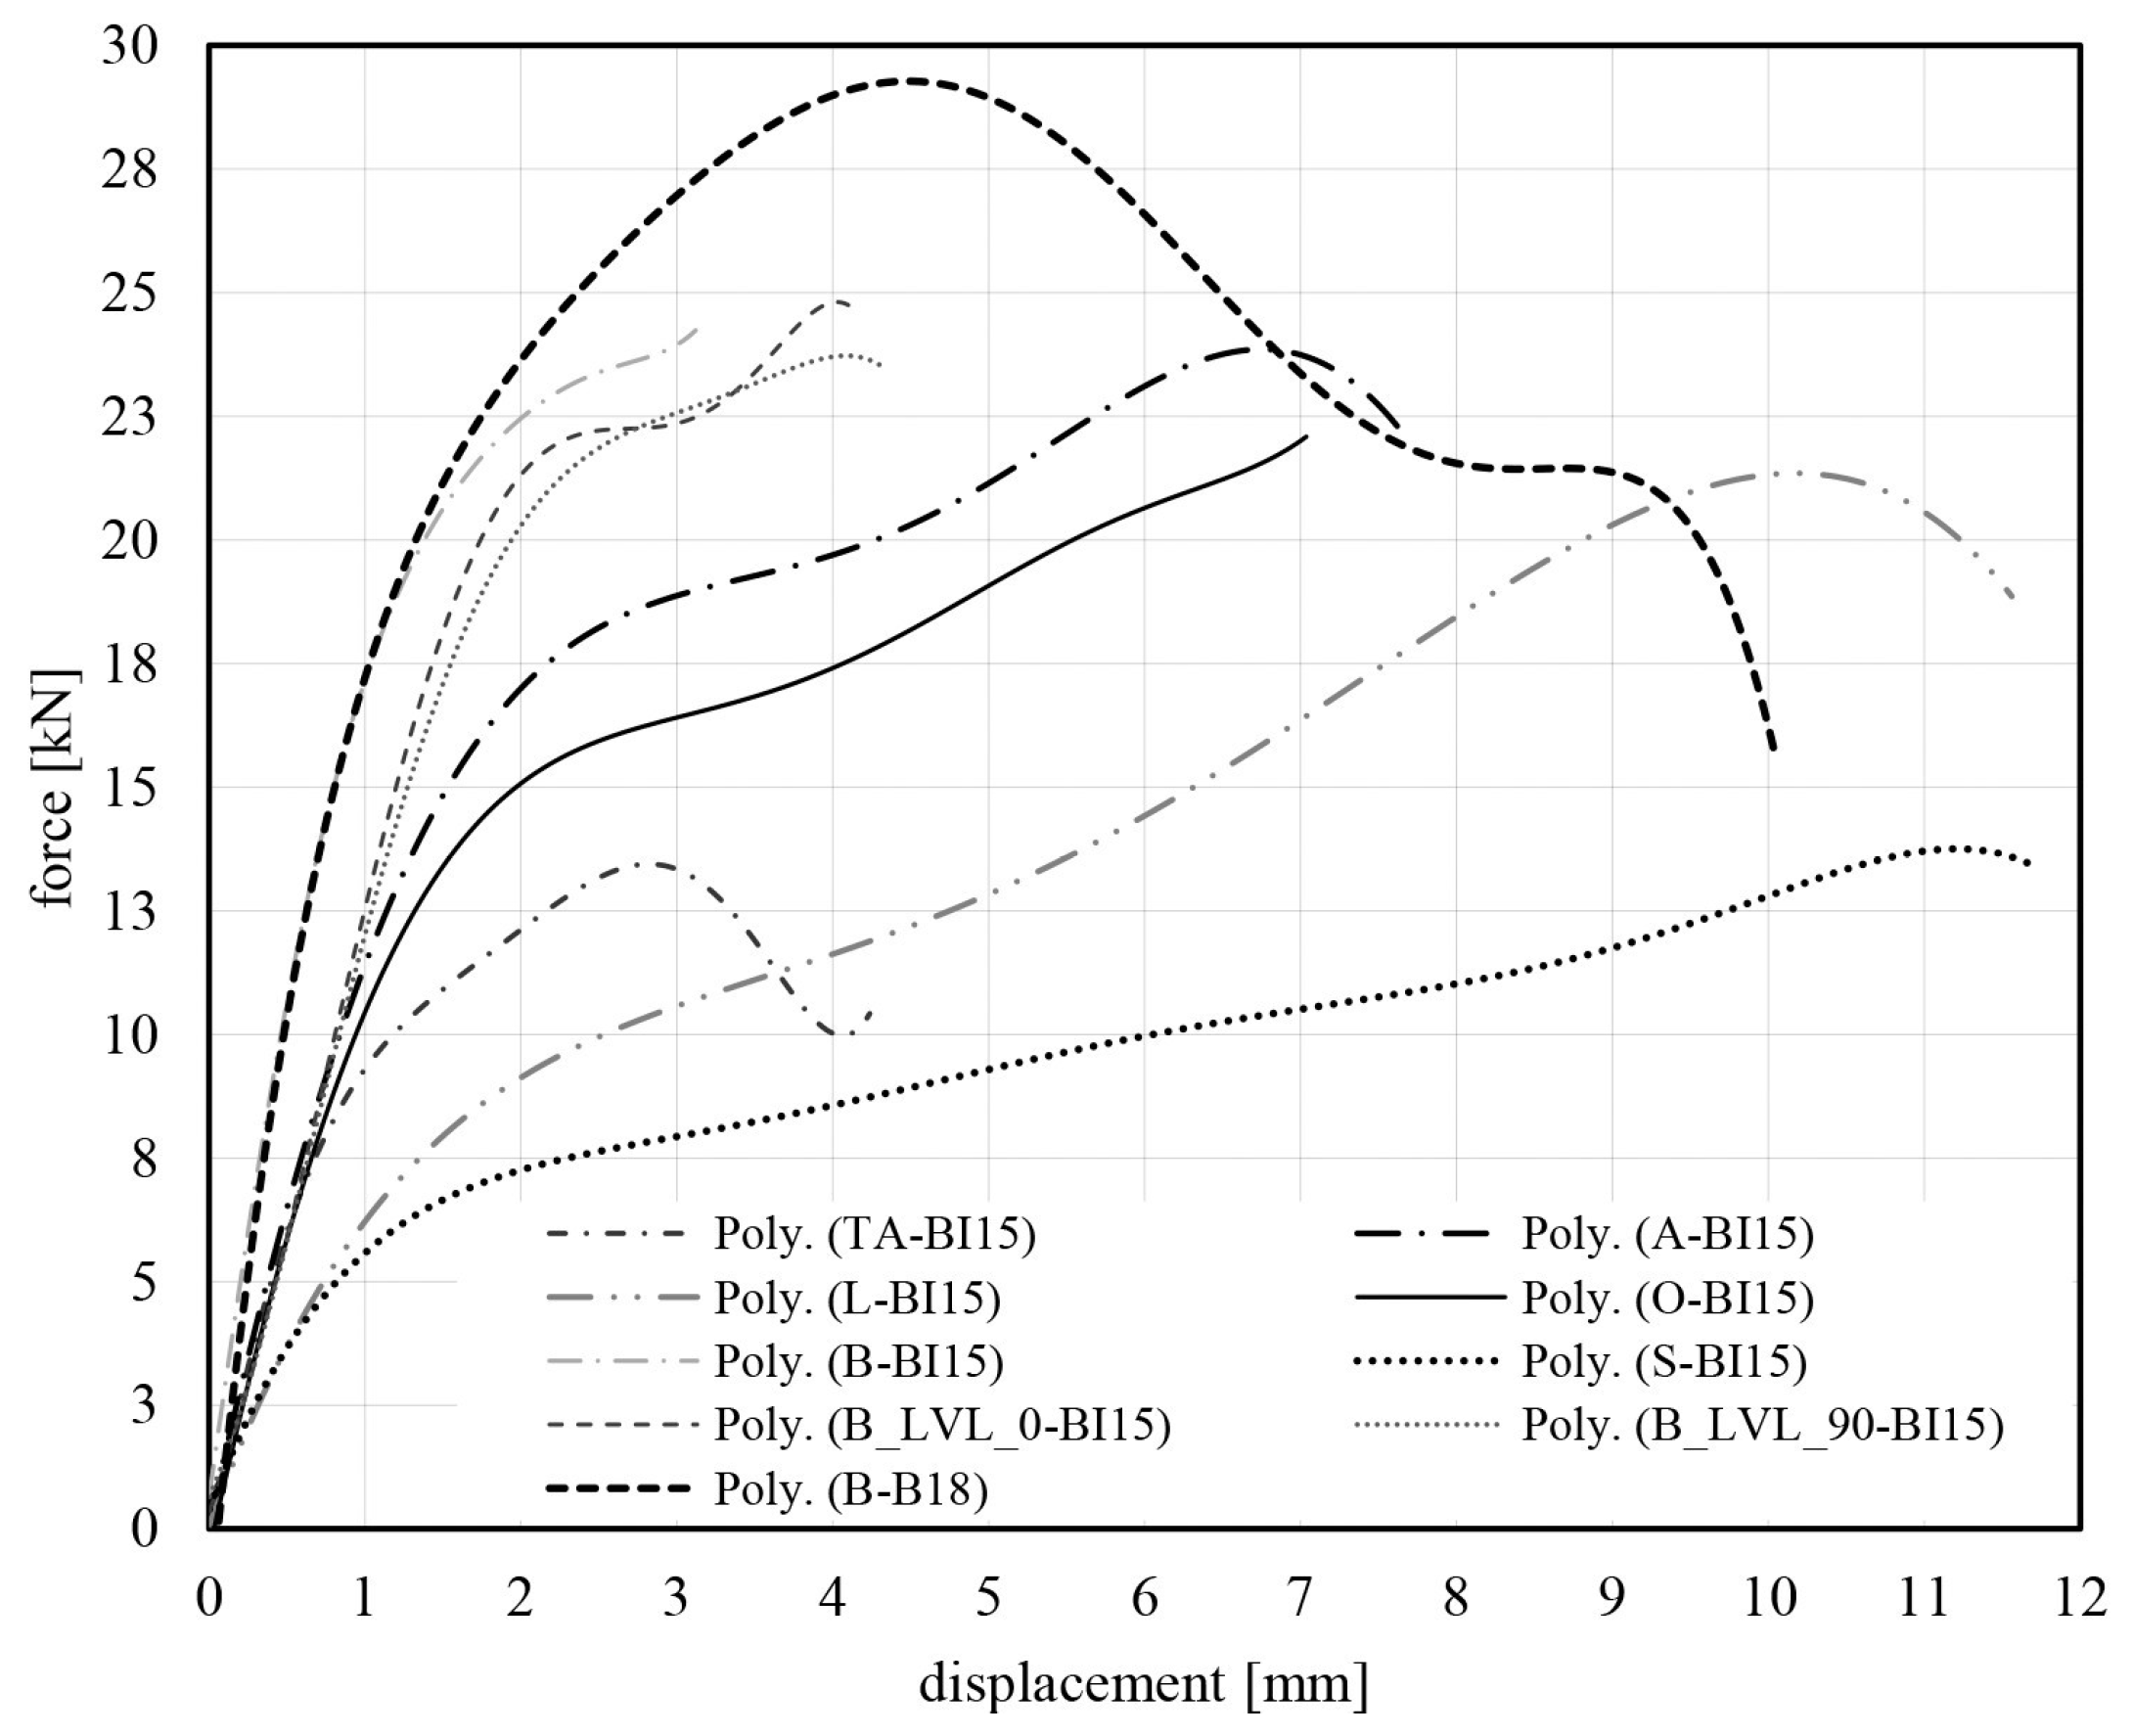
29], the thickness of the plywood panel should approximately equal the pegs’ diameter in order to ensure adequate load-bearing behaviour and ductile failure of the connection. For the first tests, a birch plywood panel was chosen with a thickness of 15 mm (BI15). The following wood species were examined for the pegs: thermo ash (TA), ash (A), oak (O), larch (L), beech (B), spruce (S), beech LVL with the glue joint parallel to the load direction (B_LVL_0) and beech LVL with the joint normal to the load direction (B_LVL_90). The tested configurations are summarised in
Table 2, and the test results are summarised in
Figure 7. The result curves represent regressive lines summarising the three specimens of every configuration. To limit the deformation in the final structure, the stiffness in the joint should be as high as possible. The results of the experimental investigation show that the combination of beech pegs and 15 mm birch plywood (B-BI15) provided the highest stiffness if configuration B-BI18 was ignored, as it was part of the second test series.
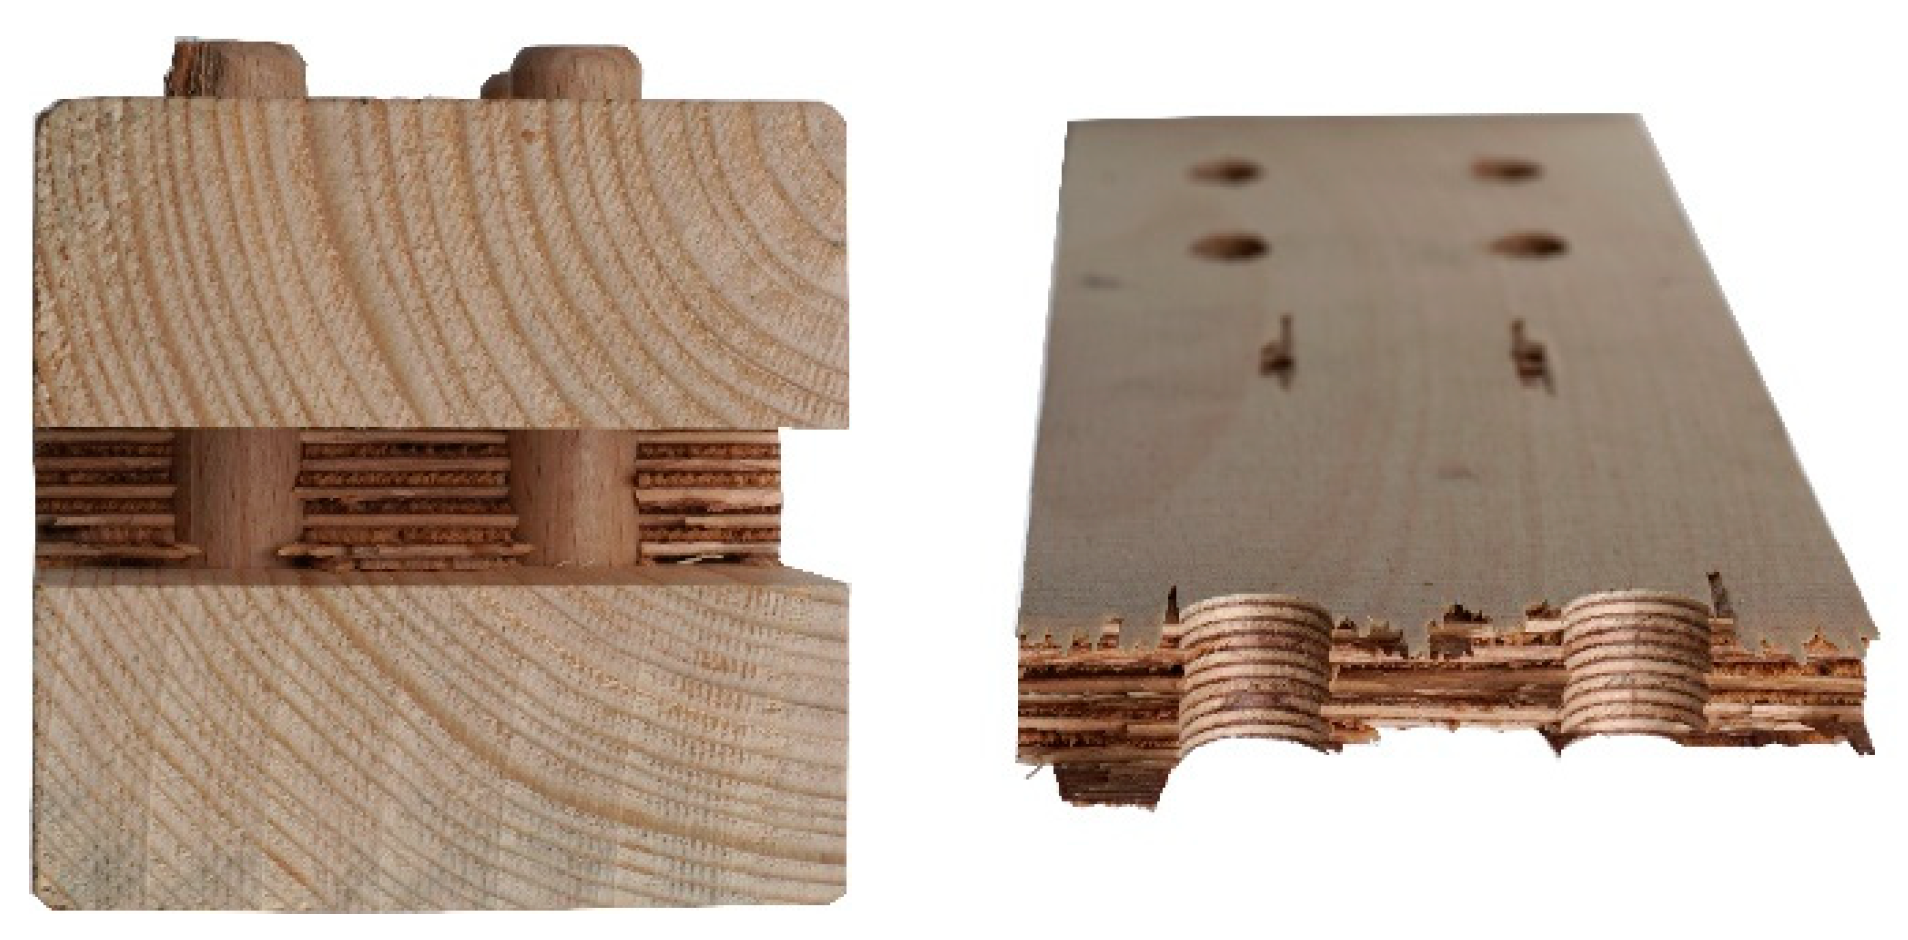
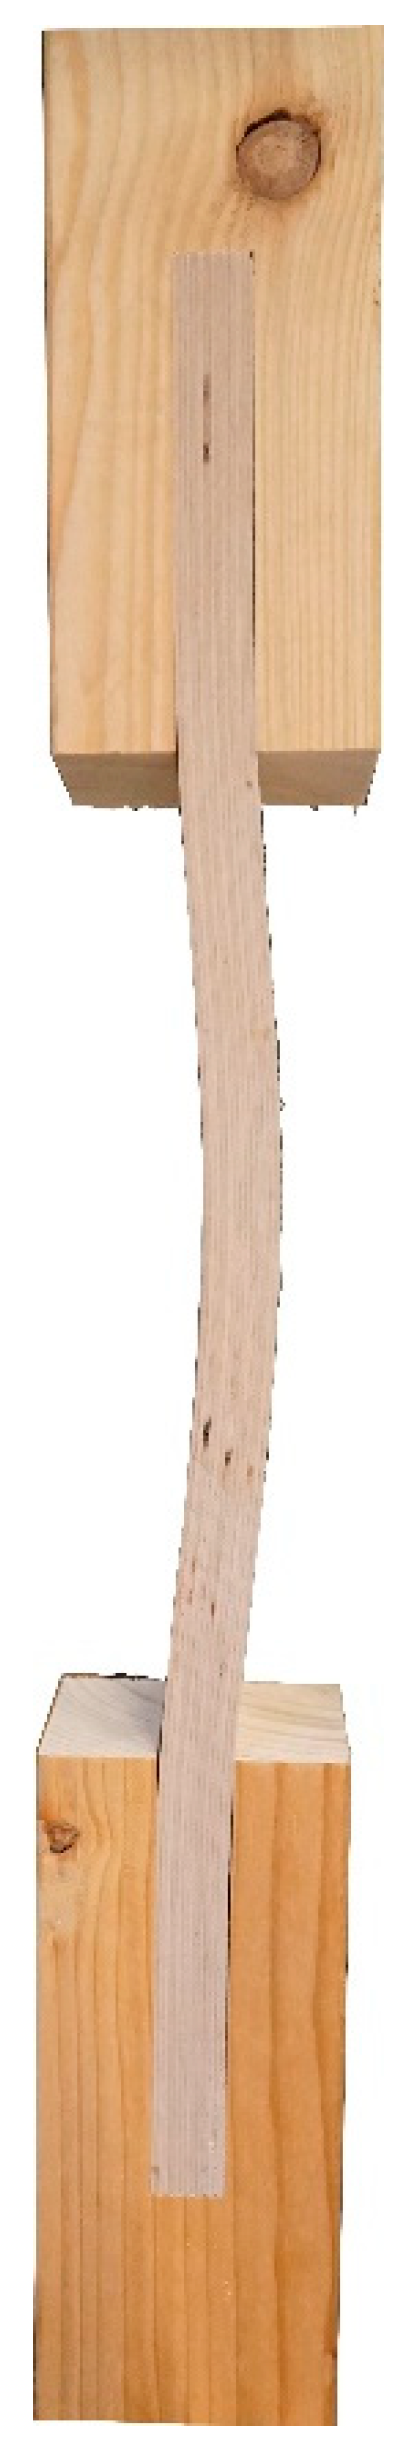
However, failure of this configuration (B-BI15) for all three specimens as well as for all three specimens in the configuration B_LVL_0-BI15 and B_LVL_90-BI15 and one specimen in A-BI15 occurred in the plywood panel next to the pegs in a brittle manner after a short period of softening (a specimen after failure is shown
Figure 8). As brittle failure is unwanted, a further series of tests was carried out. The specimen with the best results is listed in the last line of
Table 2. The 15 mm birch plywood was replaced by 18 mm beech plywood to ensure that the failure would not occur in the plywood panel. Beech pegs were chosen due to their good availability and the stiffest load-bearing behaviour of the previously tested specimens. Not only was it possible to achieve ductile failure in the combination of 14 mm beech pegs and 18 mm beech plywood (B-BI18), but it was also possible to achieve high stiffness and increase the load-bearing capacity from 25.01 kN in the first series up to 29.56 kN (see
Figure 7).
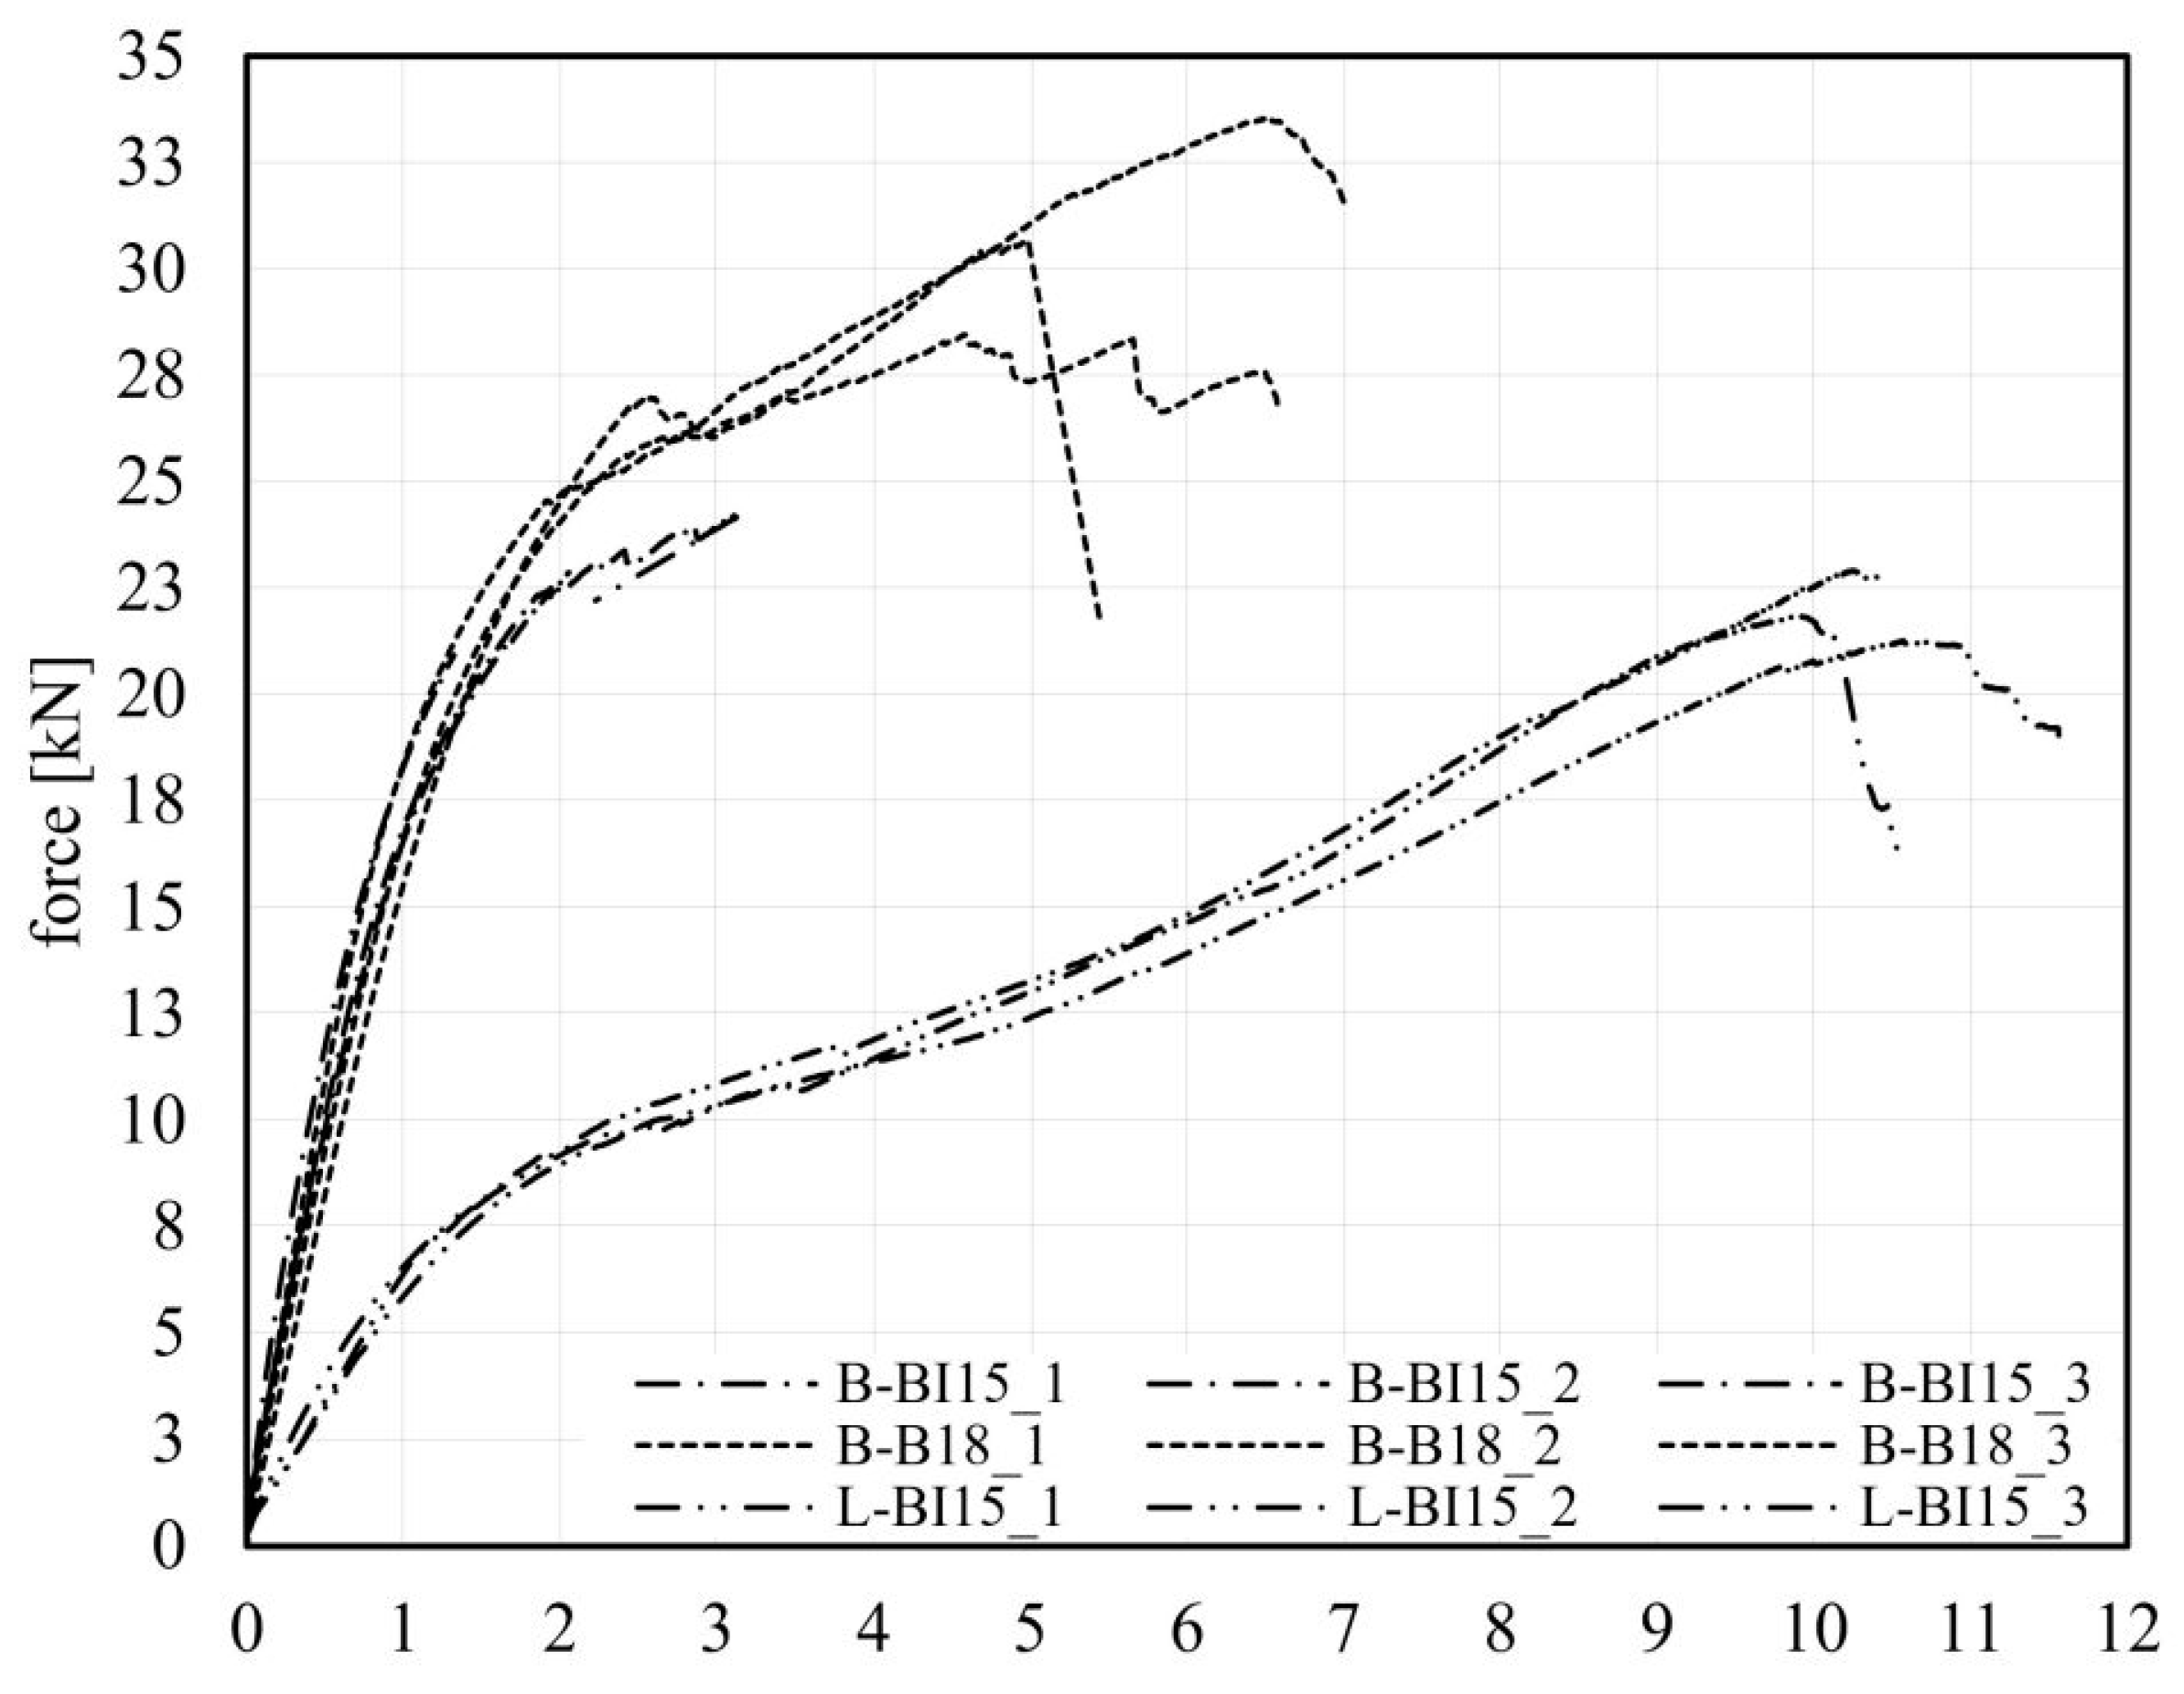
Figure 9 shows the single curves for all three test specimens of the configurations B-BI15_1-3, L-BI15_1-3 and B-B18_1-3 to show the low scattering of the different experiments as well as the similar behaviour at a low load level for the configurations B-BI15 and B-B18.
3.3. Experimental Investigations on Buckling of Beech Plywood
The design of the curved truss resulted in some cases in acute angles between the truss members. Hence, a free length of the plywood panel of up to 650 mm appears in the truss. Since the joints of the truss structure not only have to transmit tensile stresses but also compressive stresses, the risk of out-of-plane buckling of the slender plywood panel had to be ruled out. To investigate the influence of different free lengths of the plywood in comparison to the load direction regarding buckling failure, a series of compression tests was performed. The test set-up is shown in
Figure 10. The loading speed was chosen at 1 mm/min for all specimens. Again, the hydraulic uniaxial testing machine by Walter+Bai with a maximum load of 63kN was used. The force as well as the axial displacement were measured with the integrated load cell. An optical displacement transducer was used for documentation of the deviation of the plate out of plane (see
Figure 10).
As the truss nodes are stressed in different directions, three orientations of the main load-bearing direction of the plywood panel were tested. The joints consisted of 18 mm beech plywood panels inserted into the truss members and fixed with four wooden pegs (beech) with a 14 mm diameter. The joint configuration was chosen according to the B-B18 configuration of the tensile tests, presented in
Section 3.2. The aim was to transfer the compression loads not only through the peg/plywood joint but also through the contact surface between the beech plywood panel and the spruce truss member. The free length in this test series was set to 250 mm and increased in 100 mm steps up to 650 mm. Each step of the free length was tested at an angle of 0°, 45° and 90° of the plywood’s main load-bearing direction to the direction of force. The investigated configurations are summarised in
Table 3. Three specimens per configuration were tested again. The test results are shown in
Figure 11. The diagrams (a)–(e) show the comparison of the influence of the orientation of the top layer of the plywood according to the load direction for the different free lengths. The diagrams (f)–(h) show the influence of the free length for different orientations of the top layer of the plywood.
As expected, the results of the test series prove that the load-bearing capacity decreases with an increase in free length. A test specimen under load showing the buckling mode is depicted in
Figure 12. However, in each configuration of the free length, the specimens with an angle of 45° between the main load-bearing direction and the direction of force showed the lowest load-bearing capacity. Each specimen with an angle of 0° between the orientation of the main layers of the plywood and the direction of force, labelled xx-0, provided the highest load-bearing capacity for a defined plate length. These findings show that the governing stress direction in the truss node has to coincide with the load-bearing direction of the plywood in order to fully use its potential. Furthermore, it was observed that the bending shape was similar to Euler case 4, leading to the assumption that the designed joints act like rigid ends (within the tested boundary conditions). Furthermore, it can be derived that the turning points of the bending shape are also relevant for the global investigation of the buckling behaviour. Within the calculation, they were expected to occur at the intersection of the truss member axis in the plywood plate. In reality, they occur at the intersection between the truss member and the plywood plate (
Figure 11).
3.4. Final Design of the Truss Joints
For the final design of the curved truss, the members consisted of spruce with a cross section of 80 × 80 mm2 (78 × 78 mm2). One joint design was chosen for all joints to simplify the manufacturing process. Thus, four beech pegs with a 14 mm diameter and 18 mm beech plywood panels were used for the joints. A recently performed full-scale test showed that global buckling of the nodes subjected to compression due to the lower material thickness of the plywood plate significantly reduces the expected load-bearing capacity. Thus, the authors decided to fill up the plywood of the compression joints to the full cross section of 78 × 78 mm2. This measure finally allowed for full use of the joints that was then proven within another full-scale test with the filled-up joints. The ultimate load-bearing capacity was limited due to the tensile load-bearing behaviour of the joints. The tensile tests described above as well as the full-scale test showed a very good correlation, confirming the chosen research strategy.
The chosen modelling strategy using Rhinoceros with the plug-ins Grasshopper and Karamba 3D in combination with a self-programmed EC 5 calculation for the conceptual design of timber truss structures was based on hinged joints. The realised joints are semi-rigid, bringing up the question whether the modelling strategy is adequate to represent a secure dimensioning of the structure. The member cross section is low compared to the member length, in combination with a very ductile failure behaviour of the connection under tension. In addition, the tensile behaviour is decisive, as mentioned above. Therefore, the chosen approach can clearly be presumed as appropriate to predict the ultimate load-bearing behaviour in an adequate manner.
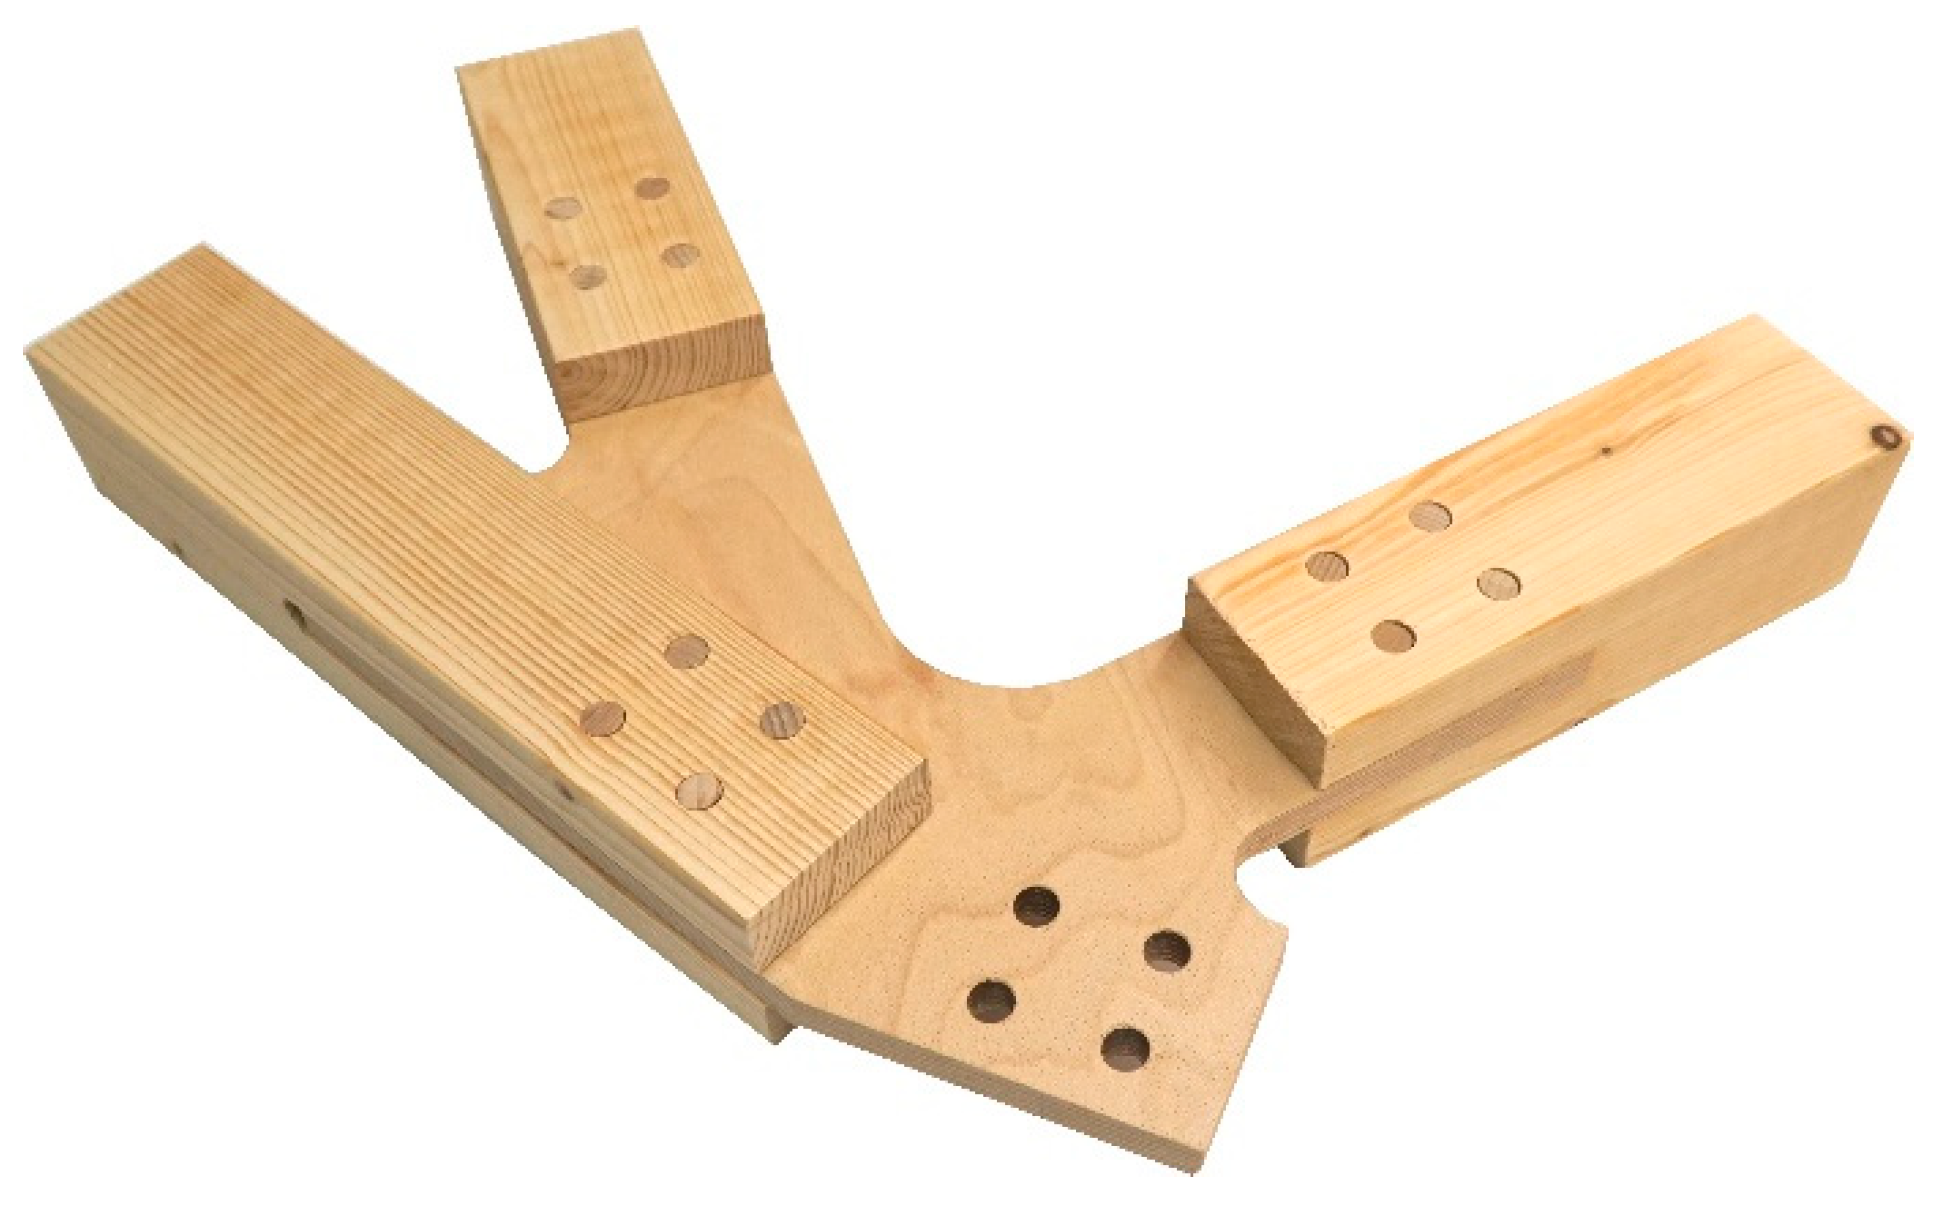
The chosen tensile node is shown in
Figure 13, the final chosen compression node in
Figure 14 and a picture of the realised laboratory in
Figure 15. The erection of the laboratory was assembled by a joint work effort of all work group members: Matthias Braun, Mathias Hammerl, Maximilian Ortner, Marc Pantscharowitsch, Sara Reichenbach, Nadine Stoiber and Benjamin Kromoser.
4. Conclusions
Industrialising the complete process chain shows great potential for the wood construction sector, allowing for an increase in resource efficiency and the ability to compete with other construction materials regarding economic efficiency. Within this context, the present paper focuses on the practical optimisation of the truss geometry and the connections of trusses by solely using wood as the construction material for all building elements. The housing of the BOKU Vienna robot laboratory was chosen as the first pilot project, implementing the research approach in a very practical manner.
The optimisation of the geometry was based on the use of a parametric model, and a genetic solving algorithm allowed for a reduction of the required construction material by 14.9% in comparison to the first design based on engineering knowledge. For this case, the cross section of the truss members was predefined to 80 × 80 mm2. A theoretical optimisation of the cross section showed further a reduction potential of 60%.
A pure wood–wood connection was chosen using plywood as the connection panel and wooden pegs as shear connectors to minimise the environmental impact of the load-bearing structure. New findings regarding this connection type could be found within a series of tensile investigations. The main investigation parameters were the influence of the wood species of the pegs on the mechanical behaviour of the connection. The results showed that using beech pegs provides the stiffest connection and the highest load-bearing capacity. Furthermore, the investigations showed that special attention is needed to be paid to the interaction between the peg diameter and the thickness of the plywood panel in order to ensure ductile failure of the connection.
To estimate local buckling failure in the plywood panel, compression tests were conducted, obtaining information about the influence of the free length. The results showed the importance of the main load-bearing direction of the plywood panel. In addition, it could be observed that if only the plywood plate is used without additional filling, the turning point of the bending shape moves from the ideal intersection point of the truss members to the intersection between truss member and plywood plate, leading to more turning points in one node.


