Figure 1.
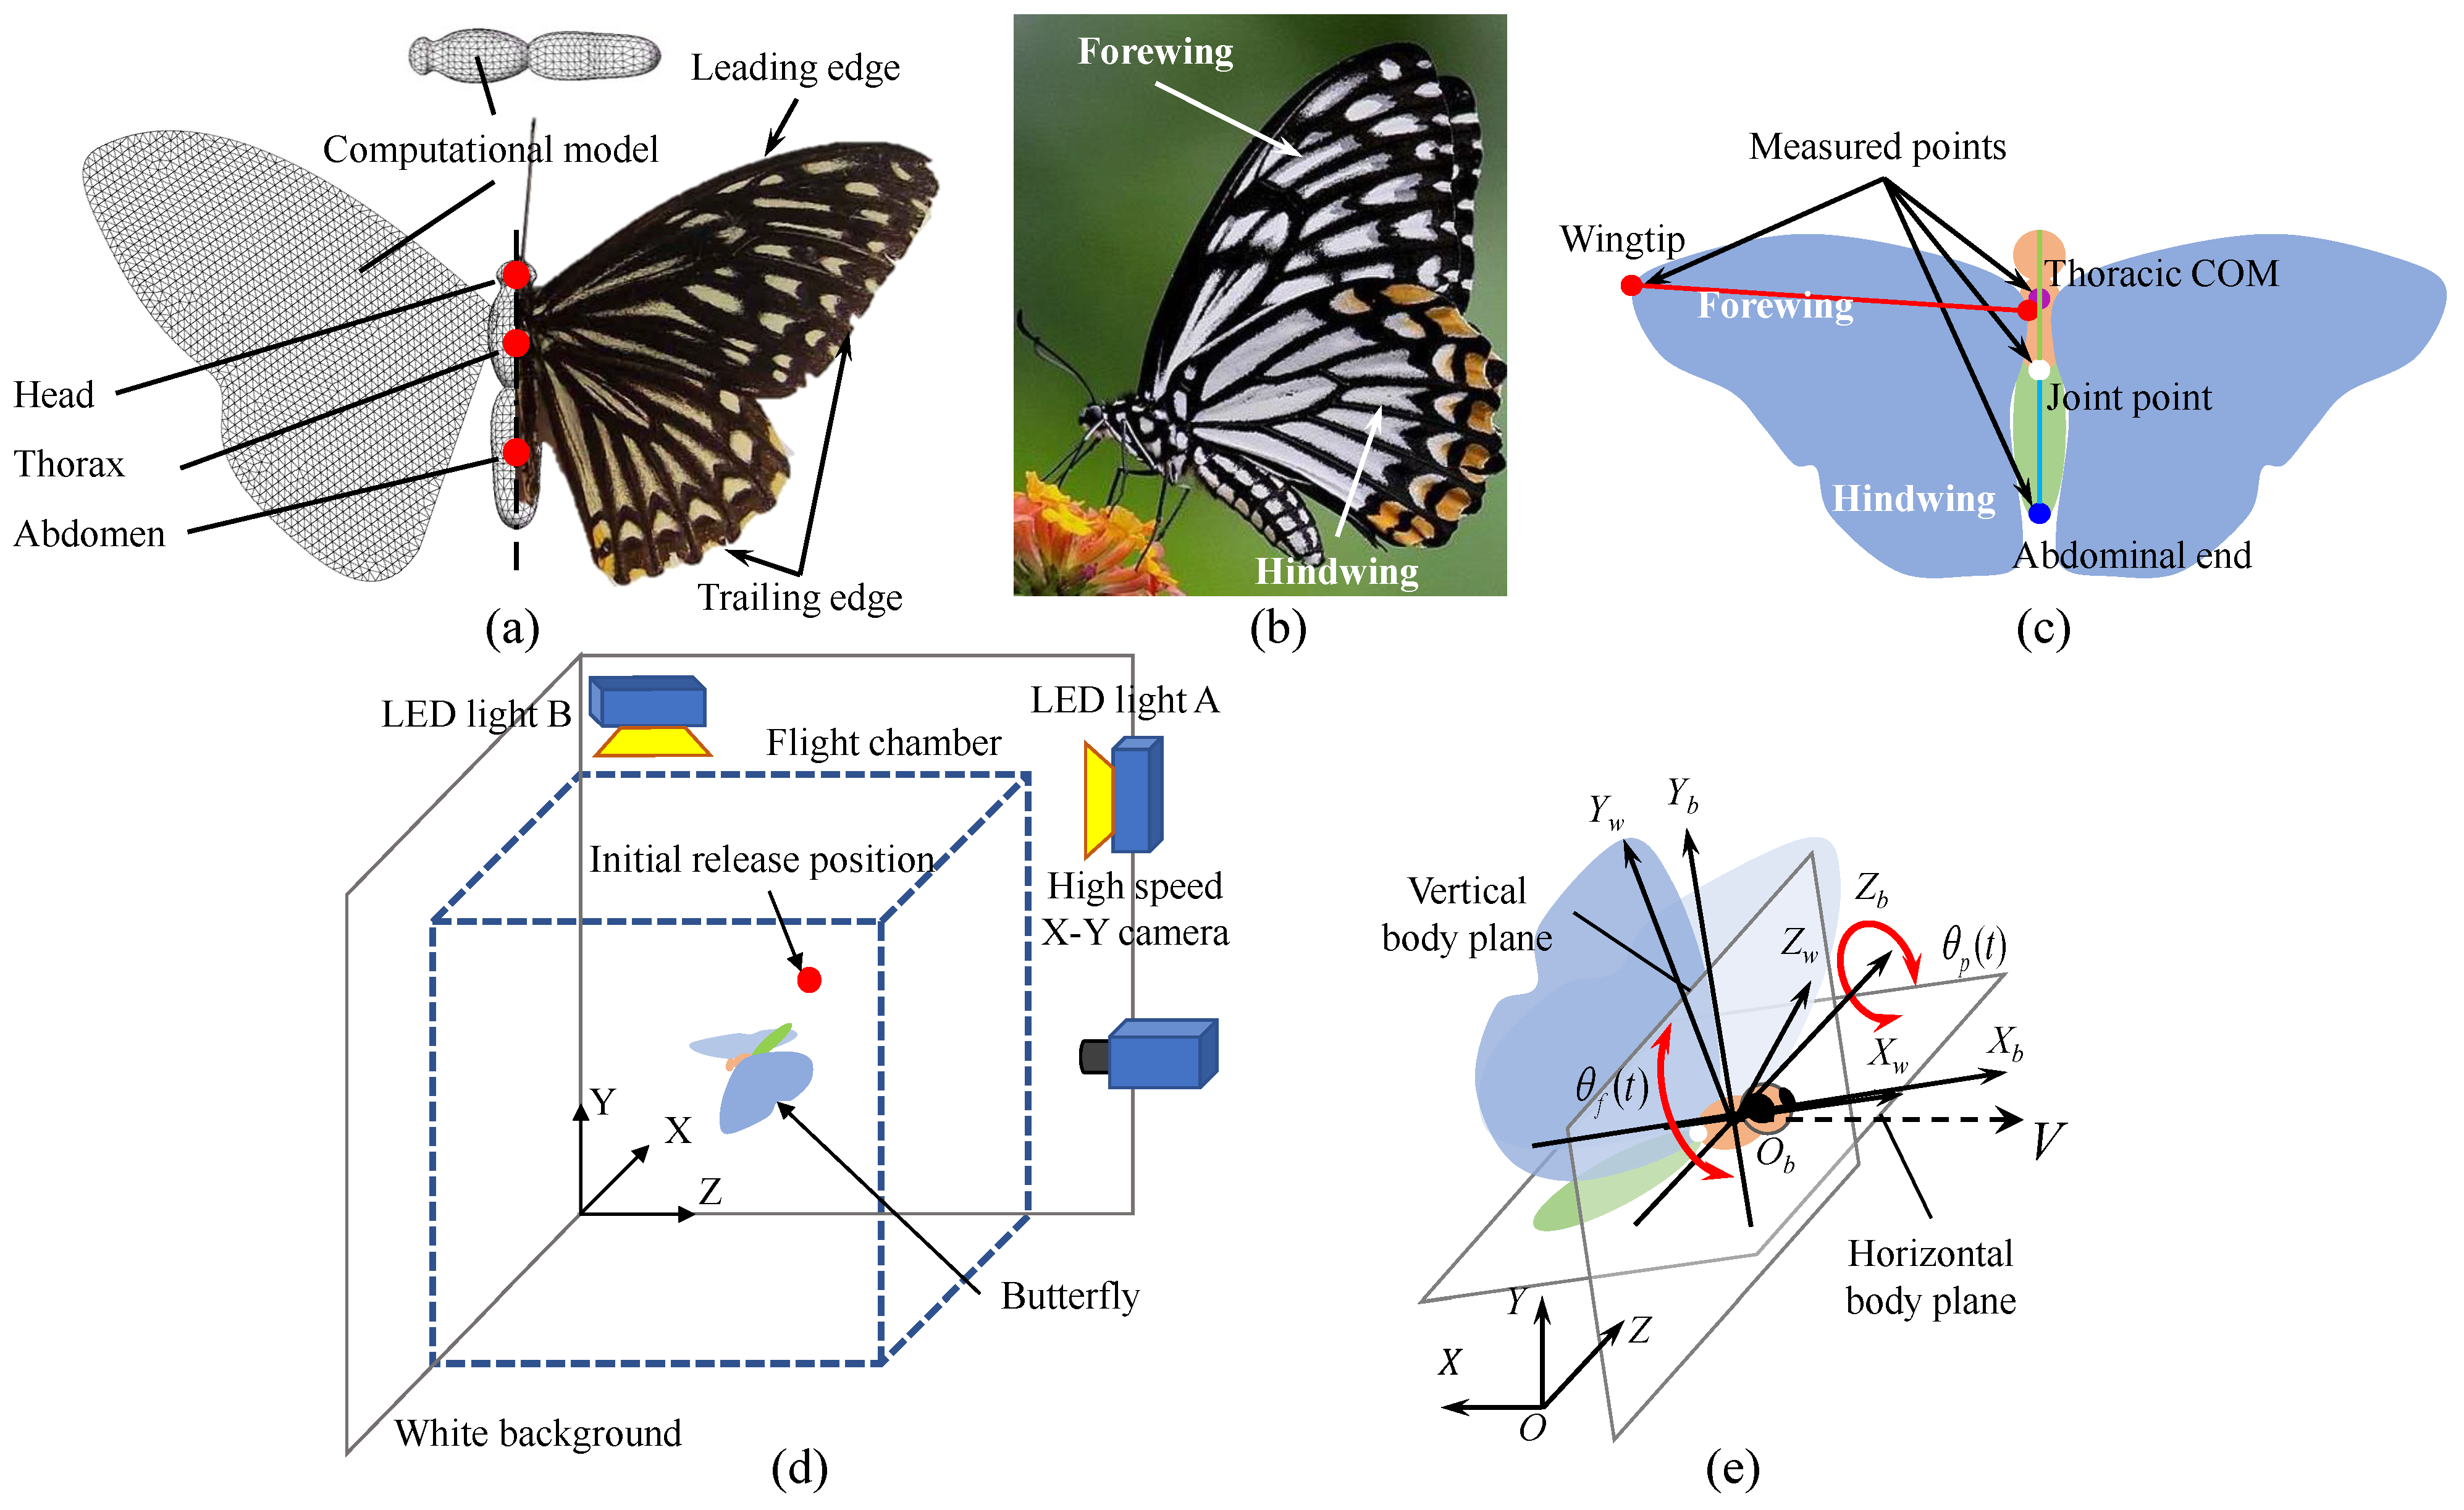
Observation experiment for butterfly flight based on high-speed camera: (a) geometry of a Chilasa clytia and the computational model with mesh, butterfly body mesh model; (b) live butterfly with the forewing (FW) and hindwing (HW) in natural environment; (c) schematic diagram of butterfly observation feature points and body kinematic parameters; (d) experiment system; and (e) three coordinate systems to describe the motion of a butterfly, namely the inertial coordinate system , the body-fixed coordinate system and wing-fixed coordinate system .
Figure 1.
Observation experiment for butterfly flight based on high-speed camera: (a) geometry of a Chilasa clytia and the computational model with mesh, butterfly body mesh model; (b) live butterfly with the forewing (FW) and hindwing (HW) in natural environment; (c) schematic diagram of butterfly observation feature points and body kinematic parameters; (d) experiment system; and (e) three coordinate systems to describe the motion of a butterfly, namely the inertial coordinate system , the body-fixed coordinate system and wing-fixed coordinate system .
Figure 2.
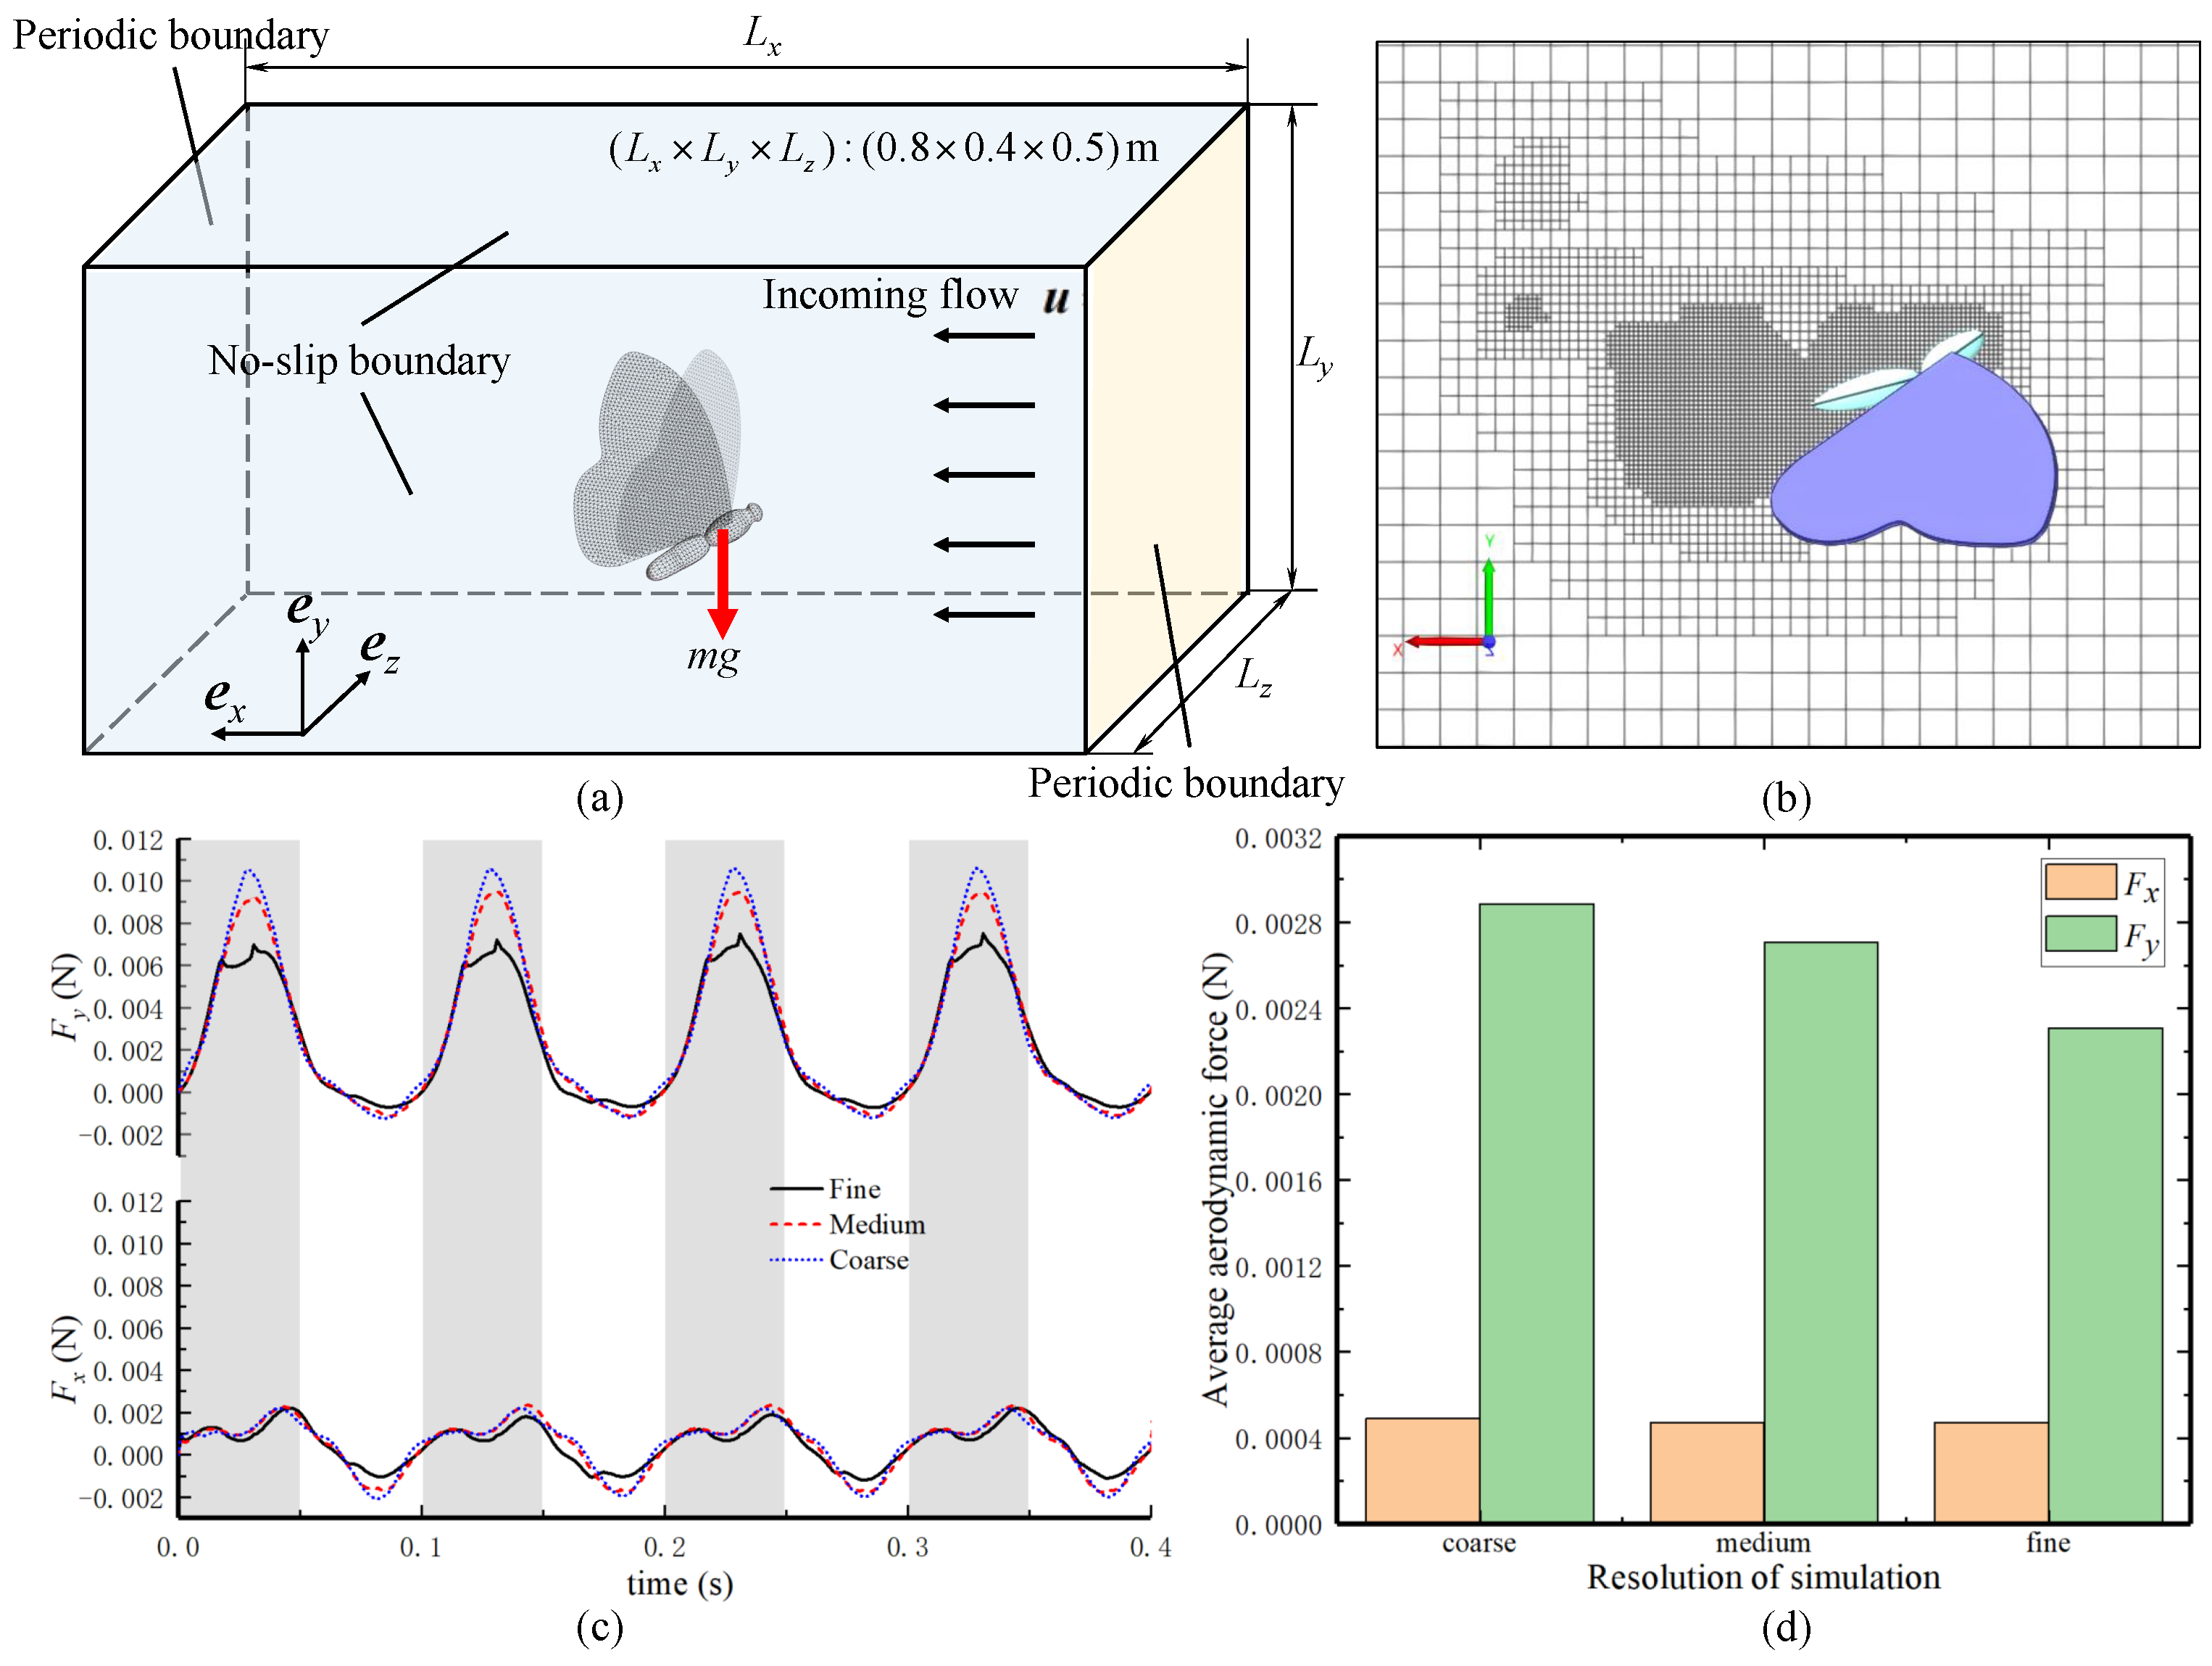
Computational fluid simulation set-up and resolution-independent study: (a) fluid computational domain for flight simulation of the butterfly multi-body model; (b) domain structure with lattice mesh on the middle symmetry plane of the butterfly; (c) the aerodynamic forces of the butterfly under three-resolution set-ups (, horizontal force; , vertical force); and (d) the average aerodynamic forces under three-resolution set-ups.
Figure 2.
Computational fluid simulation set-up and resolution-independent study: (a) fluid computational domain for flight simulation of the butterfly multi-body model; (b) domain structure with lattice mesh on the middle symmetry plane of the butterfly; (c) the aerodynamic forces of the butterfly under three-resolution set-ups (, horizontal force; , vertical force); and (d) the average aerodynamic forces under three-resolution set-ups.
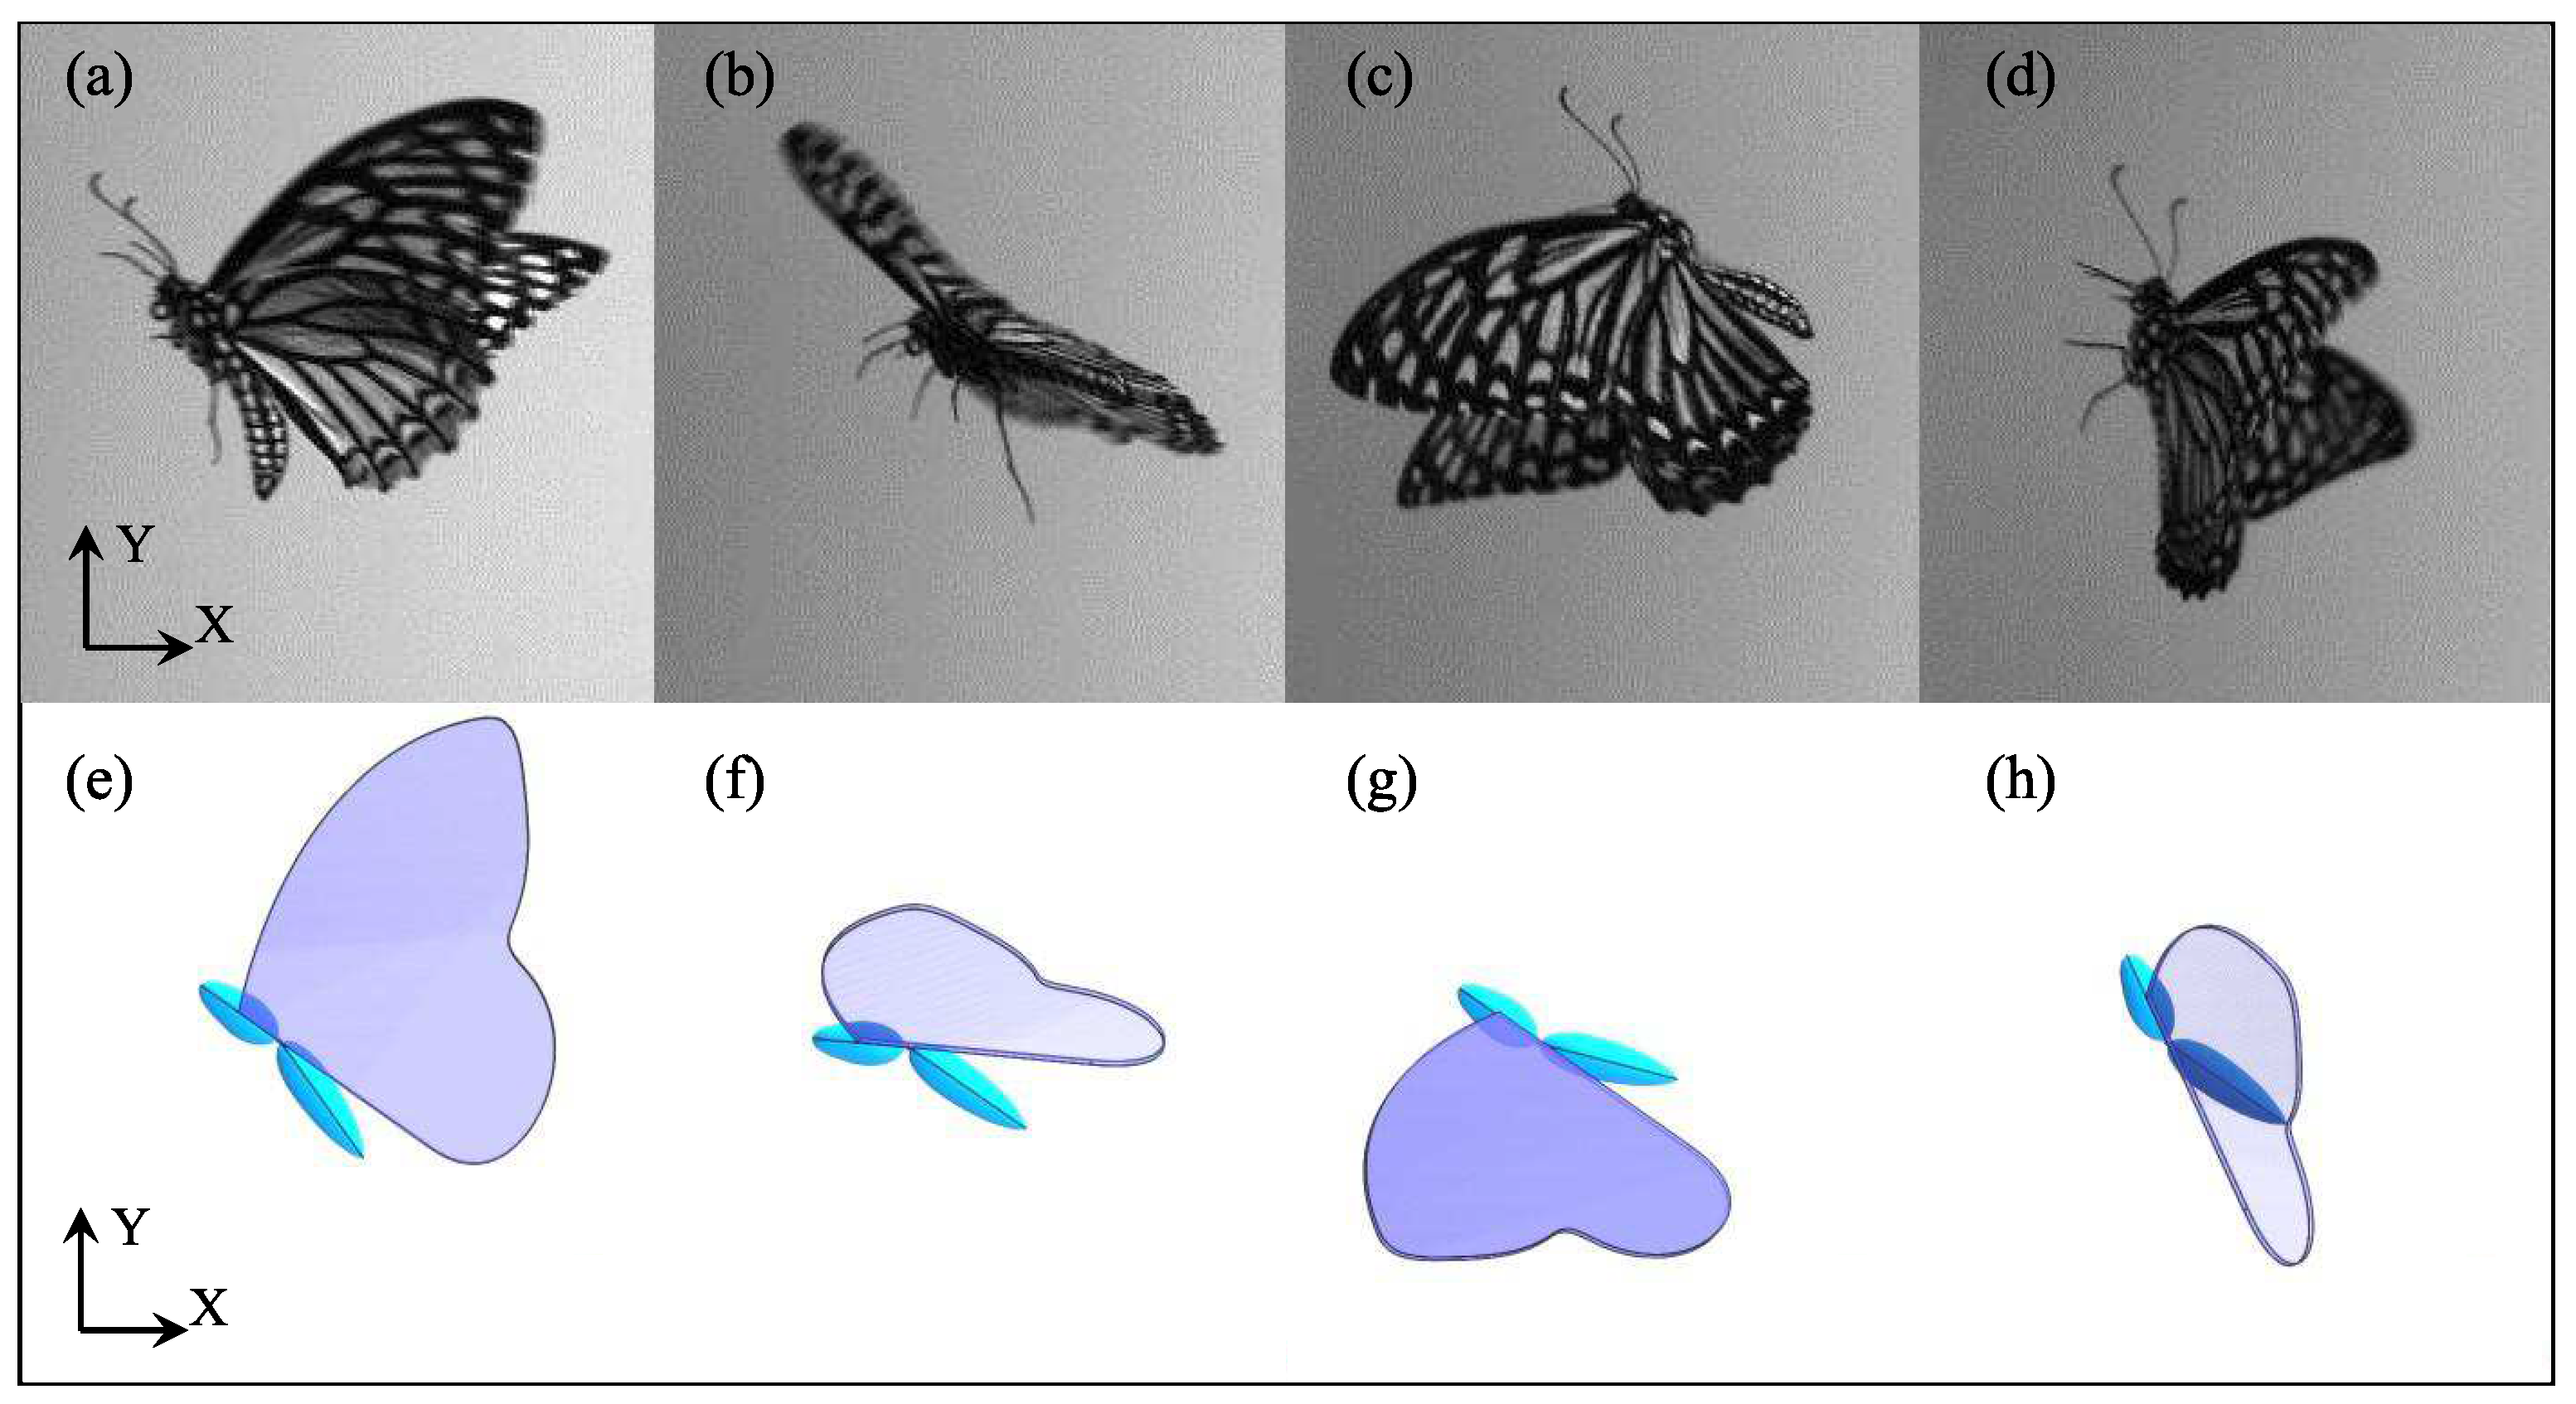
Figure 3.
The real motion (top) and prescribed motion (bottom) of the butterfly during a stroke: (a,e) start of downstroke; (b,f) mid-downstroke; (c,g) start of upstroke; and (d,h) mid-upstroke.
Figure 3.
The real motion (top) and prescribed motion (bottom) of the butterfly during a stroke: (a,e) start of downstroke; (b,f) mid-downstroke; (c,g) start of upstroke; and (d,h) mid-upstroke.
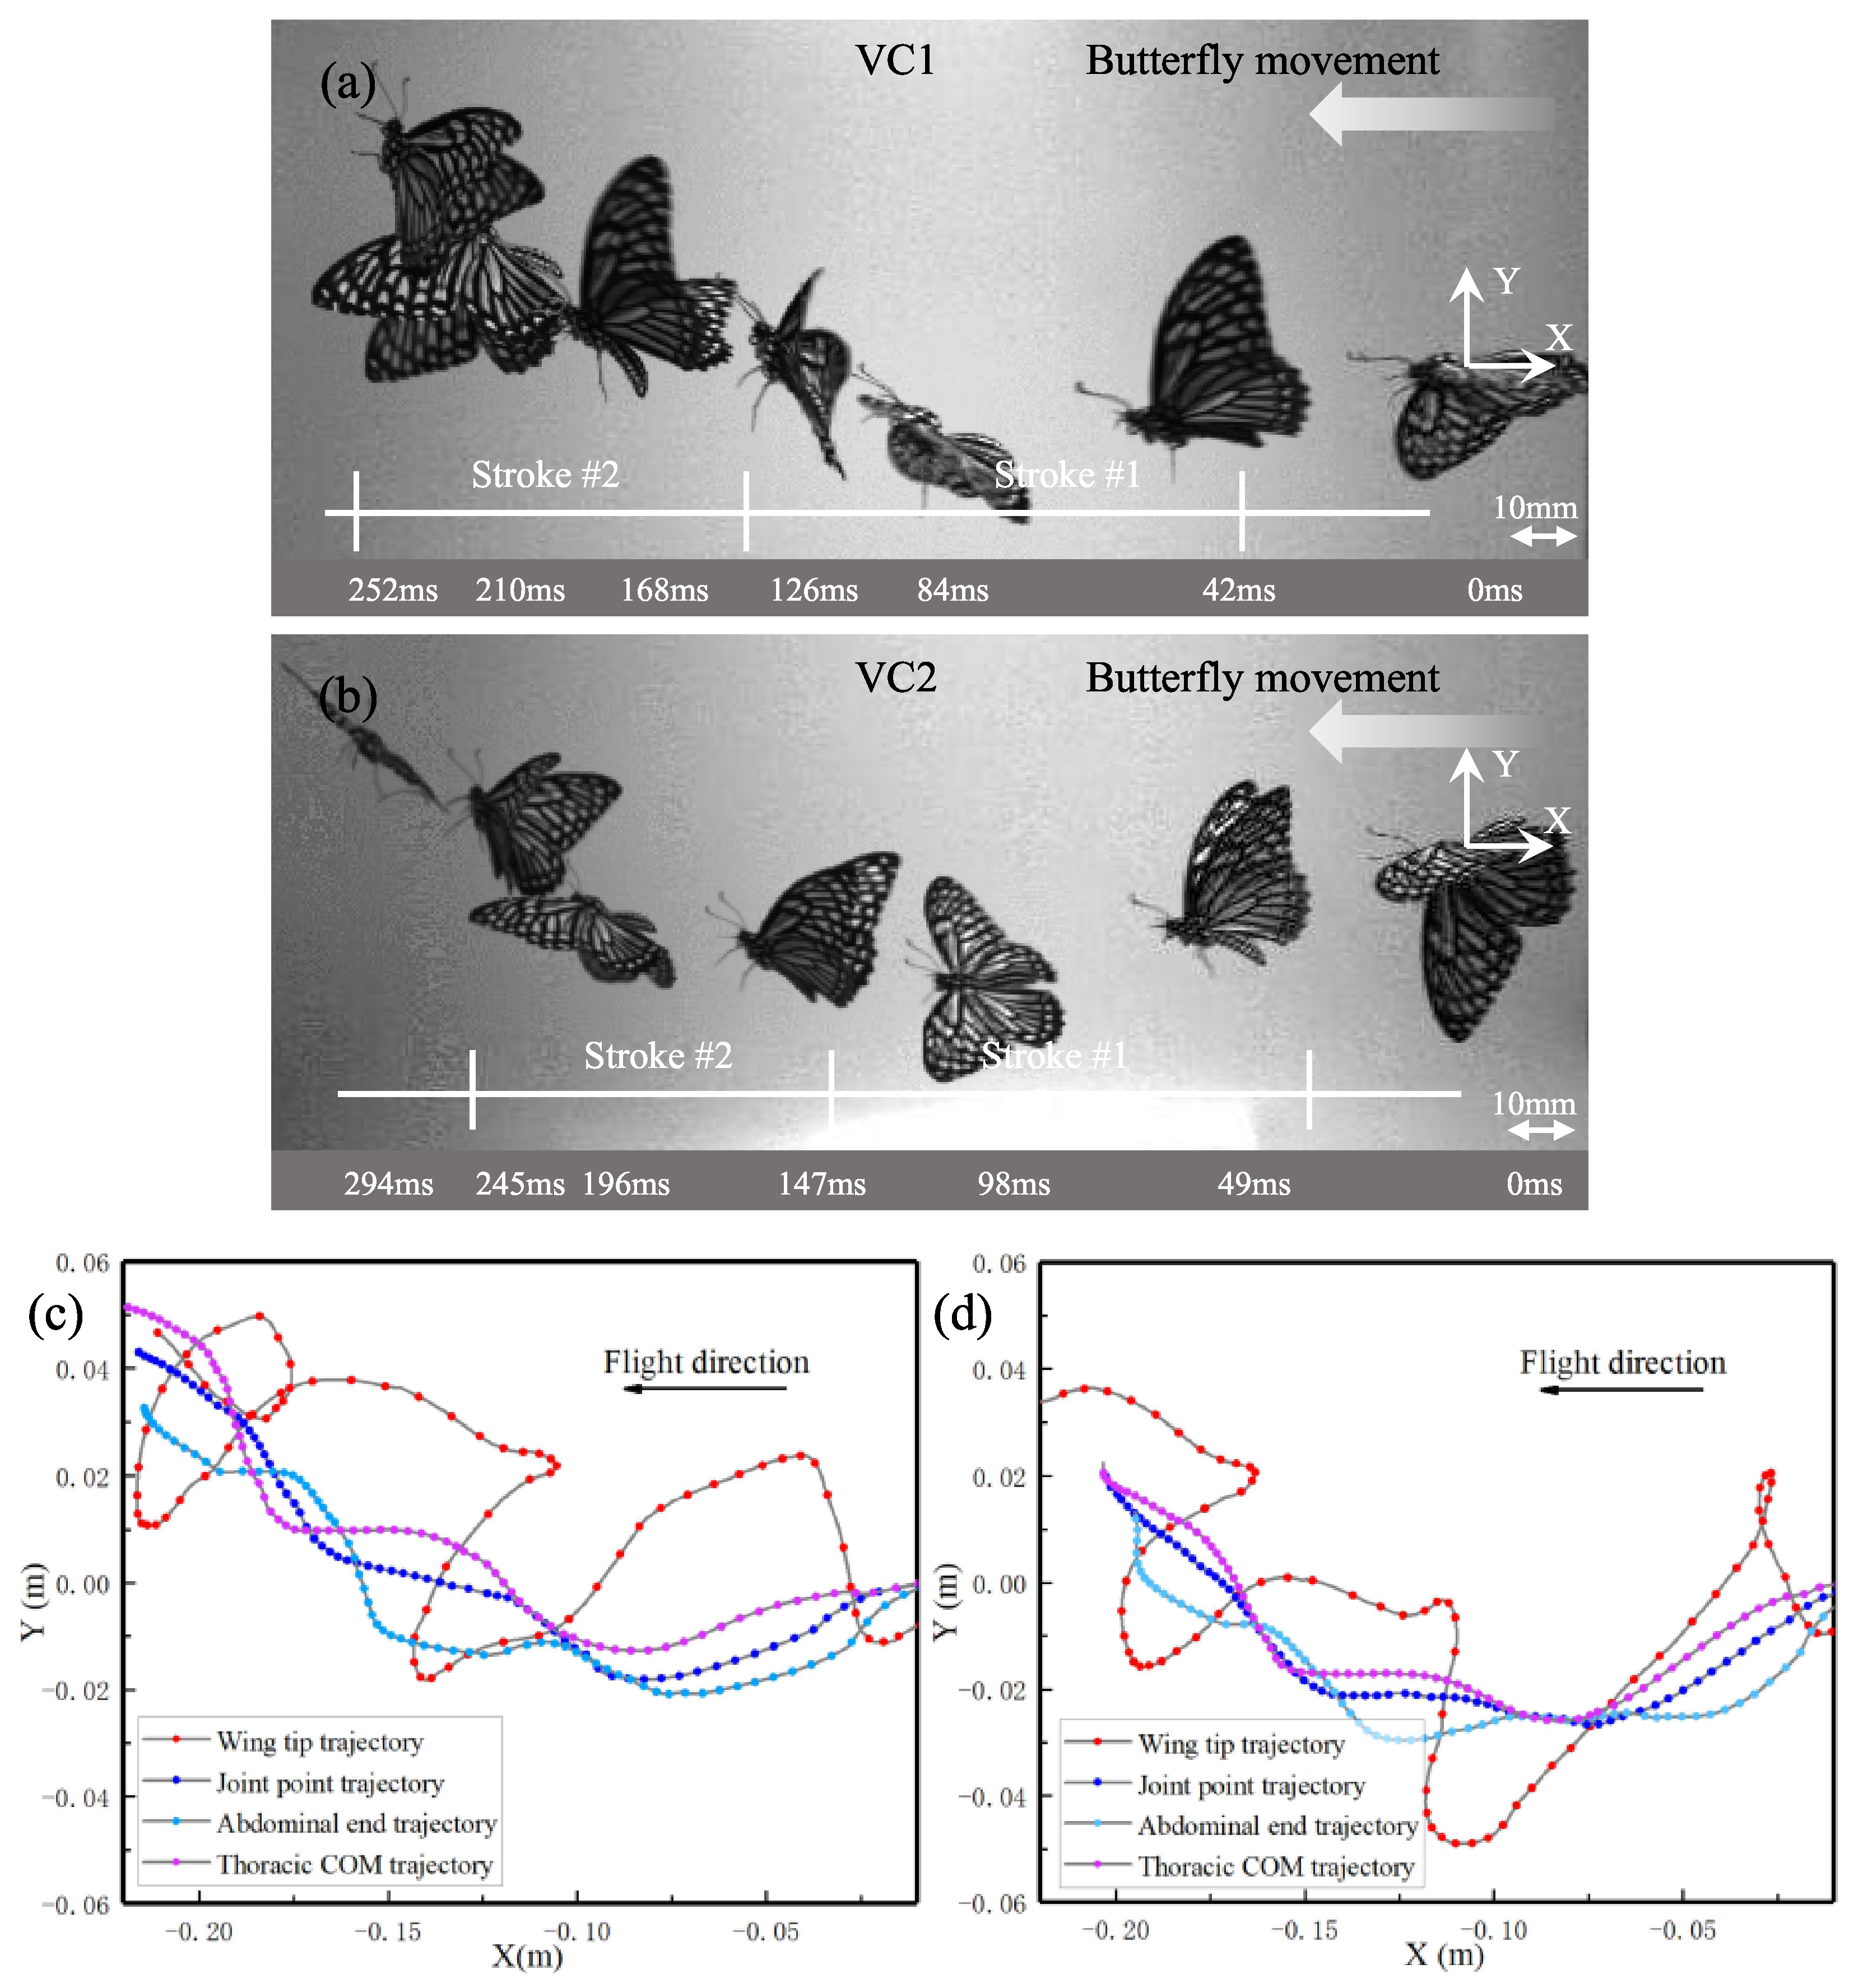
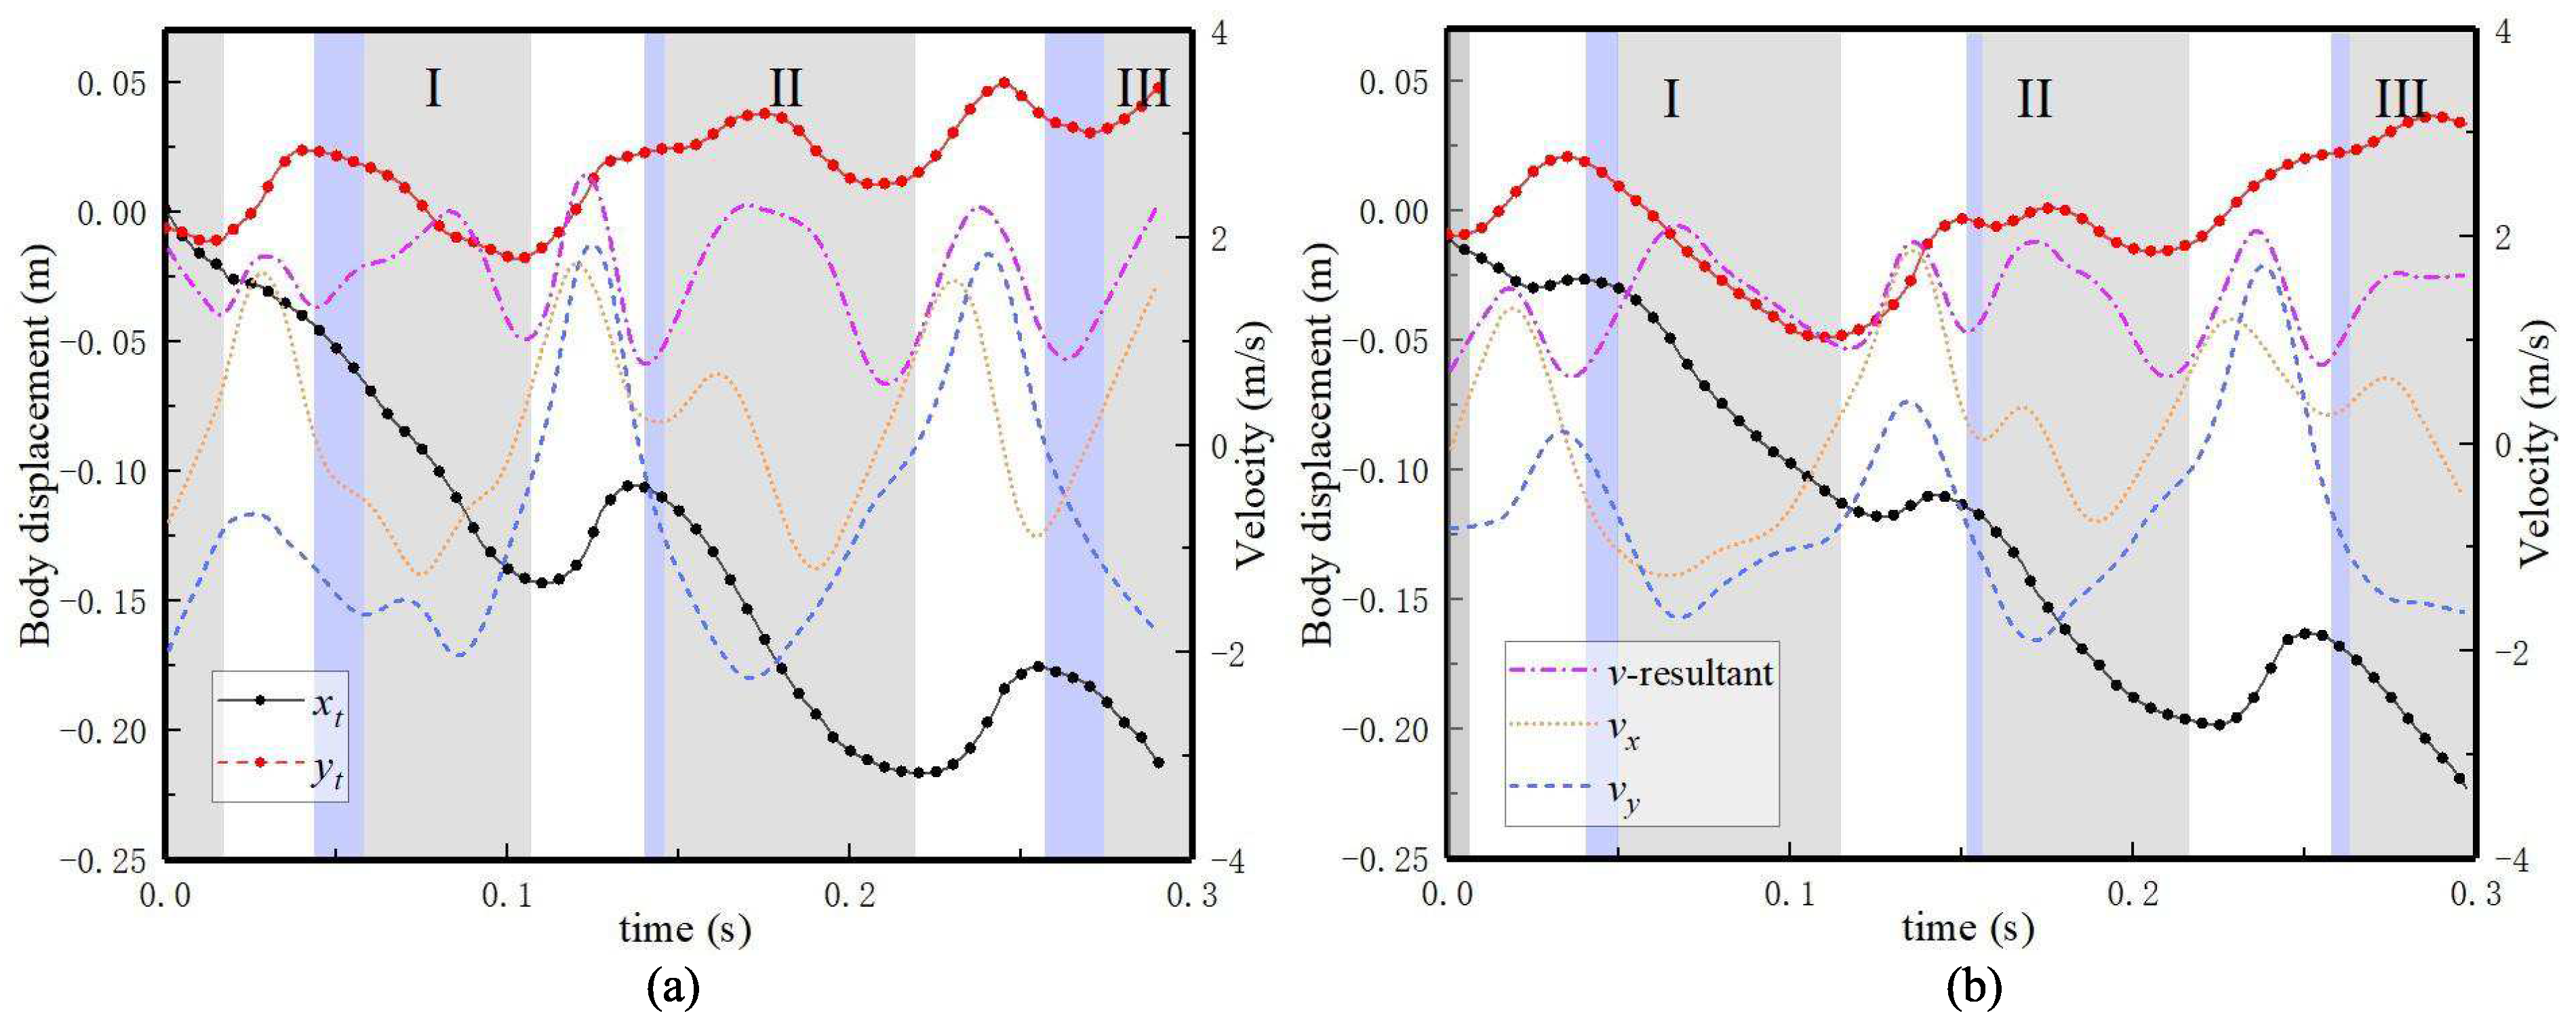
Figure 4.
Snapshots from the front-view camera of a butterfly in forward flight: VC1 (a); and VC2 (b). Trajectories of the butterfly feature points in the upward direction (along the Y-axis) and the forward direction (along the X-axis) during forward flight: VC1 (c); and VC2 (d).
Figure 4.
Snapshots from the front-view camera of a butterfly in forward flight: VC1 (a); and VC2 (b). Trajectories of the butterfly feature points in the upward direction (along the Y-axis) and the forward direction (along the X-axis) during forward flight: VC1 (c); and VC2 (d).
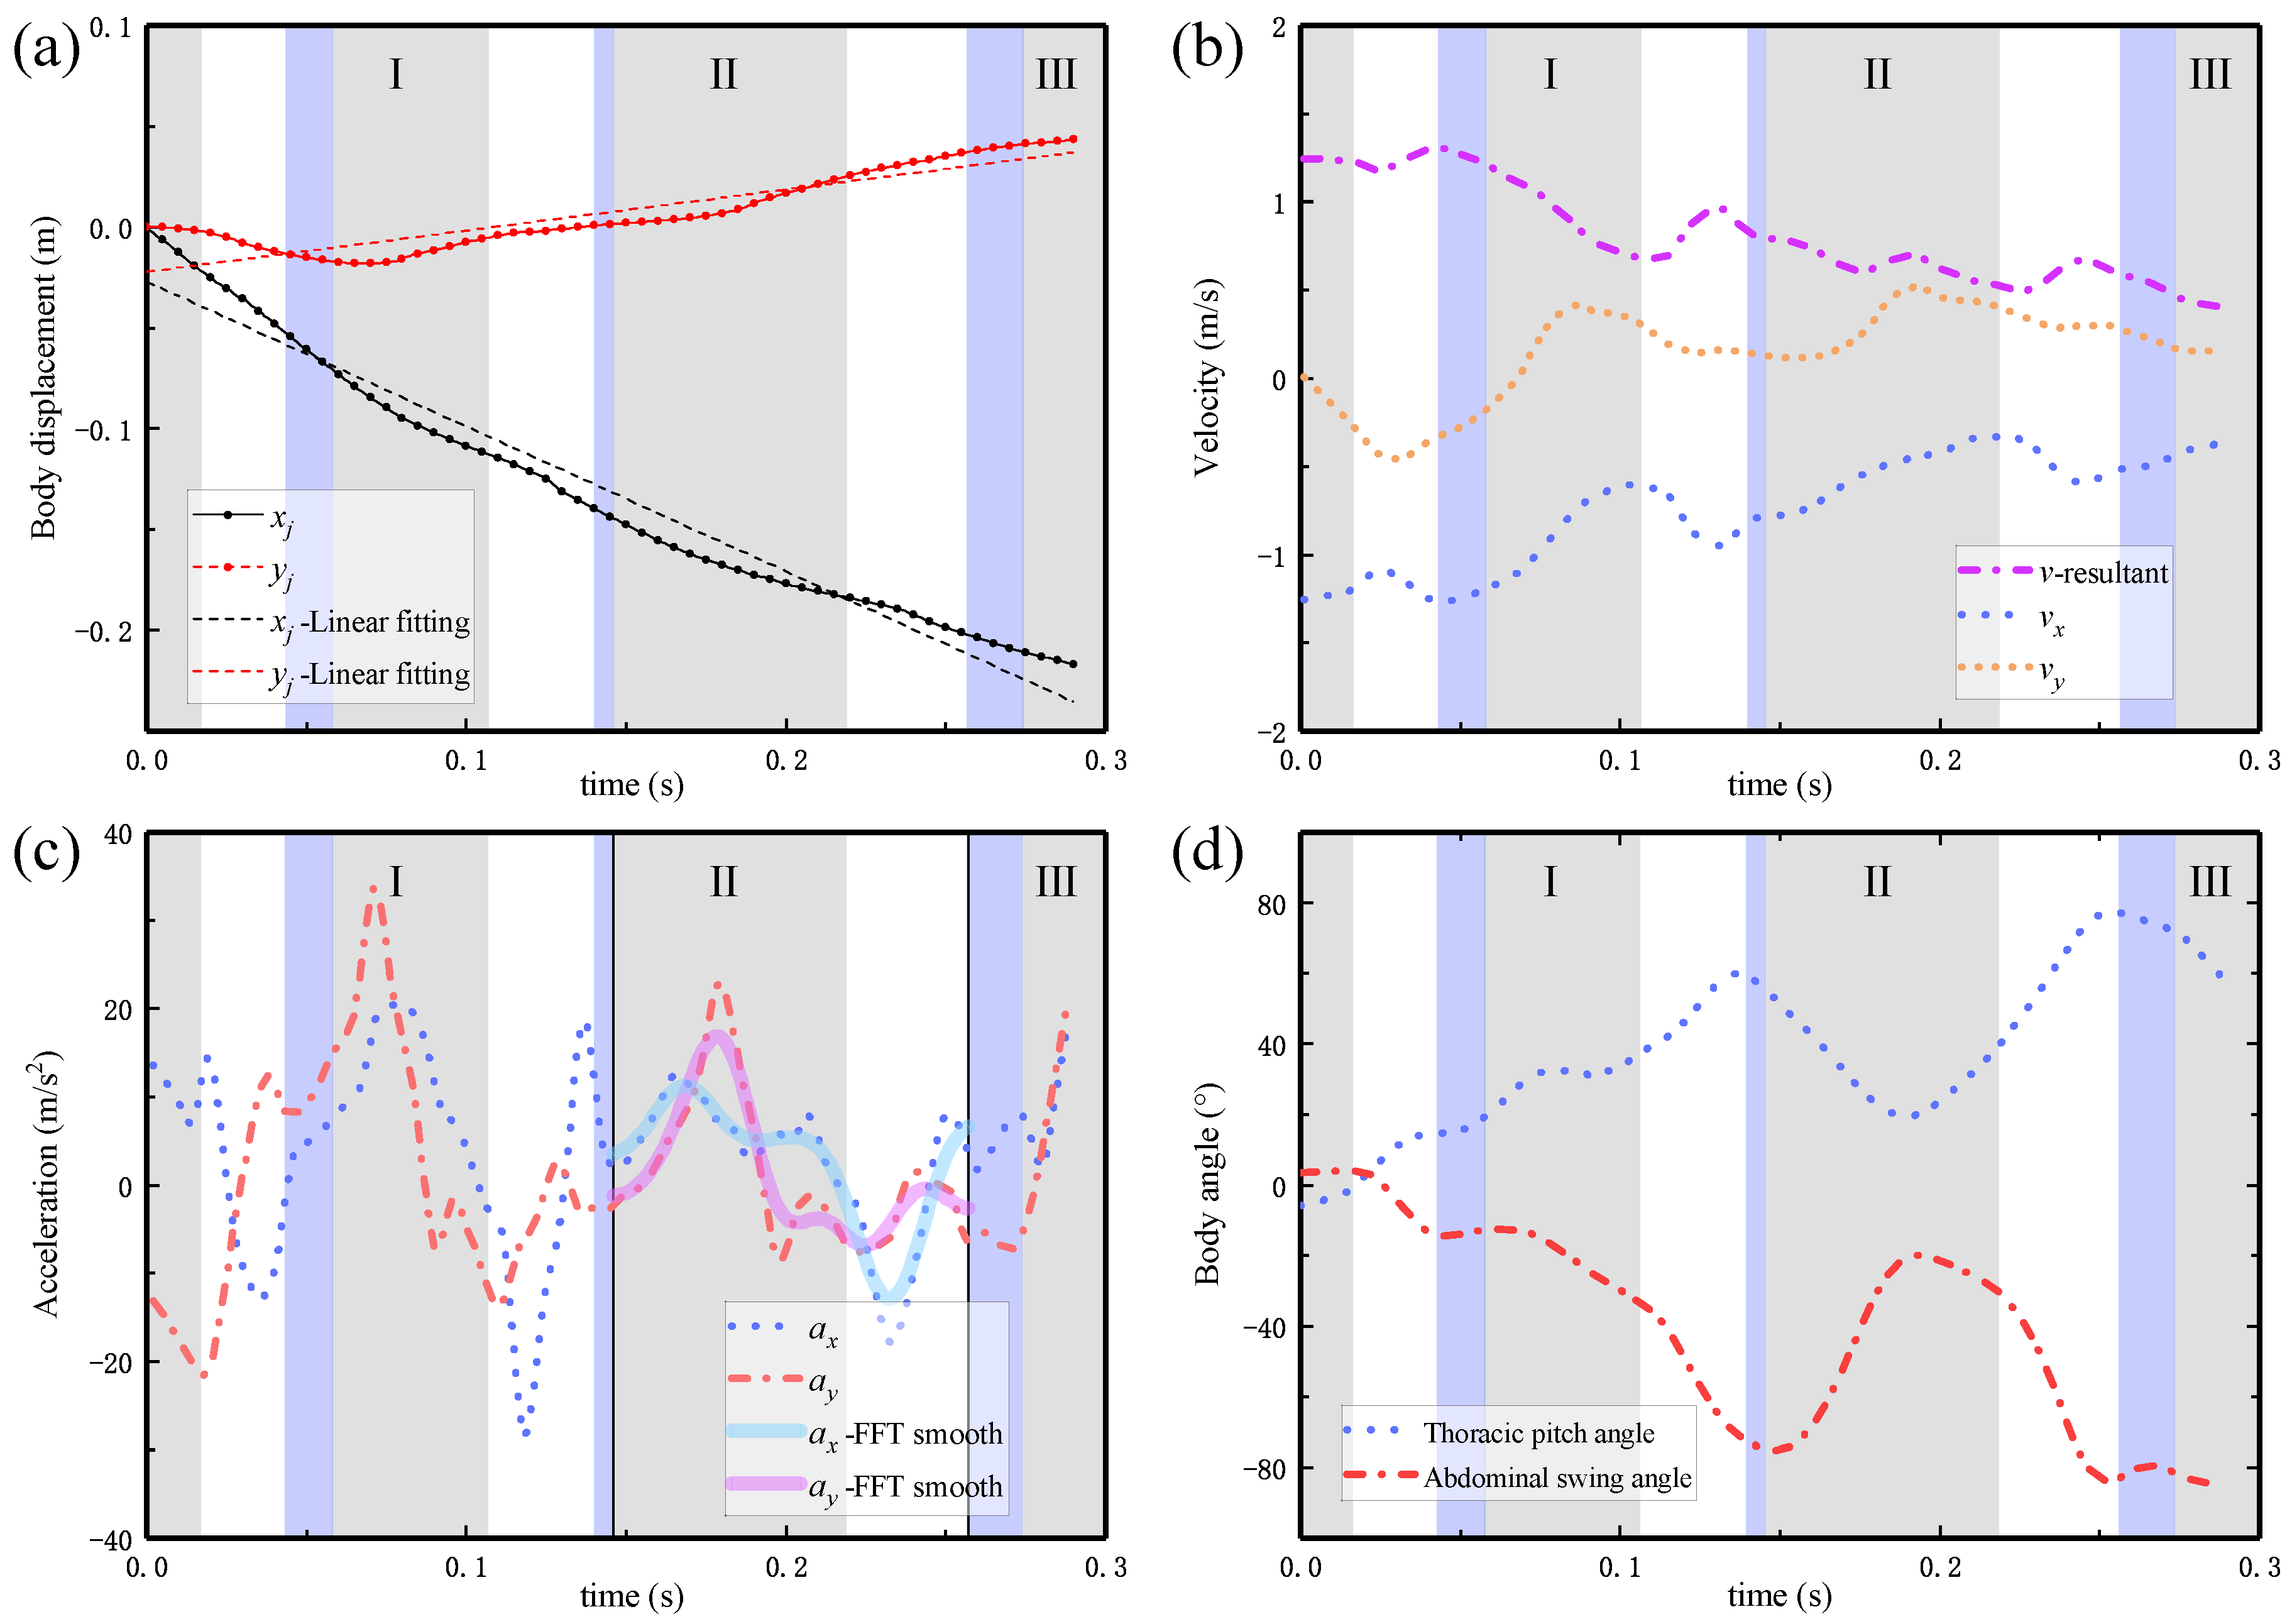
Figure 5.
Time variations of body kinematics of VC1: (a) displacement of the joint point during forward flight; (b) velocity of the butterfly centroid (joint point); (c) acceleration of the butterfly centroid and FFT smoothing for the second flapping cycle; and (d) oscillation of thoracic pitch angle and abdominal swing angle . Grey shading indicates the DS, purple shading denotes the gliding moment, and white shading denotes the US.
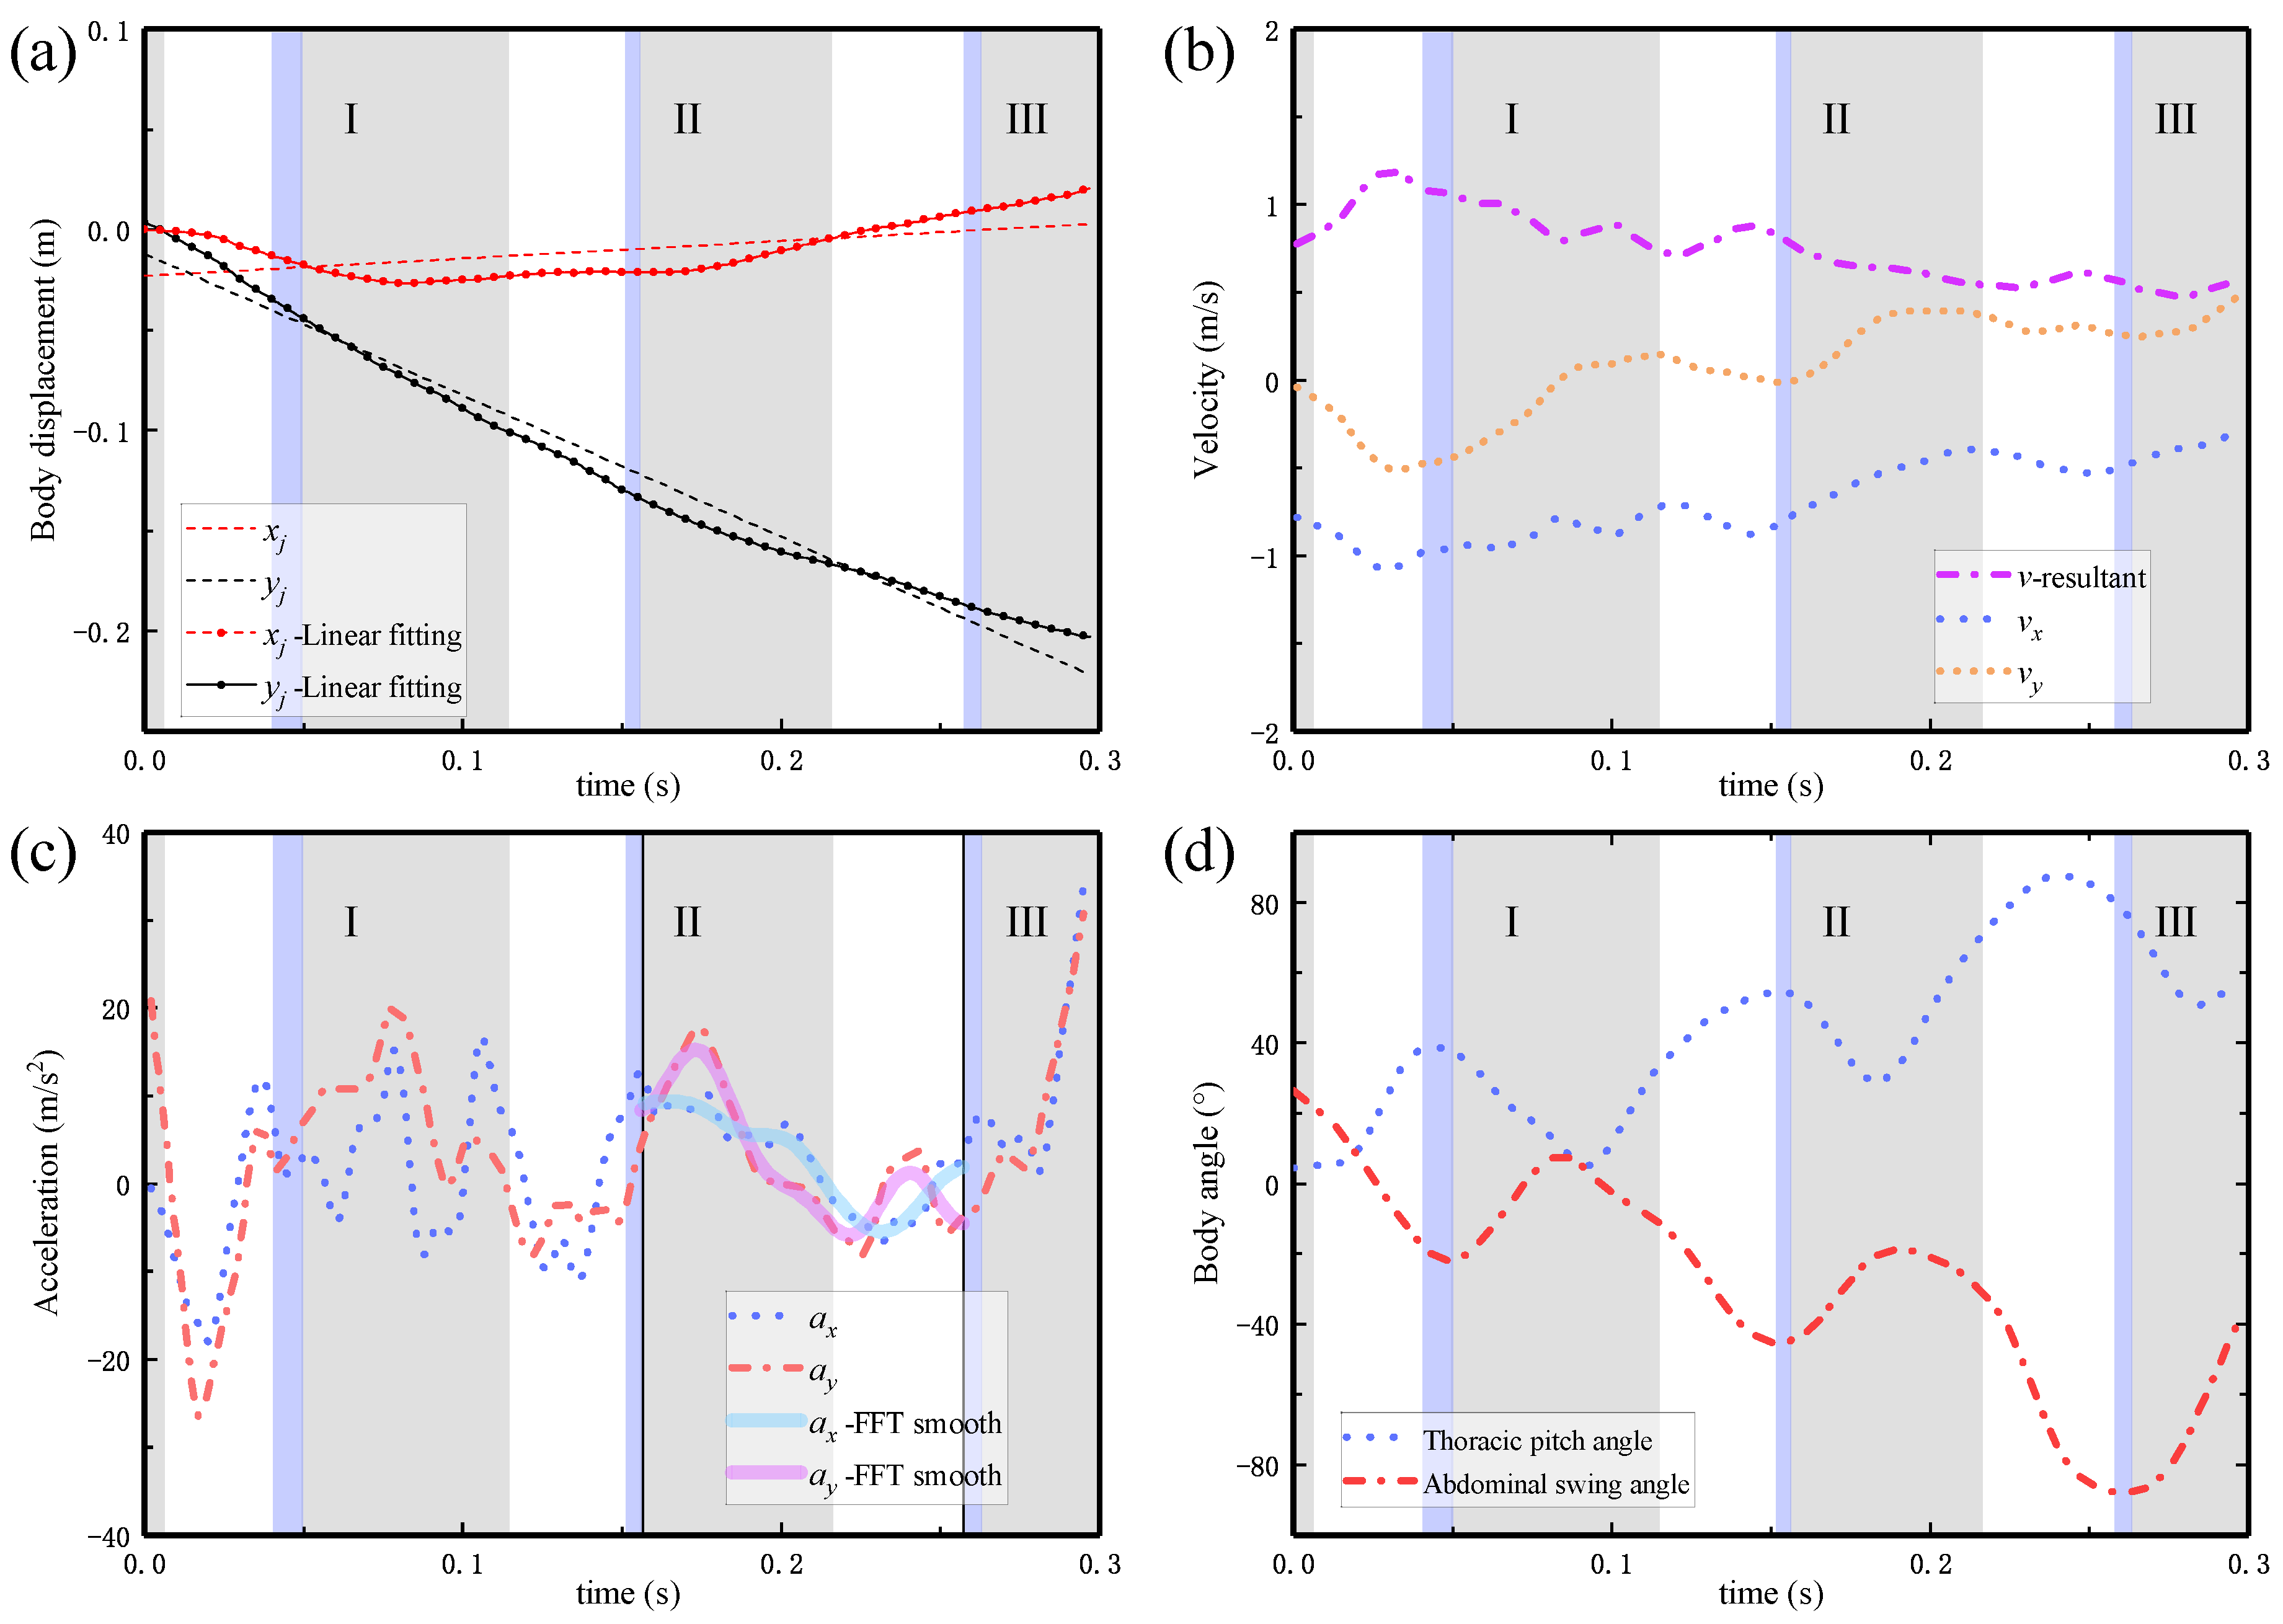
Figure 6.
Time variations of body kinematics of VC2: (a) displacement of the joint point during forward flight; (b) velocity of the butterfly centroid (joint point); (c) acceleration of the butterfly centroid and FFT smoothing for the second flapping cycle; and (d) oscillation of thoracic pitch angle and abdominal swing angle . Grey shading indicates the DS, purple shading denotes the gliding moment, and white shading denotes the US.
Figure 7.
Time variations of wing tip kinematics of: VC1 (a); and VC2 (b).
Figure 7.
Time variations of wing tip kinematics of: VC1 (a); and VC2 (b).
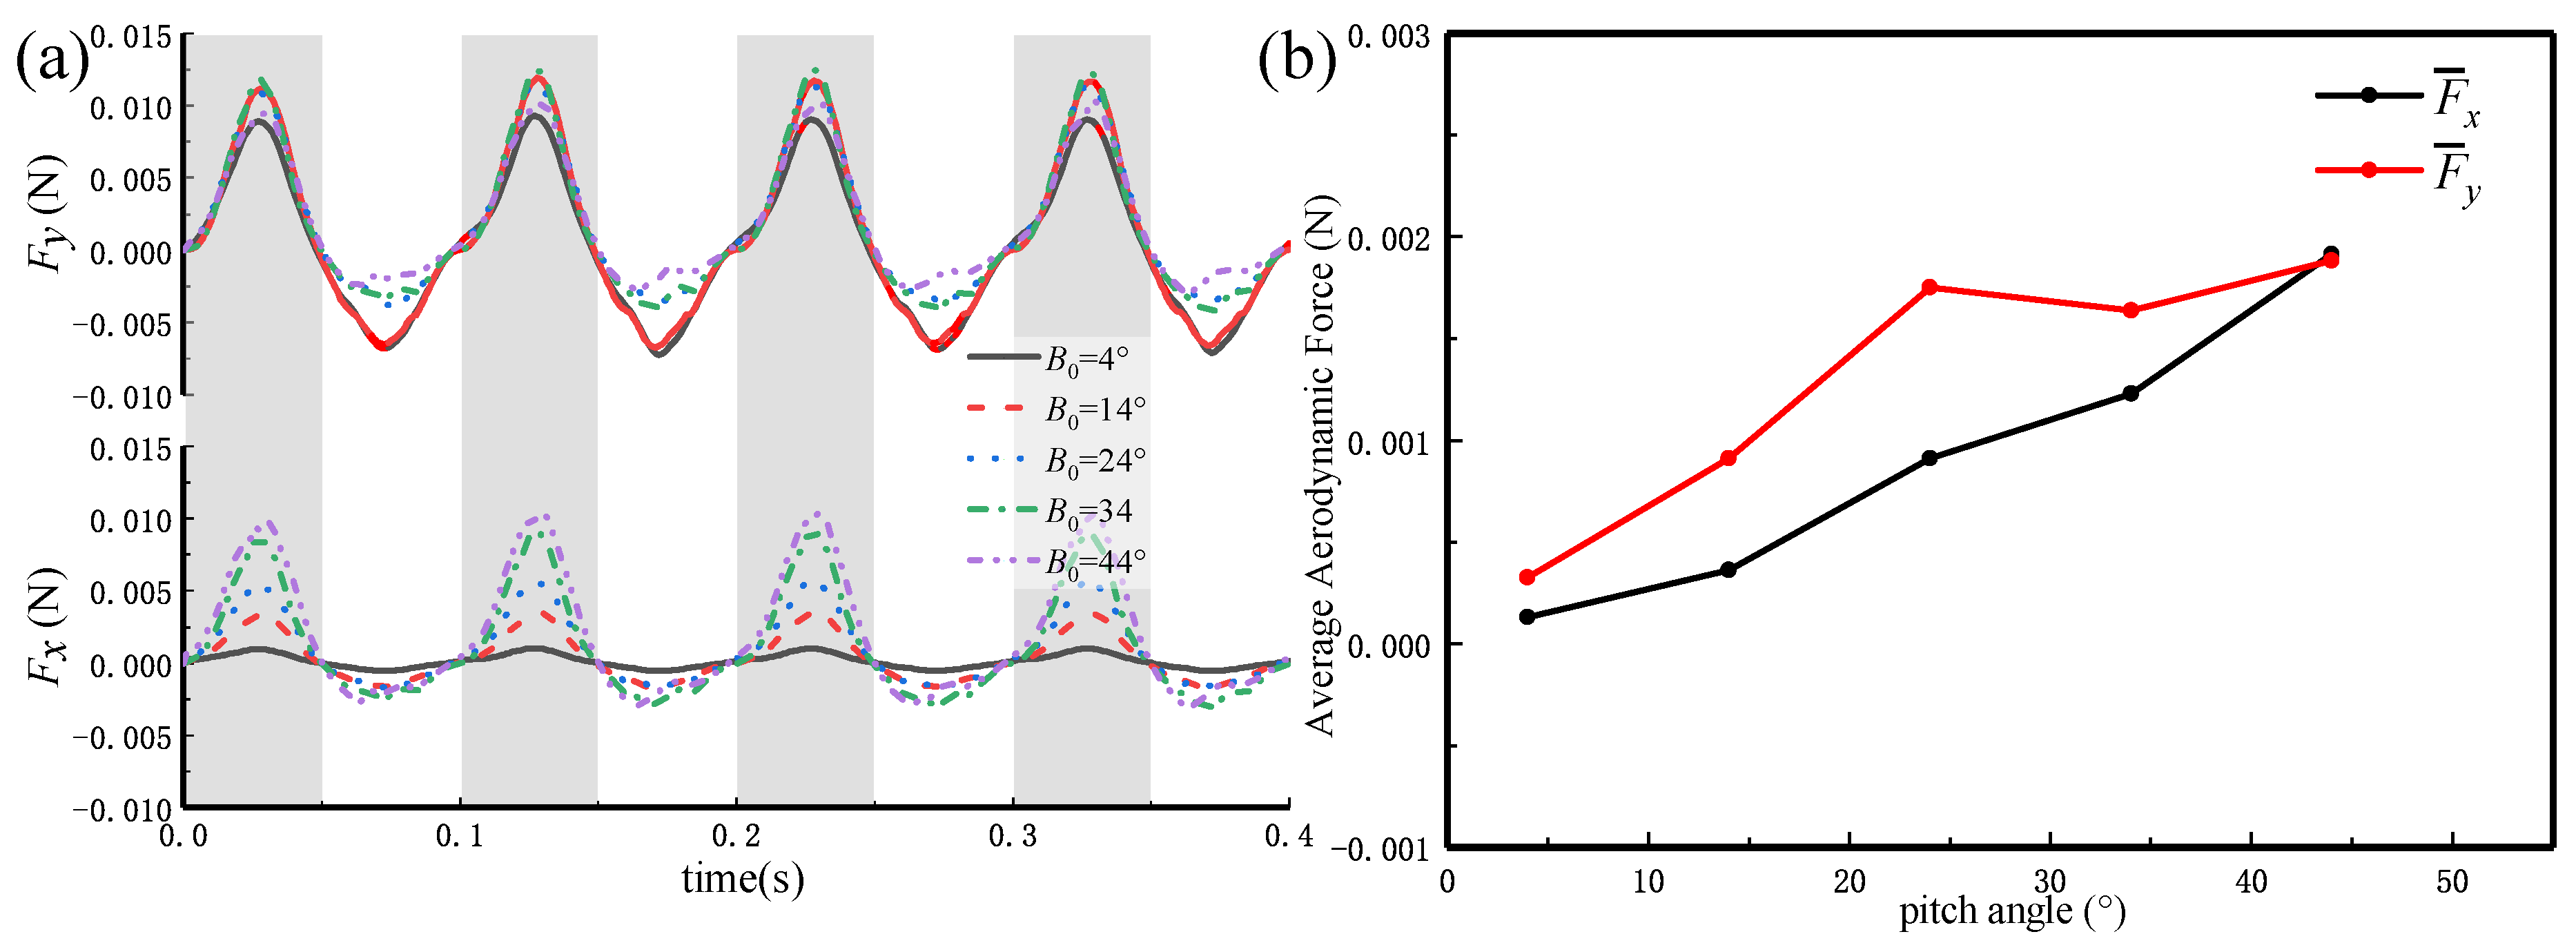
Figure 8.
(a) The instantaneous aerodynamic forces of the butterfly accompanied by the change of in four flapping cycles; and (b) the average aerodynamic forces at different fixed pitch angles.
Figure 8.
(a) The instantaneous aerodynamic forces of the butterfly accompanied by the change of in four flapping cycles; and (b) the average aerodynamic forces at different fixed pitch angles.
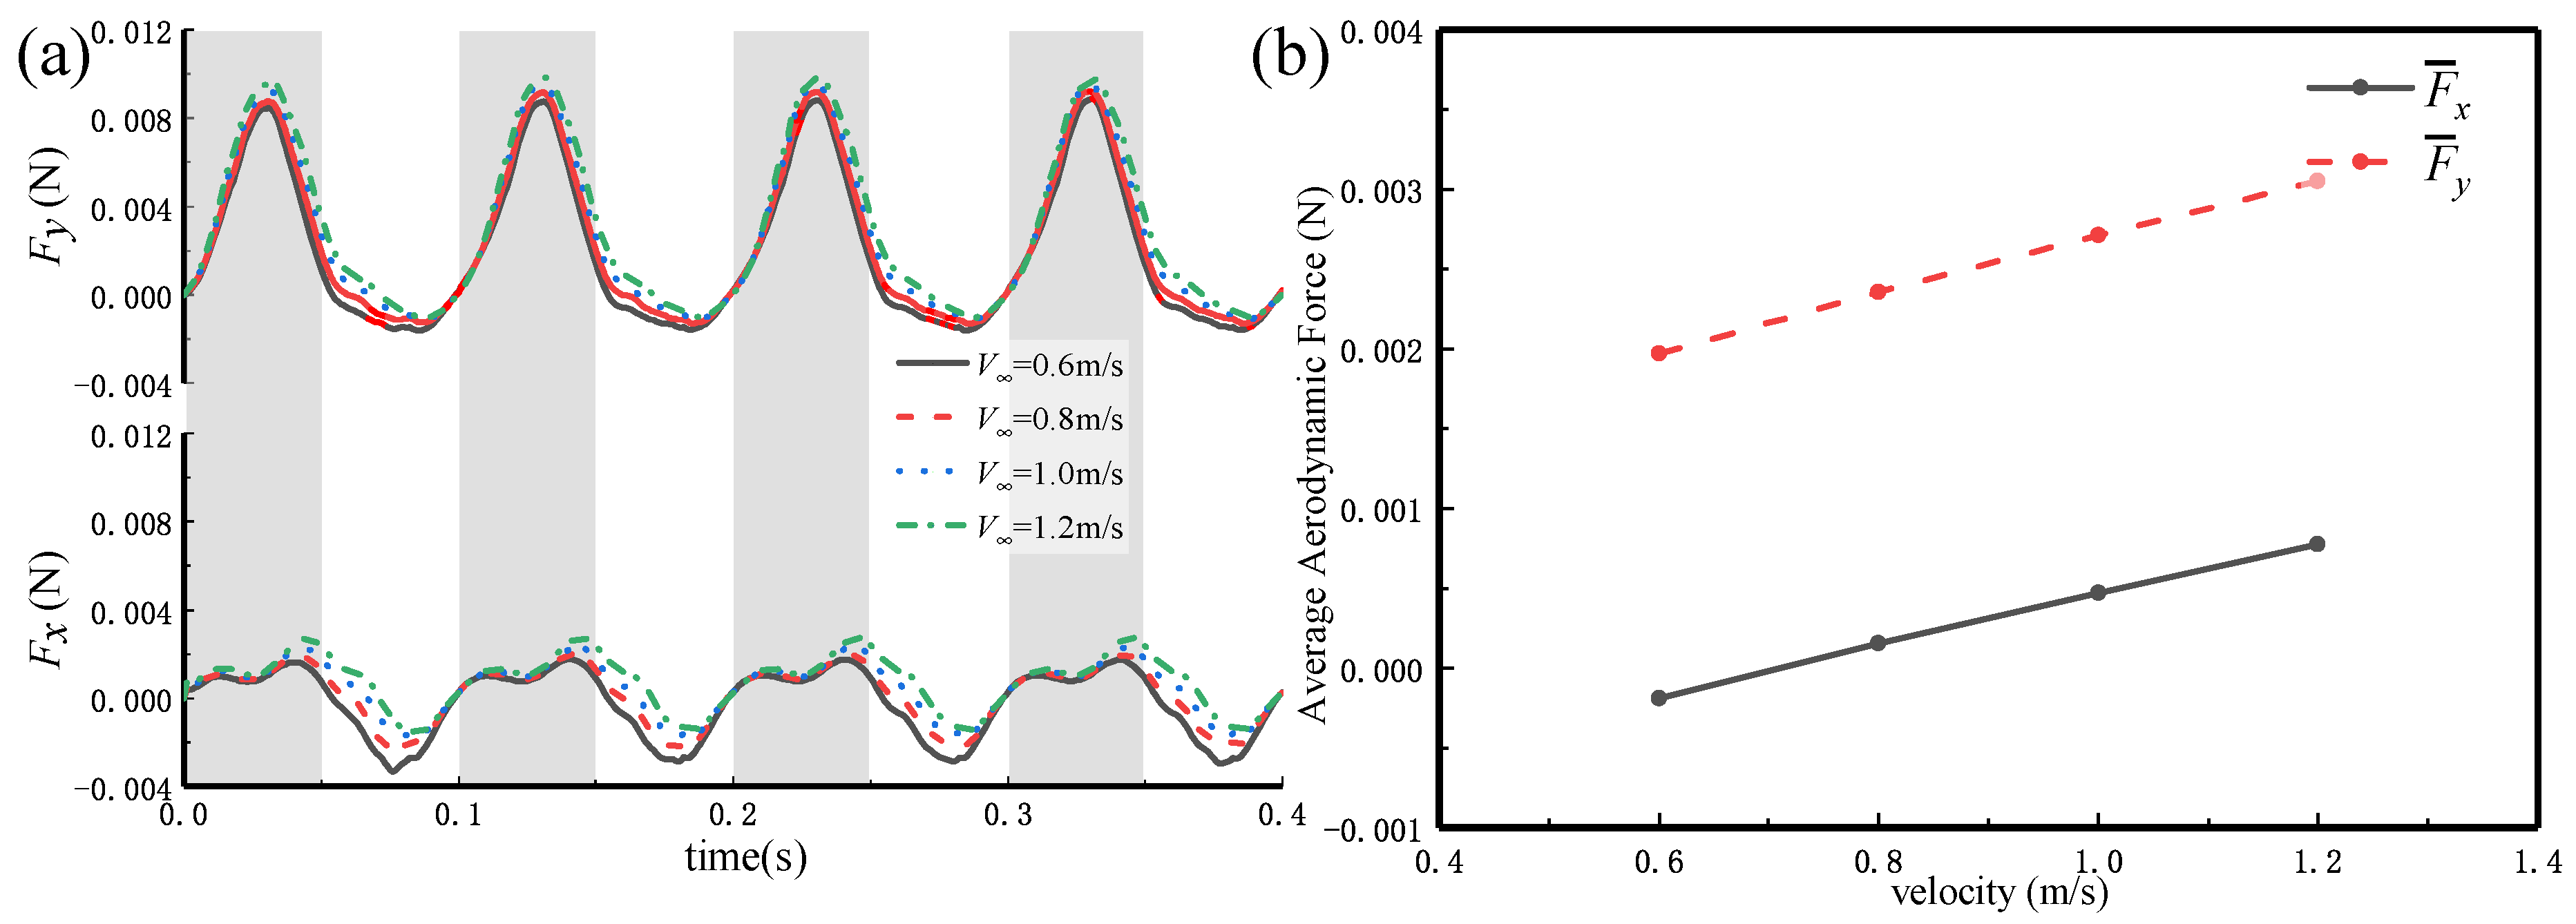
Figure 9.
(a) The instantaneous aerodynamic forces of the butterfly accompanied by the change of in four flapping cycles; and (b) the average aerodynamic forces at different incoming flow velocity.
Figure 9.
(a) The instantaneous aerodynamic forces of the butterfly accompanied by the change of in four flapping cycles; and (b) the average aerodynamic forces at different incoming flow velocity.
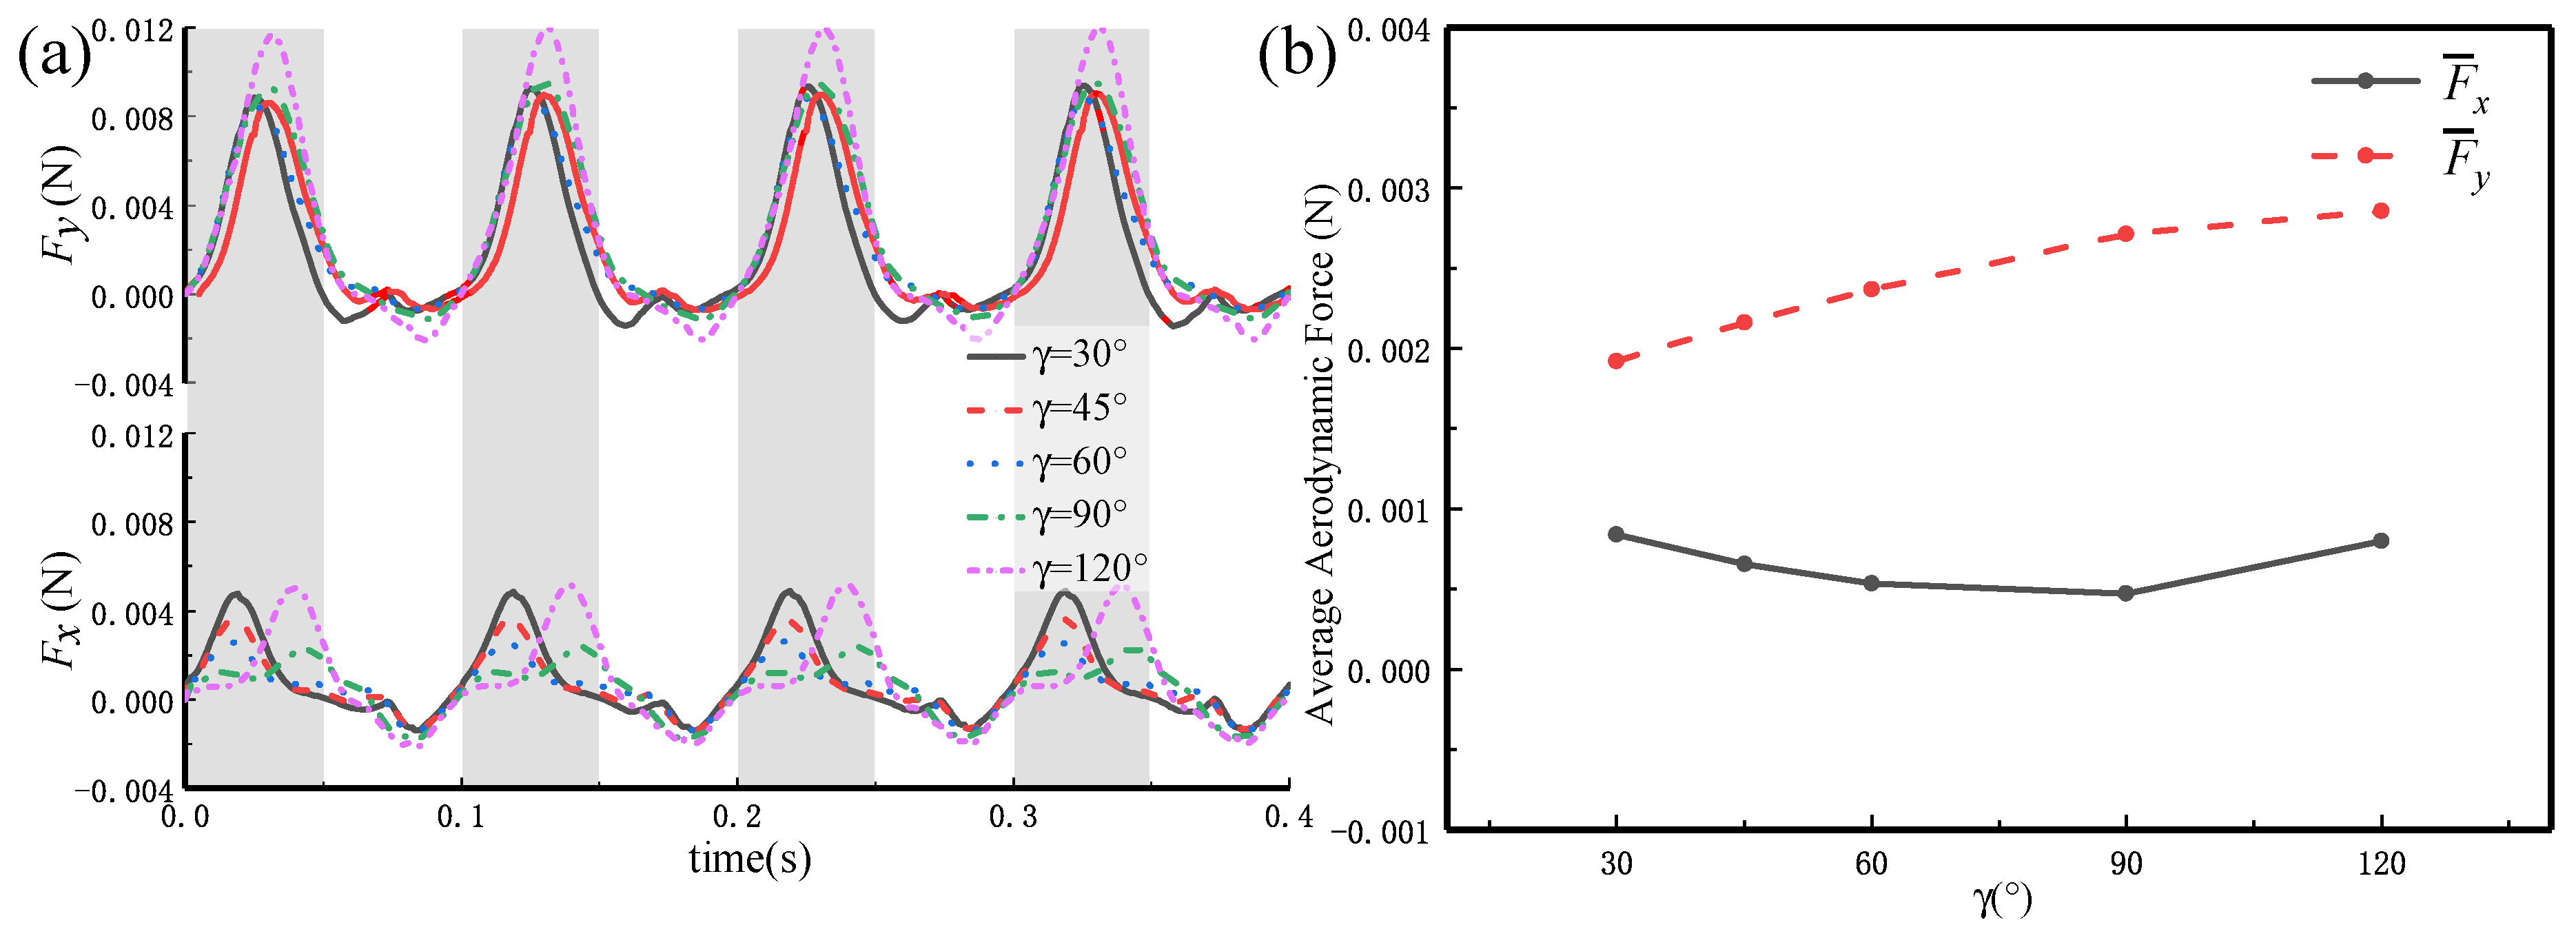
Figure 10.
(a) The instantaneous aerodynamic forces of the butterfly accompanied by the change of in four flapping cycles; and (b) the average aerodynamic forces at different phase differences.
Figure 10.
(a) The instantaneous aerodynamic forces of the butterfly accompanied by the change of in four flapping cycles; and (b) the average aerodynamic forces at different phase differences.
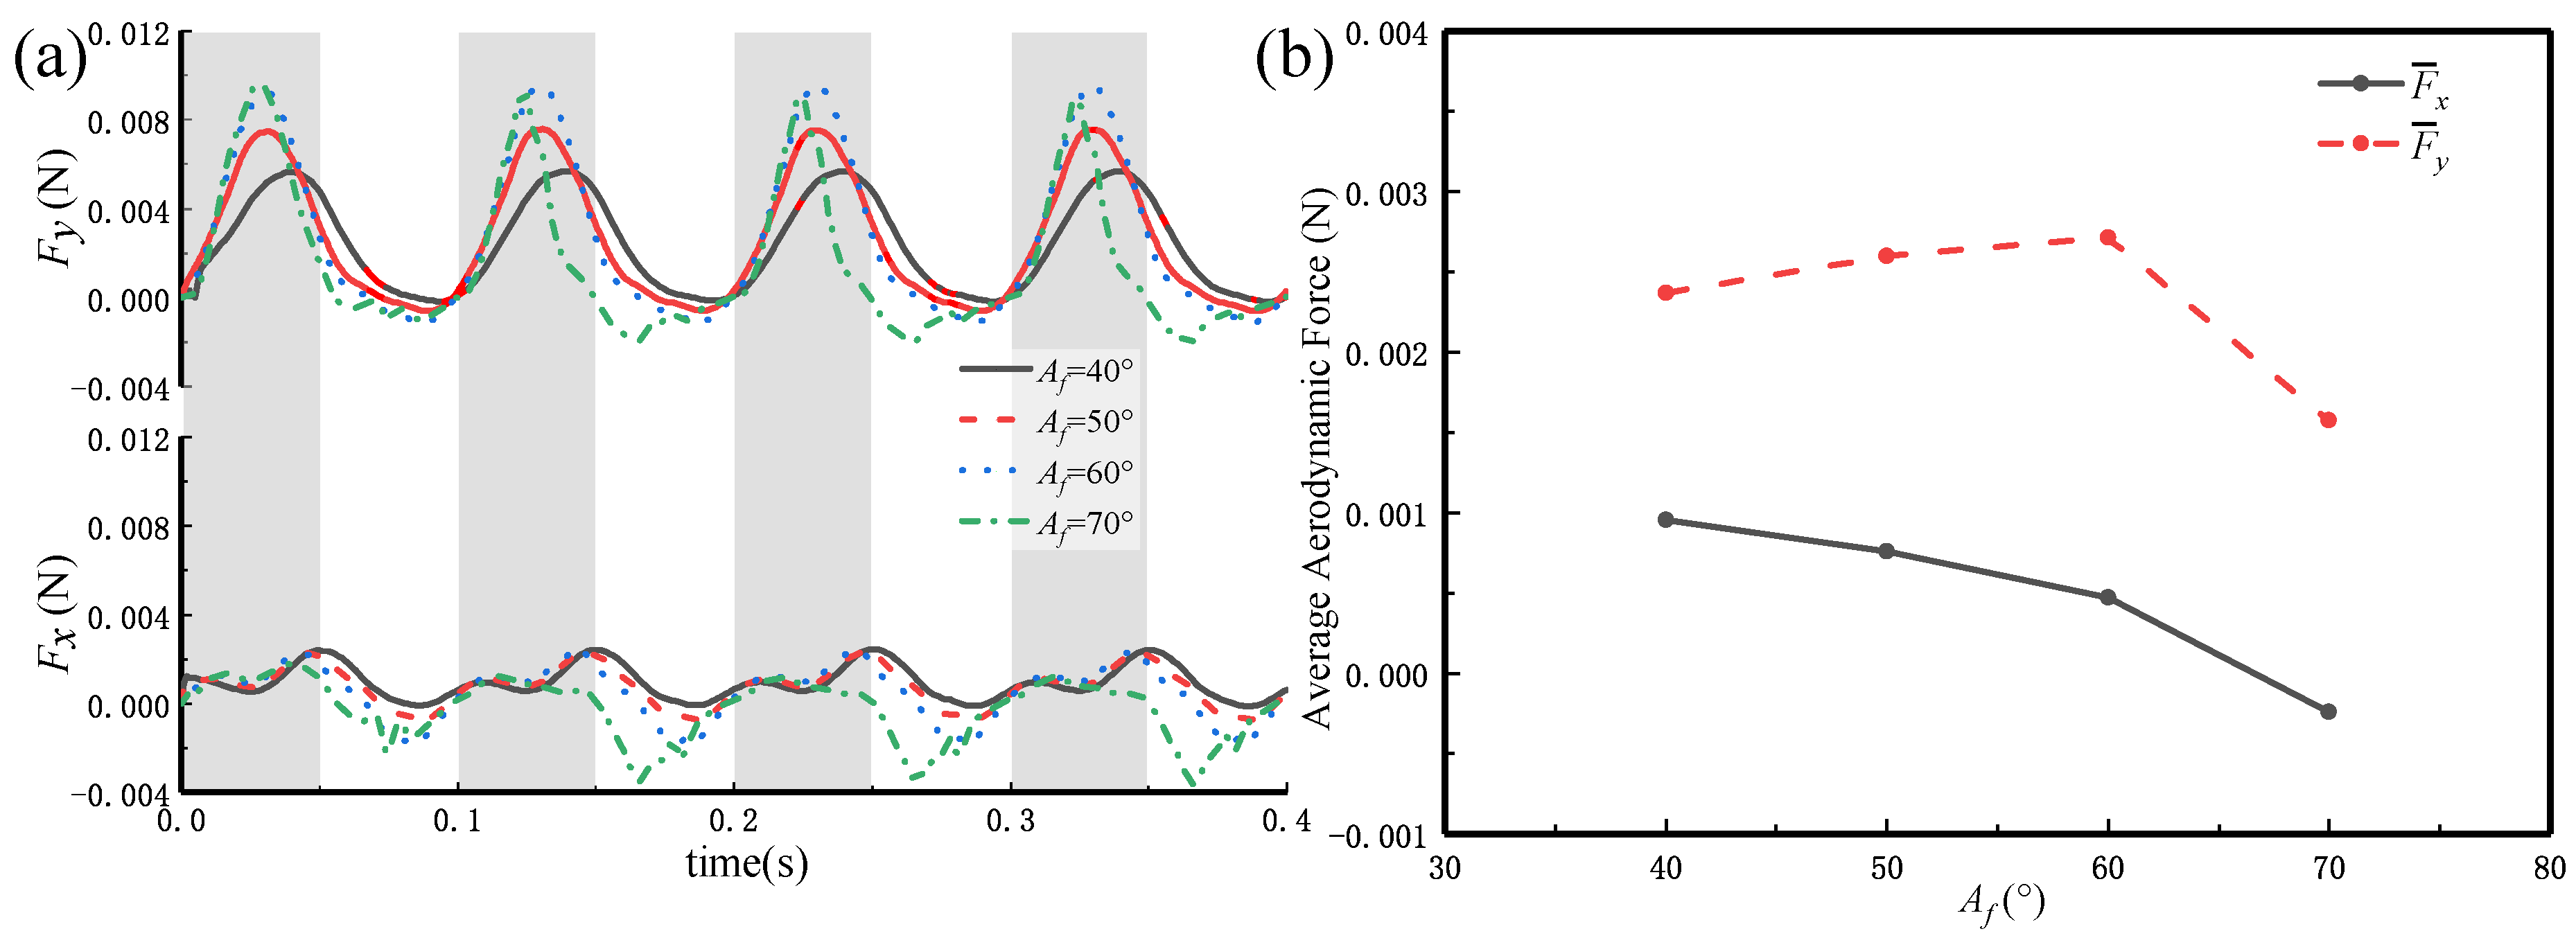
Figure 11.
(a) The instantaneous aerodynamic forces of the butterfly accompanied by the change of in four flapping cycles; and (b) the average aerodynamic forces at different amplitude of flapping angles.
Figure 11.
(a) The instantaneous aerodynamic forces of the butterfly accompanied by the change of in four flapping cycles; and (b) the average aerodynamic forces at different amplitude of flapping angles.
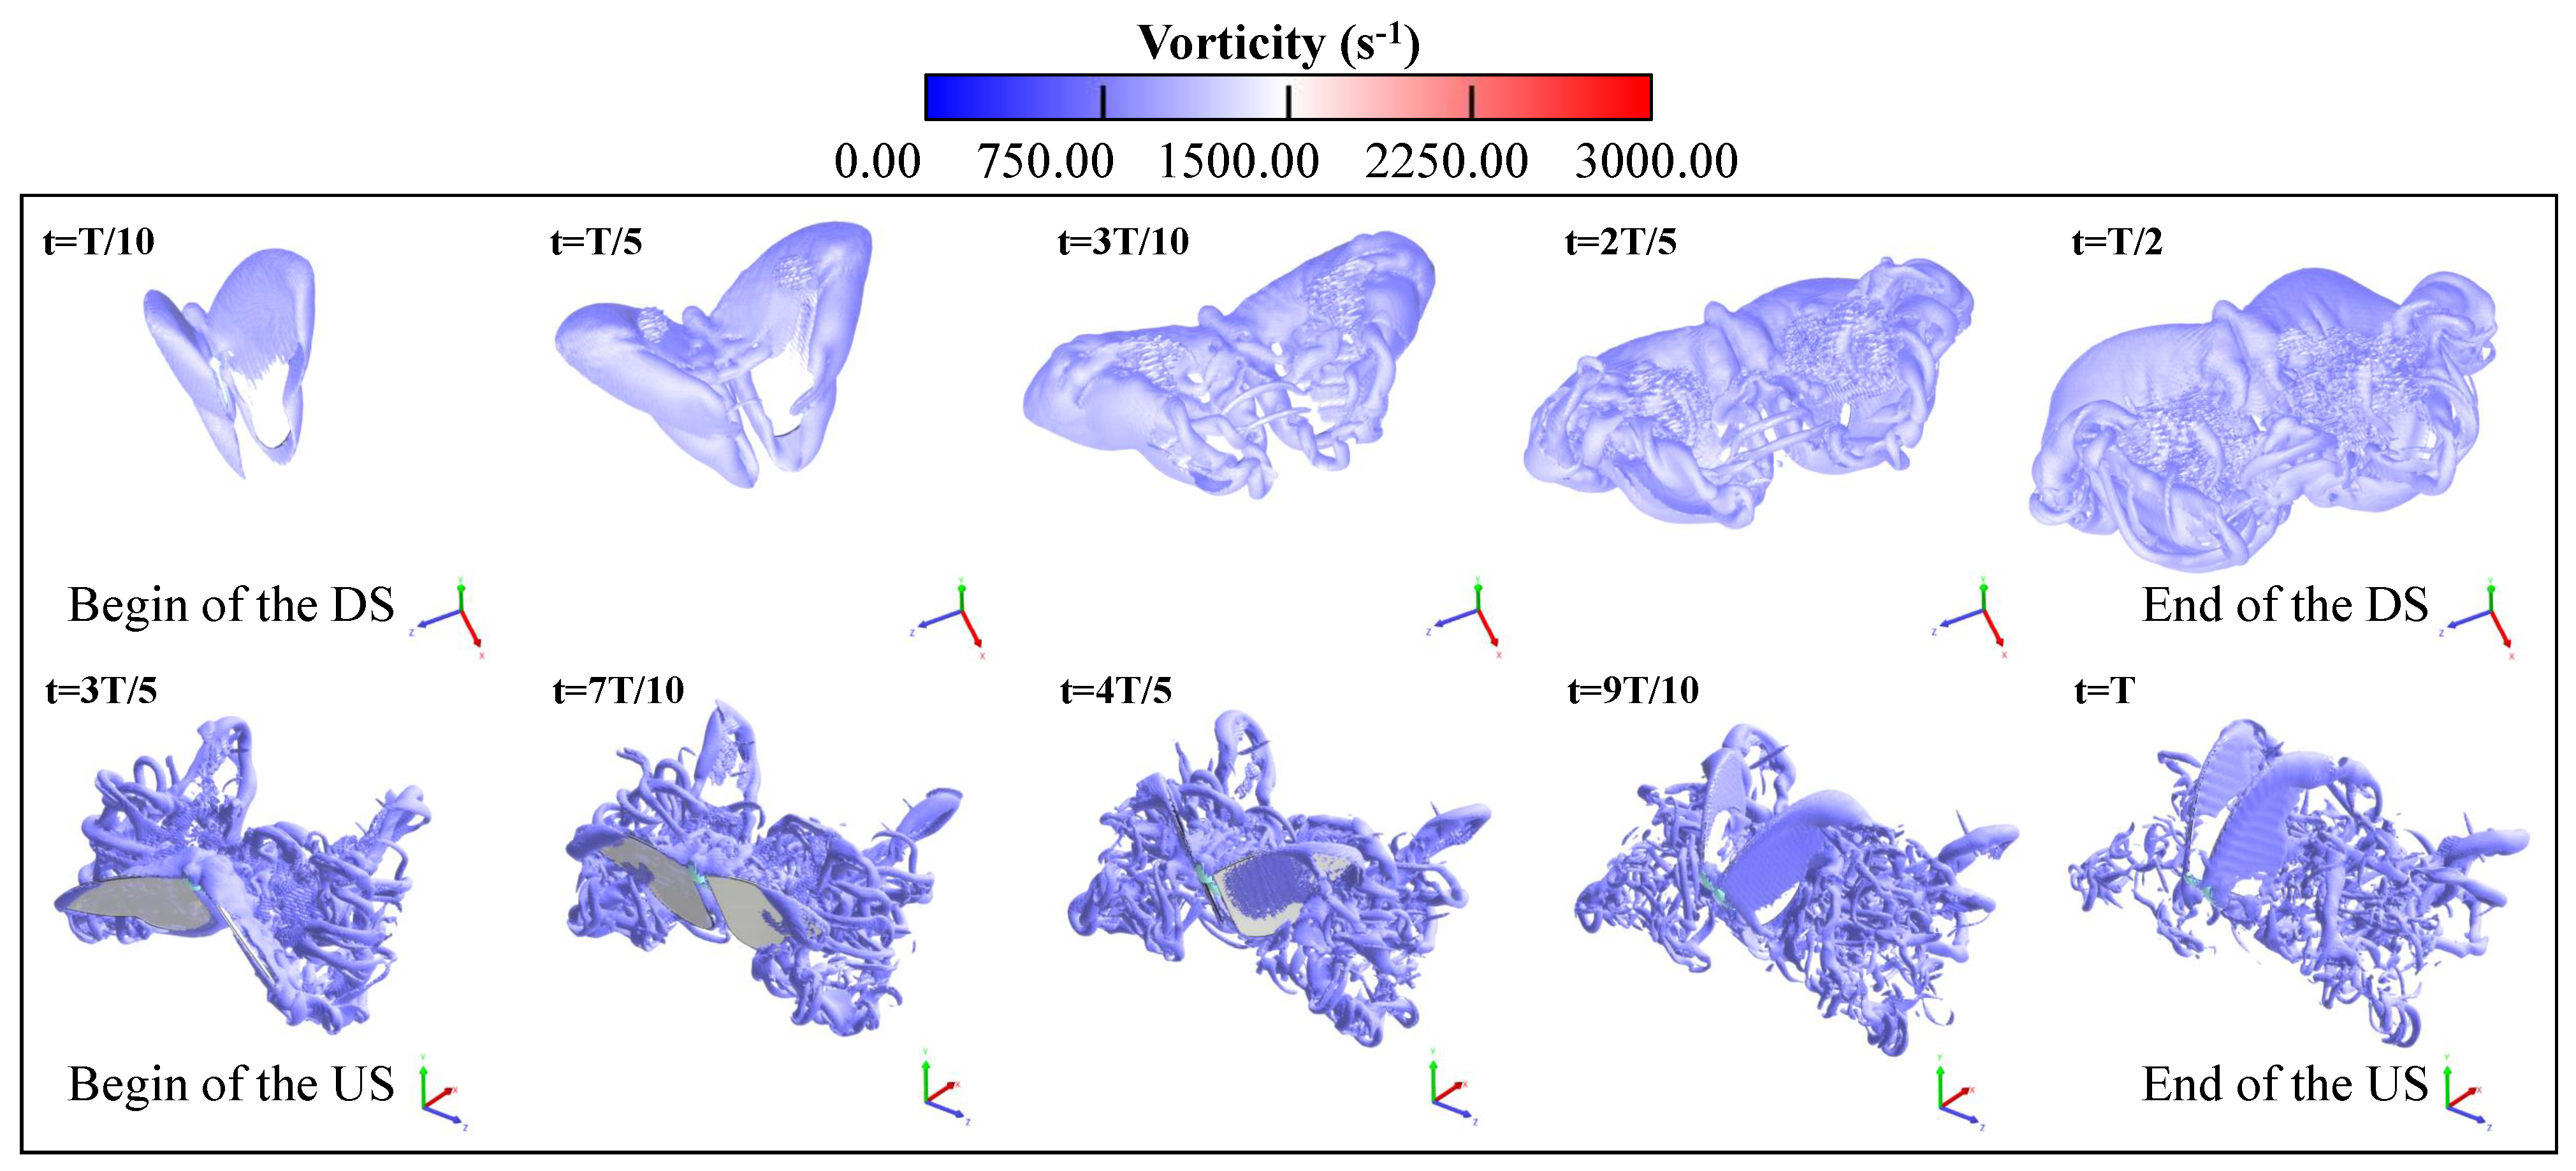
Figure 12.
3D vortex structures in the flow for the butterfly in one flapping cycle at = 0.1, 0.2, 0.3, 0.4,0.5, 0.6, 0.7, 0.8, 0.9, and 1.0 The iso-surface of the vorticity ( = 7 × 10 s).
Figure 12.
3D vortex structures in the flow for the butterfly in one flapping cycle at = 0.1, 0.2, 0.3, 0.4,0.5, 0.6, 0.7, 0.8, 0.9, and 1.0 The iso-surface of the vorticity ( = 7 × 10 s).
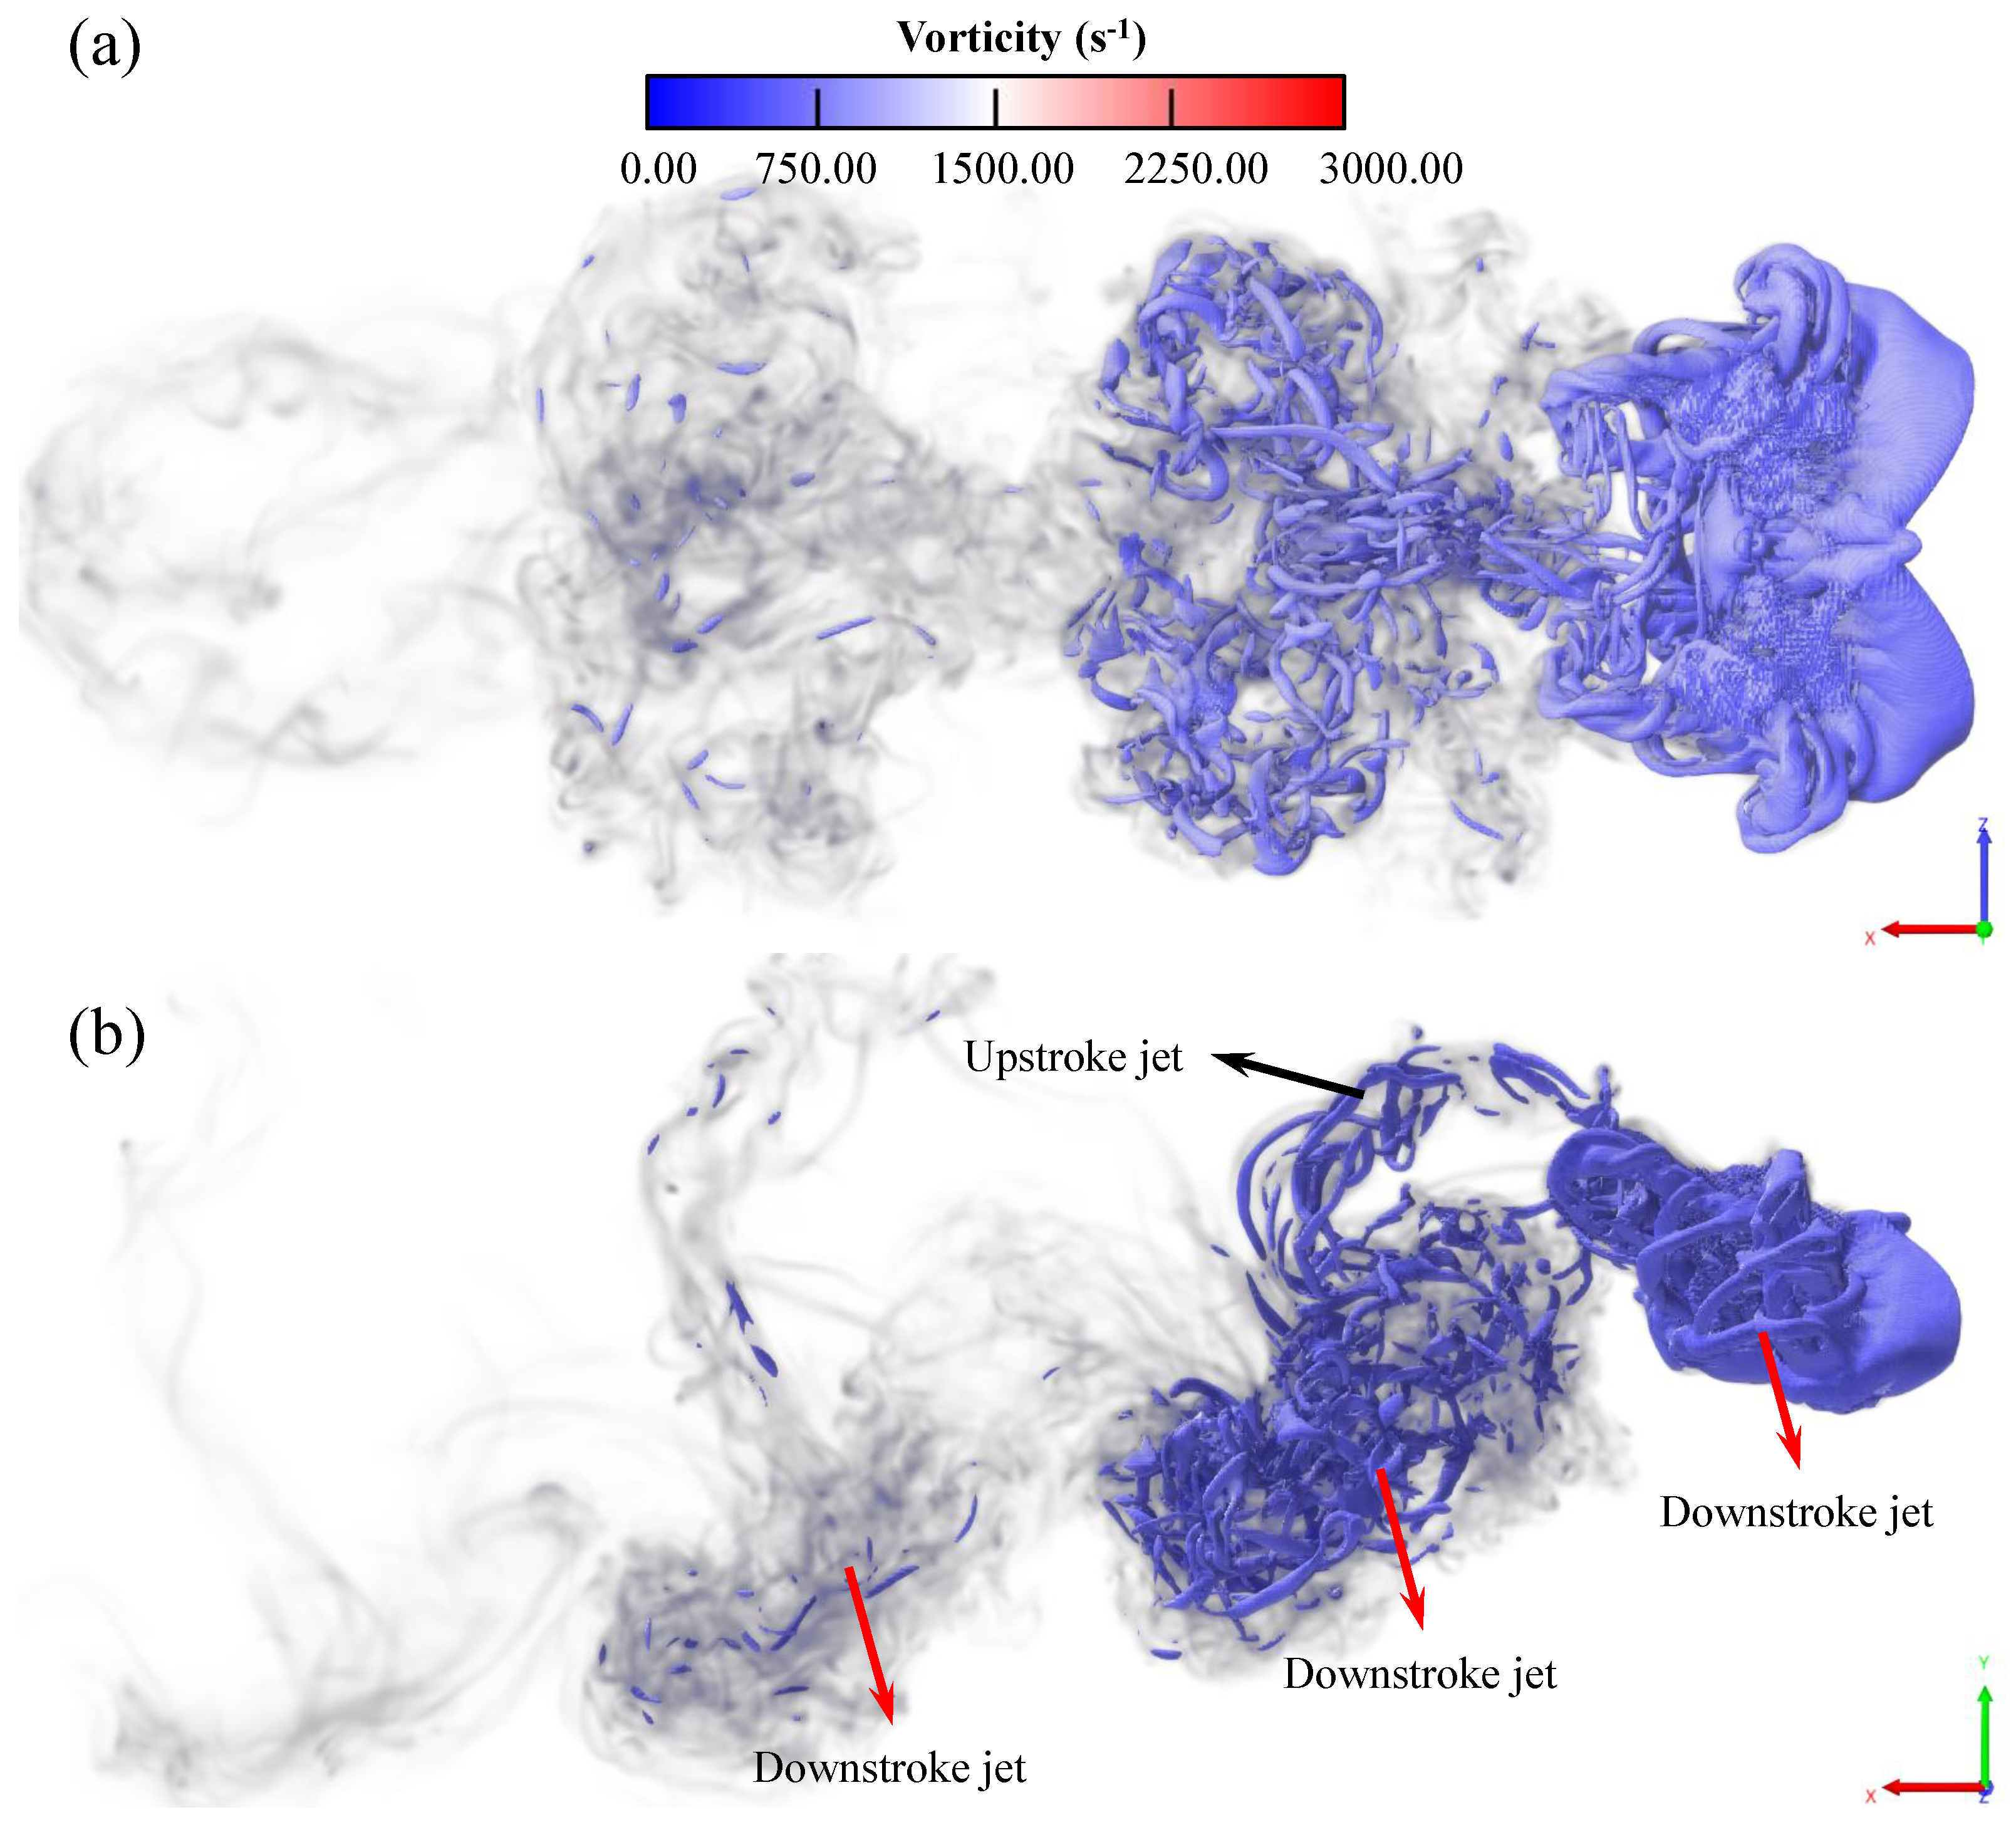
Figure 13.
Vortical structures visualized by the vorticity. The iso-surface of = 6 × 10 s is drawn: (a) top view; and (b) side view at = 3.5.
Figure 13.
Vortical structures visualized by the vorticity. The iso-surface of = 6 × 10 s is drawn: (a) top view; and (b) side view at = 3.5.
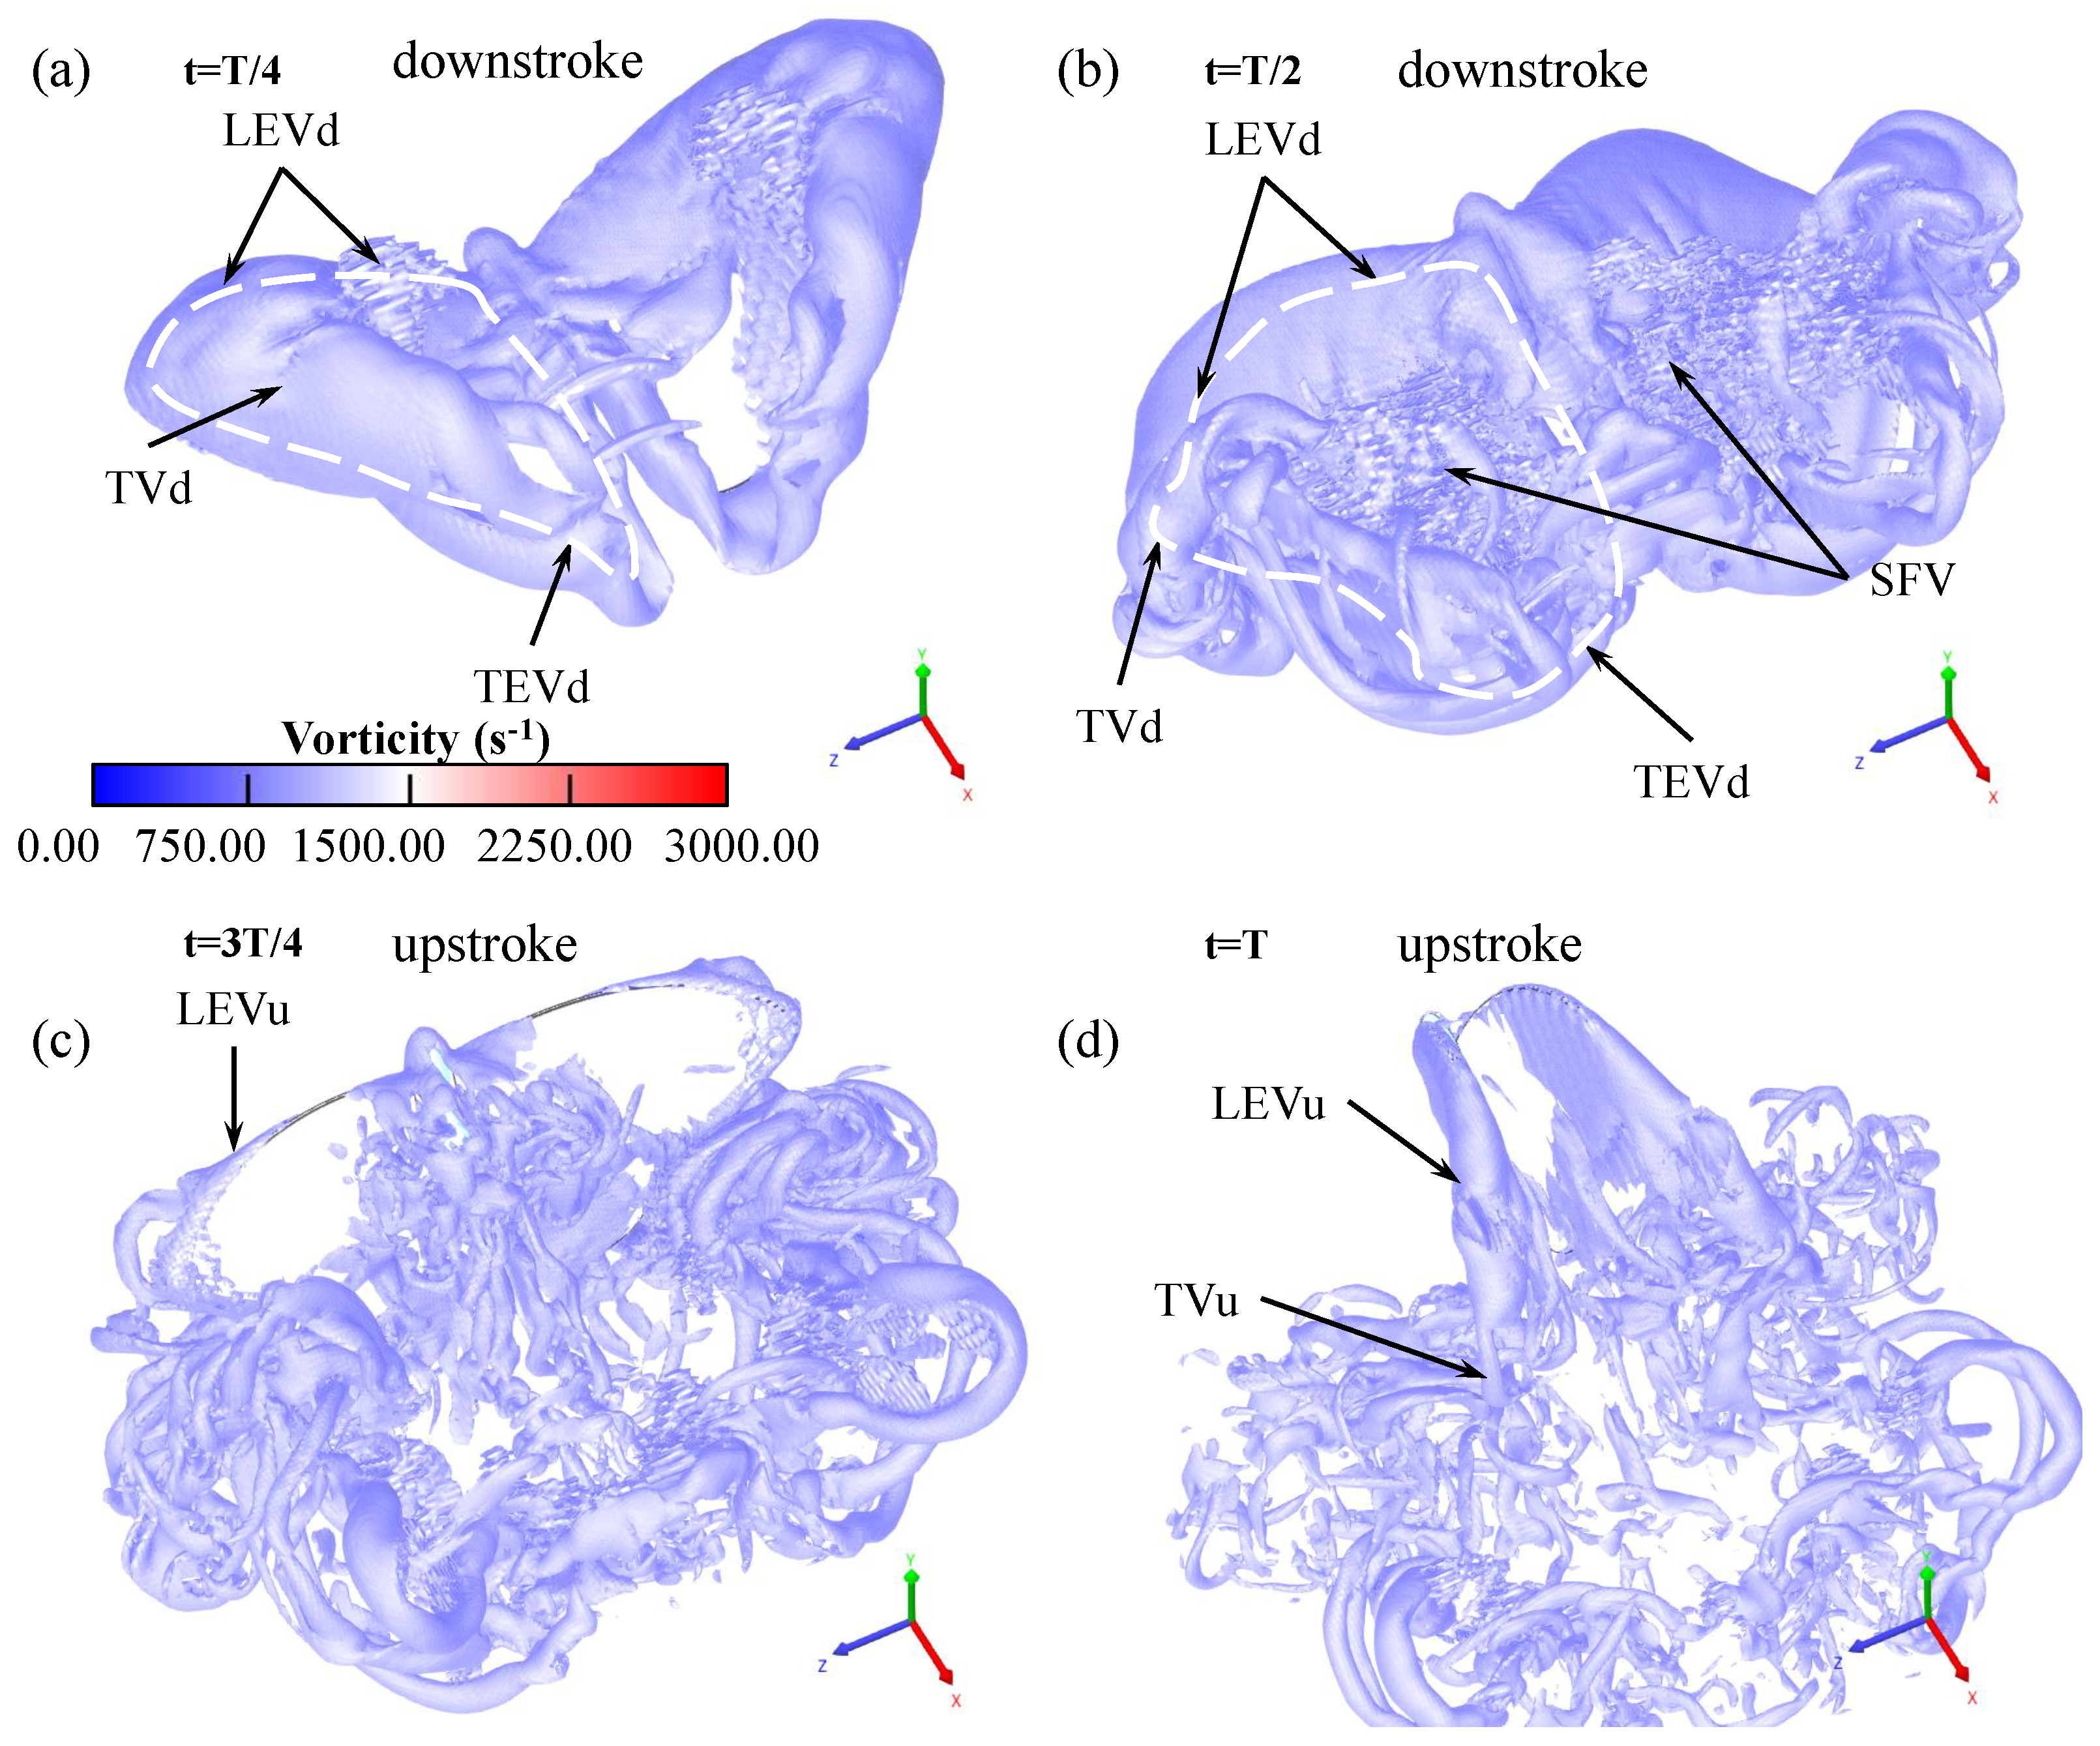
Figure 14.
High-resolution visualization of 3D vortex structures in forward flight. The iso-surface of the vorticity ( = 7 × 10 s) at = 0.25 (a), 0.5 (b), 0.75 (c), and 1 (d), respectively.
Figure 14.
High-resolution visualization of 3D vortex structures in forward flight. The iso-surface of the vorticity ( = 7 × 10 s) at = 0.25 (a), 0.5 (b), 0.75 (c), and 1 (d), respectively.
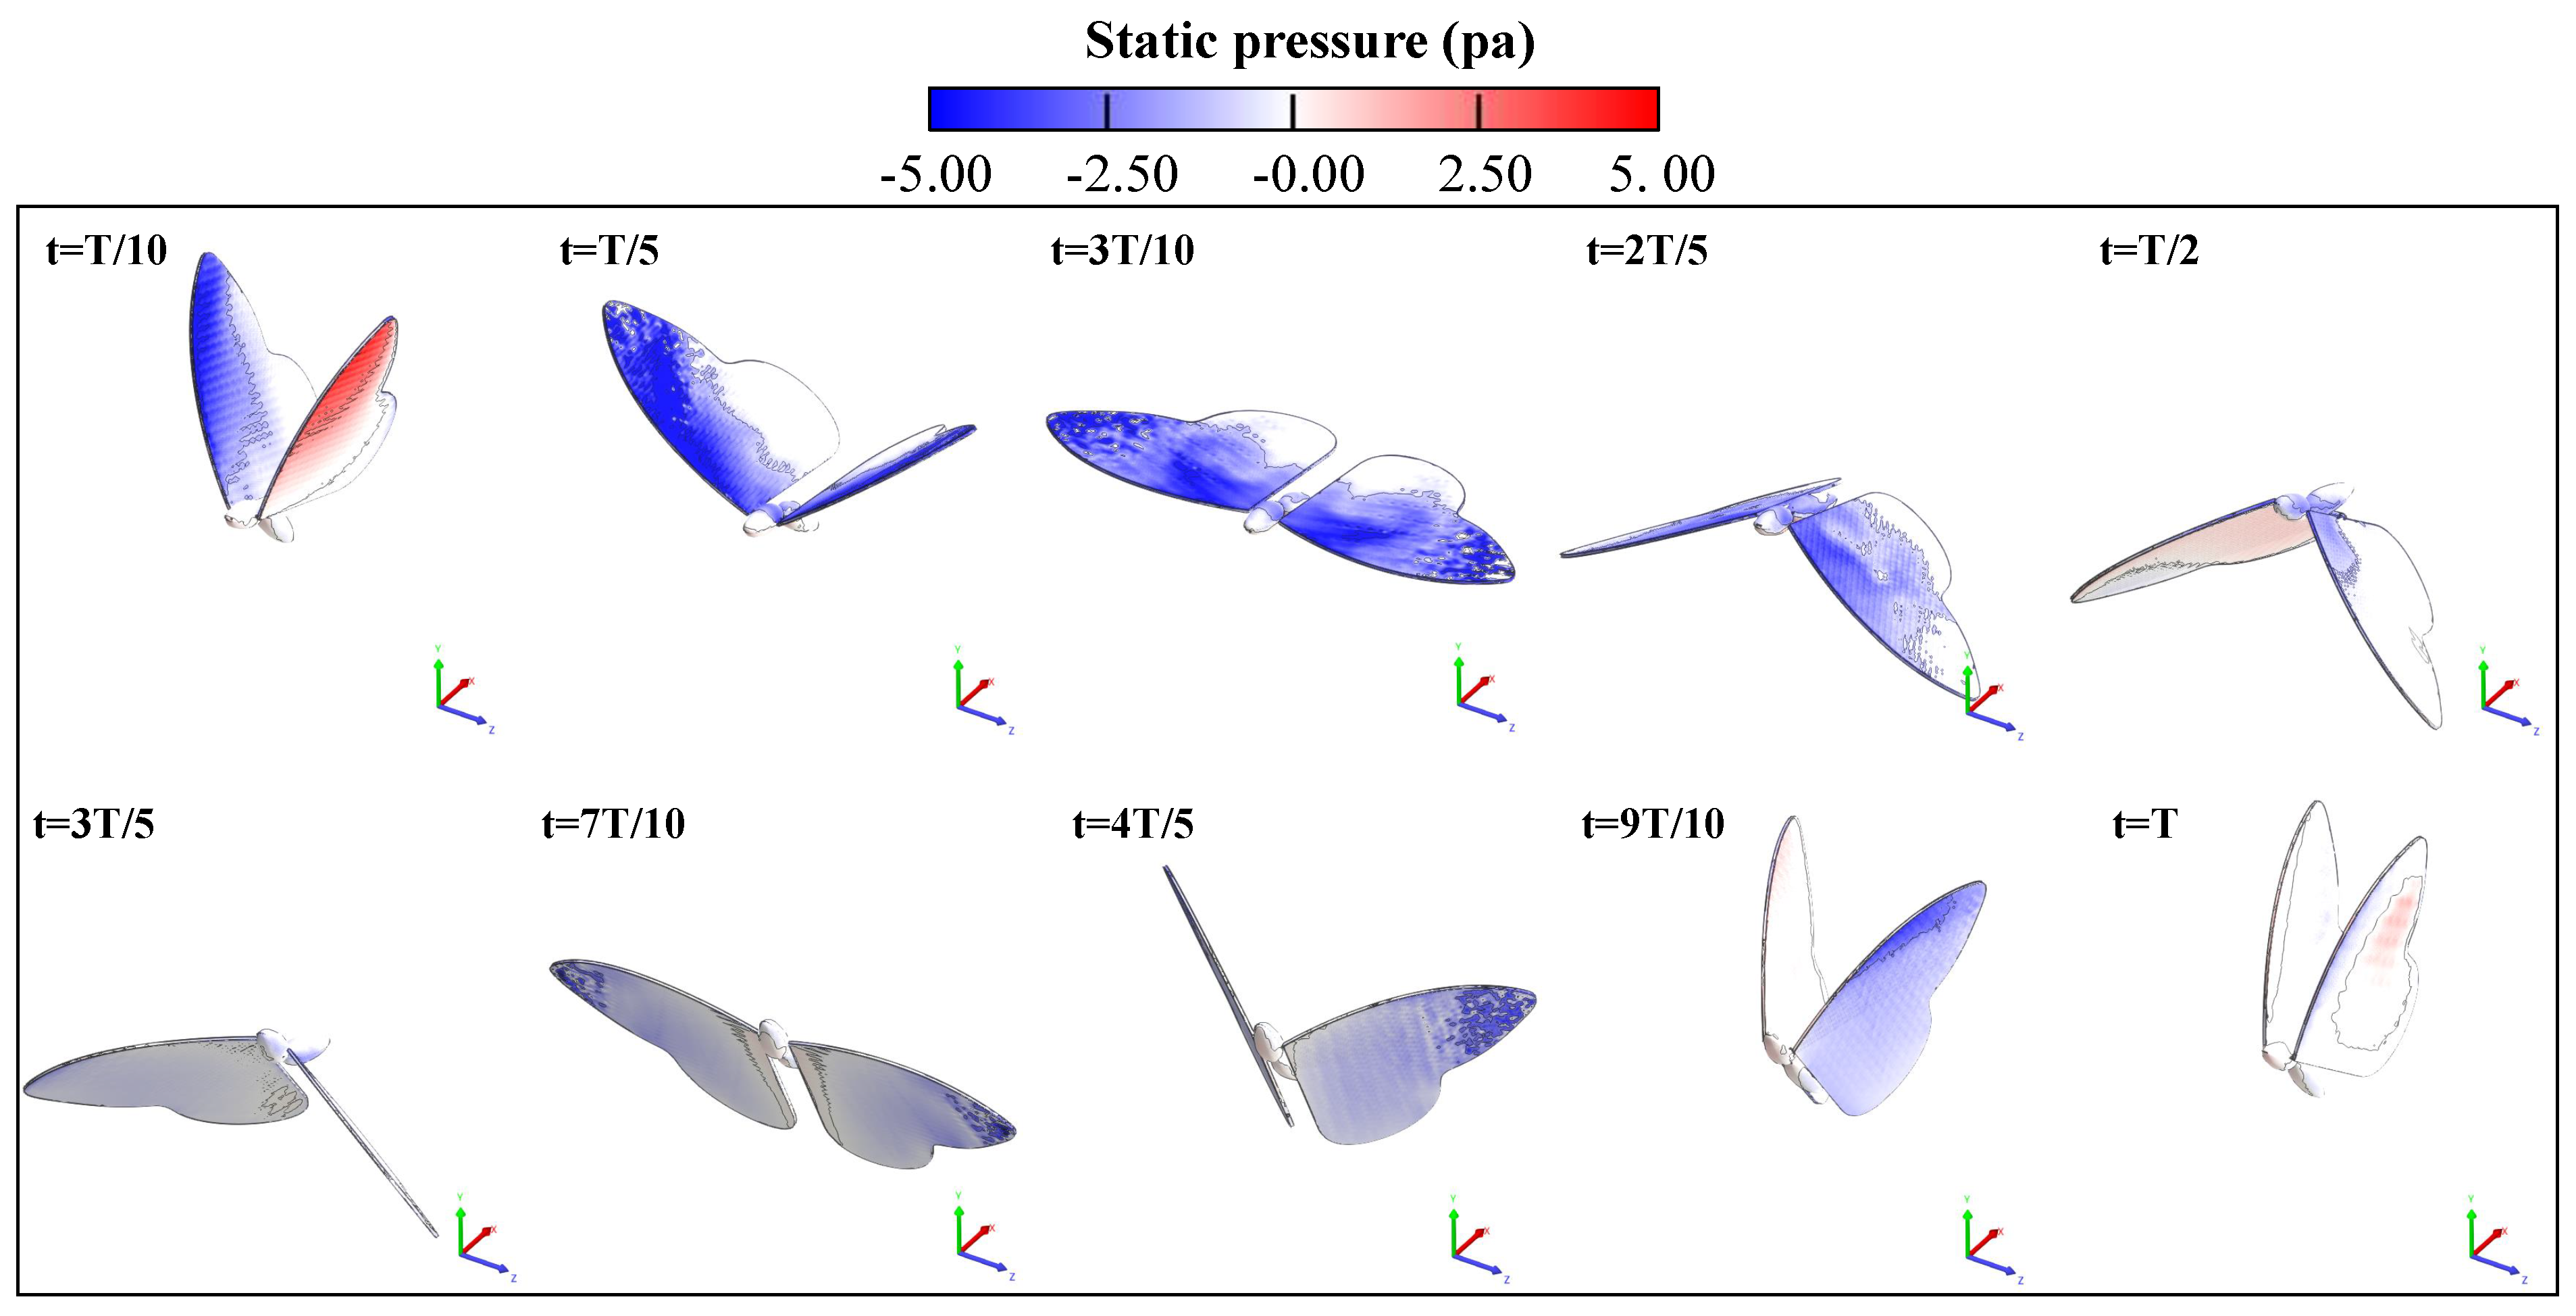
Figure 15.
Surface pressure distribution of one butterfly flapping cycle. The top row represents snapshots during the DS at = 0.1, 0.2, 0.3, 0.4, and 0.5, respectively. The bottom row represents snapshots during the DS at = 0.6, 0.7, 0.8, 0.9, and 1.0, respectively.
Figure 15.
Surface pressure distribution of one butterfly flapping cycle. The top row represents snapshots during the DS at = 0.1, 0.2, 0.3, 0.4, and 0.5, respectively. The bottom row represents snapshots during the DS at = 0.6, 0.7, 0.8, 0.9, and 1.0, respectively.
Table 1.
Morphological parameters of the butterfly (Chilasa clytia).
Table 1.
Morphological parameters of the butterfly (Chilasa clytia).
| Parameters | Value |
|---|
| m (kg) | 3.5 × 10 |
| (kg) | 1.02 × 10 |
| (kg) | 1.12 × 10 |
| (m) | 9.1 × 10 |
| (m) | 4.4 × 10 |
| (m) | 1.3 × 10 |
| (m) | 4.3 × 10 |
| (kg) | 5.2 × 10 |
| (m) | 8.29 × 10 |
| (m) | 2.57 × 10 |
| (N/m) | 1.36 |
| c (m) | 3.55 × 10 |
Table 2.
Parameters defining the simulation model of the butterfly.
Table 2.
Parameters defining the simulation model of the butterfly.
| Parameters | Description | Value |
|---|
| S (m) | Wingspan | 8.5 × |
| (m) | Wing-root offset | 1.5 × |
| c (m) | Chord length | 3.6 × |
| (m) | Thoracic length | 1.0 × |
| (m) | Abdominal length | 1.5 × |
| (m) | Wing thickness | 2.0 × |
Table 3.
Resolutions set-ups for the resolution-dependency study.
Table 3.
Resolutions set-ups for the resolution-dependency study.
| Parameters | s (Coarse) | s/2 (Medium) | s/4 (Fine) |
|---|
| Near wall (m) | 1.25 × | 6.25 × | 3.125 × |
| Far field (m) | 1.0 × | 5.0 × | 2.5 × |
| Elements at t = 0.1 s | 223,862 | 1,475,111 | 10,915,276 |
Table 4.
Kinematics parameters of the butterfly obtained by experimental observation.
Table 4.
Kinematics parameters of the butterfly obtained by experimental observation.
| ID | | | | | | | | | | | | | | | |
|---|
| VC1 | 62.7 | 19.2 | 38.5 | −11.9 | −72.8 | −33.7 | 79.3 | 15.2 | 42.2 | −17.8 | −89.4 | −47.7 | 290 | 120 | 10.6 |
| VC2 | 59.1 | −0.1 | 29.2 | 13.3 | −46.9 | −13.8 | 89.7 | 23.5 | 60.8 | −17.3 | −88.6 | −42.2 | 297 | 135 | 9.9 |
Table 5.
Kinematic parameters set-ups of four cases.
Table 5.
Kinematic parameters set-ups of four cases.
| Parameters | Case 1 | Case 2 | Case 3 | Case 4 |
|---|
| f (Hz) | 10 | 10 | 10 | 10 |
| (deg.) | 60 | 60 | 60 | variable |
| (deg.) | 0 | 30 | 30 | 30 |
| (deg.) | 20 | 20 | 20 | 20 |
| (deg.) | variable | 34 | 34 | 34 |
| (deg.) | −35 | −35 | −35 | −35 |
| (rad) | | | variable | |
| (m/s) | 1 | variable | 1 | 1 |


