Article

Gold-Modified Micellar Composites as Colorimetric Probes for the Determination of Low Molecular Weight Thiols in Biological Fluids Using Consumer Electronic Devices

by
Elli A. Akrivi
1,2,
Athanasios G. Vlessidis
3,
Dimosthenis L. Giokas
3,* and
Nikolaos Kourkoumelis
1,*
1
Department of Medical Physics, School of Health Sciences, University of Ioannina, 45110 Ioannina, Greece
2
Neurology Clinic, University Hospital of Ioannina, 45110 Ioannina, Greece
3
Department of Chemistry, School of Natural Sciences, University of Ioannina, 45110 Ioannina, Greece
*
Authors to whom correspondence should be addressed.
Appl. Sci. 2021, 11(6), 2705; https://doi.org/10.3390/app11062705
Submission received: 23 February 2021 / Revised: 15 March 2021 / Accepted: 16 March 2021 / Published: 17 March 2021

Abstract

:
This work describes a new, low-cost and simple-to-use method for the determination of free biothiols in biological fluids. The developed method utilizes the interaction of biothiols with gold ions, previously anchored on micellar assemblies through electrostatic interactions with the hydrophilic headgroup of cationic surfactant micelles. Specifically, the reaction of AuCl4 with the cationic surfactant cetyltrimethyl ammonium bromide (CTAB) produces an intense orange coloration, due to the ligand substitution reaction of the Br for Cl anions, followed by the coordination of the AuBr4 anions on the micelle surface through electrostatic interactions. When biothiols are added to the solution, they complex with the gold ions and disrupt the AuBr4–CTAB complex, quenching the initial coloration and inducing a decrease in the light absorbance of the solution. Biothiols are assessed by monitoring their color quenching in an RGB color model, using a flatbed scanner operating in transmittance mode as an inexpensive microtiter plate photometer. The method was applied to determine the biothiol content in urine and blood plasma samples, with satisfactory recoveries (i.e., >67.3–123% using external calibration and 103.8–115% using standard addition calibration) and good reproducibility (RSD < 8.4%, n = 3).

1. Introduction

More than 100 biothiols, which play a significant role in many biological processes and metabolic pathways (e.g., protein synthesis, antioxidant defense system, cell metabolism, etc.), have been identified in the human organism [1,2]. Of these biothiols, glutathione (GSH), cysteine (Cys) and homocysteine (Hcy) are the most abundant, with concentration levels that vary significantly in biological fluids. Under normal (non-pathological) conditions, GSH is present at concentrations as high as 3 mM in whole blood and less than 5 μM in blood plasma and urine. Cys, on the other hand, typically ranges from 135 to 300 μM in blood plasma and 20–80 μM in urine while Hcy concentrations are lower than 15 μM in both plasma and urine. Abnormal levels of biothiols have been related to clinical disorders and diseases, such as liver damage, Alzheimer’s disease, osteoporosis and cardiovascular diseases, among others [3,4,5,6].
Due to the important biological implications of biothiols, there has been a great interest in their determination in biological fluids. To that end, several analytical methods and techniques have been developed: HPLC, LC-MS, UV-Vis spectrometry, fluorescence, chemiluminescence, electrochemical techniques, etc. [7,8]. Over the past decade, nanomaterials have also been a popular scaffold for the development of biothiol probes and chemosensors [9]. By exploiting the high affinity of the sulfhydryl group for metal nanoparticles, a large variety of optical methods have been proposed. These methods are based on the generation or quenching of an optical event when biothiols bind on the surface of nanomaterials through a variety of mechanisms, such as host–guest interactions of biothiols with receptor molecules on the nanomaterials surface, the replacement of functional molecules from the nanomaterials surface and the disruption of inter-nanoparticle bonds [9]. The main advantage of nanomaterial probes is their high sensitivity as a result of the strong distance- and size-dependent optical properties of metal-based nanomaterials, especially those made of noble metals. However, the use of nanomaterials also faces several shortcomings: although synthesis may be relatively easy in a research laboratory, the reproducible large-scale synthesis and functionalization of nanomaterials for biomedical applications is a resource-demanding task that requires substantial nanotechnology skills and advanced equipment for their proper characterization. Additionally, due to a high surface area, which imbues nanomaterials with high reactivity, and surface functionalization, non-specific interactions with the matrix components may be observed. Furthermore, many of these methods require laboratory facilities, expensive scientific equipment (e.g., plate spectrophotometers or spectrofluorometers) and trained operators for their application, which are probably unavailable at the point-of-need and remote healthcare units.
An alternative approach to overcome the challenges associated with the use of nanomaterials is to use thiols as size and growth regulators of nanomaterials. In these methods, thiols firstly react with the precursor metal ions. Upon addition of a reducing agent, the produced nanomaterials exhibit a different size, morphology or aggregation state compared to those obtained in the absence of thiols. The difference in the colorimetric and spectral response in the presence and absence of biothiols is therefore used to determine their concentration. Based on this effect, several analytical methods using gold and silver nanoparticles have been developed, also from our group [10,11,12,13]. The main challenge in these methods, however, is that the kinetics of the reactions evolve over time and thus requiring relatively strict timing to obtain reproducible results [13,14].
Motivated by the latter methods, in this work we describe a simpler approach that does not rely on the formation of metallic nanomaterials but exploits the direct interaction of thiols with gold anions incorporated on the surface of cationic surfactant micelles. Gold anions form colored ion-pair complexes with the positively charged headgroup of cationic surfactant micelles through electrostatic interactions. These complexes have been widely used as a template for the controlled synthesis of noble metal nanoparticles [15,16,17] by chemical reduction of the Au–CTAB complex with appropriate reducing agents. However, the use of Au–CTAB complexes as colorimetric probes for analytical purposes has not been reported yet. In that sense, we exploit the intense colorimetric response generated from of Au halides associated on the surface of CTAB cationic micelles, which is quenched upon the addition of thiols due to the complexation of Au ions and the formation of colorless Au–thiolate complexes. In this manner, a concentration-dependent colorimetric response was obtained that was quantified with a simple flatbed scanner operated as an inexpensive microtiter plate photometer and was used to determine biothiols in real biological fluids (urine and blood plasma).

2. Materials and Methods

2.1. Reagents and Chemicals

L-cysteine (Cys), glycine (Gly), histidine (His), valine (Val), lysine (Lys), cystine (Cys-Cys), arginine (Arg), DL-homocysteine (HCy), glutamine (Glu), uric acid, magnesium chloride hexahydrate, sodium chloride, sodium sulfate, sodium hydrogen bicarbonate, sodium acetate, disodium hydrogen phosphate, potassium chloride, calcium chloride dehydrate, D(+)-glucose, and glacial acetic acid were obtained from Sigma-Aldrich (Steinheim, Germany). L-Glutathione (reduced), hydrogen tetrachloroaurate trihydrate (min. 99.9%), urea (>99%), trisodium citrate dihydrate, bovine serum albumin (crystalline, 98%) and tris(2-carboxyethyl)phosphinehydrochloride (TCEP, 95%, 0.5 M) were obtained from Alfa Aesar (Karlsruhe, Germany). Nanosep® centrifugal vials with modified polyethersulfone membranes of 3 kDa molecular cut-off size were obtained from Pall Corp. (New York, NY, USA). Lastly, 96-well microtiter plates (Nuclon 400 μL) with a clear flat surface were purchased from Thermo Fischer Scientific (Waltham, MA, USA).

2.2. Equipment and Instrumentation

A single-beam spectrophotometer (Jenway 6405 UV/Visible, Staffordshire, UK) with matched quartz cells of 1 cm path length was used to obtain the UV-vis spectra of the solutions. The IR spectra were acquired with a Perkin Elmer Spectrum TwoTM attenuated total reflectance—infrared (ATR-IR) spectrometer. A flatbed scanner (PerfectionV550 Photo, Epson Corp., Suwa, Japan) operating in transmittance mode was used to obtain photometric measurements by placing the microtiter plate containing the samples between the imaging surface and the transparency unit of the scanner. In this manner, the sample solution was aligned between the white LED light source with the CCD strip detector establishing an optical path length [14,18]. During scanning all automatic correction functions embedded in the software (Easy Photo Scan, v.1.00.08, Epson Corp.) were disabled to ensure that the photometric data were not manipulated. Images of the microtiter plate were saved as Joint Photographic Experts Group (JPEG) files at a resolution of 300 dpi and the color intensity was determined as the mean gray intensity and the intensity of the color in the RGB color system using Image J [19].

2.3. Experimental Procedure

The determination of biothiols was performed by adding 0.25 mL of the sodium acetate/acetic acid buffer (0.1 M, pH 6), 0.125 mL CTAB (0.16 M) and 0.05 mL AuCl4 (0.01 M) to 1.575 mL of the sample or standard solution. The mixture was incubated at room temperature for 40 min and an aliquot of 250 μL was transferred to a 96-well microtiter plate. The color intensity of the light transmitted through the sample was recorded as a colored image of the sample using a flatbed scanner operating in transmittance mode. The analytical signal was calculated as the difference in the mean grey area color intensity of the blank and the samples.

2.4. Samples

Matrix effects and interferences were evaluated using artificial and simulated body fluids (urine and blood plasma). Detailed information for the composition of each solution is given in the Supplementary Materials.
A few mL of whole blood was donated from a group member voluntarily after informed consent was obtained. The blood sample was taken in a designated room by a trained nurse of the university hospital and was not cultured or examined in any other way than the experimental protocol presented here. After collection, red blood cells were separated from the plasma using centrifugation at 800× g for 10 min. The collected blood plasma (1000 μL) was first treated with 1.0 mM TCEP for 30 min and interim vortex mixing to reduce the oxidized biothiols. Then, plasma proteins were removed by centrifugation at 12,000× g for 20 min at room temperature through centrifugal filters (MWCO = 3 kDa). This procedure was repeated twice to ensure complete removal of proteins. The collected (supernatant) liquid was diluted with distilled water (approximately 20-fold) and 1.575 mL of the sample was used for the determination of total biothiols according to the experimental procedure described above using the method of standard additions.
Urine was also provided by a group member after informed consent was obtained. Within 30 min of collection, the urine sample was centrifuged at 6000 rpm for 20 min to remove the insoluble materials. The clarified liquid was collected and treated with TCEP as above to reduce the oxidized biothiols. Then, proteins were removed with centrifugal filters (MWCO = 3 kDa) at 12,000× g for 20 min at room temperature. The collected liquid was diluted 20-fold with distilled water and 1.575 mL of the sample was used for the determination of total biothiols according to the experimental procedure described above using the method of standard additions.
To evaluate the accuracy of the method, known concentrations of cysteine were spiked in urine and blood plasma after protein precipitation in order to avoid potential losses during sample pre-treatment (which was based on a standard procedure and was out of the scope of this study).

3. Results and Discussion

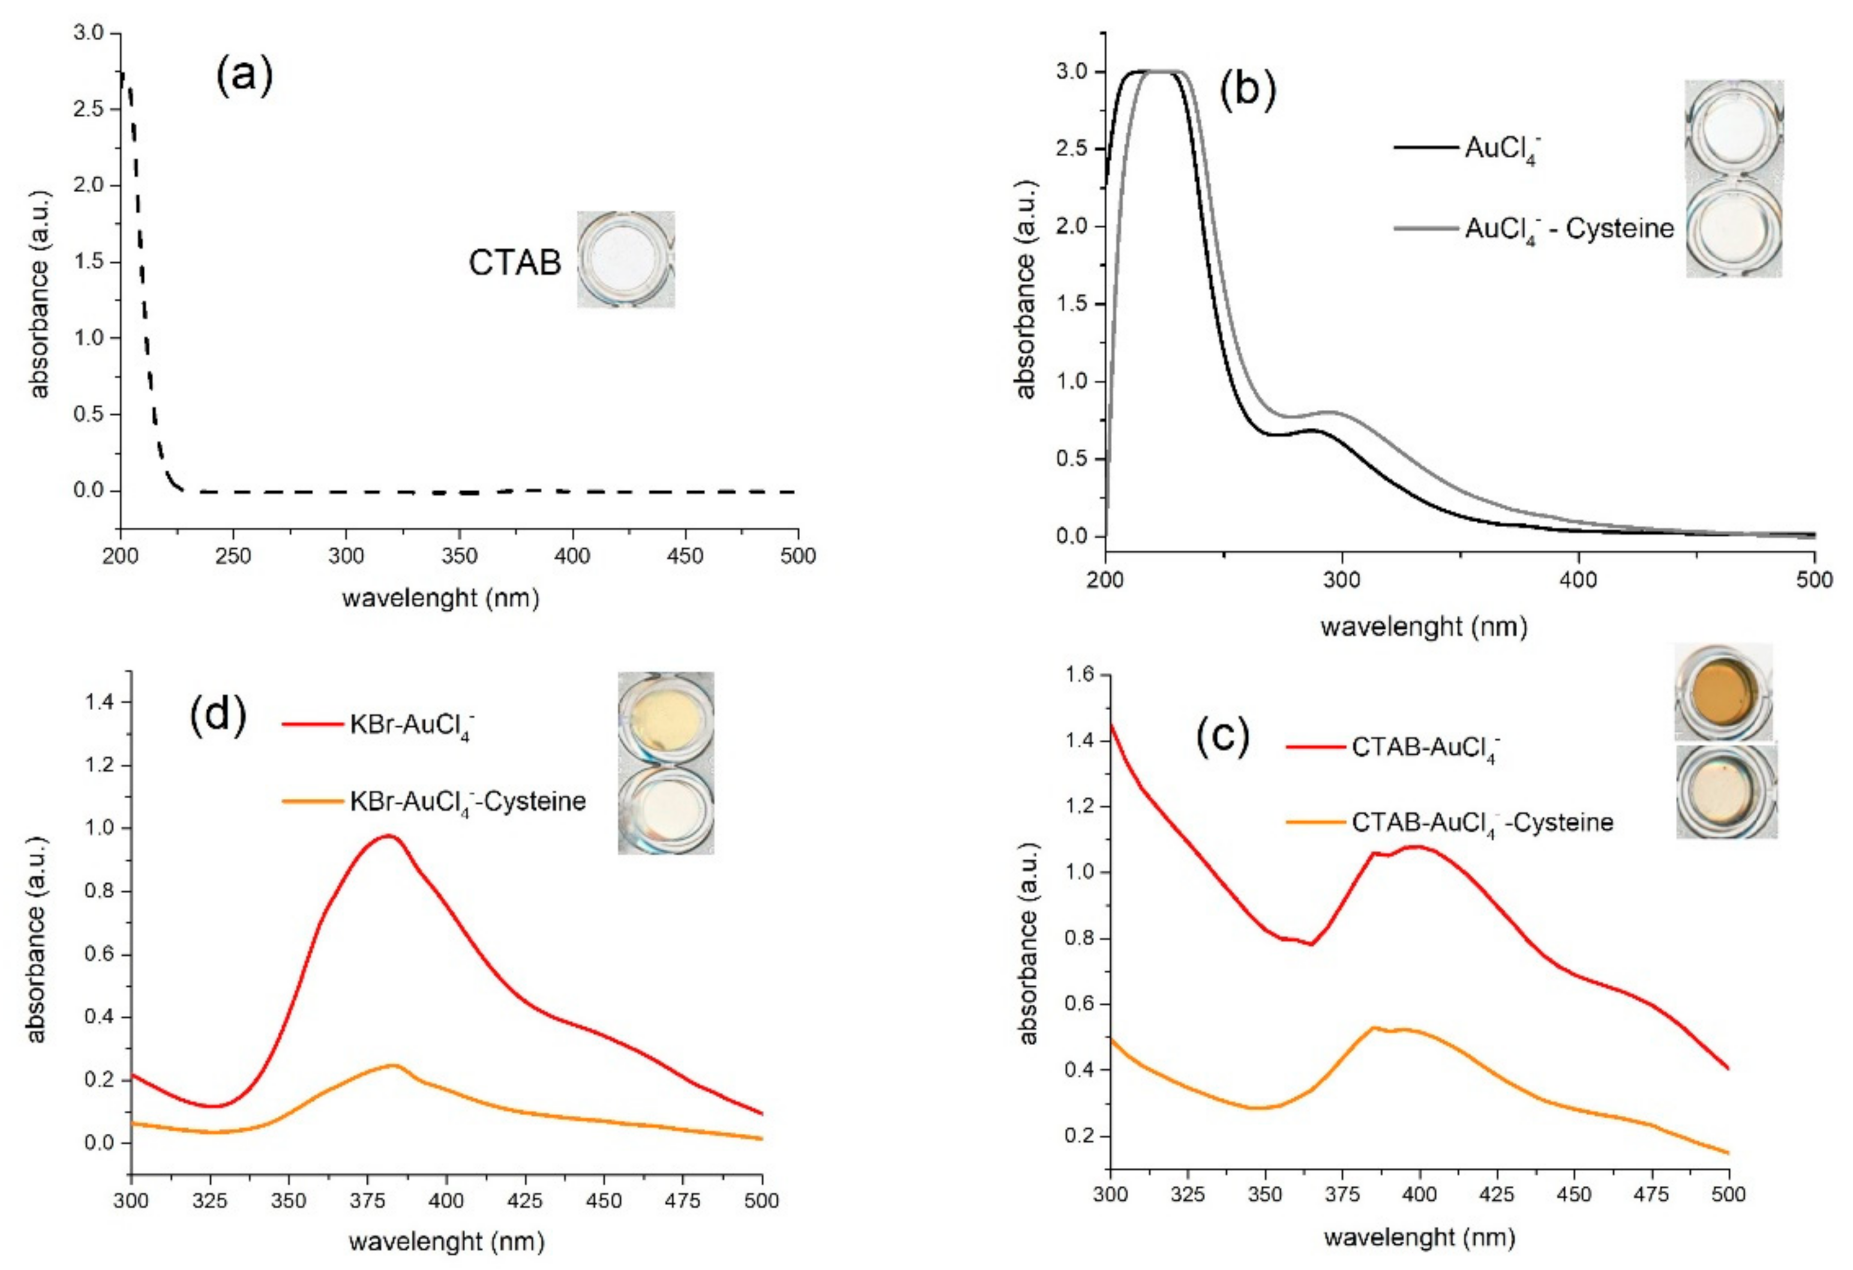
3.1. Mechanism of Biothiol Detection

The sensing mechanism of the biothiols was investigated by studying the color and spectral transitions of the AuCl4 and Au–CTAB complex solutions in the presence and absence of cysteine, which is the most representative species of biothiols in biological fluids. The UV-Vis spectra of CTAB showed no absorption band while the AuCl4 solutions exhibit two absorption bands at 220 and 290 nm due to the ligand-to-metal charge transfer (LMCT) band and the ligand field (LF) band of AuCl4, respectively [15]. When Cys was added into the solution, it formed a metal complex with the Au ions and the absorption of the Au–SH complex solution increased and red-shifted to 235 and 300 nm, respectively. On both occasions the colors were barely conceivable by the bare eye and the scanning imaging device (Figure 1b).
When CTAB was mixed with AuCl4 ions, the color of the solution turned orange and the absorption red-shifted (as compared to Au solutions) to 260 and 405 nm (Figure 1c). These absorption bands can be explained on the basis of two phenomena: The first, which explains the appearance of an orange coloration in the Au–CTAB solution, is the formation of AuBr4, due to the fast, multi-step, ligand substitution reaction of Cl from Br for anions, released from the dissociation of CTAB [15,17]. In an aqueous solution, Au species may be distributed among various hydroxyl-containing gold complexes as a function of the pH, in the general form of (AuClx(OH)y) (where x + y = 4). As the Br anions released from the dissociation of CTAB are in large excess compared to AuCl4, we assume that all gold chloride complexes are transformed to gold bromide complexes so that the Au species will actually be present in various bromide/hydroxyl complexes in the general form of (AuBrx(OH)y) (x + y = 4).
The UV-vis spectrum of the (AuBrx(OH)y) species, however, show a peak at 385 nm (Figure 1d), while the spectrum of the Au–CTAB complex is red-shifted to 405 nm. In addition, the color of the Au–CTAB solution is darker than that of the Au–KBr solution at equimolar concentration levels, possibly due to the high local concentration of (AuBrx(OH)y) species on the micelle surface. This observation is a strong indication that the (AuBrx(OH)y) anions are not free in the solution but incorporated into the Stern layer of the CTAB micelles, forming an ion-pair complex with the positive head groups of the CTAB. The formation of an orange precipitate in the Au–CTAB mixture after a few hours also supports the above reaction combined with the fact that no precipitate was formed in the Au–KBr solutions even after prolonged incubation (1 week).
In the presence of Cys, the UV-Vis spectra of the Au–CTAB-cysteine solution blue-shifts to 395–400 nm, the absorbance intensity decreases, and the color of the solution turns yellow. This colorimetric and spectral change can be attributed to the formation of Au–SH complexes that disrupt the (AuBrx(OH)y)–CTA+ complexes and release gold ions from the micelle surface. Other phenomena, such as the hydrolysis of Au, shall not have any effect since all experiments were performed in an acetate/acetic acid buffer (0.1 M, pH 6). In addition, no new peaks at 500–540 nm were observed, which excludes the possibility of Au reduction neither by CTAB nor by thiols and the formation of gold nanoparticles, (Figure S1). The sensing mechanism is graphically demonstrated in Figure 2.

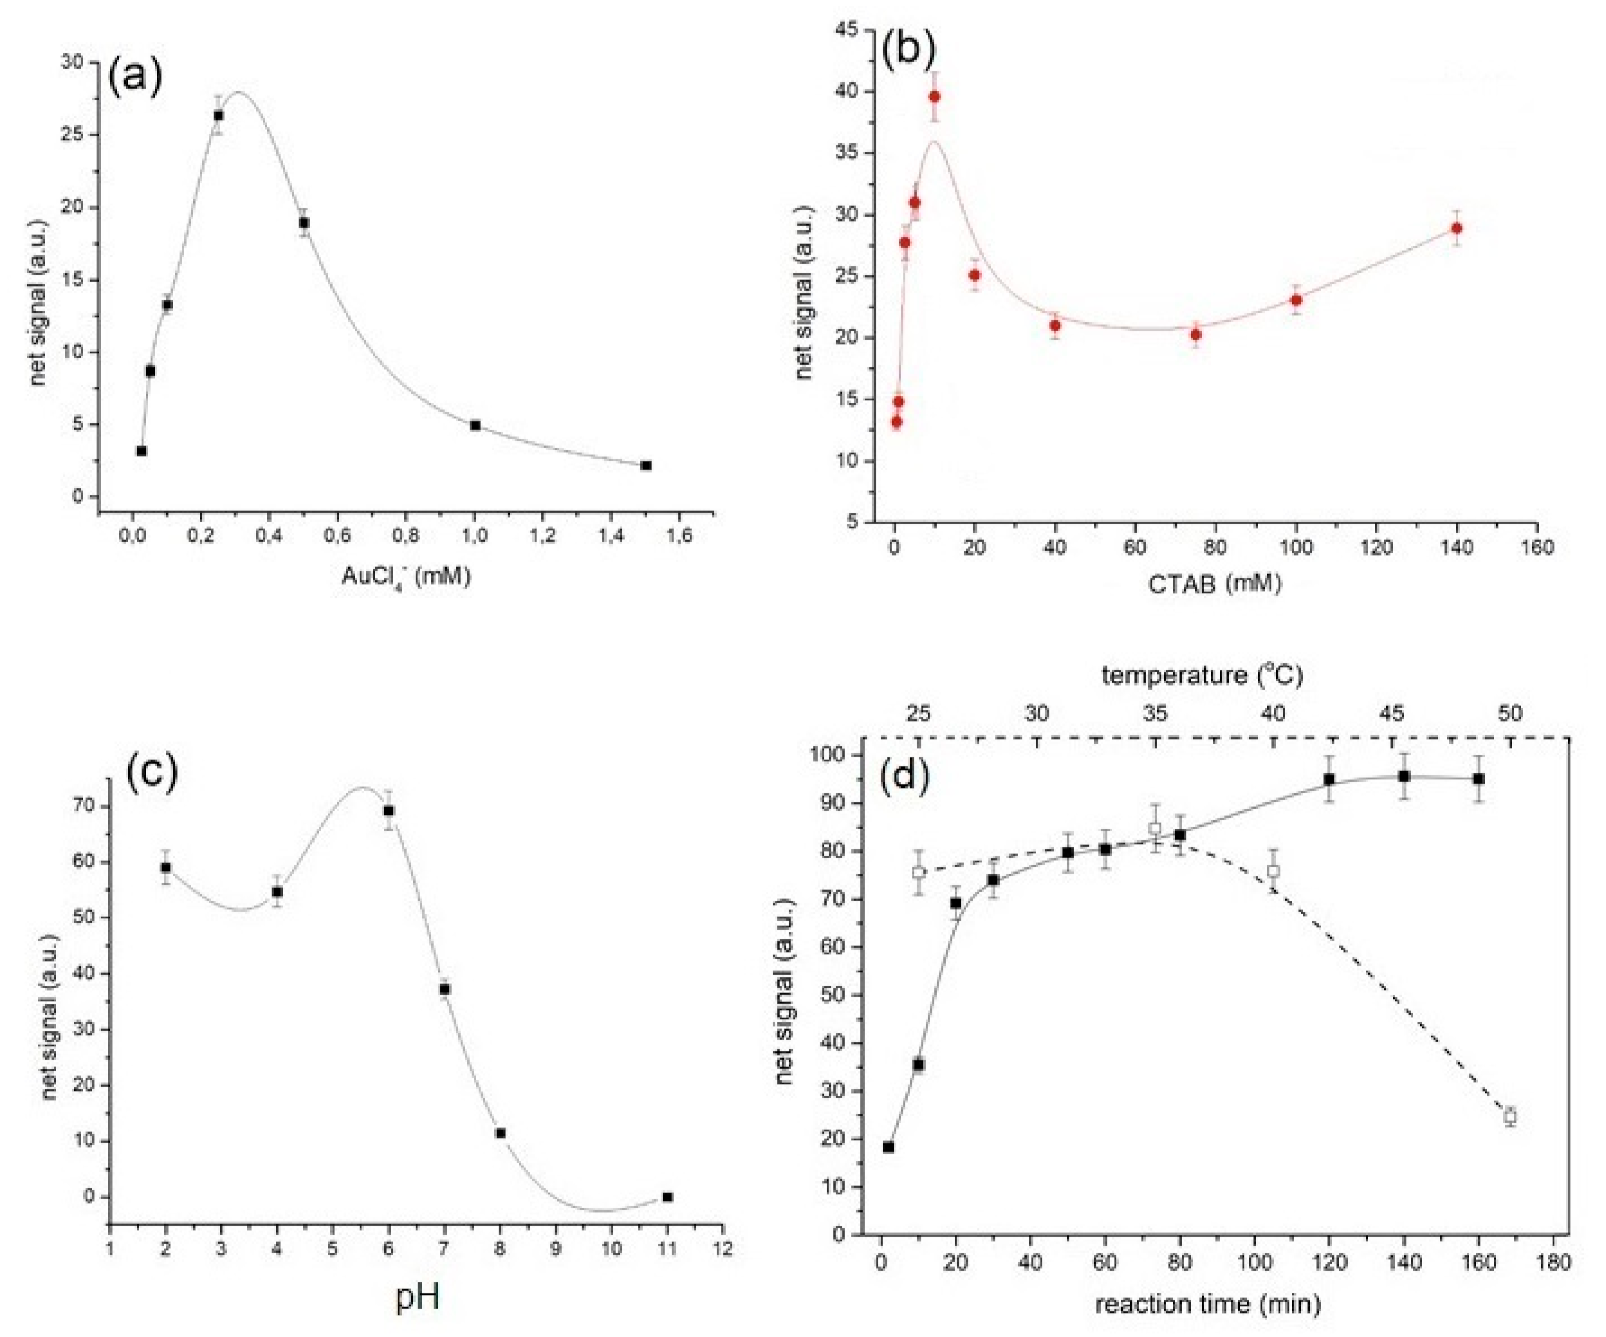
3.2. Effect of Gold Ion Concentration

According to previous reports, AuCl4 reacts quantitatively with CTAB at a 1:1 ratio to form water-insoluble precipitates [20]. As the concentration of CTAB increases above the critical micellar concentration (cmc) (i.e., the Au/CTAB ratio decreases), the Au–CTAB complex solubilizes in the CTAB micelles, reaching its maximum solubility at Au/CTAB = 1/60 [20]. Therefore, the effect of the Au ion concentration was investigated at an excess amount of CTAB (i.e., 75 mM) to ensure that the Au/CTAB ratio is lower than 1/60. This value also prevents the formation of insoluble precipitates of the Au–CTAB complex. According to the results depicted in Figure 3a, the maximum analytical signal was obtained at AuCl4 concentration of 0.25 mM, which was used as the optimum value. Based on the retail prices of gold chloride salts (which is the most expensive reagent used in this method), this concentration corresponds to a cost of <1.2 cent per sample (i.e., less than 1.2 € per 100 samples), which is affordable even in resource-limited settings. Lower Au concentrations produce solutions with faint colors and as a result the colorimetric changes induced by the addition of Cys are minor. On the contrary, when the Au ions are in excess, the added Cys (50 μM) cannot induce any significant color changes because there is an excess amount of Au ions complexed with the CTAB micelles. On both occasions, the net analytical signal, which is defined as the difference in the color intensity of the blank and the sample solutions, decreases.

3.3. Selection of Cationic Surfactant Concentration

The effect of CTAB concentration was investigated over a wide concentration range, from 0.5 mM (i.e., below the cmc of ≈ 0.9 mM) to 140 mM. The signal gradually increases up to 10 mM and decreases at higher concentrations (Figure 3b). This observation agrees with the solubility of the Au–CTAB complex, which reaches its maximum value at 1/60 [20]. At CTAB concentrations lower than 10 mM, the Au/CTAB ratio is higher than 1/60; therefore, the complex has limited solubility and forms precipitates that scavenge the incident light and produce intense signals (darker images) as less light is transmitted through the sample. At CTAΒ concentrations higher than 20 mM, the Au/CTAB ratio is lower than 1/60, hence the Au–CTAB complexes are solubilized, and more light is transmitted through the solution producing brighter images. When cysteine is added into the solutions, it complexes Au, releasing it from the Au–CTAB complex. In this manner, the Au/CTAB ratio decreases (as the Au concentration on the Au–CTAB complex also decreases), thus increasing the solubility of the Au–CTAB complex. As a result, the signal of the blank is lower than that of the sample due to the increased solubility of the Au–CTAB complex. Therefore, the net analytical signal response, which is calculated as the difference between the signals of the blank and the sample, reaches its maximum value. The above discussion also explains why at CTAB concentrations lower than 10 mM, the (net) analytical signals are higher than those observed at CTAB > 20 mM (except for the cases where the CTAB concentration is lower than its cmc) due to the solubilizing action of Cys.

3.4. Optimization of the Working pH

The influence of pH in the detection of cysteine was investigated by varying the pH from 2 to 11 using dilute HCl and NaOH solutions. According to the results in Figure 3c, the highest signals were obtained at acidic pH values and specifically at pH 6, while at alkaline conditions the signal decreased. Since CTAB is a non-pH responsive surfactant [21], we reasoned that the pH-dependent response may be related to the hydrolysis of Au salts as well as to the ionization state of cysteine and its interaction with CTAB. Au forms anionic complexes with halogens and hydroxyl anions over a wide pH range [22]; therefore, the formation of Au–CTAB complexes is feasible over a wide pH range. In addition, the formation of ion-pair AuCl4–CTAB complexes precedes the addition of cysteine. Therefore, hydrolysis of Au species at different pH values should not play any role since Au is not free in the solution but as a complex with CTAB. Based on these phenomena, we argue that the effect of pH is mainly related to the ionization state of cysteine.
The maximum signal obtained at a pH of 6 is close to the isoelectric point of cysteine, suggesting that electrically neutral biothiols favor the formation of the S–Au bond. At pH ≥ 7, the signal decreases and completely diminishes at pH > 10. At these conditions, cysteine is negatively charged since the amine group is protonated at pKa2 = 8.3 while the thiol group is deprotonated at the pka3 = 10.8 [23]. The reason for the reduction in the analytical signal may lie in the electrostatic attraction of cysteine to CTAB micelles. CTAB is present in a very large excess compared to Cys (CTAB:Cys > 200); therefore, the unprotonated COO- groups may interact with the positively charged amine headgroup of the CTAB micelles, and possibly reduce the mobility and reactivity of Cys and thus its ability to form Au–S complexes. The inhibitory effect of electrostatic interactions between the free thiols and charged molecules on the surface of the AuNP assemblies has been reported to affect the formation of the S–Au bonds, and is more favorable when the thiol groups were electrically neutral [24]. Based on these observations, the pH of the solution was regulated at pH = 6, where the predominant Au anions are (AuCl3(OH)) and (AuCl2(OH)2), using sodium acetate/acetic acid buffer.

3.5. Optimization of the Reaction Kinetics

The reaction kinetics were optimized by varying (i) the reaction time from 2–120 min, and (ii) the temperature towards warm conditions, from room temperature to 50 °C. The graph of Figure 3d shows that, at ambient conditions, the difference in the signal intensity between the blank and the sample increases rapidly during the first 30 min. At higher incubation times, the reactions slow down and only a small increase of the net signal is obtained (~14%) for incubation times up to 80 min. A significant gain in the net signal intensity (~30%), on the other hand, can be accomplished at longer incubation times (>120 min). These observations are in agreement with earlier observations regarding the kinetics of the formation of Au–CTAB complexes [25]. However, the analysis was performed in a microtiter plate (including calibration); therefore, there is no need to strictly monitor the reaction kinetics since all samples were analyzed simultaneously.
The signal response with increasing temperature shows that the signal decreases with increasing temperature. The highest signal is observed between 25 and 35 °C, which is higher than the Krafft temperature of CTAB (about 25 °C) [26]. Below the Krafft temperature, CTAB forms a bilayer-structured, hydrated solid, but above the Krafft temperature cylindrical micelles are formed, which increases the local concentration of Au anions per surface area. At higher temperatures, the signal decreases significantly, which can be attributed to the structural perturbations of CTAB micelles, because CTAB micelles are temperature sensitive [27]. In fact, at temperatures higher than 50 °C, micelles may destabilize and undergo structural and morphological changes [28,29]. Based on these observations, the optimum kinetic conditions of the assay were decided at 40 min of incubation time and ambient temperature.

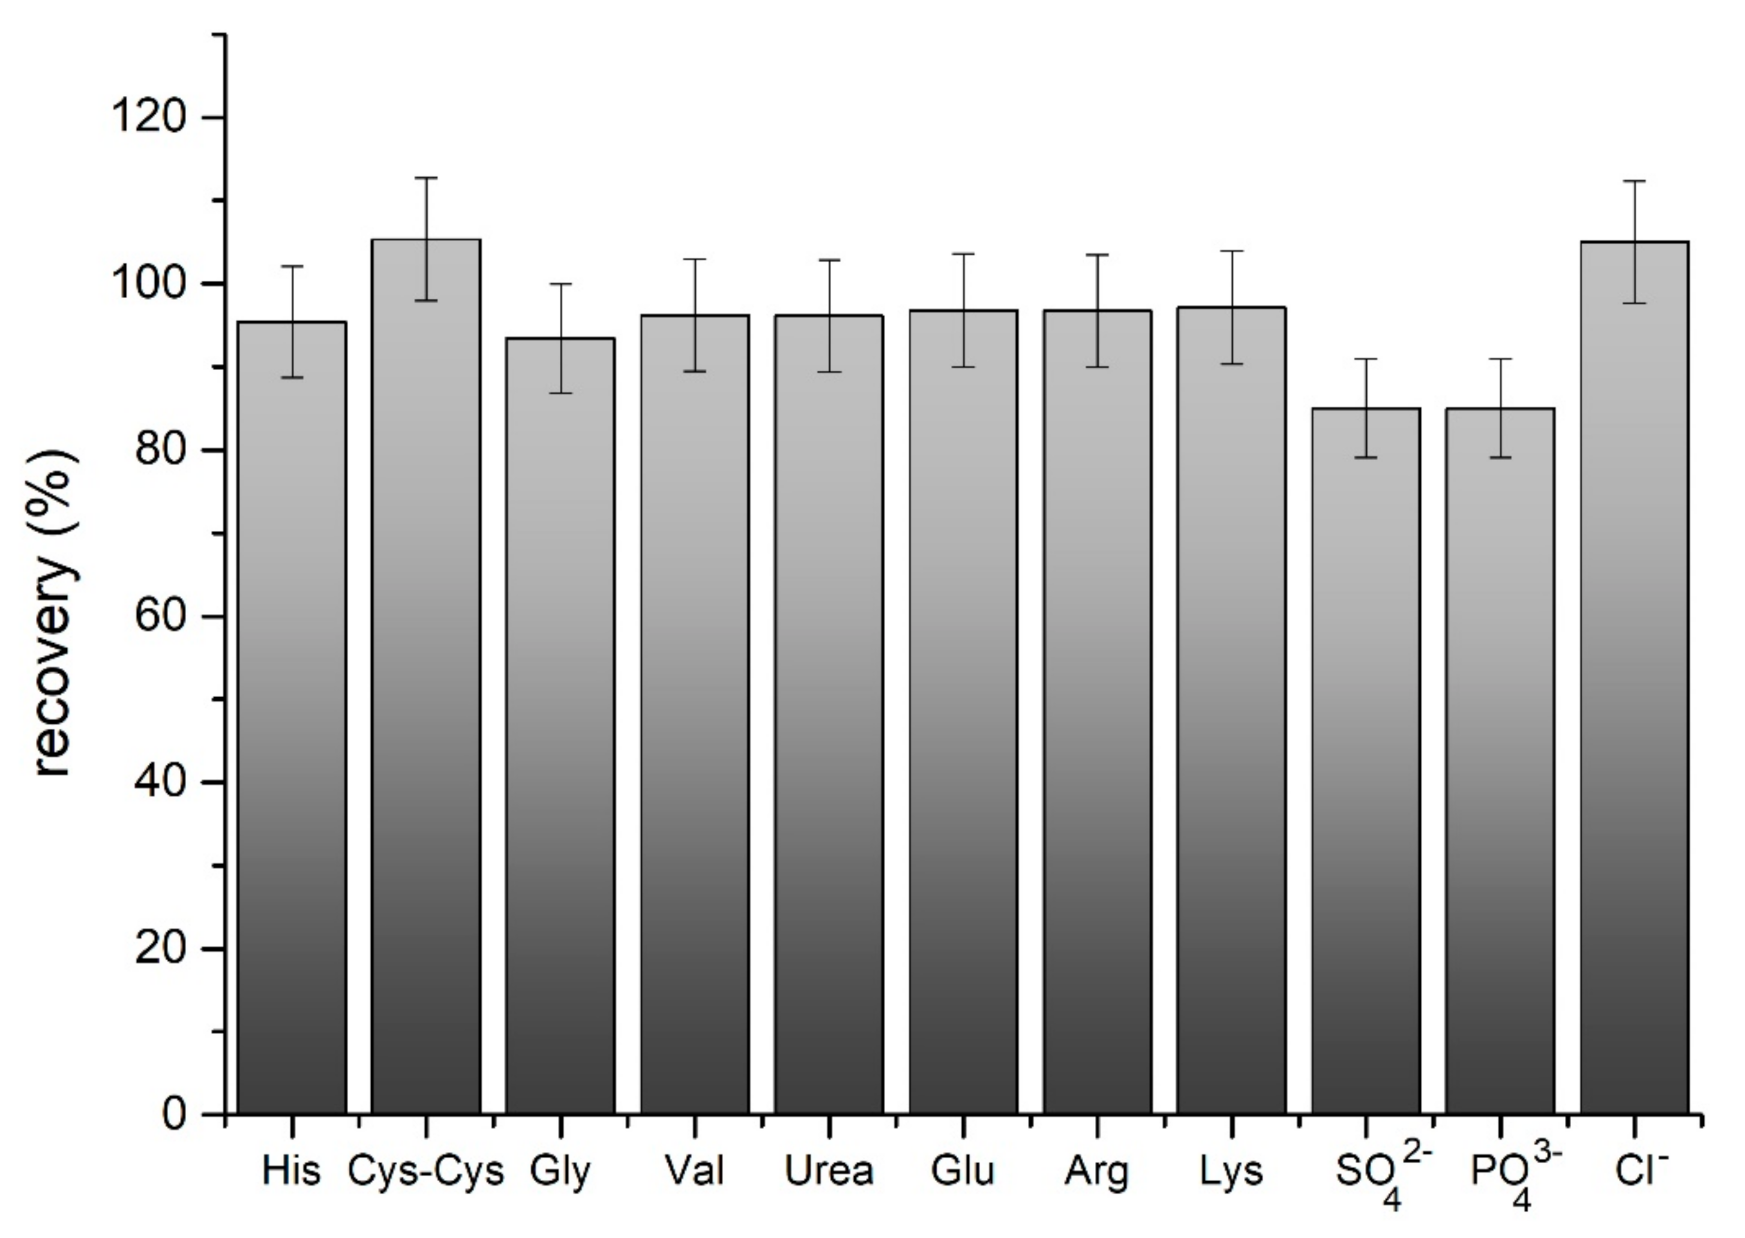
3.6. Interferences and Selectivity

The selectivity of the assay was investigated by comparing the net signal intensity obtained from Cys and binary mixtures of Cys with other common biomolecules and inorganic electrolytes typically found in biological fluids at concentrations equal or higher than their physiological levels [30]. Although the formation of complexes between amino acids and AuCl4 ions is well documented [31,32], the bar plots in Figure 4 show that the recovery of cysteine in the presence of amino acids is higher than 95%, suggesting the lack of interference from amino acids, including the cationic amino acids arginine and lysine. We believe that the complex formation between AuBr4 with the amine group of CTAB, prior to sample addition, deters the complexation of free amino acids with Au anions. The only exception to this observation is cystine, which can be tolerated up to equimolar concentration levels to that of cysteine. The interference of cystine stems from the ability of Au(III) ions to oxidatively cleave the disulfide bonds of cystine, forming the respective sulfonic acid derivatives [33,34]. This interference, however, poses no threat to the analysis because a reducing agent is commonly used before the analysis of thiols in order to reduce the disulfide bonds (oxidized thiols) to the more reactive sulfhydryl moieties (reduced thiols).
Regarding inorganic electrolytes, they were found to influence the analytical signal, possibly due to the effect of counter-anions on the properties (e.g., micellization, Krafft temperature, surface tension, aggregation number, etc.) and structure of cationic micelles [26,35]. Biological fluids contain a variety of inorganic electrolytes; therefore, we investigated the influence of ionic strength and inorganic electrolytes using artificial body fluids (for details see the experimental section). A calibration plot was then constructed in each matrix in order to study the effect of counter anions at various concentration levels of biothiols. Figure S2 shows that the artificial urine solution (AUS) had the lowest effect as compared to artificial blood plasma (ABP) while NaCl caused a significant suppression of the analytical signal. Therefore, dilution of the samples is necessary to reduce the relative abundance of inorganic electrolytes and thus minimize their effect on the properties of CTAB micelles. Technical aspects regarding sample pre-treatment are discussed further below in the analysis of biological samples.

3.7. Analytical Figures of Merit

The analytical merits of the method in the determination of different biothiols were evaluated by preparing standard solutions of Cys, Hcy and GSH at different concentration levels and constructing calibration curves of the analytical signal (i.e., mean color intensity in each well) vs. the concentration of Cys, Hcy or GSH. For all the examined biothiols, the calibration functions correlating the analytical signal to the concentration of each biothiol was linear up to 100 μM. The quantification limit (10σ) of the assay was 5 μM for Cys and GSH and 3.5 μM for Hcy. The working concentration range and the quantification limit are lower than the physiological concentration levels of Cys in blood plasma (150–300 μM), which enables method application with minimal sample volume requirements since dilution is necessary to bring the Cys concentrations within the working concentration range of the method.
The repeatability, calculated as the relative standard deviation of seven replicate measurements, was below 10% (for solutions containing 50 μM cysteine). The calibration functions, linearity, precision and detection limits (DLs) of the assays are summarized in Table 1.
Overall, the analytical merits of the assay, as expressed by the working range and the detection limits, are comparable to other published assays [9] and well below the concentration of total biothiols in biological fluids. Nevertheless, other methods that use sophisticated nanomaterial probes or reagents and advanced detectors have achieved even lower detection limits (Table 2).

3.8. Analysis of Biological Samples

The method was applied to simulated body fluid in order to assess potential matrix effects and identify the appropriate sample pre-treatment conditions. Using simulated blood plasma (for details, see the Experimental section), we investigated the reduction of oxidized thiols (i.e., cystine), as the major biothiol species in biofluids, and the conditions for precipitating proteins, which carry a significant amount of disulfide bonds and hence may produce false-positive results.
The reduction of biothiols with TCEP was optimized through trial-and-error tests in simulated blood plasma (SBP) solutions containing 250 μM of cystine, 250 μM of cysteine and no cysteine as control. We found that the TCEP concentration in the final solution that is used for analysis should be <0.05 mM. At higher concentrations, a positive interference was observed because an excess of residual (unreacted) TCEP could reduce the gold ions to metal gold. Therefore, the reduction of cystine to cysteine was performed with 1.0 mM of TCEP as reducing agent for 30 min before protein removal. The final sample was then diluted as appropriate to adjust the concentration of TCEP in the final extract below the tolerance limit.
Despite the lack of interference observed in the selectivity study, the application of the method to the simulated body fluids showed recoveries that varied from 67 to 76% in simulated urine and 94 to 123% in simulated blood plasma (Table 3).
Student’s t-test analysis in the recovery values revealed the presence of matrix effects in the urine samples but not in the blood plasma (i.e., the calculated t-value in the simulated urine and simulated blood plasma was higher and lower than the critical t-value at the p = 0.05 probability level, respectively). Since no AuNP formation was observed (i.e., no absorbance peak at 500–540 nm appeared), this interference was not caused by the matrix components present in the real samples that could reduce gold ions. Therefore, to mitigate potential matrix effects, the method of standard additions was also examined for analysis of biological samples. The spiking levels were 2, 4 and 10 times higher than the expected concentration of the analyte, which ensured good linearity and a zero intercept (i.e., the confidence internal of the intercept b ± tsb, passed through zero) [41]. The recovery of Cys in the biological samples ranged from 103.8 to 115%, which offered an improvement compared to the direct application of external calibration (the calculated t-value was lower than t-critical at p = 0.05).

4. Conclusions

In this work, we have shown that the colorimetric reaction product of Au anions with the cationic surfactant CTAB can be quenched by thiols proportionally to the thiol concentration. Based on this observation, low molecular weight biothiols were determined in simulated and physiological biological fluids. The method afforded satisfactory recoveries, low detection limits in relation to biothiol levels in biofluids, and good reproducibility. The assay is simple to perform since the end-user just mixes the necessary reagents with the sample and uses a flatbed scanner as a simple and inexpensive microtiter photometric detector. Importantly, all reagents are commercially available at low cost and are stable under normal conditions. These features render the method suitable for applications in low-resource settings, such as decentralized or remote healthcare units (e.g., rural), and for in-clinic analysis (e.g., nurse’s bench) where there is access to basic equipment and infrastructure capabilities. The experimental procedure can be further simplified by using the appropriate filters to remove red blood cells and plasma proteins, alleviating the need for centrifugation. In this manner, the method can be applied even in non-laboratory conditions, i.e., where there is a lack benchtop instrumentation (such as centrifuges) and trained operators.

Supplementary Materials

The following are available online at https://www.mdpi.com/2076-3417/11/6/2705/s1, Figure S1: Absorbance spectra of Au-CTAB complex (black line) and Au-CTAB in the presence of 50 μM of glutathione. No peaks above 500 nm are observed suggesting that gold has not been reduced to its respective gold nanoparticle species under the optimum experimental conditions (0.25 mM AuCl4, 10 mM CTAB, 50 μM GSH, sodium acetate/acetic acid buffer pH 6, 15 min incubation time at room temperature); Figure S2: Response of the colorimetric assay in various artificial biofluids. The linear curves are the result of linear regression while error bar represent the standard error calculated for triplicate samples. AUS: Artificial urine solution, ABP: artificial blood plasma, DW: distilled water.

Author Contributions

Conceptualization, D.L.G.; methodology, E.A.A. and D.L.G.; formal analysis, D.L.G. and N.K.; investigation, E.A.A.; data curation, A.G.V.; visualization, E.A.A. and A.G.V.; writing—original draft preparation, D.L.G.; writing—review and editing, N.K. All authors have read and agreed to the published version of the manuscript.

Funding

This research received no external funding.

Institutional Review Board Statement

Not applicable.

Informed Consent Statement

Informed consent was obtained from all subjects involved in the study.

Data Availability Statement

Data are available from the corresponding authors upon reasonable request.

Conflicts of Interest

The authors declare no conflict of interest.

References

  1. Turell, L.; Radi, R.; Alvarez, B. The thiol pool in human plasma: The central contribution of albumin to redox processes. Free. Radic. Biol. Med. 2013, 65, 244–253. [Google Scholar] [CrossRef] [Green Version]
  2. Valko, M.; Leibfritz, D.; Moncol, J.; Cronin, M.T.D.; Mazur, M.; Telser, J. Free radicals and antioxidants in normal physiological functions and human disease. Int. J. Biochem. Cell Biol. 2007, 39, 44–84. [Google Scholar] [CrossRef]
  3. Van Meurs, J.B.; Dhonukshe-Rutten, R.A.; De Groot, L.C.; Hofman, A.; Witteman, J.C.; Van Leeuwen, J.P.; Breteler, M.M.; Lips, P.; Pols, H.A.; Uitterlinden, A.G.; et al. Homocysteine Levels and the Risk of Osteoporotic Fracture. N. Engl. J. Med. 2004, 350, 2033–2041. [Google Scholar] [CrossRef] [PubMed] [Green Version]
  4. Rehman, T.; Shabbir, M.A.; Inam-Ur-Raheem, M.; Manzoor, M.F.; Ahmad, N.; Liu, Z.; Ahmad, M.H.; Siddeeg, A.; Abid, M.; Aadil, R.M. Cysteine and homocysteine as biomarker of various diseases. Food Sci. Nutr. 2020, 8, 4696–4707. [Google Scholar] [CrossRef]
  5. Teskey, G.; Abrahem, R.; Cao, R.; Gyurjian, K.; Islamoglu, H.; Lucero, M.; Martinez, A.; Paredes, E.; Salaiz, O.; Robinson, B.; et al. Glutathione as a Marker for Human Disease. In Advances in Clinical Chemistry; Elsevier: Amsterdam, The Netherlands, 2018; Volume 87, pp. 141–159. ISBN 978-0-12-815203-4. [Google Scholar]
  6. Prendecki, M.; Florczak-Wyspianska, J.; Kowalska, M.; Ilkowski, J.; Grzelak, T.; Bialas, K.; Wiszniewska, M.; Kozubski, W.; Dorszewska, J. Biothiols and oxidative stress markers and polymorphisms of TOMM40 and APOC1 genes in Alzheimer’s disease patients. Oncotarget 2018, 9, 35207–35225. [Google Scholar] [CrossRef] [Green Version]
  7. Isokawa, M.; Kanamori, T.; Funatsu, T.; Tsunoda, M. Analytical methods involving separation techniques for determination of low-molecular-weight biothiols in human plasma and blood. J. Chromatogr. B 2014, 964, 103–115. [Google Scholar] [CrossRef]
  8. Chen, X.; Zhou, Y.; Peng, X.; Yoon, J. Fluorescent and colorimetric probes for detection of thiols. Chem. Soc. Rev. 2010, 39, 2120–2135. [Google Scholar] [CrossRef] [PubMed]
  9. Tsogas, G.Z.; Kappi, F.A.; Vlessidis, A.G.; Giokas, D.L. Recent Advances in Nanomaterial Probes for Optical Biothiol Sensing: A Review. Anal. Lett. 2018, 51, 443–468. [Google Scholar] [CrossRef]
  10. Coronado-Puchau, M.; Saa, L.; Grzelczak, M.; Pavlov, V.; Liz-Marzán, L.M. Enzymatic modulation of gold nanorod growth and application to nerve gas detection. Nano Today 2013, 8, 461–468. [Google Scholar] [CrossRef]
  11. Shen, L.-M.; Chen, Q.; Sun, Z.-Y.; Chen, X.-W.; Wang, J.-H. Assay of Biothiols by Regulating the Growth of Silver Nanoparticles with C-Dots as Reducing Agent. Anal. Chem. 2014, 86, 5002–5008. [Google Scholar] [CrossRef]
  12. Jung, Y.L.; Park, J.H.; Kim, M.I.; Park, H.G. Label-free colorimetric detection of biological thiols based on target-triggered inhibition of photoinduced formation of AuNPs. Nanotechnology 2016, 27, 055501. [Google Scholar] [CrossRef]
  13. Kostara, A.; Tsogas, G.Z.; Vlessidis, A.G.; Giokas, D.L. Generic Assay of Sulfur-Containing Compounds Based on Kinetics Inhibition of Gold Nanoparticle Photochemical Growth. ACS Omega 2018, 3, 16831–16838. [Google Scholar] [CrossRef]
  14. Akrivi, E.; Kappi, F.; Gouma, V.; Vlessidis, A.G.; Giokas, D.L.; Kourkoumelis, N. Biothiol modulated growth and aggregation of gold nanoparticles and their determination in biological fluids using digital photometry. Spectrochim. Acta Part A Mol. Biomol. Spectrosc. 2021, 249, 119337. [Google Scholar] [CrossRef] [PubMed]
  15. Torigoe, K.; Esumi, K. Preparation of colloidal gold by photoreduction of tetracyanoaurate(1-)-cationic surfactant complexes. Langmuir 1992, 8, 59–63. [Google Scholar] [CrossRef]
  16. Nikoobakht, B.; El-Sayed, M.A. Preparation and Growth Mechanism of Gold Nanorods (NRs) Using Seed-Mediated Growth Method. Chem. Mater. 2003, 15, 1957–1962. [Google Scholar] [CrossRef]
  17. Bai, T.; Tan, Y.; Zou, J.; Nie, M.; Guo, Z.; Lu, X.; Gu, N. AuBr2–-Engaged Galvanic Replacement for Citrate-Capped Au–Ag Alloy Nanostructures and Their Solution-Based Surface-Enhanced Raman Scattering Activity. J. Phys. Chem. C 2015, 119, 28597–28604. [Google Scholar] [CrossRef]
  18. Christodouleas, D.C.; Nemiroski, A.; Kumar, A.A.; Whitesides, G.M. Broadly Available Imaging Devices Enable High-Quality Low-Cost Photometry. Anal. Chem. 2015, 87, 9170–9178. [Google Scholar] [CrossRef] [PubMed]
  19. Eliceiri, K. ImageJ2: ImageJ for the next Generation of Scientific Image Data. BMC Bioinform. 2017, 18, 1–26. [Google Scholar]
  20. Perez-Juste, J.; Liz-Marzan, L.M.; Carnie, S.; Chan, D.Y.C.; Mulvaney, P. Electric-Field-Directed Growth of Gold Nanorods in Aqueous Surfactant Solutions. Adv. Funct. Mater. 2004, 14, 571–579. [Google Scholar] [CrossRef]
  21. Patel, V.; Dharaiya, N.; Ray, D.; Aswal, V.K.; Bahadur, P. pH controlled size/shape in CTAB micelles with solubilized polar additives: A viscometry, scattering and spectral evaluation. Colloids Surf. A Physicochem. Eng. Asp. 2014, 455, 67–75. [Google Scholar] [CrossRef]
  22. Pacławski, K.; Fitzner, K. Kinetics of gold(III) chloride complex reduction using sulfur(IV). Met. Mater. Trans. A 2004, 35, 1071–1085. [Google Scholar] [CrossRef]
  23. O’Neil, M. The Merck Index—An Encyclopedia of Chemicals, Drugs, and Biologicals; Royal Society of Chemistry: London, UK, 2013. [Google Scholar]
  24. Ma, Q.; Fang, X.; Zhang, J.; Zhu, L.; Rao, X.; Lu, Q.; Sun, Z.; Yu, H.; Zhang, Q. Discrimination of cysteamine from mercapto amino acids through isoelectric point-mediated surface ligand exchange of β-cyclodextrin-modified gold nanoparticles. J. Mater. Chem. B 2020, 8, 4039–4045. [Google Scholar] [CrossRef]
  25. Khan, M.N.; Alam Khan, T.; Al-Thabaiti, S.A.; Khan, Z. Spectrophotometric evidence to the formation of AuCl4–CTA complex and synthesis of gold nano-flowers with tailored surface textures. Spectrochim. Acta Part A Mol. Biomol. Spectrosc. 2015, 149, 889–897. [Google Scholar] [CrossRef]
  26. Roy, J.C.; Islam, N.; Aktaruzzaman, G. The Effect of NaCl on the Krafft Temperature and Related Behavior of Cetyltrimethylammonium Bromide in Aqueous Solution. J. Surfactants Deterg. 2013, 17, 231–242. [Google Scholar] [CrossRef]
  27. Becker, R.; Liedberg, B.; Käll, P.-O. CTAB promoted synthesis of Au nanorods–Temperature effects and stability considerations. J. Colloid Interface Sci. 2010, 343, 25–30. [Google Scholar] [CrossRef] [PubMed]
  28. Jana, N.R. Gram-Scale Synthesis of Soluble, Near-Monodisperse Gold Nanorods and Other Anisotropic Nanoparticles. Small 2005, 1, 875–882. [Google Scholar] [CrossRef]
  29. Zijlstra, P.; Bullen, C.; Chon, J.W.M.; Gu, M. High-Temperature Seedless Synthesis of Gold Nanorods. J. Phys. Chem. B 2006, 110, 19315–19318. [Google Scholar] [CrossRef]
  30. De, M.; Rana, S.; Akpinar, H.; Miranda, O.R.; Arvizo, R.R.; Bunz, U.H.F.; Rotello, V.M. Sensing of proteins in human serum using conjugates of nanoparticles and green fluorescent protein. Nat. Chem. 2009, 1, 461–465. [Google Scholar] [CrossRef]
  31. Csapó, E.; Ungor, D.; Kele, Z.; Baranyai, P.; Deák, A.; Juhász, Á.; Janovák, L.; Dékány, I. Influence of pH and aurate/amino acid ratios on the tuneable optical features of gold nanoparticles and nanoclusters. Colloids Surf. A Physicochem. Eng. Asp. 2017, 532, 601–608. [Google Scholar] [CrossRef]
  32. Zou, J.; Guo, Z.; Parkinson, J.A.; Chen, Y.; Sadler, P.J. Gold(III)-induced oxidation of glycine. Chem. Commun. 1999, 1359–1360. [Google Scholar] [CrossRef]
  33. Shaw, C.F.; Cancro, M.P.; Witkiewicz, P.L.; Eldridge, J.E. Gold(III) oxidation of disulfides in aqueous solution. Inorg. Chem. 1980, 19, 3198–3201. [Google Scholar] [CrossRef]
  34. Franskhaw, P.; Awitkiewic, C. Oxidative Cleavage of Peptide and Protein Disulphide Bonds by Gold(II1): A Mechanism for Gold Toxicity. J. Chem. Soc. Chem. Commun. 1981, 21, 1111–1114. [Google Scholar]
  35. Oelschlaeger, C.; Suwita, P.; Willenbacher, N. Effect of Counterion Binding Efficiency on Structure and Dynamics of Wormlike Micelles. Langmuir 2010, 26, 7045–7053. [Google Scholar] [CrossRef] [PubMed]
  36. Liu, C.; Miao, Y.; Zhang, X.; Zhang, S.; Zhao, X. Colorimetric determination of cysteine by a paper-based assay system using aspartic acid modified gold nanoparticles. Microchim. Acta 2020, 187, 362. [Google Scholar] [CrossRef] [PubMed]
  37. Kappi, F.A.; Papadopoulos, G.A.; Tsogas, G.Z.; Giokas, D.L. Low-cost colorimetric assay of biothiols based on the photochemical reduction of silver halides and consumer electronic imaging devices. Talanta 2017, 172, 15–22. [Google Scholar] [CrossRef]
  38. Ortiz-Gomez, I.; Ortega-Muñoz, M.; Marín-Sánchez, A.; De Orbe-Payá, I.; Hernandez-Mateo, F.; Capitan-Vallvey, L.F.; Santoyo-Gonzalez, F.; Salinas-Castillo, A. A vinyl sulfone clicked carbon dot-engineered microfluidic paper-based analytical device for fluorometric determination of biothiols. Microchim. Acta 2020, 187, 1–11. [Google Scholar] [CrossRef] [PubMed]
  39. Xue, H.; Yu, M.; He, K.; Liu, Y.; Cao, Y.; Shui, Y.; Li, J.; Farooq, M.; Wang, L. A novel colorimetric and fluorometric probe for biothiols based on MnO2 NFs-Rhodamine B system. Anal. Chim. Acta 2020, 1127, 39–48. [Google Scholar] [CrossRef]
  40. Tang, J.; Kong, B.; Wang, Y.; Xu, M.; Wang, Y.; Wu, H.; Zheng, G. Photoelectrochemical Detection of Glutathione by IrO2–Hemin–TiO2Nanowire Arrays. Nano Lett. 2013, 13, 5350–5354. [Google Scholar] [CrossRef]
  41. Ellison, S.L.R.; Thompson, M. Standard additions: Myth and reality. Analyst 2008, 133, 992–997. [Google Scholar] [CrossRef]
Figure 1. Color and UV-Vis absorbance spectra of (a) the CTAB solution (10 mM); (b) 0.25 mM AuCl4 solutions in the absence and presence of 50 μM Cys; (c) 0.25 mM AuCl4 and 10 mM KBr solutions in the absence and presence of 50 μM Cys; (d) 0.25 mM AuCl4 and 10 mM CTAB solutions in the absence and presence of 50 μM Cys.
Applsci 11 02705 g001
Figure 2. Graphical representation of the potential mechanism of biothiol sensing using gold-coated CTAB micellar assemblies.
Applsci 11 02705 g002
Figure 3. Optimization of the experimental conditions: (a) AuCl4 concentration (other conditions: 75 mM CTAB, 50 μM Cys, no buffer, room temperature, reaction time 30 min); (b) CTAB concentration (other conditions: 0.25 mM AuCl4, 50 μM Cys, no buffer, room temperature, reaction time 30 min); (c) pH (other conditions: 0.25 mM AuCl4, 10 mM CTAB, 50 μM Cys, no buffer, room temperature, reaction time 30 min); (d) reaction time and temperature (other conditions: 0.25 mM AuCl4, 10 mM CTAB, 50 μM Cys, sodium acetate/acetic acid buffer pH 6).
Applsci 11 02705 g003
Figure 4. Investigation of interferences from common biomolecules andinorganic electrolytes at physiologically relevant concentration levels. The control sample contains 200 μM Cys while all other solutions contain 200 μM Cys and the potentially interfering biomolecule or ion as follows: histidine, glycine, valine, glutamine: 4.0 mM; cystine: 50 μM; urea: 2.0 mM; glucose: 5.0 mM; Na2SO4: 12.0 mM; Na3PO4: 12.0 mM; NaCl: 150.0 mM). All solutions were diluted 4-fold before analysis. Error bars represent the standard error calculated for triplicate samples.
Applsci 11 02705 g004
Table 1. Analytical figures of merit of the assay a.
BiothiolCysteine (Cys)Homocysteine (Hcy)Glutathione (GSH)
Linear range
Regression function
Quantification limit b
5–100 μM
y = 1.3x + 5.3, R2 = 0.97
5.0 μM
5–100 μM
y = 0.73x + 2.9, R2 = 0.99
3.5 μM
5–100 μM
Y = x + 8.6, R2 = 0.98
5.0 μM
Scanner image
(transmittance mode)
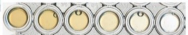
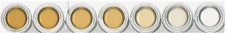
Applsci 11 02705 i001 Applsci 11 02705 i002 Applsci 11 02705 i003
a The concentrations that were used to calculate the calibration curves were 0, 5, 20, 30, 50, 70 and 100 μM for Cys and Glu and 0, 20, 30, 50, 70 and 100 μM for Hcy. The inset graphs show a digitally cropped image (to facilitate the aspect view) of the sensing zones (micro titter plates). The first plate is the control (blank) sample. A circular area occupying 80% of the total well surface was used to acquire the analytical signal, which was recorded as the mean grey area in the RGB color system. b The quantification limit was determined as 10 times the signal to noise ratio.
Table 2. Comparison of the method with recent methods for the determination of biothiols.
Detection TechniqueMaterial or Sensing ElementReal SamplesLinear Range
(μM) a
LOD
(μM) a
Recoveries
(%)
Reference
Colorimetric (paper-based)Asp-AuNPsBlood plasma99.9–998.71.099.2–101.1[36]
Turbidimetry/ColorimetryAgCl/AgNPsBlood plasma10–1008.192–97[37]
FluorescenceVS-CDsSpiked blood plasma b5–2000.398.6–111.5[38]
Colorimetry/FluorescenceRhB–MnO2 NFsSpiked blood plasma b0–150.1489.3–116.3%[39]
ColorimetricIrO2/rGO nanocomposites5 wt% BSA, Blood serum0.1–500.0499.2–122[40]
Visual/ColorimetricAuCl4/AuNP seeds/AuNPsWhole blood, blood plasma3–3001.088.7–114[14]
Visual/ColorimetricAuCl4 CTABUrine, Blood plasma5–1005 This method
Asp-AuNPs: Aspartic-acid-modified gold nanoparticles (AuNPs); VS-CDs: Vinyl sulfone—carbon dots; RhB-MnO2 NFs: Rhodamine B–manganese dioxide nanoflakes; rGO: reduced graphene oxide. a Linear range and LODs may vary for individual biothiols. b Biothiols were determined after spiking of the known concentrations in the pretreated serum.
Table 3. Application of the method to the analysis of real samples.
SampleMeasured (μM)Spiked (μM)Found (μM) aRecovery (%) bRSD (%, n = 3)
Simulated urine c0150.0101.067.38.4
0250.0190.576.26.3
Simulated blood plasma c0150.0142.094.65.9
0250.0307.5123.07.0
Urine d108100.0212.1103.86.3
Blood plasma d201100.0331.1115.05.8
a Values refer to undiluted samples. b Recoveries were calculated based on IUPAC recommendations according to the formulae: Recovery (%) = (total − spiked) × 100/found. c Concentrations were determined by external calibration using standard solutions of Cys. d Concentrations were determined using the method of standard additions.
Publisher’s Note: MDPI stays neutral with regard to jurisdictional claims in published maps and institutional affiliations.

