Article

Evaluation of the Ultimate Strength of the Ultra-High-Performance Fiber-Reinforced Concrete Beams

1
Department of Digital Architecture and Urban Engineering, Hanyang Cyber University, Seoul 04763, Korea
2
Division of Architecture, Hanyang University, Ansan 15588, Korea
3
Department of Architectural Engineering, Hanyang University, Seoul 04763, Korea
4
Department Fire and Disaster Prevention Engineering, Kyungnam University, Changwon 51767, Korea
*
Author to whom correspondence should be addressed.
Appl. Sci. 2021, 11(7), 2951; https://doi.org/10.3390/app11072951
Submission received: 20 January 2021 / Revised: 3 March 2021 / Accepted: 11 March 2021 / Published: 25 March 2021
(This article belongs to the Special Issue Advanced Fiber-Reinforced Cementitious Composites)

Abstract

:
Evaluation of the ultimate strength for the UHPFRC (ultra-high-performance fiber-reinforced concrete) flexural members was conducted. In this study, an experimental program about UHPFRC beams was conducted with the effect of fiber volume fraction, shear span to depth ratio, and compressive strength of matrix as the main variables. Among them, it was found that fiber volume fraction was the variable that had the greatest influence on the ultimate strength. The inclusion of 2% volume fraction steel fiber increases the shear and flexural strength of UHPFRC beams significantly. In particular, steel fiber inclusion changed the mode of failure of beams from diagonal shear failure into flexural failure. For the classification of failure patterns, the ultimate flexural strength and shear strength of UHPFRC members were evaluated using the current design code and UHPC guidelines. Flexural ultimate strength was affected by the size and shape of the stress block and consideration of the matrix’s tensile strength. For the accurate shear strength prediction of UHPFRC beams, the tensile strength of the high strength matrix and the effect of steel fiber should be considered.

1. Introduction

Interest in the use of fiber-reinforced concrete to structural members has been steadily increasing from the latter half of the 20th century [1]. Building code and commentary published by the American Concrete Institute 318 committee (ACI318) [2], widely used for the design of concrete structures, introduced steel fiber as the design alternatives for minimum shear reinforcement the revision of the 2008 version of code. MC2010 [3] widened the applicability of steel fiber reinforced concrete introducing the material models of steel fiber-reinforced concrete. In the 1990s, Richard and Cheverezy [4] developed reactive powder concrete (RPC) [4] with a compressive strength exceeding 200 MPa. In France, the design recommendation for the use of steel fiber-reinforced concrete with compressive strength exceeding 150 MPa was suggested [5]. This design recommendation uses reactive powder concrete (RPC) as the matrix for compressive strength higher than 100 MPa. To guarantee the large tensile deformation limit, steel fiber should be included in the matrix. Materials with these characteristics were named ultra-high-performance fiber-reinforced concrete (UHPFRC) in these design recommendations. Most of the studies on UHPFRC were about the mechanical properties of the materials, and the amount of research on structural members was relatively small. Graybeal [6] conducted a study on prestressed I-girders using Ductal. Yang et al. [7] conducted an experimental study on the UHPFRC beams with a rectangular cross-section. The main variables were reinforcement ratio and placing method. The dispersion and orientation of steel fibers in UHPFRC were significantly influenced by the placing method and significantly affected the flexural behavior of the UHPFRC beams. UHPFRC beams showed a ductility ratio of 1.7 or higher, even with a flexural reinforcement ratio of less than 1%. Yoo et al. [8] conducted a study on the effect of types of steel fibers on the flexural behavior of the UHPFRC beams. UHPFRC generally uses a water–cement ratio of 0.2 or less. This is because it has been shown that high strength (especially above 100 MPa) could be made at a water–binder ratio of 0.2 or less in general. Usually, to guarantee the workability of UHPFRC, short and straight steel fibers were used. However, for the development of advanced structural behavior of UHPFRC members, Yoo et al. [8] used long and various-shaped steel fiber and reported the increase of flexural strength and ductility. Most of the research about the flexural behavior of UHPFRC beams was conducted based on the stress-strain behavior of UHPFRC under compression and tension because design guidelines for UHPFRC recommend the use of sectional analysis with a suggested stress-strain model for the prediction of flexural strength of UHPFRC beams. Therefore, it was considered that the study on the material characteristics was more frequently conducted than the study on the flexural behavior of members. On the other hand, the study on shear strength was carried out by focusing on the evaluation of the member strength rather than the contribution of the material to the overall carrying capacity, and most of test specimens were I-shaped girder.
Graybeal [9] used UHPFRC up to 120–200 MPa of compressive strength, and short straight steel fibers with a length of 12.7 mm were used. As a result of 4-point loading tests of I-shaped girders, it was confirmed that the maximum strength was determined by the pulling out of steel fibers across the shear and flexural cracks when shear and flexural failure occurred, respectively. Voo et al. [10] studied the effect of shear span to depth ratio and steel fiber content on shear strength through 8 I-shaped girder tests. The compressive strength of concrete used was 120–140 MPa, relatively long steel fiber was used as 15 mm and 25 mm. It is suggested that the plasticity theory can be applied to the calculation of the shear strength by ensuring the deformation capacity after cracking due to the incorporation of steel fiber, and the analysis results suggest that shear strength can be predicted with high accuracy. Xia et al. [11] carried out an experiment on T-beams made with UHPFRC. The compressive strength of concrete used was 124 MPa, 193 MPa, and high strength steel was used as flexural reinforcements. In order to consider the high yield strength of high strength steel, the shear reinforcing effect of steel fiber was extensively studied analytically. Baby et al. [12] assumed that the orientation of the fiber would have a significant effect on the performance of the UHPFRC, and fiber orientation would be different between prisms for flexural test and real member. Prisms for the flexural test were taken from tested, real members. Using the test results of members and prisms, orientation factors for real structures were suggested.
It has been observed that the UHPFRC shows a large variation in mix proportion and strength depending on the purpose of the study, and it is still difficult to develop a general design method. The design recommendations limit the research scope used to create the design recommendations to address this issue. Furthermore, there is a large difference in the limitations of material strength. Considering that the material characteristics are different, it is necessary to verify the design criteria through various methods. In this study, the bending test of the UHPFRC beam was performed as part of the general evaluation of the flexural and shear design recommendations provided by the French design recommendation [5], which limits the strength range, and the Korean design recommendation [13], which provides the standard mix proportion for UHPFRC. The current structural concrete code provisions were evaluated by using test results.

2. Test Program

2.1. Variables

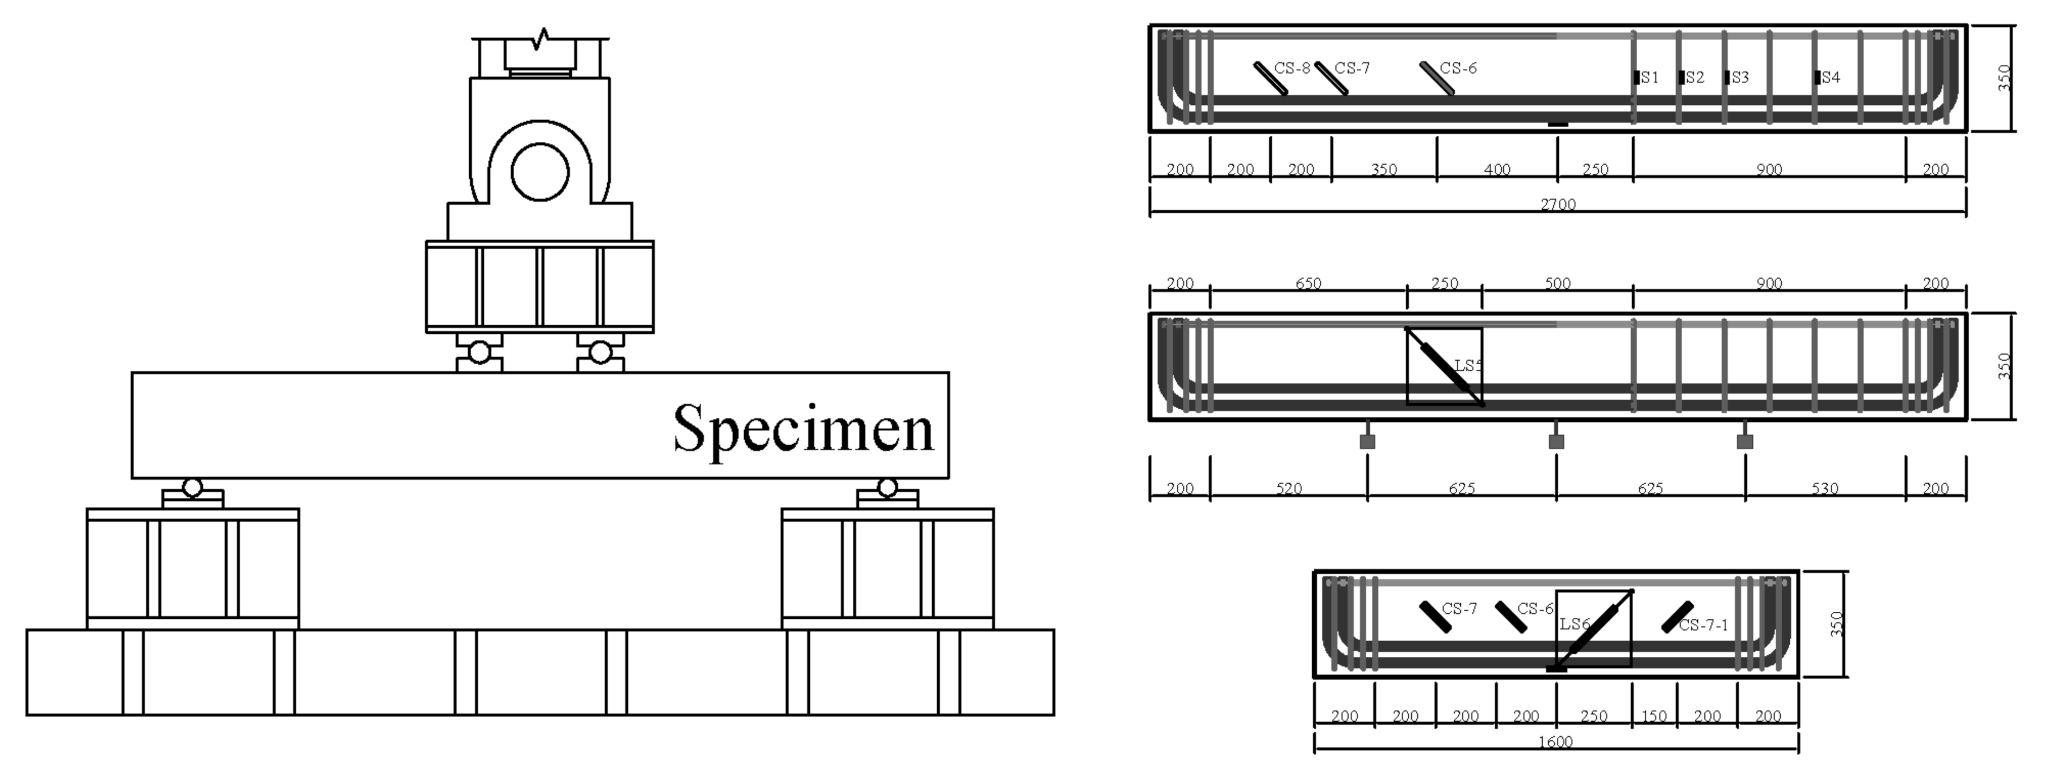
To evaluate the bending and shear strength of the UHPFRC member, the UHPFRC beams reinforced with reinforcing bars were fabricated and tested. The main variables were the shear span to depth ratio of the beams, the compressive strength of the matrix, and steel fiber and stirrups as shear reinforcement. The failure mode of reinforced concrete beams was generally well known to be strongly influenced by the shear span to depth ratio. Therefore, to investigate the various flexural behavior of UHPFRC beams, the shear span to depth ratios were adjusted to 6.6, 3.4, and 2.0. The compressive strength of UHPFRC beams was determined to be 100 and 200 MPa to investigate the effect of the matrix’s compressive strength on the flexural behavior of UHPFRC beams. Evaluating the shear strength increase and change of flexural behavior incorporating the shear reinforcement, steel fiber, and both of them, it was decided to use volume fraction of 0 and 2% and the existence of shear reinforcement variables. Because of predesign of the test specimens and mix proportion, 2% of volume fraction can prevent abrupt failure under compression. All tested beams had the same sectional shape. The beam width was 200 mm and the depth of the beam was 350 mm. The same effective depth was used for all test specimens. The reinforcement ratio was adjusted to 4.0% to make the shear failure possible and examine its applicability according to the current design standards [2]. The details of the test specimens are shown in Figure 1, which is composed of four types according to the shear span to depth ratio and presence of stirrup.
The main variables of this research are summarized in Table 1. In Table 1, U denoted the ultra-high-strength matrix with a design compressive strength of 200 MPa`. H denoted the high strength matrix with a design compressive strength of 100 MPa. The second notation 0 or S denoted the existence of shear reinforcement. The third notation 0 or F denoted the inclusion of steel fiber with a 2% volume fraction. The last notation denoted the shear span-to-depth ratio of each test specimen.
The four-point bending test method was used for specimens with a shear span-to-depth ratio higher than 3. Specimens with a shear span to depth ratio of 2.0 were tested by using a 3-point bending test. An actuator with a capacity of 2000 kN was used. However, all test specimens have shear strength lower than 1000 kN, ensuring the failure of test specimens that have unexpected high strength because of the high tensile strength of UHPFRC. The test setup is shown in Figure 2.
Strain gauges were installed on the longitudinal reinforcement and shear reinforcements to specify the member’s failure type. Strain gauges were installed on the concrete surface within the shear span to determine the occurrence and propagation of diagonal cracks. Moreover, the Linear variable differential transformers(LVDTs) was installed to specify the amount of deformation in the diagonal direction within a specific section (besides the loading point). The measurement plan is shown in Figure 2, along with the loading plan of the specimen.

2.2. Materials

This research used the three different UHPFRC mix proportions. Ultra-high strength matrix without steel fiber (200-0), ultra-high strength matrix reinforced with steel fiber (200-F), and high strength matrix with steel fiber (100-F) were used. Mix proportions are shown in Table 2. The water–binder ratio used for the preparation of UHPFRC was 0.17, and silica fume and micro-silica were used to increase the packing density. High-range water reduction agents were used to prevent the lowering of workability due to the incorporation of a low water-binder ratio and steel fiber inclusion. Straight and short steel fiber with a length of 13 mm and a diameter of 0.2 mm, which minimized the workability deterioration, was used. The reinforcing bars used in this study were D25, D13, and D10 specified in KS B0802 [14]. D25 was used as the main flexural reinforcement, and D13 was used as compression reinforcement. D10 was used as the shear reinforcement.

3. Test Results

3.1. Properties of Materials

To define the characteristics of the UHPFRC used, a cylinder specimen with a height of 200 mm and a diameter of 100 mm was produced according to KS F 2405 [15], and the compressive strength test was performed. For evaluation of tensile strength improvement, which is the most important feature of UHPFRC, splitting tensile strength was carried out according to KS F 2423 [16]. According to JCI’s test standard [17], the bending test of the notched prism was carried out, and the inverse analysis using the test results was performed to derive the tensile strength. The mechanical properties of concrete are summarized in Table 3, and the stress-strain relationships measured from the bending test are shown in Figure 3. The mechanical properties of reinforcing bars are summarized in Table 4. The characteristics of each reinforcing bar were evaluated according to the tensile test method of KS B 0802.

3.2. Moment-Rotation Relation and Crack Pattern

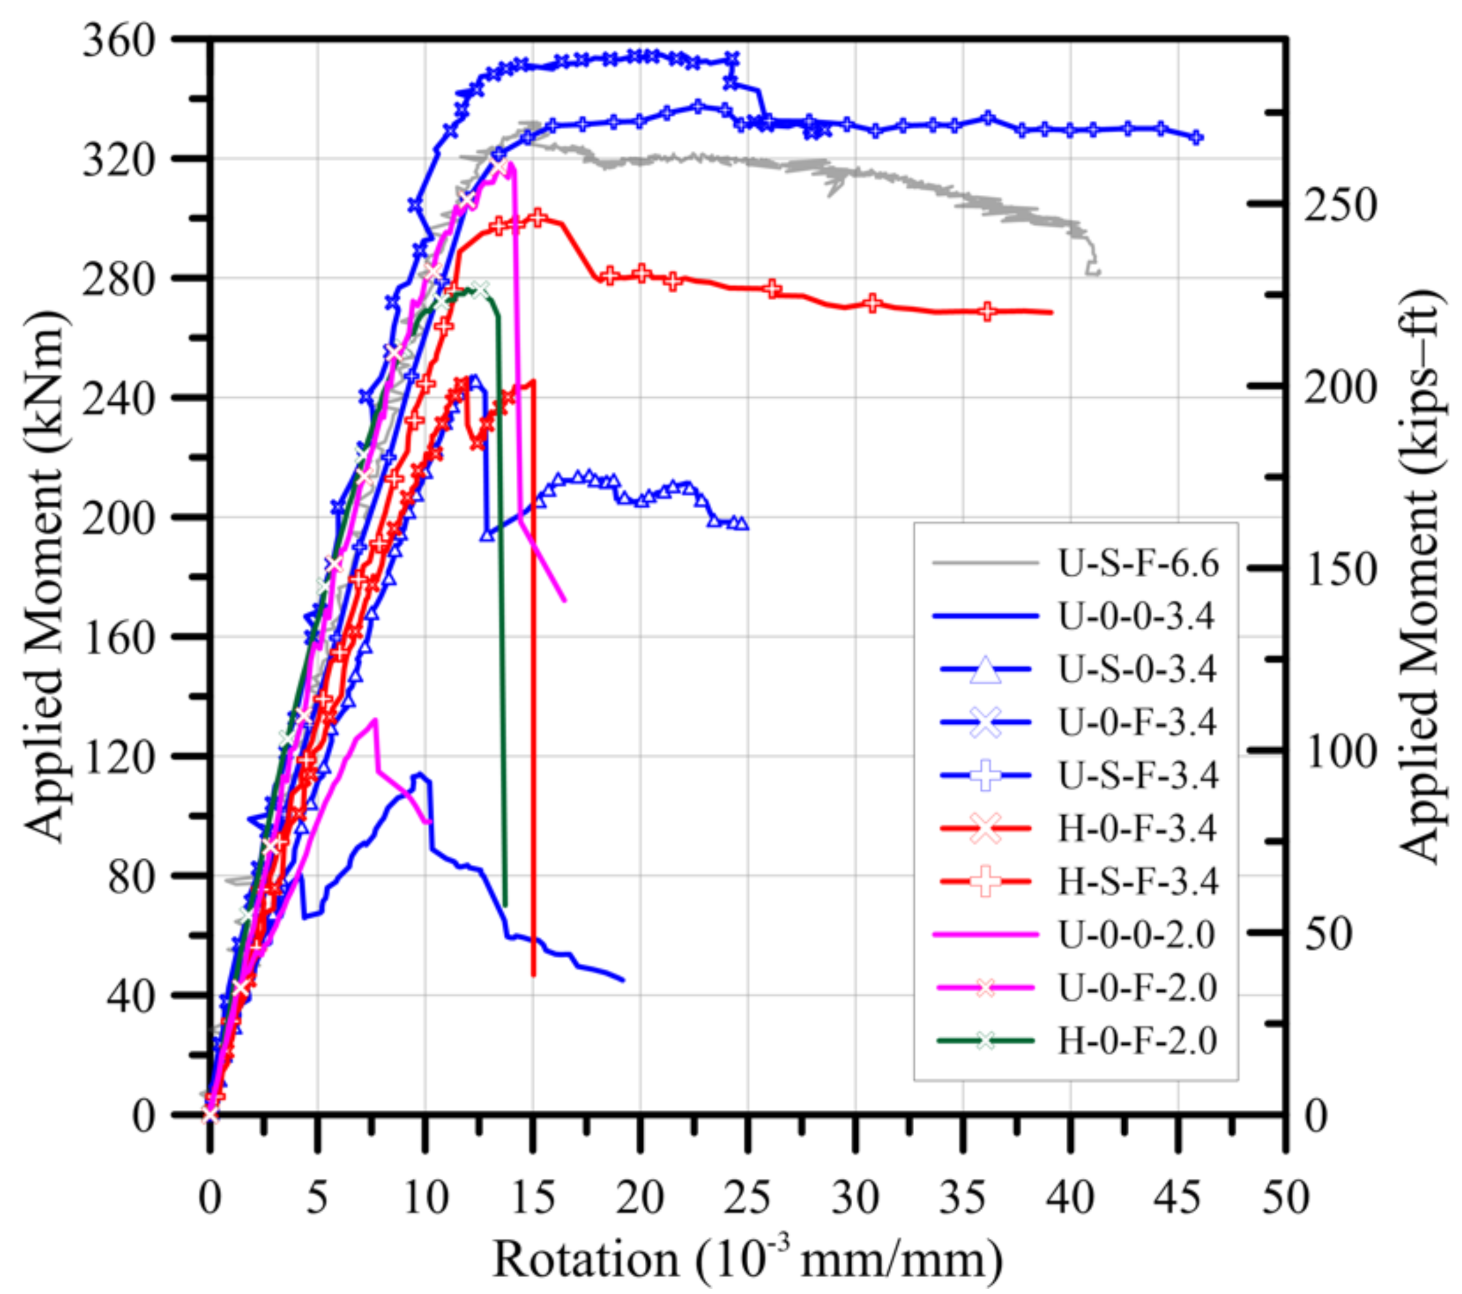
Figure 4 shows the relationship between the load-resisting capacity and its associated deformation of the test specimen obtained through the experiment. Figure 5 showed the final failure condition of the test specimens. Since the shear span to depth ratios of the specimens differed, the load acting on the specimen was expressed by the moment, and the rotation angle expressed the deformation capacity. The rotation angle of each specimen was expressed by the value obtained by dividing the deflection occurring at the loading point by the distance from the support to the loading point.
The specimens were found to have flexural and shear failure modes depending on the shear span to depth ratio and the existence of steel fiber and shear reinforcements. U-S-F-6.6 was failed by crushing on the compression side, as shown in Figure 5a after typical bending behavior. Furthermore, it was confirmed that even in the moment-rotation angle relationship shown in Figure 4, a large deformation was experienced without losing the load-bearing capacity after the maximum load manifestation.
For test specimens with shear span to depth ratio of 3.4, the mode of failure was determined depending on the steel fiber inclusion. Two specimens, U-0-0-3.4 and U-S-0-3.4, which used the 200-0 matrix, showed expanded diagonal shear crack and spalling of web area, respectively, as shown in Figure 5b,c. As shown in Figure 5d, in the case of ultra-high strength concrete specimens reinforced with steel fiber, diagonal shear cracks were observed, but these cracks were not expanded, and the maximum load applied to the specimen was observed with crushing of concrete at compression fiber of beam center. Therefore, the failure pattern of this specimen was defined as flexural failure. Specimen U-S-F-3.4 also showed a similar crack pattern with U-0-F-3.4, as shown in Figure 5e. The test specimens using 100-F matrix without stirrups, H-0-F-3.4 failed with the expansion of diagonal crack. On the other hand, H-S-F-3.4 was failed with crushing of compression region at beam center. Therefore, it was confirmed that failure modes were changed by shear failure and flexural failure due to the installation of the stirrup. It was confirmed that the specimens with a shear span ratio of 2.0 were destroyed by the occurrence and diffusion of diagonal cracks connected between the loading point and the supporting point and the increase of the crack width. When the steel fiber was not reinforced, the fracture occurred due to the diffusion of the cracks in the diagonal direction. It is judged that the incorporation prevents the longitudinal destruction of the strut and causes an increase in strength. Table 5 summarizes the strength with the first yield of tensile flexural reinforcement and ultimate strength with corresponding rotational angle.

3.3. Strain Distribution and Failure Mode of Test Specimens

Figure 6 shows the tensile flexural reinforcement strain at the center of the beam with a shear span to depth ratio of 3.4. All of the above-mentioned flexural failure type specimens experienced yielding of the flexural reinforcement, and shear failure type specimens showed the elimination of stress in the flexural reinforcement after experiencing maximum strength. The test specimens with a shear span to depth ratio of 2.0 were a shear failure due to the diagonal shear crack width expansion, as shown in Figure 5. However, as a result of examining the flexural reinforcement strain, the flexural reinforcement of the specimen H-0-F-2.0 was yielded, as shown in Figure 6.
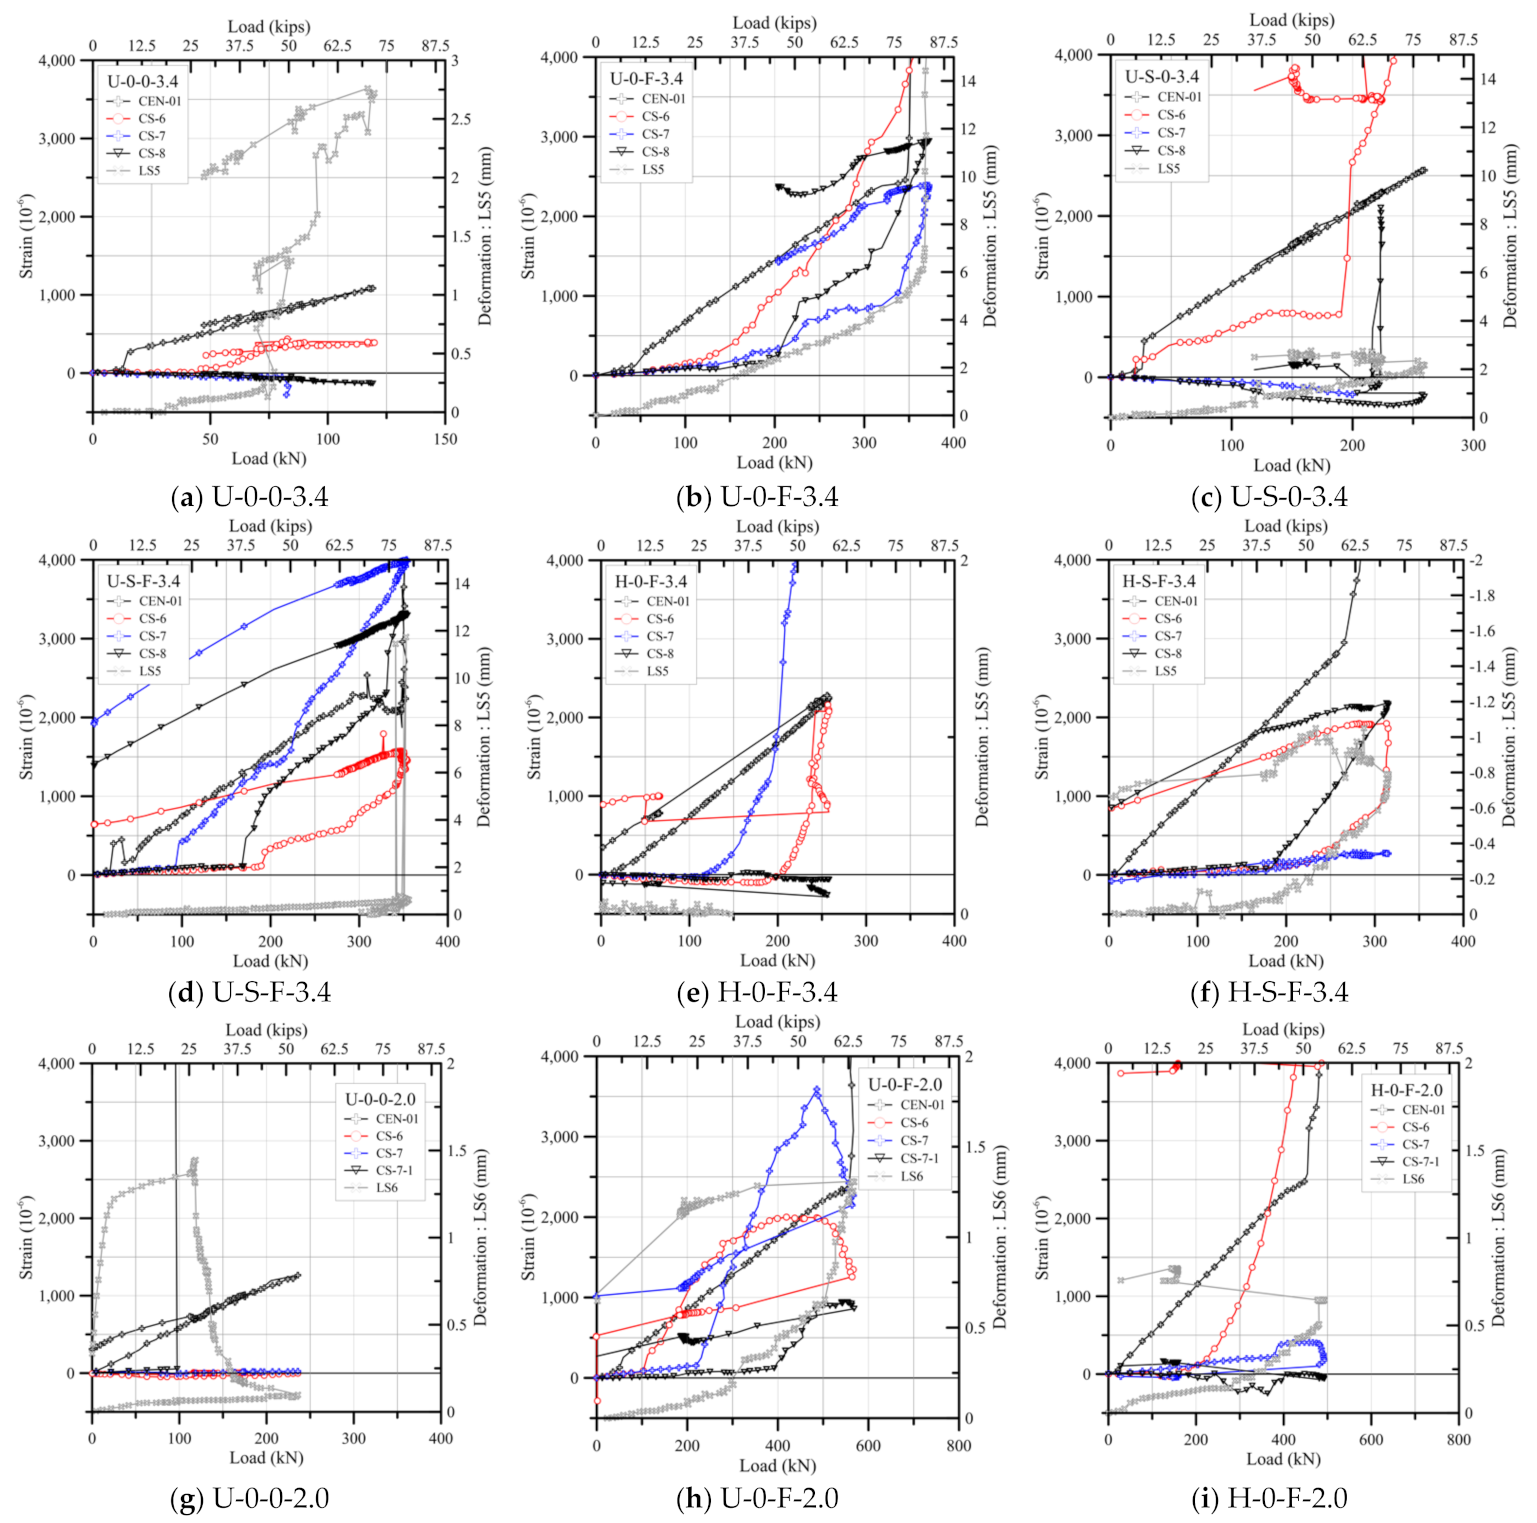
The measurement results for the deformation state of the diagonal cracks shown in Figure 7. When the cracks occurred by the naked eye, the diagonal cracks’ occurrence time was tracked. These results are summarized in Table 6.
CS stands for concrete strain, and the number on the back is used as a symbol to distinguish the measurement location. LS means measurement through LVDTs, and the number at the end is also used as a symbol to distinguish the measurement location. In the case of LVDT, the deformation amount (mm) was expressed to confirm the crack width’s expansion tendency after cracking, and the amount of deformation was determined through the right vertical axis of each graph. Figure 7 shows the strain in the diagonal direction of each specimen.
According to Figure 7a, which is the strain distribution of the specimen U-0-0-3.4, it was found that all strain gauges had a smaller amount of strain than other specimens and the tendency to return to the state before the loading after the maximum load experience appeared. This phenomenon occurred because the strain gauge did not pass through the crack surface. The diagonal section’s deformation amount was continuously increased even after the maximum load manifestation could be classified as a shear failure. It was also confirmed that the location where the deformation amount of LS5 rapidly increased was similar to the time of the crack in the diagonal direction. Figure 7c also showed this phenomenon as it is. However, in U-S-0-3.4, as reinforcement by shear reinforcement was performed, the crack angle appeared close to 45 degrees, and it could be confirmed that the strain of the corresponding gauge increased rapidly by passing through the CS6 strain gauge. The two specimens reinforced with steel fibers showed that, unlike the two specimens that were not reinforced with steel fibers, there was no sharp increase in the diagonal strain or the amount of deformation, but gradually increased. When a high-strength matrix was used, as shown in Figure 7e, it was confirmed that it belongs to shear failure as the expansion of the cracks in the diagonal direction was clearly seen even when reinforced with fibers. At this time, by reinforcing with shear reinforcement, it can be confirmed that the failure pattern was changed to a flexural failure pattern.
It was confirmed that U-0-0-2.0 appears similar to the strain distribution shown in U-0-0-3.4. When steel fibers were mixed in the ultra-high-strength concrete, it was confirmed that the increase in the strain rate of CS6 and CS7 was sequentially made. Afterward, it is judged that the load was supported in the form of a truss through struts and ties through the restoration of the deformation at both positions. On the other hand, in the case of H-0-F-2.0, as shown in Figure 7i, the strain rate at a specific location increased rapidly, and it is believed that the expansion of the diagonal crack was the main cause of failure.

3.4. Diagonal Shear Cracking Strength

The flexural and diagonal crack strengths which are listed in Table 6 were determined based on the measurement of the strain gauge attached to the longitudinal reinforcement and diagonally installed LVDT and strain gauge at the predicted point of shear crack initiation location, respectively.
According to Table 6, flexural cracking strength increased with the inclusion of steel fiber. The increase in diagonal crack shear strength due to inclusion of steel fiber was found to be 95%. As a result of comparing the characteristics of the materials, it was found that the splitting tensile strength increased by 90% due to the inclusion of the steel fiber. Therefore, as shown by the results of Sharma [18], the shear strength of UHPFRC may also be affected by splitting tensile strength.

4. Evaluation of Test Specimens with UHPRC Design Recommendations

4.1. Flexural Strength Evaluation

To predict the safe and accurate flexural strength of UHPFRC members, the flexural strength evaluation was conducted according to the current concrete structure design standard and society standard [19]. This study evaluated the stress block-based strength by ACI31[2]8 and ACI544[1]. Moreover, the flexural behavior evaluation applying the stress-strain relationship proposed in the UHPFRC design recommendation and the flexural behavior evaluation applying the stress-strain relationship proposed by the Korea Concrete Institute was performed, and a comparative evaluation of each strength estimation method was performed. In Figure 8, the results are presented in two cases with different compressive strengths.
The flexural strengths of the U-S-F-3.4 and H-S-F-3.4 specimens, based on the ACI code provision [2], did not consider the concrete matrix’s tensile strength were 294.8 kNm and 286.0 kNm, respectively, and the difference was only 3%. The test specimens’ strength evaluation results using the ACI stress block were up to 20% lower than the actual test results, as shown in Figure 8. Therefore, it was considered that the tensile behavior of the UHPFRC should be reflected properly when calculating the flexural strength. ACI544 committee recommended the flexural strength evaluation method by using compressive and tensile stress blocks. [1] As shown in Figure 8, this model showed good agreement with test results, the difference with test results only within 5%.
Recently, as UHPFRC has been used more widely, design recommendations using the UHPFRC have been proposed. The flexural strength of the UHPFRC beam can be determined by sectional analysis using the stress-strain relationship of UHPFRC under uniaxial compressive and tensile stresses. In this study, French and Korean recommendations about UHPFRC member design were evaluated. The main difference between the two recommendations was the limitation of material behavior. The French recommendation (AFGC) [5] allow the strain hardening and softening. However, Korean recommendation (KICT) [13] only suggests the strain hardening rule and specific mix proportion of UHPFRC. In addition, a review through the stress-strain curve proposed by the Korea Concrete Institute was also conducted to examine the possibility of expanding the current structural design standards.
In Table 7, stress-strain curves of two recommendations that can be used for the sectional analysis of UHPFRC flexural member and KCI model suggested by Korea Concrete Institute were summarized. To evaluate the applicability of these three models, a sectional analysis was carried out with assumptions of (1) plane sections before bending remain plane after bending, (2) perfect bond between concrete and reinforcement, and (3) if a matrix not reinforced with steel fiber is used, the tensile strength can be ignored, and the tensile strength should be considered when reinforced with steel fiber. The method proposed by Park [20], which is used at high frequency in section analysis, was used except for assuming the consideration of concrete tensile strength when steel fiber is used. Since all specimens are reinforced with the same reinforcement ratio, the moment-rotation angle relationship for the specimen with the 200-F matrix and the 100-F matrix with flexural failure was derived. The characteristics of the materials used in the sectional analysis were the average values of the material test results performed in this study.
Figure 8 shows the results of the moment-rotation angle relationship of the specimen and the sectional analysis derived using material models suggested by AFGC, KICT, and KCI. As a result of the analysis using the stress-strain relations, it was confirmed that the initial stiffness is higher than the experimental results. However, the initial stiffness was not considered in this study because the initial stiffness degradation may be caused by the initial crack at the stirrup position, which is frequently encountered when an ultra-high-strength matrix is used.
As shown in Table 8, KICT model overestimated the flexural strength of test specimen, compared with AFGC model. This is because the limit of the tensile strain of the KICT model is 200% larger than that of AFGC, and the tensile strength of the KICT model is 21% larger than that of AFGC due to the strain hardening rule of the KICT stress-strain model. In the case of ACI318 and KCI17, which are currently used as design standards, it was found that the flexural strength of the specimen was conservatively evaluated. However, the effect of steel fibers was not reflected. On the other hand, in the case of ACI544, which partially reflected the effects of fibers, it was found that the prediction of the flexural strength was relatively accurate, indicating that it was essential to consider the strength contribution of the fibers when calculating the flexural strength.

4.2. Shear Strength Evaluation

Since the UHPFRC is far from the compressive strength limit of the shear strength evaluation method of the current design standard, such as ACI [2], it needs to be evaluated using test results. In this study, the shear strength models proposed by AFGC and KICT were evaluated. For the applicability to current code provisions, ACI318 and ACI544 shear force equations were evaluated. Table 9 summarized the shear strength models.
Both design recommendations for UHPFRC suggested that the shear strength of the members could be calculated by the sum of the shear strength contributions of the concrete, the shear strength contributions of the steel fibers, and the shear strength contributions of the shear reinforcement. To evaluate the applicability of the two recommendations on the evaluation of the shear strength contributions, the strength evaluation results by the shear strength equation were compared with the experimental results. The shear strength estimation method proposed by the two design recommendations was to consider the principal stress direction and crack angle for calculating the shear strength contribution of steel fiber. Because many design recommendations suggest the crack angle or compressive strut angle of 45-degree, in this study, shear strength evaluation was based on the 45-degree angle of crack or compressive strut. Table 10 shows the shear strength evaluation results of each specimen.
According to UHPFRC design recommendations, the shear strength of all the test specimens with a shear span to depth ratio of 3.4 was overestimated, except for H-0-F-3.4. The error was larger when the specimen was not reinforced with steel fiber and shear reinforcement. On the other hand, H-0-F-3.4, which is reinforced with steel fiber and comparatively low compressive strength of the concrete matrix, was conservatively estimated but had high accuracy. Therefore, it was confirmed that steel fiber should be reinforced to the matrix to design the member according to UHPFRC design recommendations. As the current design standards did not reflect steel fibers, it was confirmed that the specimens reinforced with steel fibers had high water retention. When a high-strength matrix was used, excessively high strength was estimated. High precautions are required in the shear design. Sharma’s estimation equation provided by ACI544 did not reflect the phenomenon of deterioration of the split tensile strength of the ultra-high-strength concrete matrix. Thus, it was found that the evaluation was unsafe.
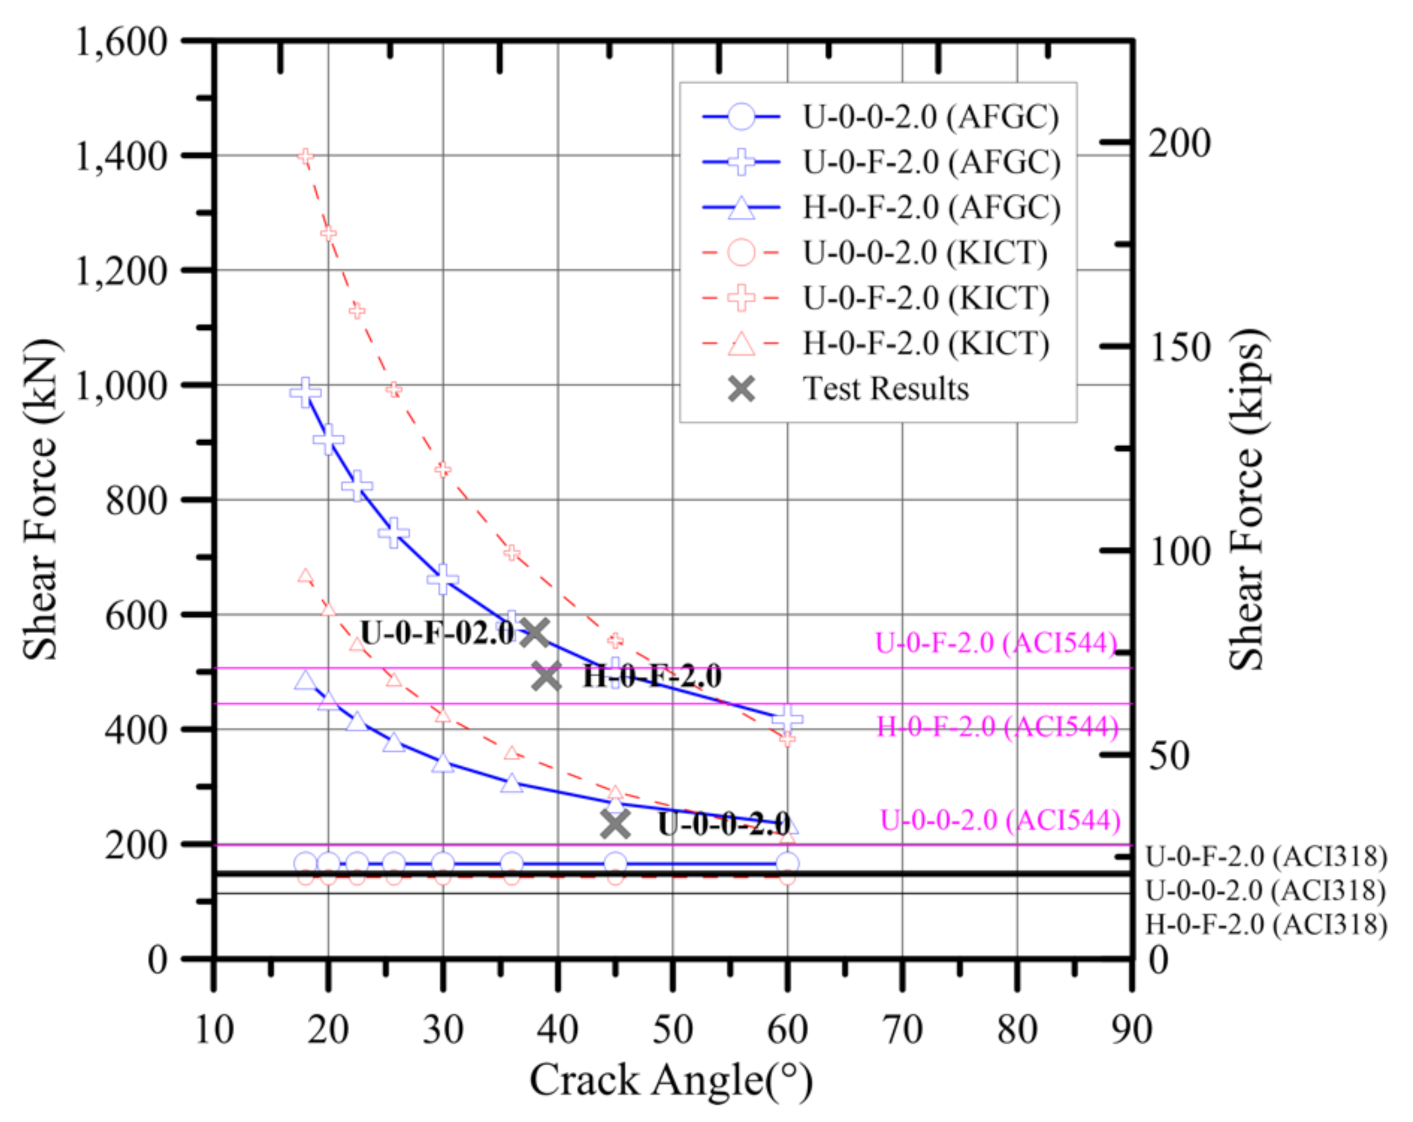
In order to evaluate the shear strength equations for the reinforcing effect of steel fiber, test specimens with a shear span to depth ratio of 2.0 were examined. As shown in Table 10, the predicted value was much smaller than the tested value. Especially, it is confirmed that this tendency is more prominent when reinforced with steel fiber. This was the case in both the AFGC and KICT design recommendations. This phenomenon was confirmed as a phenomenon occurring because the angle was evaluated at 45 degrees in this study. However, design recommendations consider the crack angle and principal stress angle as the effect of the shear span to depth ratio. Therefore, the crack angle of each specimen was measured to consider the effect of the crack angle. In U-0-0-2.0, which is not reinforced by steel fiber, the crack angle close to 45 degrees was measured in the web center. The U-0-F-2.0 and H-0-F-2.0, which were reinforced with steel fiber, had crack angles of 38 degrees and 39 degrees at the center of the web. Figure 9 illustrated the calculated shear strength and experimental results of the specimens with a shear span to depth ratio of 2.0. According to Figure 9, AFGC showed high accuracy when applying the relationship between the crack angle and the shear strength contribution of steel fiber.
However, the KICT strength prediction model overestimated the strength of the test specimen. This is probably due to the similarity of the 200-F matrix used in this study with the materials used to establish the AFGC recommendations. On the other hand, in the case of KICT, it was considered that the overestimation of the shear strength occurred because the standard material of the KICT recommendation was strain hardening material, especially under tensile stress. In the case of H-0-F-2.0, both AFGC and KICT were underestimated. This was because both design recommendations made the shear strength contribution of the concrete small to reflect the steel fiber’s reinforcing effect. As long as the concrete used does not meet the design recommendation’s main material strength, it is considered to have great conservatism. In the case of not reinforced with steel fiber, both design recommendations tend to be underestimated, and it can be confirmed that the same strength is estimated regardless of the change in crack angle. This is because the design recommendations only consider the effect of crack angles when calculating the shear strength contributions of steel fibers. This was because it affected only the support of the tensile strength at the shear crack surface and was not directly related to the diagonal compressive strut’s strength. However, as shown in Table 10, the shear strength of specimens not reinforced with steel fibers changes with the shear span ratio change. Therefore, further research is needed to investigate the shear span to depth ratio of rectangular section UHPFRC members.

5. Conclusions

For the safe design of UHPFRC, the influence of major design variables was experimentally evaluated, and the applicability of two design recommendations was evaluated. The conclusions are as follows.
  • The ultra-high strength concrete without steel fiber showed a shear failure. However, in specimens reinforced with steel fiber, the appearance and spread of diagonal cracks were observed. However, shear failure caused by the widening of the diagonal shear crack did not occur. It means that 2% volume fraction of steel fiber could change the mode of failure of beams. Moreover, it was found that the diagonal shear cracking strength could be increased by 95% when reinforced with 2% volume fiber of steel fiber.
  • The comparison of shear strength of H-0-F-3.4 and U-0-F-3.4 was impossible because the final failure mode of U-0-F-3.4 was a flexural failure. Therefore, as compressive strength increased with 100 MPa, shear strength at least 40% increased. This phenomenon was observed in the diagonal shear cracking strength.
  • When the steel fiber was included, the diagonal crack’s angle was lower than that of the case where the steel fiber was not used. Therefore, it was considered that the effective area of the steel fiber became larger, and the shear reinforcing effect of the steel fiber became larger. The decrease of the shear span to depth ratio showed a significant increase in the shear strength because the compressive strength of diagonal compressive struts increases significantly. Dispersion of splitting cracking of diagonal compressive strut delayed the failure and increased shear strength.
  • As a result of evaluating the UHPFRC design guideline’s applicability in France and Korea, AFGC showed a conservative evaluation for both flexure and shear. KICT underestimates flexure strength. However, it overestimated the shear strength. Both design recommendations did not consider the increase in shear strength due to the decrease of shear span to depth ratio unless the change in crack angle to shear strength contribution of steel fiber was considered. Thus, each design recommendation had a large conservatism at short shear span to depth ratio specimens. As a result of examining the shear strength of U-0-F-2.0, AFGC showed high accuracy when reflecting crack angle and KICT underestimated shear strength. This is because, as described above, the material used in this study was a strain-softening material, and the enhancement rate of the tensile strength itself was lower than that of the material used in the KICT.
  • When the design stress-strain relation of the design recommendation was followed, the flexural behavior was presumed to have a significantly lower ductility ratio than the actual flexural behavior. Therefore, a study on the ultimate strain in the compression fiber proposed by the design recommendation in the flexural design should be added. A study on the ductility ratio of the member should be added.
  • The two design recommendations for shear design consist of the sum of the shear strength contributions of concrete, steel fiber, and shear reinforcement. Since the contribution of concrete was not influenced by the present shear span to depth ratio, an additional experiment should be carried out using the shear span to depth ratio and the amount of steel fiber as a variable in the beam using UHPC, which is not reinforced with steel fiber.
  • Model code which did not consider the inclusion effect of steel fiber underestimated flexural and shear strength of UHPFRC. However, model code overestimated the shear strength of the test specimens without steel fiber. Therefore, it should be carefully used for the design of UHPFRC.

Author Contributions

Original draft preparation and editing, B.-I.B.; Planning test program, B.-I.B., H.-K.C.; performing tests and investigation, H.-S.J., M.-S.L.; analyzing the results and reviewing the article, H.-K.C., M.-S.L.; supervision and review writing, C.-S.C. All authors have read and agreed to the published version of the manuscript.

Funding

This work was supported by the National Research Foundation of Korea (NRF) grant funded by the Korea government (NRF-2018R1D1A1B07045177).

Institutional Review Board Statement

Not applicable.

Informed Consent Statement

Not applicable.

Data Availability Statement

Data is contained within the article.

Conflicts of Interest

The authors declare no conflict of interest.

References

  1. ACI (American Concrete Institute). ACI 544.4R-88: Design Considerations for Steel Fiber Reinforced Concrete; American Concrete Institute: Farmington Hills, MI, USA, 2009. [Google Scholar]
  2. ACI (American Concrete Institute). ACI 318-19: Building Code Requirements for Structural Concrete (ACI 318-19) Commentary on Building Code Requirements for Structural Concrete (ACI318R-19); American Concrete Institute: Farmington Hills, MI, USA, 2019. [Google Scholar]
  3. FIB (International Federation for Structural Concrete). FIB Model Code for Concrete Structures 2010; Ernst & Sohn: Lausanne, Switzerland, 2013. [Google Scholar]
  4. Richard, P.; Cheyrezy, M. Composition of reactive powder concretes. Cem. Concr. Res. 1995, 25, 1501–1511. [Google Scholar] [CrossRef]
  5. AFGC (Association Française de Génie Civil). Interim Recommendations. In Ultra High Performance Fibre Reinforced Concretes; Association Française de Génie Civil: Paris, France, 2013. [Google Scholar]
  6. Graybeal, B.A. Flexural behaviour of Ultra high performance concrete I-girder. J. Bridge Eng. 2008, 13, 602–610. [Google Scholar] [CrossRef]
  7. Yang, I.H.; Joh, C.; Kim, B.S. Structural behavior of ultra-high performance concrete beams subjected to bending. Eng. Struct. 2010, 32, 3478. [Google Scholar] [CrossRef]
  8. Yoo, D.Y.; Yoon, Y.S. Structural performance of ultra high performance concrete beams with different steel fibres. Eng. Struct. 2015, 10, 409–423. [Google Scholar] [CrossRef]
  9. Graybeal, B.A. Material Property Characterization of Ultra-High Performance Concrete; Rep. No. FHWA-HRT-06-103; Federal Highway Administration: Washington, DC, USA, 2006. [Google Scholar]
  10. Voo, Y.L.; Poon, W.K.; Foster, S.J. Shear strength of steel fiber-reinforced ultrahigh-performance concrete beams without stirrups. J. Struct. Eng. 2010, 136, 1393–1400. [Google Scholar] [CrossRef]
  11. Xia, J.; Mackie, K.R.; Saleem, M.A.; Mirmiran, A. Shear failure analysis on ultra-high performance concrete beams reinforced with high strength steel. Eng. Struct. 2011, 33, 3597–3609. [Google Scholar] [CrossRef]
  12. Baby, F.; Marchand, P.; Toutlemonde, F. Shear behavior of ultrahigh performance fiber-reinforced concrete beams. I: Experimental investigation. J. Struct. Eng. 2013, 140, 04013111. [Google Scholar] [CrossRef]
  13. Korea Concrete Institute. Design Guidelines for K-UHPC, KCI-M-12-003; Korea Concrete Institute: Seoul, Korea, 2012. [Google Scholar]
  14. KS (Korean Standard). KS B 0802. In Method of Tensile Test for Metallic Materials; Korean Standard Information Center: Seoul, Korea, 2013. [Google Scholar]
  15. KS (Korean Standard). KS F 2405. In Standard Test Method for Compressive Strength of Concrete; Korean Standard Information Center: Seoul, Korea, 2010. [Google Scholar]
  16. KS (Korean Standard). KS F 2423. In Method of Test for Splitting Tensile Strength of Concrete; Korean Standard Information Center: Seoul, Korea, 2011. [Google Scholar]
  17. JCI (Japan Concrete Institute). JCI-S-001. In Method of Test for Fracture Energy of Concrete by Use of Notched Beam; Japan Concrete Institute: Tokyo, Japan, 2003. [Google Scholar]
  18. Sharma, A.K. Shear strength of steel fiber reinforced concrete beams. ACI J. Proceeding 1986, 83, 624–628. [Google Scholar]
  19. KCI. KCI Model Code 2017 (KCI M-18-006); Kimoondang Publishing Company, Korea Concrete Institute (KCI): Seoul, Korea, 2017. (In Korean) [Google Scholar]
  20. Park, R.; Paulay, T. Reinforced Concrete Structures; John Wiley & Sons, Inc.: New York, NY, USA, 1975. [Google Scholar]
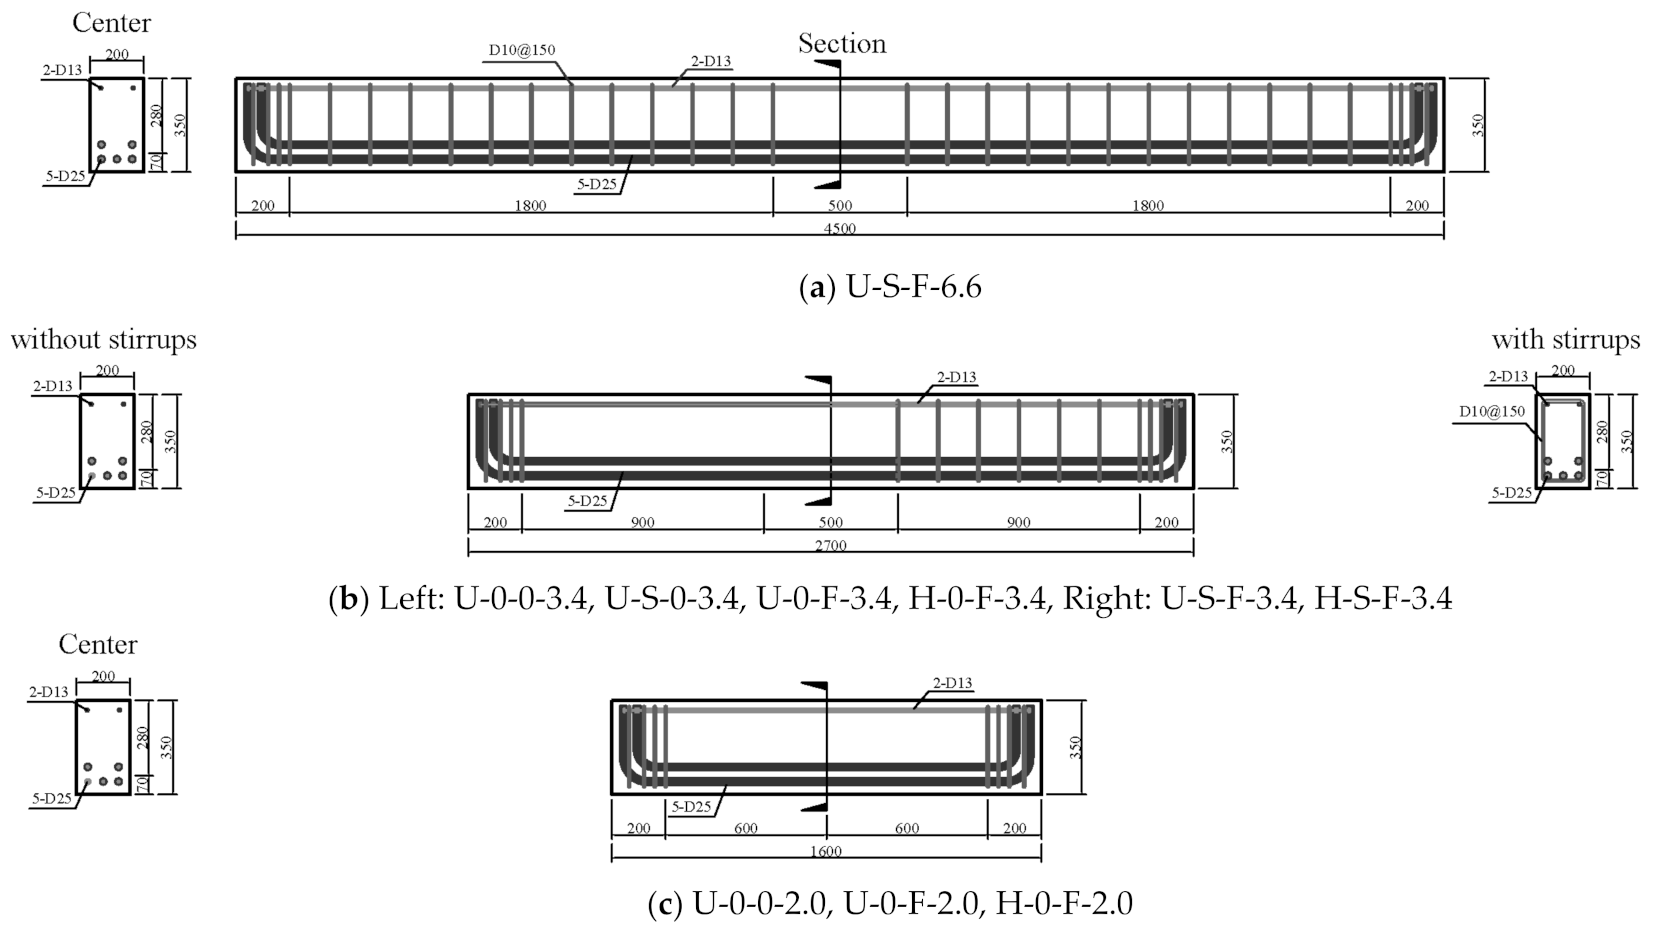
Figure 1. Details of test specimens (Unit: mm).
Applsci 11 02951 g001
Figure 2. Test setup and measurement plan.
Applsci 11 02951 g002
Figure 3. Material test results.
Applsci 11 02951 g003
Figure 4. Test results: Moment-rotation curve.
Applsci 11 02951 g004
Figure 5. Test results: Crack pattern of the test specimens (at failure).
Applsci 11 02951 g005
Figure 6. Tensile strain of longitudinal reinforcement (at center).
Applsci 11 02951 g006
Figure 7. Measured strain in shear span (diagonal direction (45 degree)).
Applsci 11 02951 g007
Figure 8. Flexural strength evaluation for test specimens.
Applsci 11 02951 g008
Figure 9. Shear strength - Crack Angle relation.
Applsci 11 02951 g009
Table 1. Variables of the test program.
Specimensa/dConcreteTransverse SteelFiber
f c d b , T R s f y , t V f L f D f
(MPa)(mm)(mm)(MPa)(%)(mm)
U-S-F-6.66.62179.51504222130.2
U-0-0-3.43.4198- 0--
U-S-0-3.4 198 150 0
U-0-F-3.4 217 - 2130.2
U-S-F-3.4 217 150 2
H-0-F-3.4 117 - 2
H-S-F-3.4 117 150 2
U-0-0-2.02.0198 - 0
U-0-F-2.0 217 - 2130.2
H-0-F-2.0 117 - 2
a/d: effective depth-shear span ratio, f c : compressive strength of concrete, d b , T R : diameter of transverse reinforcements, s: spacing of transverse reinforcement, f y , t : yield strength of transverse reinforcement, V f : volume fraction of steel fiber, L f : length of steel fiber, and D f : diameter of steel fiber.
Table 2. Mix proportion for the matrix used for test specimens.
IDW/B
(%)
CWSFSFiFSP
Unit Weight (kg/m3)
200-00.178301762079122461471.08
200-F0.1783017620791224601.08
100-F0.258092228010521621471
W/B: water–binder ratio, C: cement, W: water, SF: silica fume, S: fine aggregated (quartz sand), Fi: filler(microsilica), F: steel fiber, SP: super plasticizer.
Table 3. Mechanical characteristics of concrete.
IDVf
(%)
Ecfcfspft
(MPa)
200-0045,283198.216.31-
200-F2.049,865216.5211.9615.48
100-F2.038,451109.469.987.84
Vf: Volume fraction of steel fiber, Ec: elastic modulus of ultra-high-performance concrete (UHPC), fc: compressive strength of cylinder, fsp: splitting tensile strength of UHPC, fr: tensile strength of ultra-high-performance fiber-reinforced concrete (UHPFRC) using notched specimens.
Table 4. Mechanical characteristics of steel reinforcement.
IDDiameter
(mm)
Yield Strength
(MPa)
Yield StrainTensile Strength
(MPa)
D109.5495.320.00260614.87
D1312.7422.560.00245526.23
D2525.4445.220.00261554.87
Table 5. Yield and ultimate strength of test specimens.
Specimens θ y
(mm/mm)
M y
(kNm)
θ m a x
(mm/mm)
M m a x
(kNm)
U-S-F-6.60.01272319.30.01488331.7
U-0-0-3.4--0.00975114.0
U-S-0-3.4--0.01233245.6
U-0-F-3.40.01175333.40.02036355.2
U-S-F-3.40.01856336.90.02353338.8
H-0-F-3.4--0.01192246.5
H-S-F-3.40.01003244.50.01524300.2
U-0-0-2.0--0.00768132.1
U-0-F-2.0--0.01396318.3
H-0-F-2.00.00896256.50.01196276.2
θ y : member rotation at the yielding of the tensile rebar, M y : applied moment at the yielding of the tensile rebar, θ m a x : member rotation at maximum load, M m a x : applied moment at maximum load.
Table 6. Cracking strength of test specimens.
Specimens θ f c r
(mm/mm)
M f c r
(kNm)
θ d c r
(mm/mm)
M d c r
(kNm)
U-S-F-6.60.0011641.60.00341102.7
U-0-0-3.40.0002915.10.0017242.3
U-S-0-3.40.0006119.00.0013145.7
U-0-F-3.40.0012142.50.0015182.4
U-S-F-3.40.0010349.10.0030688.1
H-0-F-3.40.0008223.20.0022557.5
H-S-F-3.40.0008224.10.0022164.2
U-0-0-2.00.0005418.70.0021454.6
U-0-F-2.00.0012544.20.00418129.2
H-0-F-2.00.0007127.70.00286102.2
θ f c r : member rotation at the flexural cracking load, M f c r : applied moment at the flexural cracking load, θ d c r : member rotation at the diagonal cracking load, M d c r : applied moment at the diagonal cracking load.
Table 7. Stress-strain models for sectional analysis.
RecommendationCompressionTensionCurve
AFGC ε c o = f c k / E c m
f c d = α c c f c k / γ c
ε c o d = f c d / E c m
ε c u d = 1 + 14 f c t f m / f c m ε c o d
ε u , p e a k = w p e a k l c + f c t k , e l γ c f E c , e f f
ε u , 1 % = w 1 % l c + f c t k , e l γ c f E c , e f f
ε u , l i m = l f 4 l c , l c = 2 3 h
K g l o b a l = 1.25 , K l o c a l = 1.75
Applsci 11 02951 i001
KICT E c = 45 G P a (pre-design) ε c r = ϕ c f c r k E c
ε u = ϕ c f c r k E c + w u L e q
ε l i m = ϕ c f c r k E c + w l i m L e q
L e q h b e a m = 0.8 1 1 / 1.05 + 6 h b e a m / l c h 4
Applsci 11 02951 i002
KCI f c = 0.85 f c k 1 1 ε c ε c o n
f c = 0.85 f c k , c ( ε c ε c o )
n = 1.2 + 1.5 100 f c k 60 4 2.0
ε c o = 0.002 + f c k 40 100 , 000 0.002
ε c u = 0.0033 f c k 40 100 , 000 0.0033
- Applsci 11 02951 i003
French recommendation (AFGC model) f c t f m : maximum mean post-cracking stress in tension[MPa], f c m : maximum mean stress in compression (MPa), α c c : coefficient that takes into account the long-term effects l c : characteristic length (mm), w p e a k : crack opening corresponding to the local peak or 0.3 mm if there is no peak (mm), γ c f : partial safety factor on fibers(=1.5), f c t k , e l : the characteristic elastic tensile strength (MPa), E c , e f f : effective modulus of elasticity (MPa), w 1 % = 0.01   H , H : height of the prism (mm), l f : fiber length (mm), K : fiber orientation factor; Korean recommendation (KICT model) h b e a m : height of beam (mm), l c h : characteristic length (mm) (= G F E c f t k 2 ), G F : fracture energy (N/mm), f t k : characteristic tensile strength (MPa), f c r k : characteristic cracking strength (MPa), f c r d : design cracking strength (MPa) (= ϕ c f c r k ), (KCI model) f c : concrete stress, f c k : compressive strength of concrete, ε c : concrete strain, ε c o : strain at peak stress, ε c o : strain at ultimate state.
Table 8. Flexural strength prediction.
SpecimensTestAFGCKICTACI318ACI544KCI17
M t e s t
(kNm)
M A F G C
(kNm)
M t e s t M A F G C M K I C T
(kNm)
M t e s t M K I C T M A C I 318
(kNm)
M t e s t M A C I 318 M A C I 544
(kNm)
M t e s t M A C I 544 M K C I 17
(kNm)
M t e s t M K C I 17
U-S-F-6.6331.7362.80.99378.90.88294.81.14325.61.02272.51.22
U-0-0-3.4114.0311.10.37306.50.37294.81.06294.80.35272.50.42
U-S-0-3.4245.6311.10.79306.50.80294.81.06294.80.75272.50.90
U-0-F-3.4355.2362.81.06378.90.94294.81.14325.61.09272.51.30
U-S-F-3.4338.8362.81.01378.90.89294.81.14325.61.04272.51.24
H-0-F-3.4246.5301.20.82311.00.79286.01.05293.80.84256.90.96
H-S-F-3.4300.2301.21.00311.00.97286.01.05293.81.02256.91.17
U-0-0-2.0132.1311.10.42306.50.43294.81.06294.80.41272.50.48
U-0-F-2.0318.3362.80.95378.90.84294.81.14325.60.98272.51.17
H-0-F-2.0276.2301.20.92311.00.89286.01.05293.80.94256.91.08
M t e s t : Applied moment(test results), M A F G C : flexural strength calculated according to the AFGC recommendation, M K I C T : flexural strength calculated according to the KICT recommendation, M A C I 318 : flexural strength calculated according to the ACI318 stress block, M A C I 544 : flexural strength calculated according to the ACI544 stress block, M K C I 17 : flexural strength calculated according to the KCI17 stress-strain model.
Table 9. Shear strength equations for the UHPC member design.
RecommendationEquations
AFGC V R d = V R d , c + V R d , s + V R d , f
V R d , c = 0.21 γ c f γ E k f c k 0.5 b w d , k = 1 + 3 σ c p f c k σ c p 0 0.7 σ c p f c t k , 0.05 σ c p < 0 , σ c p = N E d / A c
V R d , f = A f v σ R d , f t a n θ , σ R d , f = 1 K γ c f 1 w l i n 0 w l i n σ f w d w , A f v = b w z
V R d , s = A s w s z f y w d cot θ , V R d , m a x = 2 × 1.14 α c c γ c b w z f c k 2 / 3 / cot θ + tan θ
KICT V d = V r p c d + V f d + V s d , V r p c d = ϕ b 0.18 f c d b w d , V f d = ϕ b f v d / tan β u b w z , f v d = 1 w v 0 w v σ d w d w , w v = m a x w u , 0.3 m m , β u = 1 2 tan 1 2 τ σ z u σ y u β 0 , V s d = ϕ b A w f y v d sin α s + cos α s s s d , V w c d = ϕ b 0.84 f c d 2 / 3 sin 2 β u b w d
ACI318 V c = 0.16 λ f c + 17.6 ρ w V u d M u b w d , V S = A v f y t d s
ACI544 v n = 2 3 f t d a 0.25
(AFGC model) V R d : shear capacity of UHPFRC members (N), V R d , c : shear capacity contributed by concrete (N), V R d , s : shear capacity contributed by shear reinforcement (N), V R d , f : shear capacity contributed by steel fiber (N), γ E : safety coefficient(=1.5), f c k : characteristic compressive strength, N E d : applied normal force (N), A c : gross sectional area (mm2), A s w : area of shear reinforcements (mm2), z : internal lever arm (mm), s : spacing of shear reinforcements (mm), f y w d : design yield strength of shear reinforcements, θ : strut inclination angle, (KICT model) V d : design shear strength (N), V r p c d : design shear strength of a member which have no shear reinforcement (N), V f d : design shear strength provided by reinforcing fibers (N), V s d : design shear strength provided by shear reinforcements (N), ϕ b : member strength reduction factor, f c d : design compressive strength of K-UHPC, b w : web width, d : effective depth of member, f v d : average design tensile strength of K-UHPC normal to the diagonal crack (MPa), β u : inclination of diagonal crack, τ : average design shear stress (MPa), σ z u , σ y u : average compressive stress in the longitudinal direction and normal to the longitudinal direction, respectively (MPa), β 0 : angle between a diagonal crack and a line at 45 degree from the longitudinal axis of a member, z : the internal lever arm (mm), A w : area of steel reinforcement f y v d : design yield strength of shear rebars (MPa), α s : inclination of shear rebars, (ACI318 model) V c : contribution of concrete on shear strength, f c : compressive strength of concrete, ρ w : longitudinal reinforement ratio, b w : width of web, d : effective depth of section, V s : contribution of shear reinforcement on shear strength, A v : area of shear reinforcement, f y t : yield strength of shear reinforcement, s : spacing of shear reinforcement, (ACI544 model) v n : shear stress of section, f t : splitting tensile strength of concrete, a : shear span length.
Table 10. Shear strength prediction of all test specimens.
SpecimensTestAFGCKICTACI318ACI544
V t e s t
(kN)
V A F G C
(kN)
V t e s t V A F G C V K I C T
(kN)
V t e s t V K I C T V A C I 318
(kN)
V t e s t V A C I 318 V A C I 544
(kN)
V t e s t V A C I 544
U-S-F-6.6179.7599.20.30221.20.81269.40.67409.80.44
U-0-0-3.4119.8165.60.72120.60.99138.30.87173.50.69
U-S-0-3.4259.4266.30.97215.81.20269.60.96304.70.85
U-0-F-3.4373.1498.50.75471.40.79144.02.59328.81.13
U-S-F-3.4355.9599.20.59566.50.63275.31.29460.10.77
H-0-F-3.4258.9270.90.96247.51.05105.92.44274.40.94
H-S-F-3.4315.3371.70.85342.60.92237.21.33363.70.87
U-0-0-2.0235.4165.61.42120.61.95146.81.60198.11.19
U-0-F-2.0568.4498.51.14471.41.21152.53.73506.71.12
H-0-F-2.0493.2270.91.82247.51.99114.44.31444.61.11
V t e s t : Applied load(test results), V A F G C : shear strength calculated according to the AFGC recommendation, V K I C T : shear strength calculated according to the KICT recommendation, V A C I 318 : shear strength calculated according to the ACI318, V A C I 544 : shear strength calculated according to the ACI544 (suggestion of Sharma).
Publisher’s Note: MDPI stays neutral with regard to jurisdictional claims in published maps and institutional affiliations.