Review

Principles of Different X-ray Phase-Contrast Imaging: A Review

1
State Key Laboratory of Modern Optical Instrumentation, College of Optical Science and Engineering, Zhejiang University, Hangzhou 310027, China
2
Collaborative Innovation Center of Extreme Optics, Shanxi University, Taiyuan 030006, China
*
Authors to whom correspondence should be addressed.
These authors contributed equally to this work and should be considered co-first authors.
Appl. Sci. 2021, 11(7), 2971; https://doi.org/10.3390/app11072971
Submission received: 13 February 2021 / Revised: 18 March 2021 / Accepted: 18 March 2021 / Published: 26 March 2021

Abstract

:
Numerous advances have been made in X-ray technology in recent years. X-ray imaging plays an important role in the nondestructive exploration of the internal structures of objects. However, the contrast of X-ray absorption images remains low, especially for materials with low atomic numbers, such as biological samples. X-ray phase-contrast images have an intrinsically higher contrast than absorption images. In this review, the principles, milestones, and recent progress of X-ray phase-contrast imaging methods are demonstrated. In addition, prospective applications are presented.

1. Introduction

As discovered by Wilhelm Conrad Röntgen, X-rays are electromagnetic waves with wavelengths ranging from approximately 10−12 to 10−8 m. The X-ray source, which is usually called an X-ray tube, is a vacuum chamber containing the anode and the cathode. When a high current is applied to the cathode, its temperature increases, so electrons are released from it. High potential is applied between the cathode and the anode, so the electrons are accelerated towards the anode. These electrons stop suddenly after hitting the anode. The loss of energy is then released in the form of X-ray photons. This is called bremsstrahlung radiation. If the electrons knock out the core electron on the anode, the valence electron falls to fill the core-shell. During this transition, the loss of energy is released in the form of X-ray photons, which is the characteristic radiation. When transmitted through materials, the intensity of the X-ray beam changes owing to the different absorption coefficients of materials, allowing the observation of the internal features of objects using noninvasive X-ray imaging.
The absorption images of low-Z materials exhibit poor contrast under X-ray irradiation. Theoretically, phase-contrast X-ray imaging has higher contrast and sensitivity than conventional absorption imaging. Higher contrast makes the different compositions of an object more distinguishable [1,2]. In this review, we did not differentiate between phase-contrast imaging and phase imaging, as Momose did in a previous review [2]. Instead, we refer to all X-ray imaging that contains phase information as X-ray phase imaging. The main streams of X-ray phase imaging include but are not limited to Zernike’s X-ray microscopy [3,4], X-ray holography [5], differential X-ray microscopy [6,7], coherent diffraction microscopy [8], crystal interferometer [9], grating interferometer [10,11], diffraction-enhanced imaging (DEI) [12], and propagation-based techniques [13]. In Zernike’s X-ray microscopy, a phase ring is inserted to phase-shift the undiffracted light so that the light that has been phase-shifted by the object constructively or destructively interferes with the undiffracted light, which both increase the contrast. In X-ray holography, a coherent wave passes through an object and forms interference patterns on the photographic plate. After being illuminated by the coherent wave without the object, a pair of twin images appear at both sides of the photographic plate. Differential X-ray microscopy was performed by inserting a pair of parallel and laterally displaced zone plates upstream of the sample. The incident beam splits into zeroth- and higher-order spherical waves after the zone plates. The combinations of the zeroth-order in the first zone plate and the first order in the second zone plate and vice versa interfere with each other and form diffraction patterns. Coherent diffraction imaging (CDI) is a lensless method that uses an iterative algorithm to retrieve phase information. A crystal interferometer uses a crystal that is separated into a splitter, a mirror, and an analyzer with two grooves. The splitter splits the incident beam into two coherent waves. One of the waves passes through the object while the other one does not. Therefore, after focusing on the analyzer, these two waves form diffraction patterns that show the contrast of the phase shift. In a grating interferometer, a grating is placed downstream of the object and splits the incoming beam into two first-diffraction orders. These two beams interfere with each other and form linear periodic fringe patterns. By inserting a second grating downstream of the first grating at a certain position, the diffraction fringes can be restored from the stepping readouts on the detector of the second grating. In DEI, monochromatic X-rays are reflected by a crystal (monochromator) with an incident angle at the Bragg angle. After transmission through the object, the X-rays are reflected to the detector by a second crystal (analyzer). The analyzer is set parallel to the first one; therefore, the incident angles of the X-rays are slightly off the Bragg angle due to refraction from the object. By tilting the analyzer half of the full width at half maximum (FWHM) of the rocking curve of itself, with the intensities on the detector, the intensity of the refraction can be resolved. Propagation-based imaging requires only the source, object, and detector. The phase information is resolved from the intensity in the detector. All of these methods have their advantages and disadvantages, which are discussed in this review. Many reviews have discussed X-ray phase-contrast imaging [14,15,16,17]. However, none of them discussed almost all phase-contrast image methods. In addition, as several years have passed, the progress and applications of these methods need to be updated. Hence, this review examines most of the reported X-ray phase-contrast imaging techniques, and we also discuss some recent applications.

2. Methods

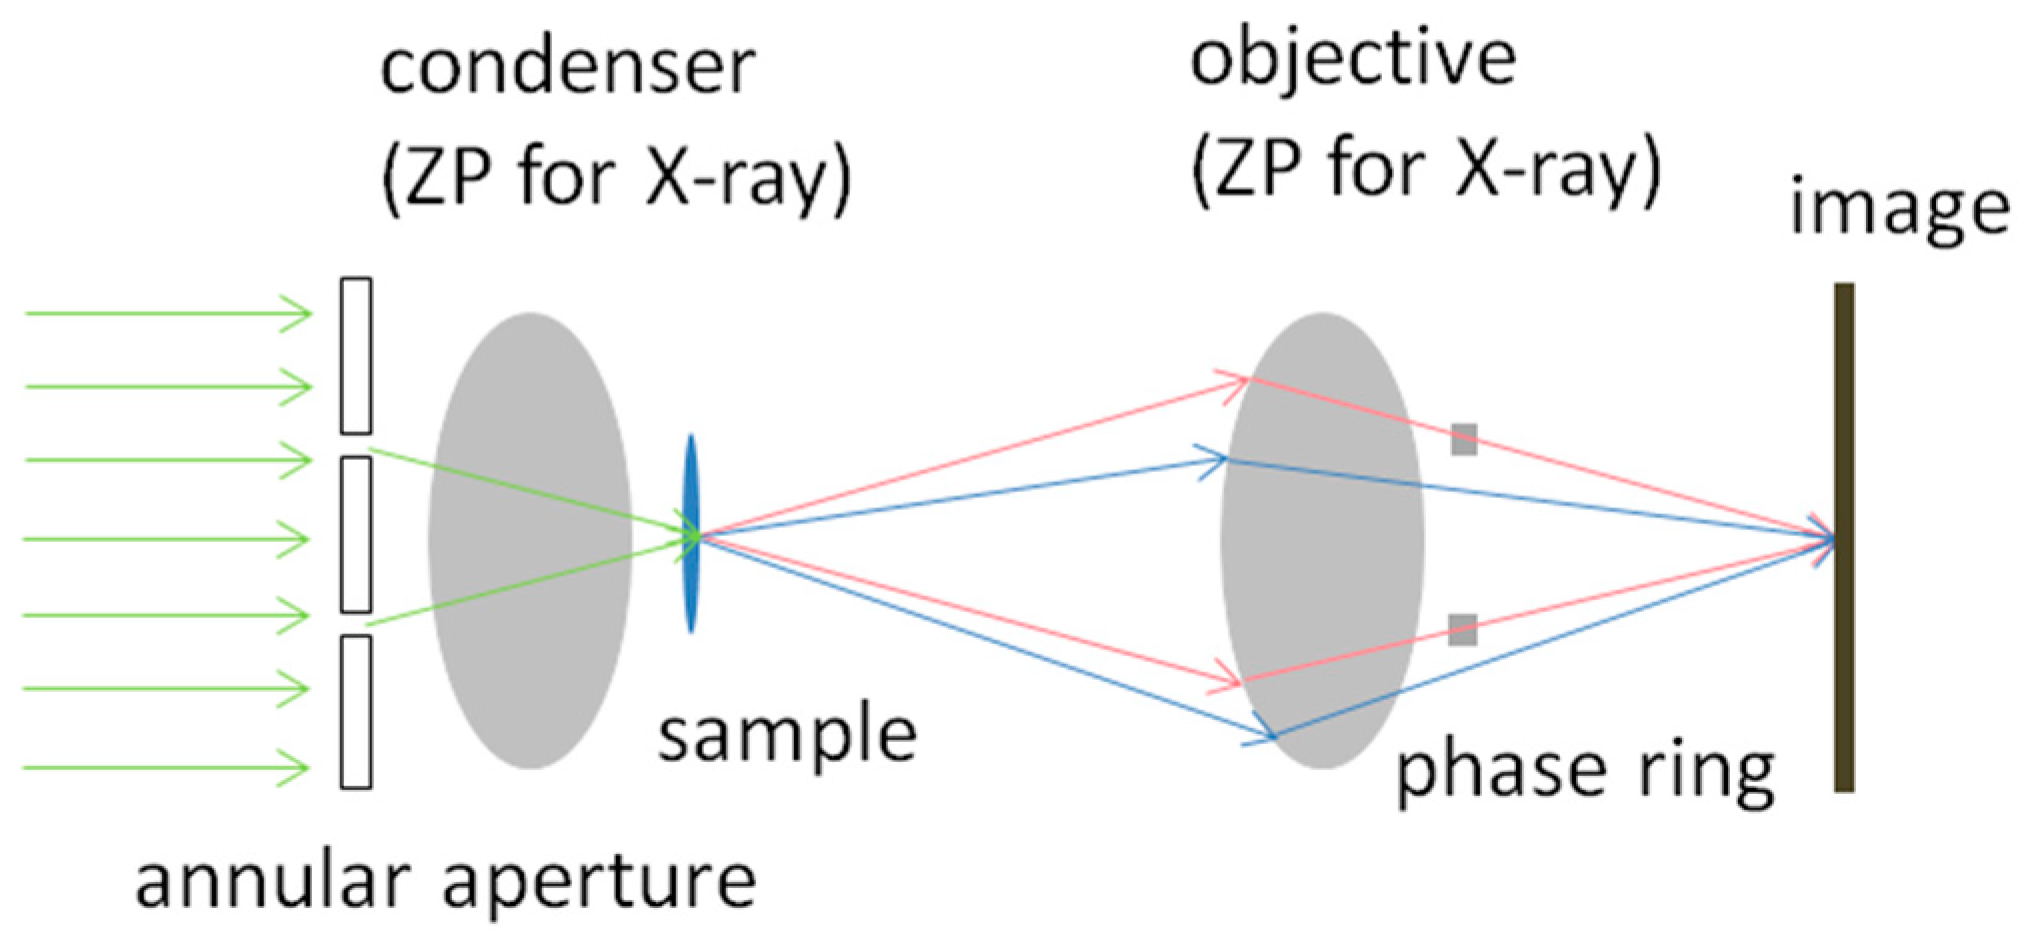
2.1. Zernike’s X-ray Microscopy

Zernike’s X-ray microscopy was first introduced by Zernike in 1942 [3]. A brief review of the principle of Zernike’s phase-contrast microscopy is shown in Figure 1.
Figure 1 shows that after the ring-shaped illuminating (green) light passes through the sample, part of the light is diffracted by the sample, as indicated in blue. The undiffracted light, which is indicated in red, forms the background on the image plane. Typically, diffracted light has a −90° phase shift compared with undiffracted light. Without the phase ring, the interfered waves show intensities similar to the background; thus, the interference patterns in the detector exhibit low imaging contrast, as shown in Figure 2.
If the phase ring is placed to phase-shift the background light by −90°, the undiffracted light constructively interferes with the diffracted light. Then, the contrast of the object on the image plane increases. If the undiffracted light is phase-shifted by 90°, it destructively interferes with the diffracted light. The contrast also increases, as shown in Figure 2.
Zernike’s X-ray microscope was reported in 1994 by Schmahl et al. with a Fresnel zone plate (FZP) [4]. The principle is similar to that of visible light except zone plates replace the condenser and object. Their work was performed using 2.4-nm radiation, resulting in a higher-order contrast and one-sixth of the dose than those in the absorption image with the same signal-to-noise ratio.
As shown in Figure 1, this method requires that the sample is aligned at the focus of the first zone plate. The detector needs to be aligned at the focus of the second zone plate, similar to traditional optical microscopy. Furthermore, the phase ring needs to be aligned with the annular aperture. Unlike other phase-contrast X-ray imaging techniques, Zernike’s phase-contrast microscopy does not require a high-brilliance synchrotron source. It works with a low-brilliance laboratory source. Because this method enhances the contrast of the image with a single shot, Zernike’s phase-contrast microscopy brings less dosage to the object [4].
Kagoshima et al. independently derived the expression for image contrast using this method in the X-ray region [18]. By using new phase zone plates and beamline BL24XU of SPring-8, a 60-nm resolution was achieved. Tkachuk et al. achieved a 50-nm resolution using a copper rotating anode X-ray source [19]. Holzner et al. applied Zernike’s phase-contrast imaging to a scanning X-ray microscope by simply swapping the detector and source plane in a full-field Zernike’s microscope [20].
In 2006, Youn et al. found the halo effect, a bright boundary, at the edge of the object with hard X-ray Zernike microscopy. This effect is well known in optical microscopy [21]. Vartiainen et al. suppressed the halo by applying a beam shaper instead of a condenser [22]. In addition to the halo effect, Zernike’s X-ray phase-contrast microscopy suffers from a lower contrast than the absorption images when used on thick samples. However, new techniques for fabricating the FZP allow for 30-nm resolution capability [23].
Zernike’s X-ray phase-contrast microscopy (ZXPCM) converts phase modulations into amplitude modulations, resulting in sharper absorption images without numerical phase retrieval [3]. It has been widely applied to biological samples. In 2017, Bradley et al. used this method to image cells in polymer scaffolds at a resolution of 150 nm with a commercial source [24]. Their group successfully removed the halo effects by deconvolution with an image filter [24]. In 2017, Falch et al. employed this method with a synchrotron source to image Al-Si microstructures and 2 μm-diameter polystyrene spheres on a membrane. Both experiments showed that ZXPCM delivers a higher contrast than conventional absorption imaging [25]. In 2020, Su et al. discovered the lithium peroxide and pore size distribution in lithium-O2 batteries at different states of charge using this method with a synchrotron source. The images contrasts have been improved so light elements inside the battery and the distribution, thickness, interphases, and pore network of Li2O2 are visualized [26]. In the same year, Longo et al. obtained 3D regions of interest scans from mice tissues with a resolution down to 36 mm with this method using a synchrotron source [27]. Additionally, in 2020, Park et al. skipped the condenser, used a collimated beam to illuminate the sample, and employed a beam stopper to block the zeroth-order harmonic of the objective. This setup successfully enlarged the field of view (FOV) to 400 μm at a resolution below 500 nm [28]. Their experiment was performed with a synchrotron source; it can also be applied to laboratory sources owing to its simplicity [28].
ZXPCM increases the contrast of images with biological samples, but has been limited when applied to thick samples. This method has been widely used in experiments with thin samples and a small field of view.

2.2. X-ray Holography

Holography was introduced by Gabor in 1948 [5]. He coined “holography” from two Greek words “holo”, meaning “entire” or “complete”, and “grafe”, denoting “reading”. Compared with conventional absorption images that only record the intensity of the wave, holograms also contain phase information. Holography was first applied to electronic microscopes with coherent illumination. In holography, the object must be transparent and illuminated by a coherent wave so that the wave scattered by the object (object wave) and unscattered wave (reference wave) form interference patterns on the photographic plate, as shown in Figure 3a. When the photographic plate with interference patterns is illuminated by the reference wave only, it diffracts into the first ±1 order, with the higher orders being negligible. Hence, a virtual image of the object appears at the position of the object with a real image at its conjugate position, as shown in Figure 3b. According to the two differentreference waves, namely, plane waves and point-source illumination, this method is called in-line and Fourier holography.
Although holography was first realized on an electron microscope, electrons are not ideal for holographic imaging because they strongly interact with matter and create large phase shifts during scattering. In contrast, X-rays produce ideal holograms because their interaction with matter is much weaker.
In 2002, Suzuki et al. developed a prism X-ray interferometer [29]. Figure 4 shows that the X-ray deflected by the prism works as the reference wave and interferes with the beam that is refracted by the object.
The main progress in X-ray holography until 2010 was discussed in a review by Chapman et al. [30]. In 2007, Guizar-Sicairos et al. developed holography with extended reference by autocorrelation linear differential operation (HERALDO) on the basis of the work of Podorov [31,32]. In 2010, Gauthier et al. achieved a resolution of 110 nm with an integration time of 20 femtoseconds using extended references [33]. This method takes advantage of the sharp features of an extended reference object. The final image is retrieved by using the directional derivatives of the Fourier transformed hologram [34]. Zhu et al. achieved a resolution of 16 nm using this method in 2010 [35]. More details on the development and capabilities of X-ray holography are discussed in Pfau and Eisebitt’s article [34]. In this article, they revealed the achievement of imaging magnetic nanostructures. A spatial resolution of 10 nm was reached. In 2013, Krenkel et al. implemented a deterministic method for solving the phase problem in hard X-ray in-line holography, which overcame the twin-image problem [36].
In Fourier transform holography (FTH), the image contrast is limited by the reference beam generated by a pinhole aperture. Increasing the pinhole diameter improves the signal but decreases the resolution [37]. In 2014, Geihufe et al. decoupled the spatial resolution from image contrast using a reference beam generated by an FZP [37]. A spatial resolution of 46 nm was achieved.
In 2018, Gorkhover et al. demonstrated high-fidelity imaging based on Fourier holography on free nanosamples with intense femtosecond X-ray pulses. Their method can be extended to a variety of references and samples. A lateral resolution below 20 nm was achieved [38]. In the same year, Vidas et al. imaged the insulator-metao transition in vanadium dioxide with element and polarization specificity using resonant soft X-ray holography. A resolution of 50 nm was achieved [39]. In the same year, Burgos-Parra et al. imaged the [Co/Ni]x4 multilayer magnetic structure within a nanocontact (NC) orthogonal pseudospin valve using HERALDO. The results revealed a structure where the magnetic droplet existed, and the size and spatial position of the droplet was consistent with expectations. A minimum resolution of 32 nm was achieved [40]. Stable paleomagnetic information in meteoritic metal is carried by the “cloudy zone”. In 2020, Blukis et al. imaged the structure of the cloudy zone of the Tazewell IIICD meteorite using X-ray holography. A spatial resolution of 40 nm was achieved [41]. In the same year, Geilhufe et al. demonstrated that a resolution smaller than the source size of the reference beam could be achieved up to the diffraction limit of the hologram with their methods based on numerical postprocessing of the reconstruction [42]. Also in 2020, Turnbull et al. imaged topological magnetic states in the lamellae of a centrosymmetric alloy (Mn1−x Nix)0.65 Ga0.35 (x = 0.5) using X-ray holography. Their results showed the presence of magnetic stripes evolving into single-core magnetic bubbles. A resolution of approximately 20 nm was achieved [43].
In 1996, Tegze and Faigel proposed the X-ray fluorescence holography (XFH) method. The experiment was performed with strontium titanate (SrTiO3) crystal platelets 30 mm in diameter and 0.5 mm thick [44]. There are two types of this method: “normal holography” or “inverse holography”. In the normal mode, an atom in the sample absorbs the incident X-ray and emits a characteristic X-ray. The characteristic X-ray expands as a spherical wave and is scattered by the surrounding atoms. Here, the scattered wave is an object wave, and the unscattered wave is the reference wave. In inverse mode, part of the incident X-ray beam is scattered by the atoms in the sample. The scattered and unscattered waves interfere with each other at the nanoscale. Thereafter, atoms absorb X-rays and emit characteristic X-rays. The intensity of the characteristic X-ray is proportional to the interference field. It operates like a time-inversed normal mode. The XFH method obtains atomic resolution with coherent high-power X-ray sources and has been widely used to determine the distribution, valence states, lattice distortion, and other atomic structures of the atoms in samples [45,46,47,48]. The principles and applications of XFH have been thoroughly discussed by Hayashi and Korecki [49].
This method requires a coherent and high-brightness source that constrains the application on sources other than synchrotron sources or X-ray free-electron lasers. While this method is applicable for material science usage, the high dosage limits its application to living biological samples.

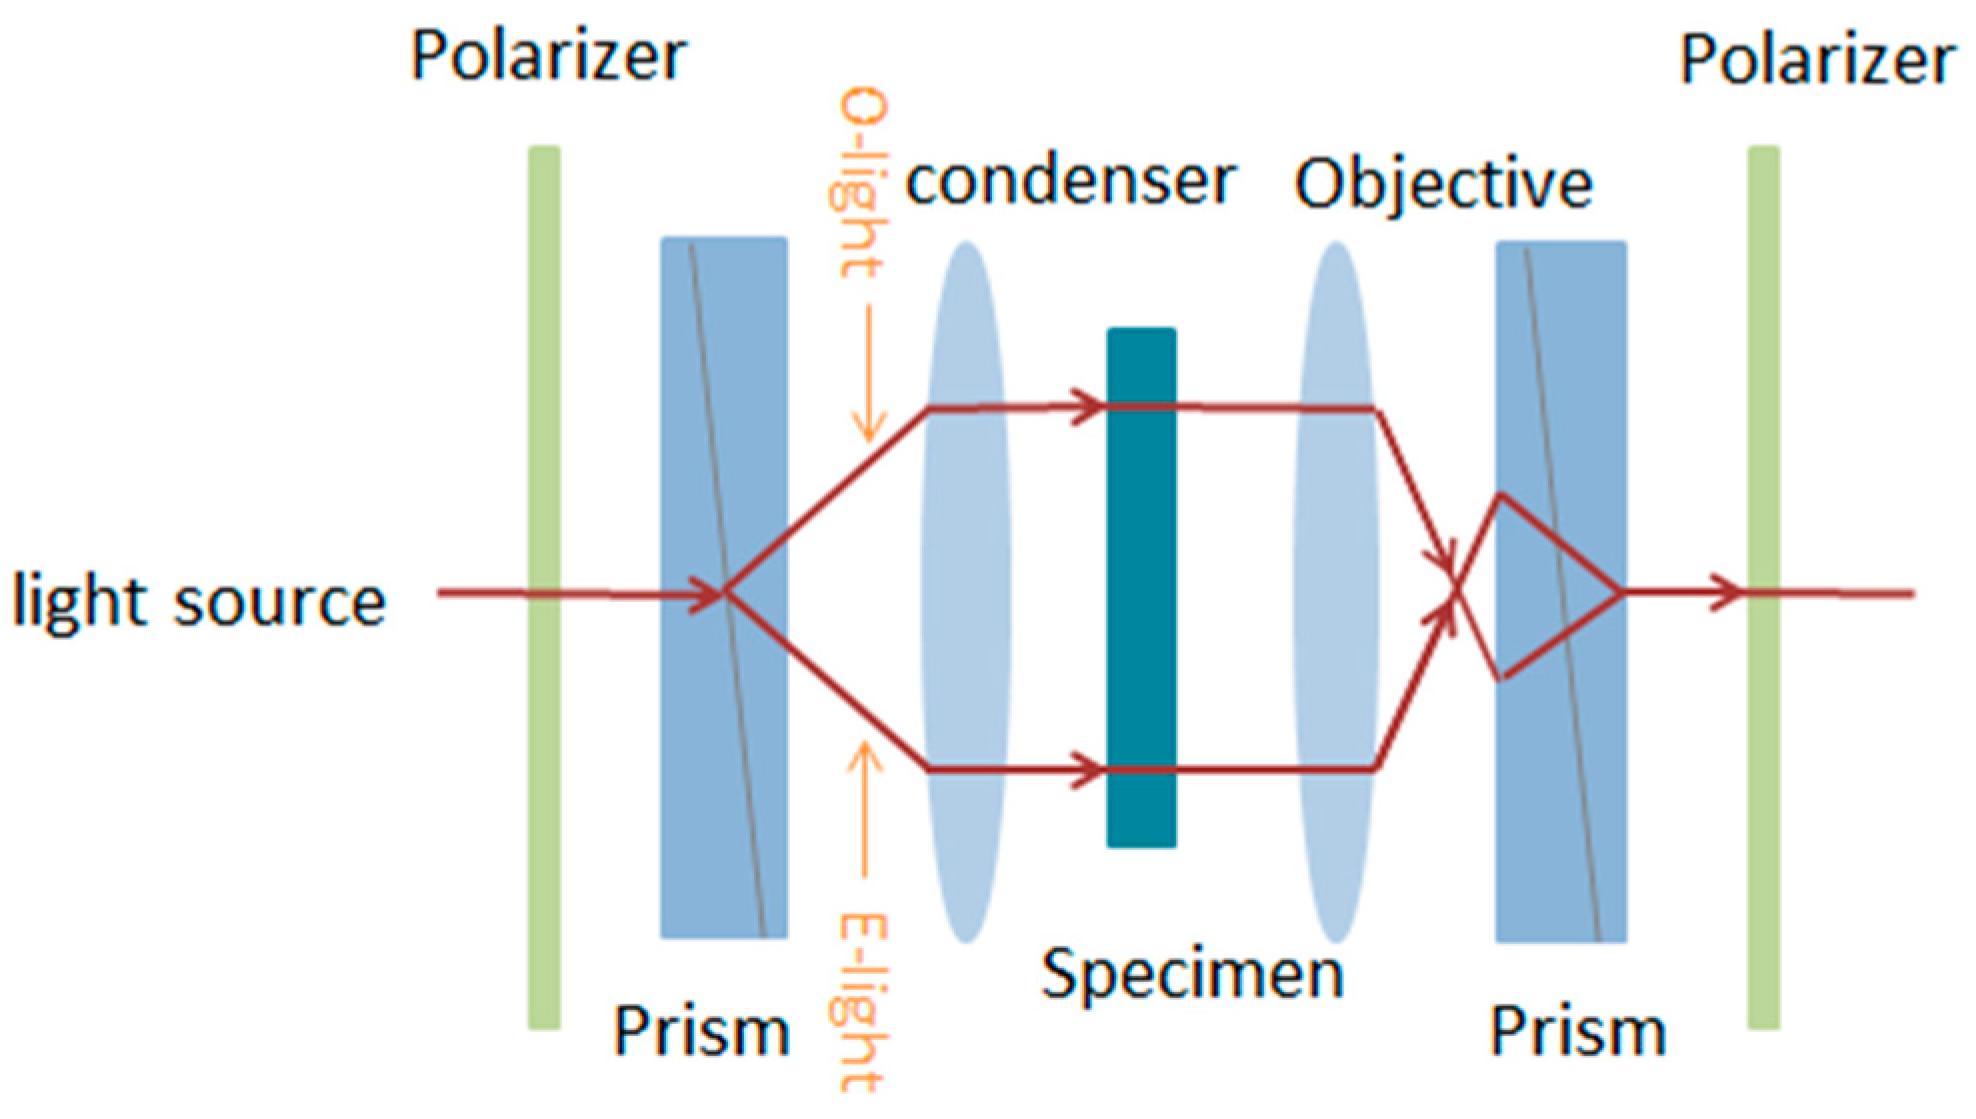
2.3. Differential X-ray Microscopy

Differential interference contrast (DIC) imaging was first introduced into visible-light microscopy by Nomarski [6]. Figure 5 shows that the plane wave produced by the first polarizer is split into ordinary (O) and extraordinary (E) rays by the first prism. The separation of these two beams is smaller than the resolution of the system. Then, the O- and E-lights pass through different areas of the specimen, resulting in different phase shifts. After the objective, the O- and E-lights are recombined by the second prism and form elliptically polarized light because of the different wavefronts. Finally, the light enters the second polarizer, which is orthogonal to the first polarizer and creates DIC imaging.
In 2001, Wilhein et al. achieved X-ray DIC imaging by inserting a pair of zone plates upstream of the sample [7]. These two zone plates were set parallel with the lateral displacement (orthogonal to the optical axis) smaller than the resolution of the system. The distance between these two zone plates along the optical axis was small compared with that between the zone plates and the detector, as shown in Figure 6. The incident plane wave split into a zeroth-order plane wave and higher order spherical waves after the first zone plate (ZP1). These waves then split into zeroth and higher-order harmonics through the second zone plate (ZP2). Only the combinations of the zeroth-order of ZP1 and the first order of ZP2 and vice versa contributed to the image while appropriate apertures blocked the others. These two waves interfered with each other and formed diffraction patterns because of the different wave paths. The presence of a specimen changed the diffraction patterns. Later, in 2002, a 320-nm resolution was achieved by their group [50]. In the same year, Fabrizio et al. introduced DIC imaging into both full-field imaging and scanning X-ray microscopy with a 200-nm resolution with the fabrication of a novel FZP doublet [51]. All these experiments were performed at the European Synchrotron Radiation Facility.
Similar to X-ray holography, the DIC method also requires highly coherent and brilliant sources. That constrains the application of this method to sources other than synchrotron sources, X-ray free-electron lasers, or laboratory sources in the extreme-ultraviolet wavelength region [52]. In 2005, Vogt et al. introduced a liquid-nitrogen jet laser-plasma source at a water window into this method and achieved a resolution of approximately 321 nm [52].
In 2006, Chang et al. combined an overlaid binary grating and a zone plate through a logically exclusive OR operation and directly presented a magnetic phase contribution [53]. In 2007, Bertilson et al. demonstrated this method using a compact soft X-ray microscope. A resolution of 30 nm was achieved [54]. In 2008, Cui et al. separated the amplitude and phase information by applying a structured aperture [55]. In 2012, Xie et al. designed single-optical-element optics for this method based on modified photon sieves (MPSs), providing better resolution than the Fresnel zone plate-based DIC, and higher image contrast than normal photon sieves. A resolution below 45 nm was achieved [56]. In 2015, Zhang et al. proposed differential interference contrast digital in-line holography by using a single optical element to split the incident light into a plane wave and a converging spherical wave. A two-dimensional DIC effect was generated simultaneously. This method is capable of in situ metrology [57]. In 2018, Matsuda et al. demonstrated a DIC method for cells using hard X-ray holography and knife-edge filtering in the spatial frequency domain. Good quality phase-contrast images of polystyrene beads and human HeLa cells were obtained [58].
With the new fabrication technique of FZP, the X-ray DIC method can easily achieve a resolution of tens of nanometers. The invention of the FZP doublet reduces the difficulty of alignment. However, the requirement of coherency and brilliancy limits the application of this method.

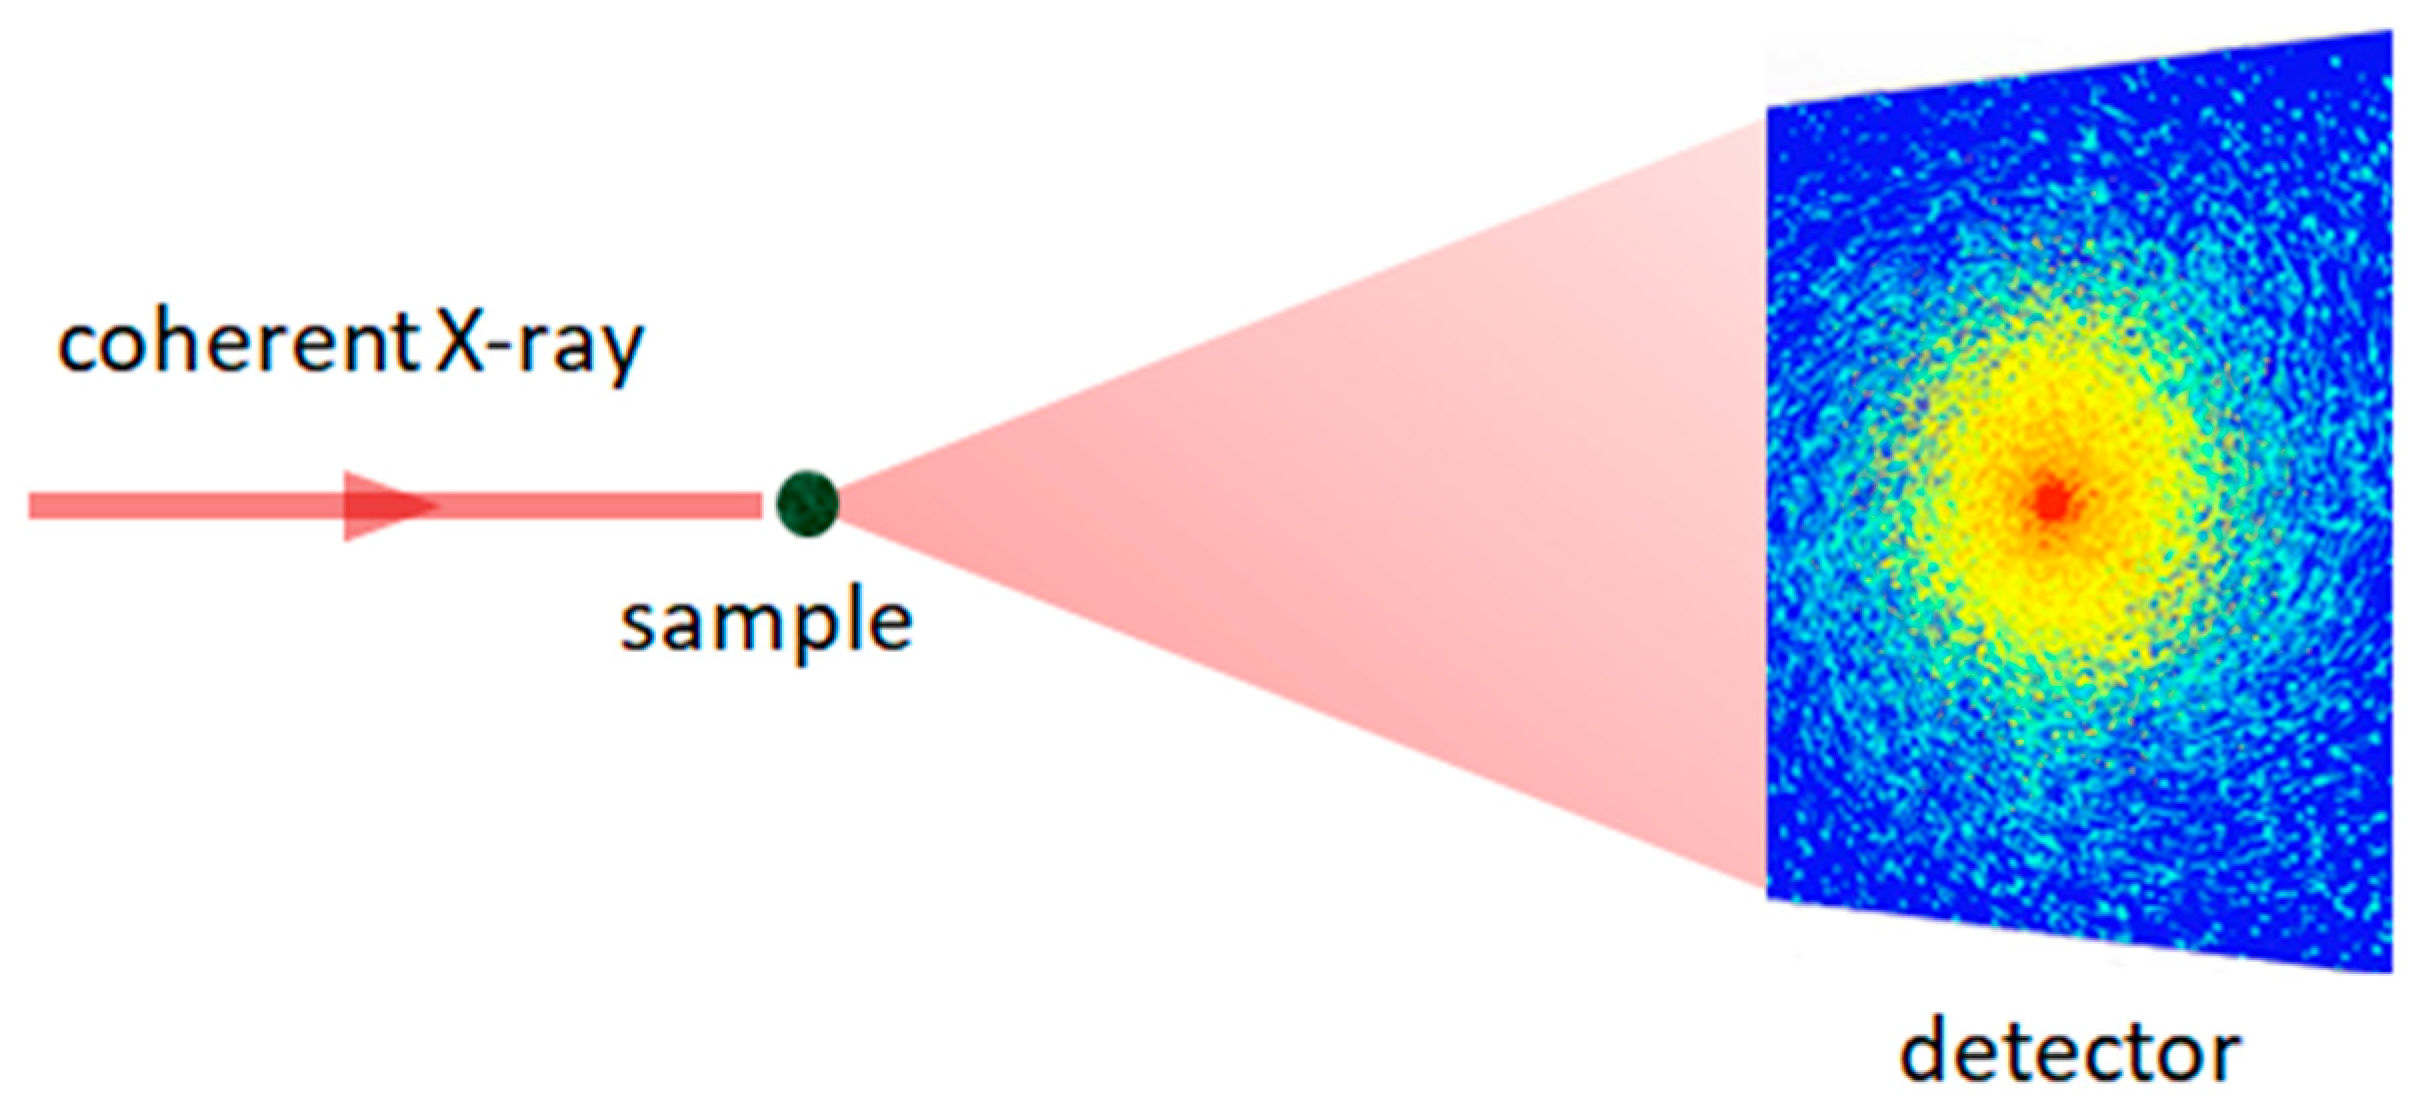
2.4. Coherent Diffraction Imaging

In 1952, Sayre suggested that Shannon’s theorem could be extended to determine the crystal structure by measuring the diffraction intensities at a half-integral of h , which is midway between the Bragg peaks [8]. This lensless method called coherent diffraction imaging (CDI) was then introduced into noncrystalline specimens, and high-resolution phase images were obtained [59]. The progress and applications of the method have been thoroughly discussed in the reviews of Chapman [30] in 2010 and Miao in 2011 [60]. In the present review, we briefly introduce the principle of phase-retrieval algorithms based on the iterative method of Gerchberg and Saxton [61]. We discuss the progress and applications after 2011.
The experimental setup for the CDI method is shown in Figure 7. In the CDI method, after illumination by a coherent X-ray source, the diffraction patterns of an object with transmission function f ( x ) are recorded by the detector as scattered intensities. The Fourier transform is then applied to the scattered intensities for F ( u ) such that the object is synthesized by the inverse Fourier transform of F ( u ) . A random guess of phase φ ( u ) is applied to F ( u ) for the inverse Fourier transform to retrieve the object’s phase. Image f 1 ( x ) is formed. The object has finite support, meaning the outside of the support should be zero. Because the resulting f 1 ( x ) would not be zero outside the support, f 2 ( x ) is set to f 1 ( x ) inside the support and zero outside. Then, F 2 ( u ) is obtained by applying the Fourier transform onto f 2 ( x ) . Since F 2 ( u ) is not equal to the measured scattered intensities, F 2 ( u ) is set to | F ( u ) | exp ( i φ 2 ( u ) ) , and f 2 ( x ) is obtained using its inverse Fourier transform. This procedure is repeated multiple times, as shown in Figure 8.
In 2013, Nam et al. observed fully hydrated and unstained biological specimens and achieved a resolution better than 25 nm using coherent X-ray diffraction microscopy [62]. In the same year, Takahashi analyzed the size distribution and electron density projection of particles with the CDI method using focused hard X-ray free-electron laser pulses [63]. In 2016, Kourousias et al. performed an in situ spatiotemporal study on an electrodeposition process in a sealed wet environment and provided an experimental demonstration of the theoretical prediction of Turing–Hopf electrochemical pattern formation [64]. In 2016, Glownia et al. used the CDI method, which imaged the atomic motion of laser-excited molecular iodine with temporal and spatial resolutions of 30 fs and 0.03 nm, respectively, due to the interference between the nonstationary excitation and stationary initial charge distribution [65]. In the same year, Cha et al. demonstrated a formalism of 3D CDI by scanning the energy of the incident X-ray beam instead of moving the sample, which dramatically improved the temporal resolution of this method [66].
In 2004, Faulkner and Rodenburg presented a new iterative phase-retrieval algorithm called ptychography [67,68]. This method is a combination of scanning transmission X-ray microscopy (STXM) and the CDI method. It measures multiple diffraction patterns by scanning the coherent X-ray probe over an extended specimen instead of illuminating a finite specimen with a spread source in the CDI method. It exploits a convolution between the Fourier transform of a finite illumination function and the diffraction pattern of the object in a Fourier space. The principle, milestone progress, and application of ptychography were thoroughly discussed in a review by Pfeiffer in 2018 [69]. In 2019, Shi et al. discussed applying this method on low-dimensional hard-condensed matter materials [70].
In 2018, Hill et al. characterized the stacking defects and strain in a single InGaAs (indium gallium arsenide) nanowire with coherent nanofocused X-ray using this method. A spatial resolution of 2.6 nm was achieved [71]. In the same year, Wu et al. used spectroptychography to image polymeric perfluorosulfonic acid (PFSA) ionomers in polymer electrolyte membrane fuel cell (PEMFC) cathodes in both and three dimensions. A two-dimensional spatial resolution of 15 nm was achieved [72]. In 2019, Hirose used X-ray spectroptychography to visualize the three-dimensional cerium valence map in Ce2Zr2Ox (x = 7–8) particles. This achievement may permit the chemical imaging of reaction tracking areas at the nanoscale in solid materials [73]. In 2020, the fragmentation behavior of polyolefin catalysts was visualized in 3-D for the first time with this method by Bossers et al. [74]. In the same year, Polo et al. imaged three-dimensional fragments of the petioles of wild type and C4H lignin mutant Arabidopsis thaliana plants using synchrotron cryoptychography. The images revealed the heterogeneity of vessels, parenchyma, and fiber cell wall morphologies, highlighting the relation between disturbed lignin deposition and vessel implosion. A spatial resolution of 134 nm was achieved [75]. Furthermore, Lo et al. demonstrated X-ray linear dichroic ptychography and mapped the c-axis orientations of aragonite crystals [76]. Additionally, in 2020, Yao et al. applied multiple illuminations to the method and successfully received an extended FOV [77].
With high coherency and extremely-focused X-ray sources, X-ray CDI, mainly the ptychography method, has been widely applied in material science, especially crystallography. It can also obtain good contrast with biological samples. However, the high dosage makes this method unsuitable for living samples.

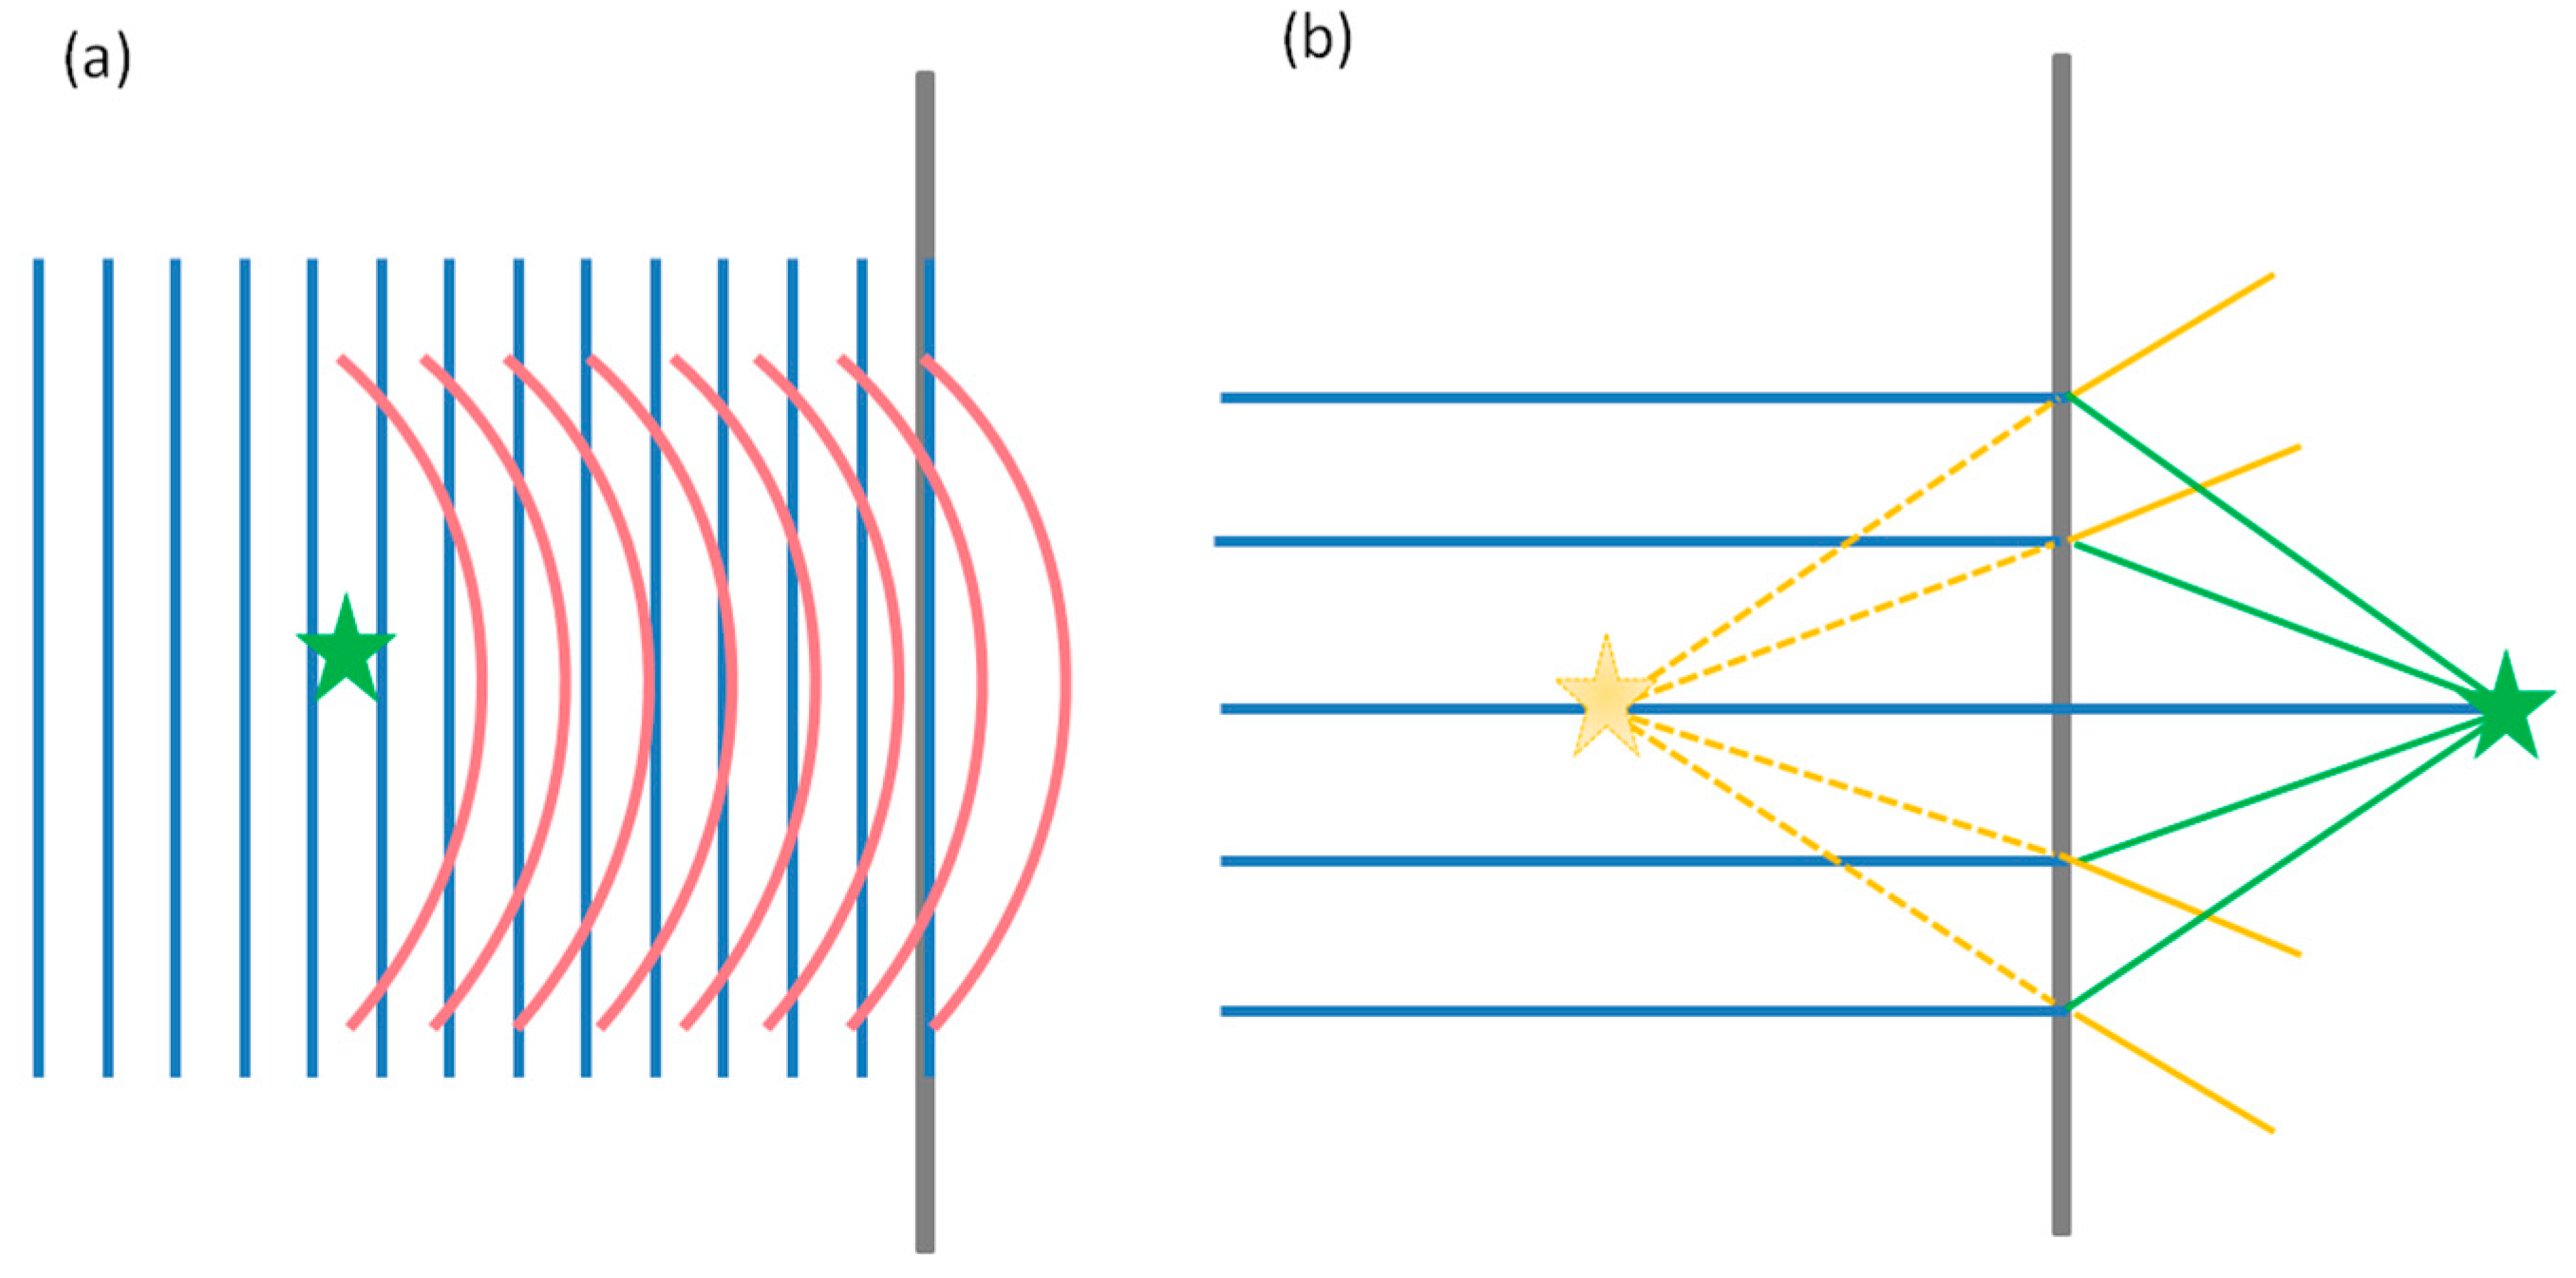
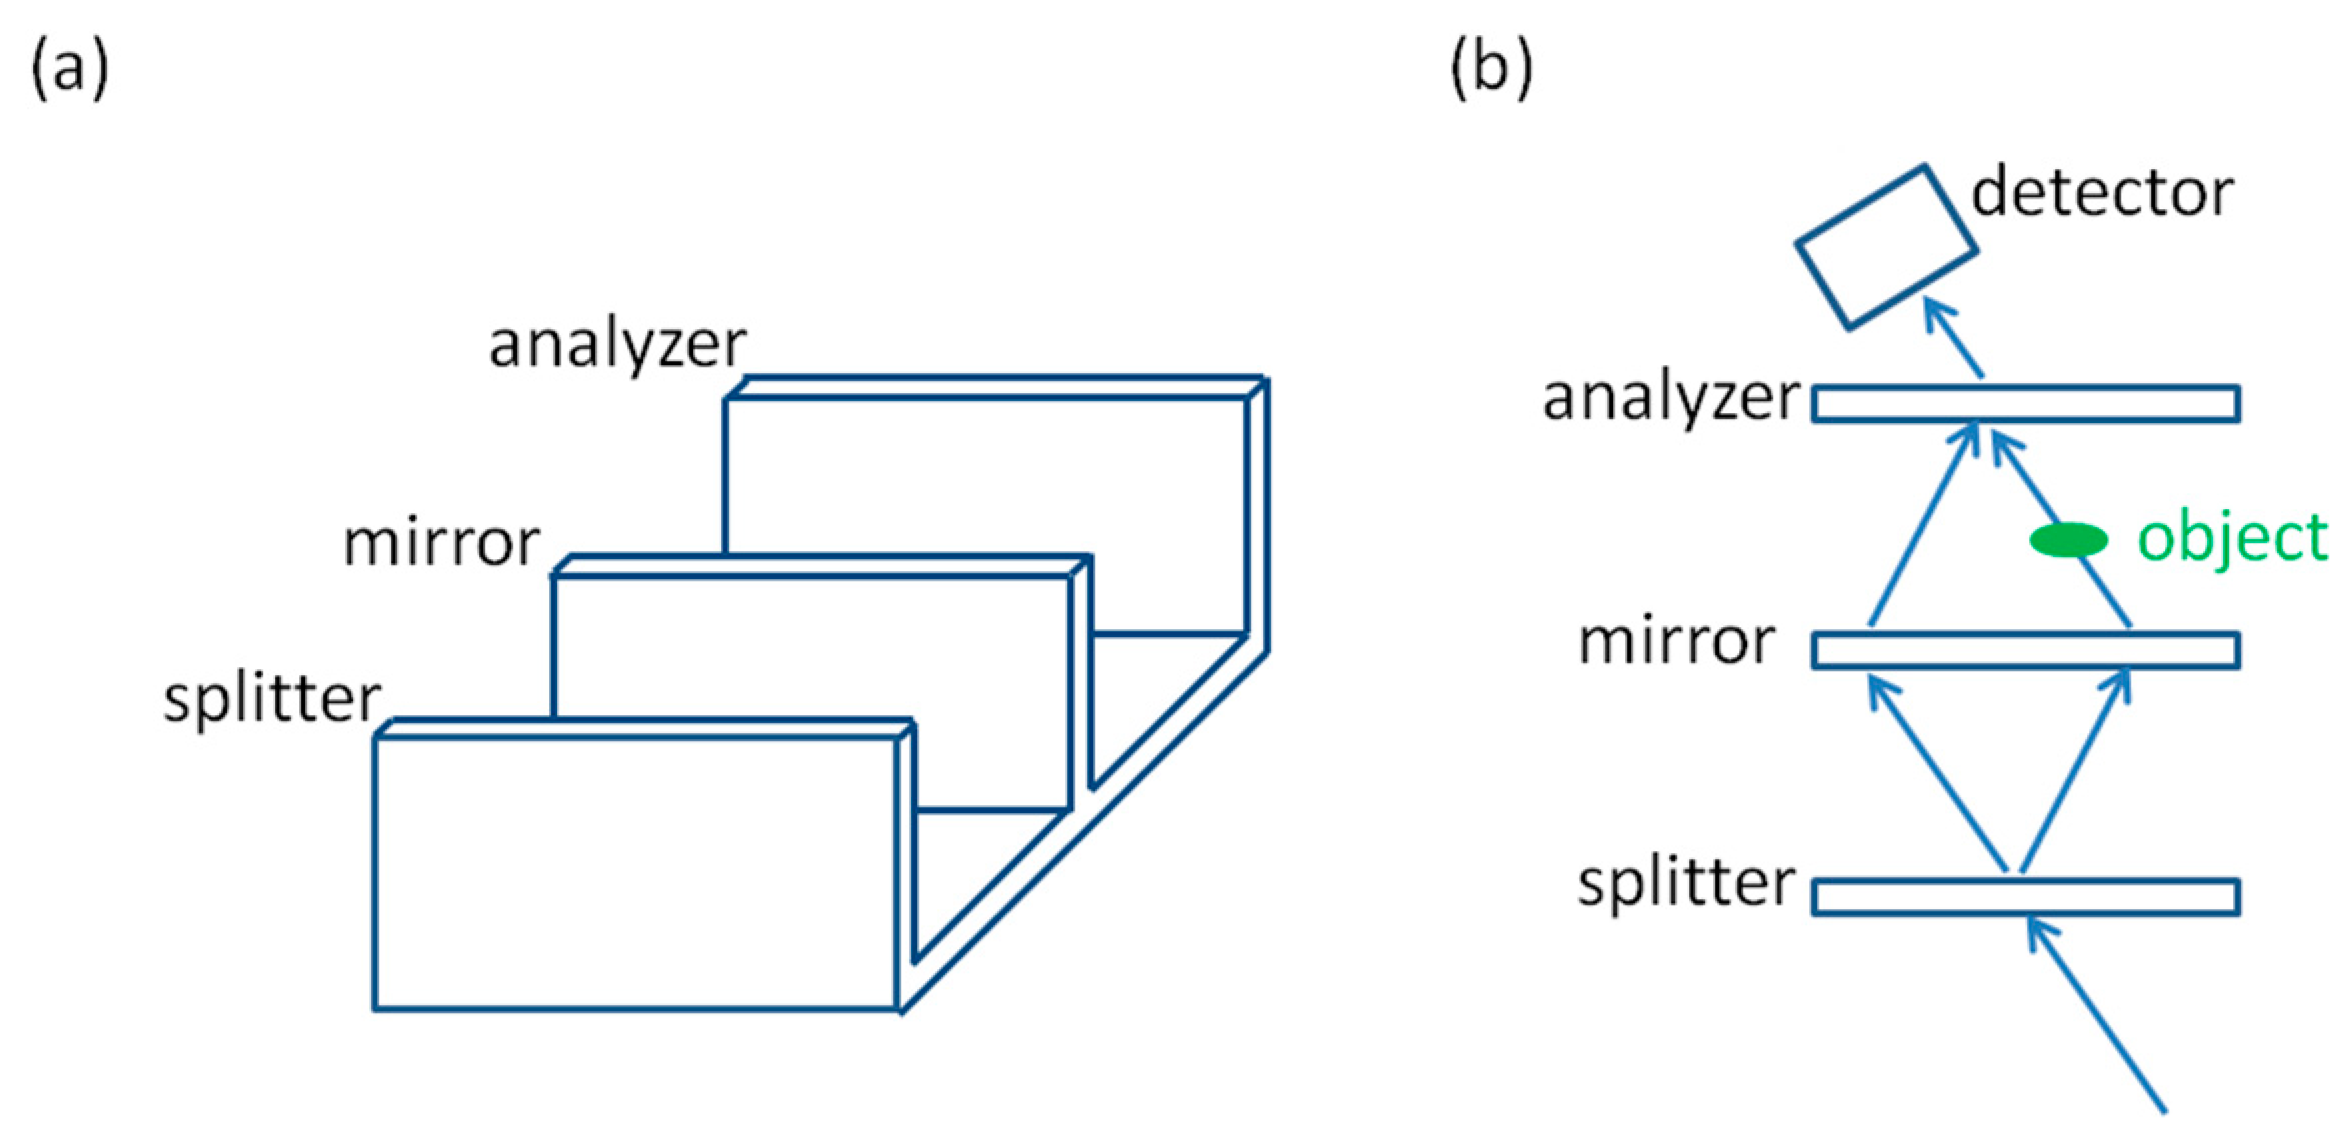
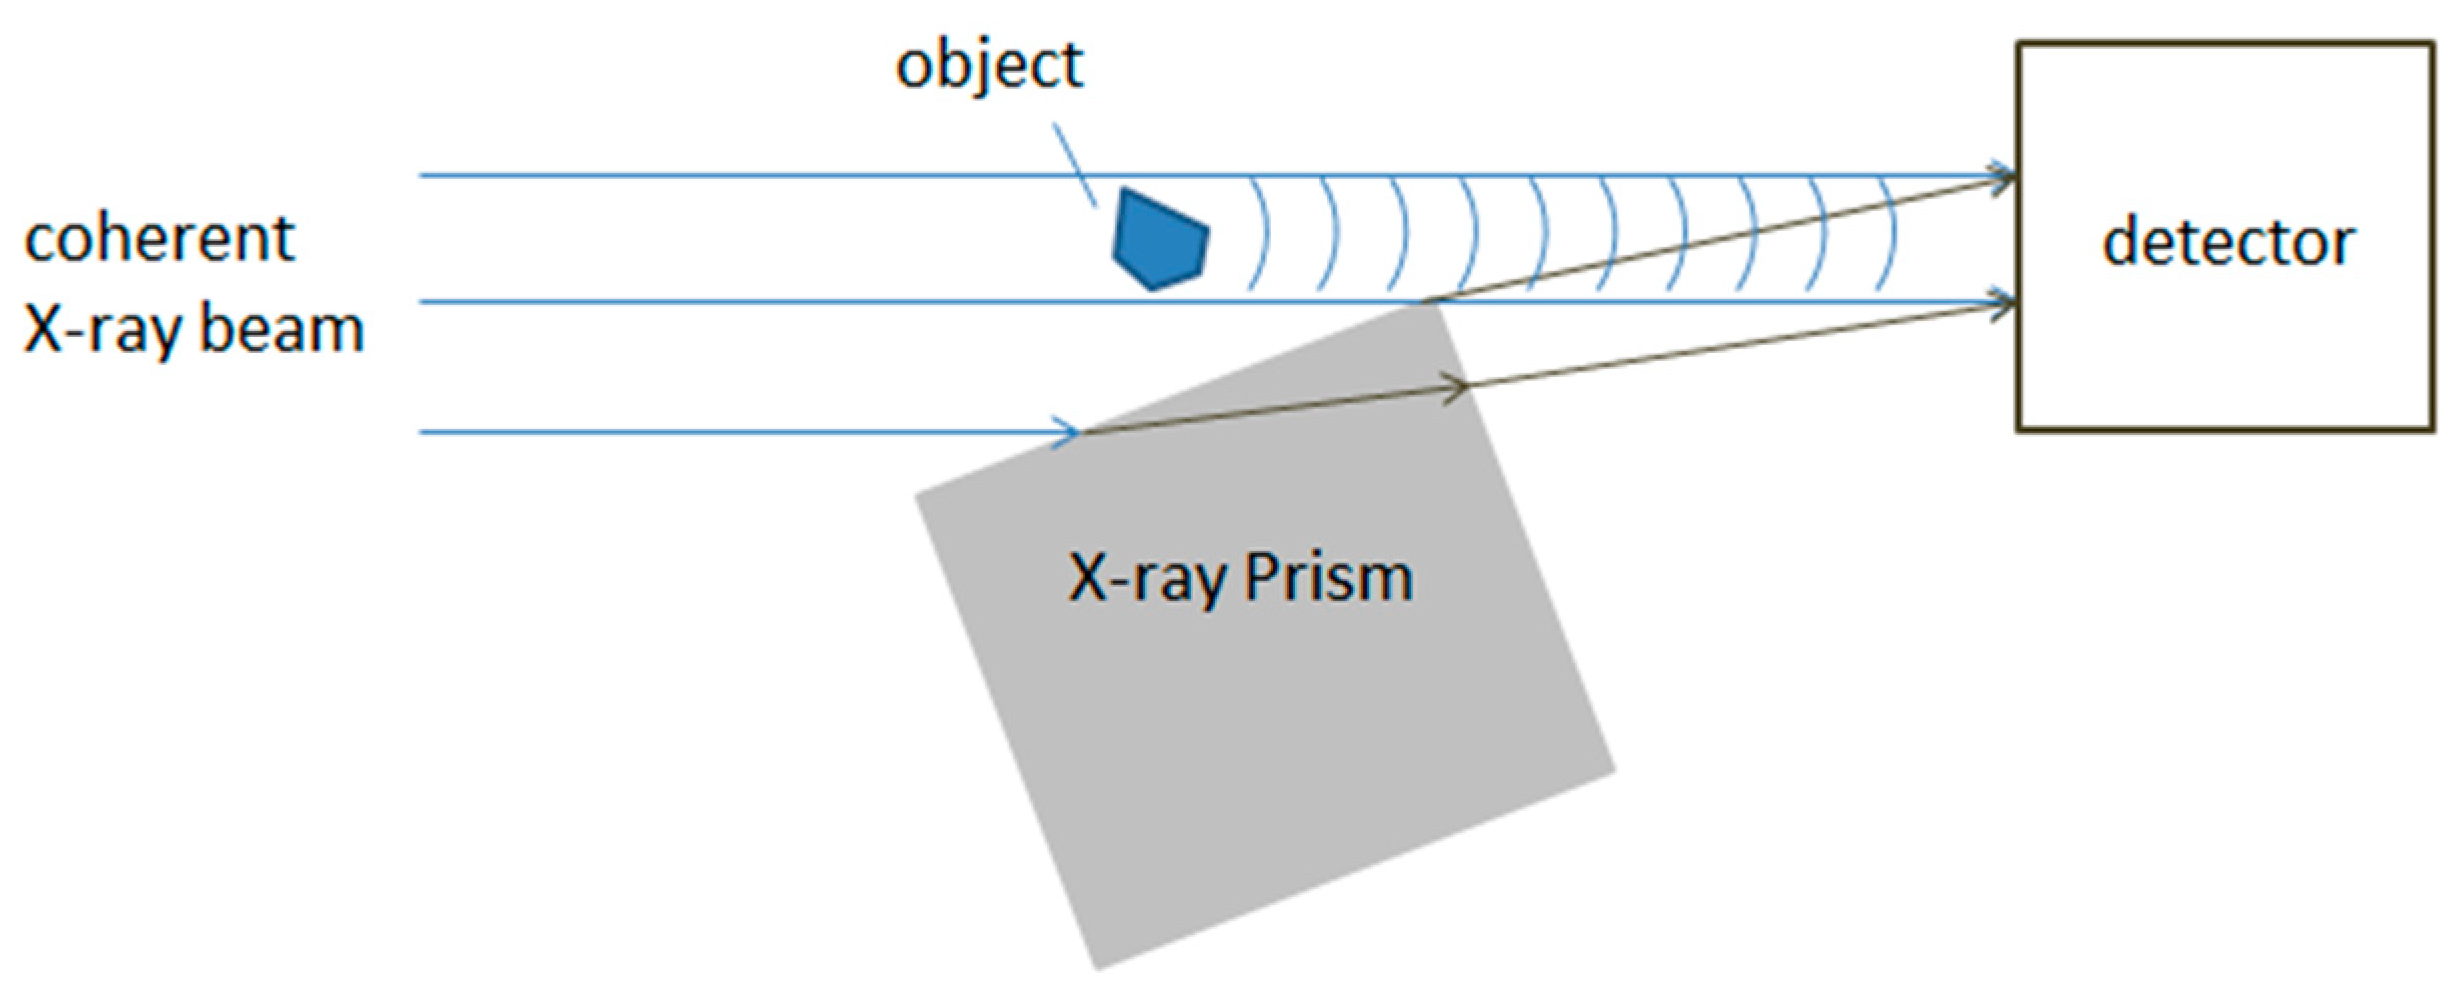
2.5. Crystal Interferometer

In 1965, Bonse and Hart proposed a crystal interferometer that used diffraction patterns to show the difference in the beam paths [9]. Figure 9 suggests that the instrument used in the crystal interferometer was a perfect crystal (silicone, for instance), which had two grooves, so that the crystal was separated into splitter, mirror, and analyzer. The splitter splits the incident monochromatic X-ray beam into two coherent waves. After convergence using the mirror, the two waves formed a diffraction pattern on the analyzer, which showed the difference in the beam paths caused by refraction from the object. Because the entire interferometer was fabricated from an entire crystal, no extra alignment was needed except for setting the incident angle of the X-ray beam under Bragg conditions.
In 1995, Momose and Fukuda obtained high contrast X-ray phase images of a slice of a rat cerebellum, and the phase-retrieval techniques were explained [78]. In 2002, Takeda et al. revealed clear vessels that were larger than 0.03 mm in diameter of the liver from rats and a rabbit using this method, whereas no vessel could be seen in the absorption image and only 0.1-mm-diameter vessels could be seen under almost the same X-ray dose, similar to those in the iodine-loaded acrylic microspheres [79]. In 2003, Yoneyama et al. applied the method with a 60 × 30 mm FOV with a synchrotron source. The visibility of the interference pattern averaged 50%. Phase imaging of rat liver vessels was performed where blood vessels with a diameter of approximately 50 μm could be seen [80]. In 2004, Takeda et al. presented in vivo phase-contrast X-ray computed tomography (CT) images of cancer implanted in nude mice using this method [81]. In 2011, Takeda et al. revealed the portal vein, capillary vessel area, and hepatic vein of live rats using this method [82]. All these experiments were performed with synchrotron sources owing to the requirement for highly coherent incident X-ray beams. In 2013, Yoneyama et al. used this method to obtain an elemental map of an object by calculating the ratio of absorption and phase-contrast images. The results showed that aluminum, iron, nickel, and copper foils were clearly distinguished [83]. In 2014, Mkrtchyan et al. investigated the X-ray optical anisotropy of 5CB type liquid crystals using this method. The values of refractive indices for the specimen were measured [84]. In 2016, Lwin et al. demonstrated crystal interferometer-based phase-contrast CT with brain tumors. The results clearly show the tumor’s various pathological features [85]. In 2018, Yoneyama et al. developed a phase-contrast X-ray laminography using this method. Images of an old flat slab of limestone from the Carnic Alps depicting fusulinids in the Carboniferous period were obtained with 3 mg cm−3 density resolution [86].
In 2002, Momose reviewed the principle and some demonstrations of the method [87]. In 2014, Lider reviewed various configurations of this method [88].
Because the splitter, the mirror, and the analyzer are graved on one crystal, there is no need to align these three instruments. However, this limits the size of the object. If larger samples are illuminated, two or three independent crystals are needed for the splitter, the mirror, and the analyzer [80]. For this, a precise alignment is required to obtain the diffraction pattern. This method provides high visibility and contrast for biological samples, especially when combined with the CT technique.

2.6. Grating Interferometer

Figure 10 shows that in the grating interferometer, the first grating (G1) splits the incoming beam into two first-order diffractions. These two beams diffract downstream of the first grating, interfere with each other, and form linear periodic fringe patterns. The existence of a phase object causes displacement of the fringes. A second grating (G2) with the same periodicity and orientation as the fringes is inserted directly in front of the detector to read the fringes and obtain the refraction of the object. Thus, the fringes can be restored from the stepping readouts on the detector of G2. To transform the phase modulation into intensity modulation with G2, the distance between the first and second gratings is calculated from the Talbot effect. Therefore, this method is also called the “Talbot interferometer”. The origin and development of X-ray grating interferometers until 2013 were thoroughly reported in a review by Pfeiffer [89]; thus, we do not elaborate on this in the current review.
However, this method also demands a highly coherent and high-brightness X-ray source, limiting its application to laboratory sources and commercial uses. In 2006, Pfeiffer et al. introduced another grating G0 into this method as this grating was placed immediately after the X-ray source. The G0 grating creates an array of individually coherent, but mutually incoherent sources. The Talbot effects of these sources overlap with each other on the plane of G2 due to the Lau effect [90], making this method suitable for incoherent and low brightness sources. The X-ray grating interferometer with G0 is also named the “Talbot-Lau interferometer”. The comparably simple alignment of instruments in the experimental setups allows for a large FOV when using the Talbot-Lau interferometer. This method is becoming one of the most popular X-ray phase-contrast images for biological samples.
In 2014, Momose et al. reported a hospital-installed X-ray phase-imaging machine based on a Talbot–Lau-type grating interferometer and successfully depicted the cartilage features in the joints of a human hand [91], as shown in Figure 11.
In 2011, Itoh et al. integrated two-dimensional checkerboard designed gratings into this method. The results clearly showed the soft tissues and cartilage of a chicken wing sample [92]. In 2014, Ge et al. employed a novel designed G2 to avoid the stepping procedure of this method. Both physical phantom and biological samples were imaged. The results provided more information than conventional absorption images and presented better visibilities [93]. This approach decreased the dosage but brought a tradeoff to the resolution. In 2016, Birnbacher et al. performed X-ray Talbot-Lau interferometer CT with a laboratory source and obtained higher sensitivity than any other laboratory X-ray phase-contrast technique. A minimum refraction angle of 17 nrad was achieved [94]. In 2017, Yashiro et al. obtained an X-ray tomogram with an exposure time under 10 ms using this method [95]. In 2018, Gradl et al. demonstrated time-resolved in vivo dark-field imaging of a breath cycle in a mechanically ventilated mouse. A time resolution of 0.1 s was achieved [96]. In 2020, Arboleda et al. performed grating-interferometry-based mammography at a mean glandular dose of 1.6 mGy for a 5-cm-thick, 18%-dense breast, and an FOV of 26 × 21 cm2 [97].
In 2010, Wen and Bennett introduced the mesh-based X-ray phase-imaging method that simultaneously obtained absorption and differential phase-contrast images [98]. This method requires no coherent sources and only simple alignment of a wired metal mesh, as shown in Figure 12.
After the Fourier transformation of the absorption image, the zeroth-order harmonic contains the absorption-image information, and the first-order harmonic contains information on the differential phase-contrast image [99]. Both images can be obtained by windowing these harmonics in a Fourier space and taking their inverse Fourier transform. This method obtains absorption, differential phase contrast, and scattering amplitude images from a single raw image.
In 2012, Morgan et al. developed X-ray phase imaging with sandpaper by replacing the mesh with sandpaper. The results showed some advantages for live imaging in compared to single-exposure X-ray imaging [100].
Wired-mesh-based imaging works with low brightness and noncoherent sources bring a large FOV, and delivers high contrast but low dosage with a rapid single shot. This method is promising not only in biological and life science but also in security screening.

2.7. Diffraction-Enhanced Imaging (DEI)

Diffraction-enhanced imaging (DEI) derived from the contrast from absorption, refraction, and extinction was developed by Chapman et al. in 1997 [30]. As shown in Figure 13, this method is based on two crystals, which is also referred to as analyzer-based imaging.
In this method, monochromatic X-rays are reflected by a crystal with an incident angle Bragg angle to the detector. By using a sample upstream of the crystal, which is usually termed as an analyzer, the incident beam to the analyzer is slightly refracted by the sample by Δ θ Z . In the DEI method, the analyzer is set to θ = ± Δ θ D / 2 , where Δ θ D is the FWHM of the rocking curve. Thus, the intensity of the reflected beam is expressed as
I B = I R R ( θ B ± Δ θ D 2 + Δ θ Z ) ,
where R ( θ ) is the analyzer reflectivity on the rocking curve. Because Δ θ Z is very small, R ( θ 0 + Δ θ Z ) can be expressed as a two-term Taylor series approximation.
R ( θ 0 + Δ θ Z ) = R ( θ 0 ) + d R d θ ( θ 0 ) Δ θ Z
The intensities of the images taken at the low- ( θ L ) and high-angle ( θ R ) sides of the FWHM of the rocking curve are expressed as
I L = I R ( R ( θ L ) + d R d θ ( θ L ) Δ θ Z )
I H = I R ( R ( θ H ) + d R d θ ( θ H ) Δ θ Z )
By solving these equations, the results are presented as follows:
I R = I L ( d R d θ ) ( θ H ) I H ( d R d θ ) ( θ L ) R ( θ L ) ( d R d θ ) ( θ H ) R ( θ H ) ( d R d θ ) ( θ L )
Δ θ Z = I H R ( θ L ) I L R ( θ H ) I L ( d R d θ ) ( θ H ) I H ( d R d θ ) ( θ L )
In 2000, Pisano et al. applied this method to breast cancer specimens with a synchrotron source. Six out of seven cases showed enhanced visibility compared to digital radiology [101]. In 2000, Dilmanian et al. implemented the DEI method in CT [102]. In 2002, Mollenhauer et al. used this method to image articular cartilage based on a synchrotron source. Both disarticulated and intact joints were visualized through their experiments. Gross cartilage defects, even at the early stages of development, could be visualized. A spatial resolution of 100 μm was achieved [103]. In 2003, Oltulu et al. applied a more general method to independently determine the refraction, absorption, and extinction of an object [104]. In 2007, Kelly et al. performed this method with a porcine eye as a sample based on a synchrotron source. The results clearly showed the cornea, iris, lens, retina, optic nerve, choroidal vasculature, and the ampullae of the vortex veins. A spatial resolution of approximately 100 μm was achieved [105]. In 2009, Kao et al. applied the DEI method in CT mode to human cancerous breast tissues yielding 14, 5, and 7 times higher CT numbers and 10, 9, and 6 times higher signal-to-noise ratios (SNRs) compared to conventional CT for masses, calcifications and spiculations, respectively. The DEI-CT mode yields a better SNR than conventional CT, even at ten times lower doses. This experiment was performed with a synchrotron source at a photon energy of 52 keV, which is similar to the K α lines of a tungsten anode X-ray tube, showcasing the potential of DEI-CT application using laboratory sources [106]. Several researchers applied this method using laboratory sources in 2009 [107,108,109,110]. In 2014, Zhou et al. applied this method on a microfocus X-ray source [111]. In 2020, Ando et al. improved the resolution by approximately a factor of 2 in analyzer-based imaging by cutting the monochromator collimator and thinning the Laue angle analyzer [112]. The DEI method has been widely used for biological samples based on synchrotron and laboratory sources [107,113,114,115,116,117,118,119,120].
In the field of material science, Mizuno et al. applied the DEI method to obtain high-contrast images to observe hydrides in titanium, which was invisible in conventional X-ray absorption imaging in 2005 [121]. In 2007, the same authors applied the DEI method to a quantitative study of hydrogen diffusion in titanium-hydride. The diffusivity and activation energy of hydrogen diffusion was observed directly [122].
The DEI method is suitable for imaging light-element materials. It has been widely used in material, biological, and life sciences owing to its high contrast and low dosage. The FOV is limited by the size of the crystals. This method demands collimation (at least in one direction perpendicular to the optical axis to satisfy the incident Bragg angle to the crystal) and monochromatic radiation. That requires extremely high brightness sources. With the invention of high brightness micro-focus X-ray tubes, this method is now capable of laboratory sources.

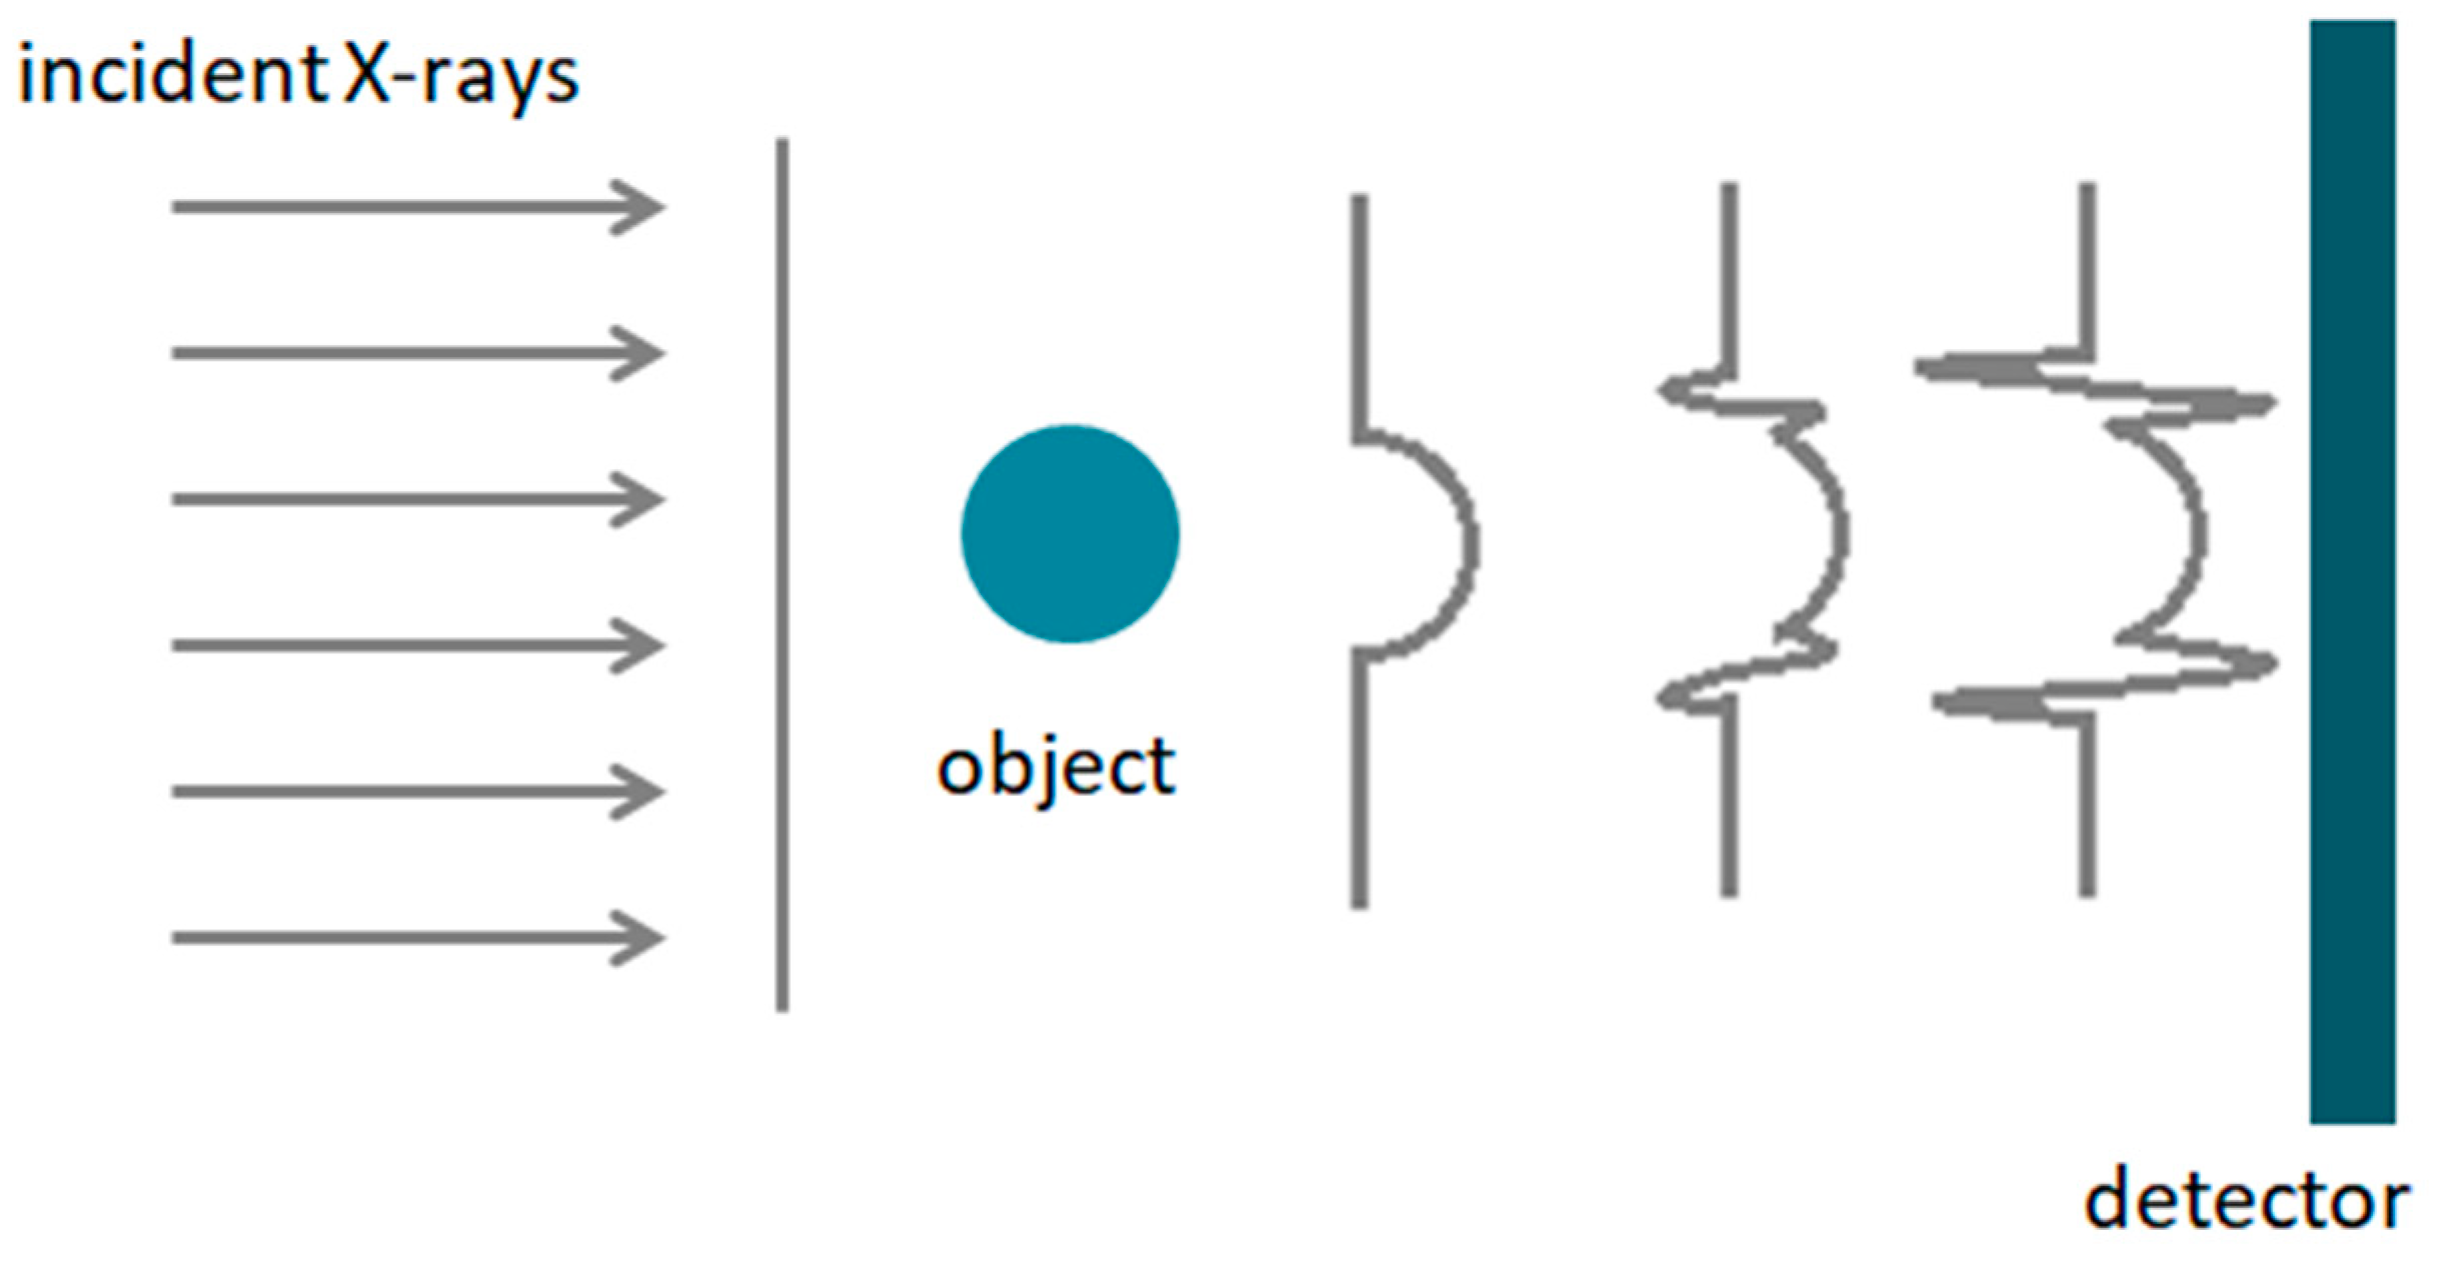
2.8. Propagation-Based Imaging

In 1995, Snigirev et al. developed a propagation-based X-ray imaging (PBI) method [13]. This method requires only the source, object, and detector and no other equipment, as shown in Figure 14.
The intensity of the detector can be expressed as follows:
I P B I = M 2 I 0 T ( 1 λ d 2 π 2 ϕ ) ,
where M = ( r + l ) / l and l are the magnification factor and source-to-sample distance, respectively. I 0 is the intensity of the object. T = e x p ( d z μ o b j ) is the object transmission, where μ is the linear attenuation coefficient of the object. d = r / M is the defocusing distance, and ϕ is the phase shift introduced by the object. The propagation-based imaging (PBI) method provides edge enhancement on the detector [16].
In 2012, Diemoz et al. theoretically compared PBI, analyzer-based imaging (also called the DEI method), and grating interferometry (GI). The signal-to-noise ratio, the figure of merit and spatial resolution were evaluated and compared. The results could be used to assess whether a method is suitable for a given application [16]. In 2014, Lang et al. compared PBI and GI methods on cancerous tissue and the entire heart of a mouse experimentally. The results showed that the PBI method had approximately twice the spatial resolution compared to the GI method. However, the GI method yielded a much higher contrast-to-noise ratio than the PBI method [123]. In 2018, Preissner et al. obtained in vivo dynamic CT of the lungs in small animals. A spatial resolution of slightly below 50 μm at imaging rates of 30 Hz was achieved [124]. In 2019, Kalasová et al. summarized a method to evaluate the capability of a laboratory system for propagation-based imaging in CT mode. The evaluation was based on three criteria: imaging regime, degree of coherency, and lack of geometrical sharpness, which helped determine if a system is suitable for PBI-CT [125]. In the same year, Longo et al. performed breast CT with monochromatic beam with this method at the Elettra synchrotron source. The doses and scan times were clinically acceptable [126].
This method requires high brightness sources. Therefore, synchrotron sources provide the best results under this method. However, commercial sources can be used owing to the lower coherency requirement compared to interferometry methods [127]. The PBI method requires no instruments other than the X-ray source and the detector. It has been widely used in medicine and biological sciences [128,129,130,131].

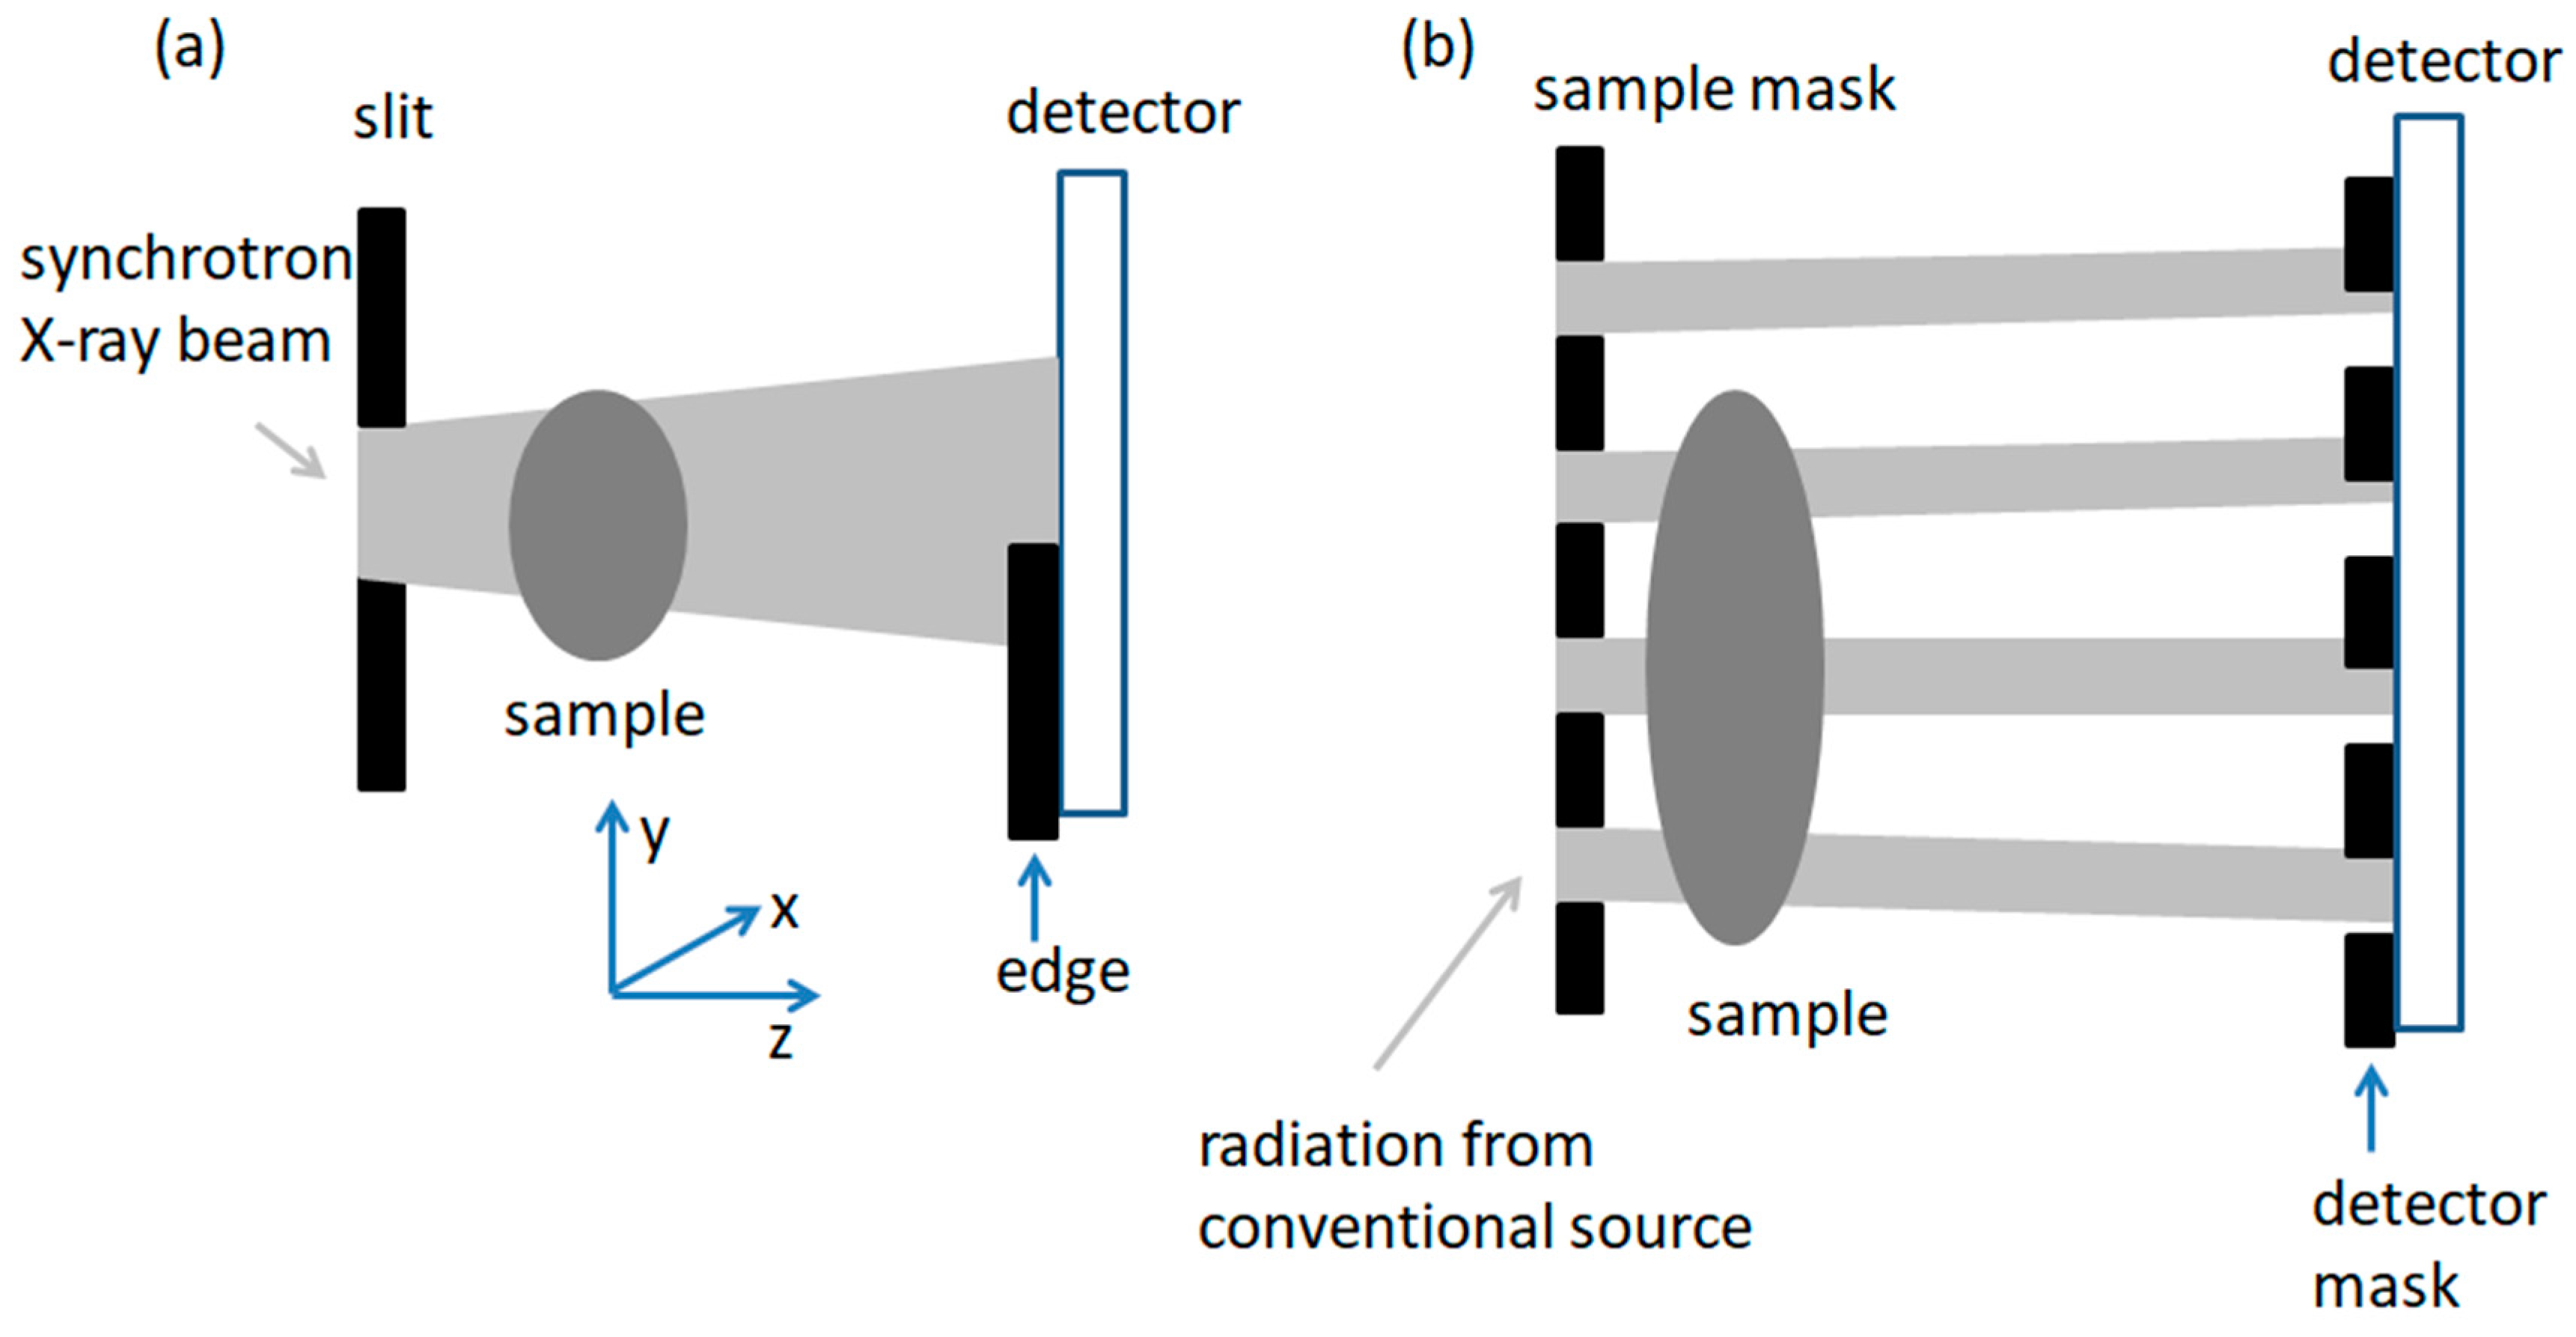
2.9. Edge Illumination (EI)

Edge illumination X-ray phase-contrast imaging was proposed by Olivo et al. in 2001 [132]. In this method, the incoming X-ray beam is collimated into one direction by a slit usually sized from a few to several tens of microns, and is aligned with an opaque edge placed right in front of the detector. As shown in Figure 15a, part of the X-ray beam is blocked by the edge after being refracted by the object, and the rest hits the detector. The position of the X-ray beam on the detector shifts owing to refraction from the sample, causing an intensity change in the detector. If the beam penetrates the sample, an image showing a mixture of absorption and refraction contrasts is obtained [133,134,135,136,137]. This method can also be applied to conventional X-ray sources if appropriate masks with multiple apertures are employed, as shown in Figure 15b.
This method was first demonstrated with a synchrotron source and was later performed with incoherent conventional laboratory sources [138]. The angular sensitivity of this method has been studied as a function of the experimental parameters and source intensity for synchrotron [134] and laboratory [135] sources. In 2012, Marenzana et al. demonstrated that this method visualized the cartilage layer in slices of an excised rat tibia and correctly detected surgically induced lesions [139]. In 2014, Diemoz et al. studied the spatial resolution of this method based on various experimental parameters [136]. The CT mode of EI was discussed and performed with a synchrotron source in the same year [140]. Nylon, PEEK (polyether ether ketone), PBT (polybutylene terephthalate), sapphire, titanium wires and coronal slices from a domestic wasp were imaged. In 2016, Modregger et al. obtained an angular-resolved small-angle X-ray scattering distribution with this method based on an X-ray tube. Absorption, differential phase, and scatter images were obtained with improved contrast, allowing for pulmonary emphysema diagnosis in a murine model [141]. In 2019, Havariyoun et al. performed this method in two- and three-dimensional modes (planar image and CT). Both the PMMA (polymethylmethacrylate) phantom and human breast tissue were imaged. The results showed that a more compact system provides a higher contrast-to-noise ratio (CNS), making it possible for this method to be applied to in situ surgeries [142]. The advances of this method were discussed by Zamir et al. in 2017 [137].
This method provides higher contrast and better angular-resolution for low-Z materials such as human tissue. Because the sample mask blocks part of the X-ray beam, there is comparatively less dosage with this method. It has huge potential in medical science.

3. Summary

In this article, we reviewed X-ray phase imaging methods and their progress. We are quite excited that many of these methods are now used commercially, especially Zernike’s X-ray microscopy, grating-based interferometer, and propagation-based imaging. The fabrication techniques of the zone plate, gratings, and microfocused X-ray tubes allow for the commercial application of these methods. Crystal interferometry has also been used to detect biological samples. The need for coherence of the source limits its clinical applications. Among these methods, Zernike’s X-ray microscope and X-ray holography provide phase-contrast images. The other methods provide phase-retrieved images. For researchers, it is convenient to select a method based on their experimental conditions and the purpose of their research. New researchers can get started quickly with the information provided, knowing what is required to build a system. Experienced researchers may find improvements and new applications that they can demonstrate.
In addition to the review papers mentioned above, Zhou and Brahme reviewed the development of phase-contrast X-ray imaging techniques and their potential medical applications [14]. Keyriläinen et al. discussed the application of X-ray phase-contrast imaging of the breast [15]. Mayo et al. reviewed the applications of in-line phase-contrast X-ray imaging in material science [128]. In these reviews, especially our review, details of each method, differences among the methods, and potential applications are discussed. This may provide inspiration for further research. Every step forward in these methods, and the efforts of the researchers, are depicted. Although these methods still suffer from limitations, we believe that the untiring endeavors of scientists in the future continue to enhance X-ray phase imaging in many areas.

Author Contributions

S.T.: Writing—review & editing, Investigation; C.H.: Writing—original draft; X.H.: Writing—review & editing; C.K.: Supervision; X.L.: Funding acquisition. All authors have read and agreed to the published version of the manuscript.

Funding

Fundamental Research Funds for the Central Universities (2019XZZX003-06 and K20200132).

Institutional Review Board Statement

Not applicable.

Informed Consent Statement

Not applicable.

Data Availability Statement

Data sharing not applicable.

Conflicts of Interest

The authors declare no conflict of interest.

References

  1. Momose, A. Recent Advances in X-ray phase imaging. Jpn. J. Appl. Phys. 2005, 44, 6355–6367. [Google Scholar] [CrossRef]
  2. Momose, A. Development toward high-resolution X-ray phase imaging. QJM Int. J. Med. 2017, 66, 155–166. [Google Scholar] [CrossRef]
  3. Zernike, F. Phase contrast, a new method for the microscopic observation of transparent objects part II. Physica 1942, 9, 974–986. [Google Scholar] [CrossRef]
  4. Schmahl, G.; Rudolph, D.; Schneider, G.; Guttmann, P.; Niemann, B. Phase contrast X-ray microscopy studies. Optik 1994, 97, 181–182. [Google Scholar]
  5. Gabor, D. A new microscopic principle. Nat. Cell Biol. 1948, 161, 777–778. [Google Scholar] [CrossRef]
  6. Allen, R.D.; David, G.B.; Nomarski, G. The Zeiss-Nomarski differential interference equipment for transmitted-light microscopy. Z. Wiss. Mikrosk. Mikrosk. Tech. 1969, 69, 193–221. [Google Scholar]
  7. Wilhein, T.; Kaulich, B.; Di Fabrizio, E.; Romanato, F.; Cabrini, S.; Susini, J. Differential interference contrast X-ray microscopy with submicron resolution. Appl. Phys. Lett. 2001, 78, 2082–2084. [Google Scholar] [CrossRef] [Green Version]
  8. Sayre, D. Some implications of a theorem due to Shannon. Acta Crystallogr. 1952, 5, 843. [Google Scholar] [CrossRef] [Green Version]
  9. Bonse, U.; Hart, M. An X-ray interferometer. Appl. Phys. Lett. 1965, 6, 155–156. [Google Scholar] [CrossRef]
  10. Momose, A.; Kawamoto, S.; Koyama, I.; Hamaishi, Y.; Takai, K.; Suzuki, Y. Demonstration of X-Ray talbot interferometry. Jpn. J. Appl. Phys. 2003, 42, L866–L868. [Google Scholar] [CrossRef]
  11. Weitkamp, T.; Diaz, A.; David, C.; Pfeiffer, F.; Stampanoni, M.; Cloetens, P.; Ziegler, E. X-ray phase imaging with a grating interferometer. Opt. Express 2005, 13, 6296–6304. [Google Scholar] [CrossRef]
  12. Chapman, D.; Thomlinson, W.; E Johnston, R.; Washburn, D.; Pisano, E.; Gmür, N.; Zhong, Z.; Menk, R.; Arfelli, F.; Sayers, D. Diffraction enhanced X-ray imaging. Phys. Med. Biol. 1997, 42, 2015–2025. [Google Scholar] [CrossRef] [Green Version]
  13. Snigirev, A.; Snigireva, I.; Kohn, V.G.; Kuznetsov, S.; A Schelokov, I. On the possibilities of x-ray phase contrast microimaging by coherent high-energy synchrotron radiation. Rev. Sci. Instrum. 1995, 66, 5486–5492. [Google Scholar] [CrossRef]
  14. Zhou, S.-A.; Brahme, A. Development of phase-contrast X-ray imaging techniques and potential medical applications. Phys. Med. 2008, 24, 129–148. [Google Scholar] [CrossRef]
  15. Keyriläinen, J.; Bravin, A.; Fernandez, M.; Tenhunen, M.; Virkkunen, P.; Suortti, P. Phase-contrast X-ray imaging of breast. Acta Radiol. 2010, 51, 866–884. [Google Scholar] [CrossRef]
  16. Diemoz, P.C.; Bravin, A.; Coan, P. Theoretical comparison of three X-ray phase-contrast imaging techniques: Propagation-based imaging, analyzer-based imaging and grating interferometry. Opt. Express 2012, 20, 2789–2805. [Google Scholar] [CrossRef] [Green Version]
  17. Bravin, A.; Coan, P.; Suortti, P. X-ray phase-contrast imaging: From pre-clinical applications towards clinics. Phys. Med. Biol. 2012, 58, R1–R35. [Google Scholar] [CrossRef] [PubMed]
  18. Kagoshima, Y.; Yokoyama, Y.; Niimi, T.; Koyama, T.; Tsusaka, Y.; Matsui, J.; Takai, K. Hard X-ray phase-contrast microscope for observing transparent specimens. J. Phys. Colloq. 2003, 104, 49–52. [Google Scholar] [CrossRef]
  19. Tkachuk, A.; Duewer, F.; Cui, H.; Feser, M.; Wang, S.; Yun, W. X-ray computed tomography in Zernike phase contrast mode at 8 keV with 50-nm resolution using Cu rotating anode X-ray source. Z. Krist. Cryst. Mater. 2007, 222, 650–655. [Google Scholar] [CrossRef]
  20. Holzner, C.; Feser, M.; Vogt, S.; Hornberger, B.; Baines, S.B.; Jacobsen, C. Zernike phase contrast in scanning microscopy with X-rays. Nat. Phys. 2010, 6, 883–887. [Google Scholar] [CrossRef] [Green Version]
  21. Youn, H.S.; Jung, S.W. Hard X-ray microscopy with Zernike phase contrast. J. Microsc. 2006, 223, 53–56. [Google Scholar] [CrossRef] [PubMed]
  22. Vartiainen, I.; Mokso, R.; Stampanoni, M.; David, C. Halo suppression in full-field x-ray Zernike phase contrast microscopy. Opt. Lett. 2014, 39, 1601–1604. [Google Scholar] [CrossRef] [PubMed]
  23. Chen, Y.-T.; Chen, T.-Y.; Yi, J.; Chu, Y.S.; Lee, W.-K.; Wang, C.-L.; Kempson, I.M.; Hwu, Y.; Gajdosik, V.; Margaritondo, G. Hard X-ray Zernike microscopy reaches 30 nm resolution. Opt. Lett. 2011, 36, 1269–1271. [Google Scholar] [CrossRef] [Green Version]
  24. Bradley, R.S.; Robinson, I.K.; Yusuf, M. 3D X-Ray Nanotomography of cells grown on electrospun scaffolds. Macromol. Biosci. 2016, 17, 1600236. [Google Scholar] [CrossRef]
  25. Falch, K.V.; Casari, D.; Detlefs, C.; Snigireva, A.; Honkimäki, V.; Di Michiel, M.; Snigireva, I.; Mathiesen, R.H. In situ hard X-ray transmission microscopy for material science. J. Mater. Sci. 2017, 52, 3497–3507. [Google Scholar] [CrossRef]
  26. Su, Z.; De Andrade, V.; Cretu, S.; Yin, Y.; Wojcik, M.; Franco, A.; Demortiere, A. X-ray Nanocomputed tomography in Zernike phase contrast for studying 3D morphology of Li-O2 battery elec-trode. ACS Appl. Energy Mater. 2020. [Google Scholar] [CrossRef]
  27. Longo, E.; Sancey, L.; Flenner, S.; Kubec, A.; Bonnin, A.; David, C.; Muller, M.; Greving, I. X-ray Zernike phase contrast tomography: 3D ROI visualization of mm-sized mice organ tissues down to sub-cellular components. Biomed. Opt. Express 2020, 11, 5506–5517. [Google Scholar] [CrossRef]
  28. Park, J.Y.; Kim, Y.; Lee, S.; Lim, J. Zernike phase-contrast full-field transmission X-ray nanotomography for 400 micrometre-sized samples. J. Synchrotron Radiat. 2020, 27, 1696–1702. [Google Scholar] [CrossRef]
  29. Suzuki, Y. Two-beam X-ray interferometer using prism optics. Jpn. J. Appl. Phys. 2002, 41, L1019–L1021. [Google Scholar] [CrossRef]
  30. Chapman, H.N.; Nugent, K.A. Coherent lensless X-ray imaging. Nat. Photon. 2010, 4, 833–839. [Google Scholar] [CrossRef]
  31. Podorov, S.; Pavlov, K.M.; Paganin, D.M.J.O.E. A non-iterative reconstruction method for direct and unambiguous coherent dif-fractive imaging. Opt. Express 2007, 15, 9954–9962. [Google Scholar] [CrossRef]
  32. Guizar-Sicairos, M.; Fienup, J.R. Holography with extended reference by autocorrelation linear differential operation. Opt. Express 2007, 15, 17592–17612. [Google Scholar] [CrossRef] [PubMed]
  33. Gauthier, D.; Guizar-Sicairos, M.; Ge, X.; Boutu, W.; Carré, B.; Fienup, J.R.; Merdji, H. Single-shot femtosecond X-ray holography using extended references. Phys. Rev. Lett. 2010, 105, 093901. [Google Scholar] [CrossRef] [PubMed]
  34. Pfau, B.; Eisebitt, S. X-ray holography. Synchrotron light sources and free-electron. Lasers 2020, 5, 1295–1335. [Google Scholar]
  35. Zhu, D.; Guizar-Sicairos, M.; Wu, B.; Scherz, A.; Acremann, Y.; Tyliszczak, T.; Fischer, P.; Friedenberger, N.; Ollefs, K.J.; Farle, M.; et al. High-resolution X-ray lensless imaging by differential holographic encoding. Phys. Rev. Lett. 2010, 105, 043901. [Google Scholar] [CrossRef] [Green Version]
  36. Krenkel, M.; Bartels, M.; Salditt, T. Transport of intensity phase reconstruction to solve the twin image problem in holographic X-ray imaging. Opt. Express 2013, 21, 2220–2235. [Google Scholar] [CrossRef] [PubMed] [Green Version]
  37. Geilhufe, J.; Pfau, B.; Schneider, M.; Büttner, F.; Günther, C.M.; Werner, S.; Schaffert, S.; Guehrs, E.; Frömmel, S.; Kläui, M.; et al. Monolithic focused reference beam X-ray holography. Nat. Commun. 2014, 5, 3008. [Google Scholar] [CrossRef] [PubMed] [Green Version]
  38. Gorkhover, T.; Ulmer, A.; Ferguson, K.; Bucher, M.; Maia, F.R.N.C.; Bielecki, J.; Ekeberg, T.; Hantke, M.F.; Daurer, B.J.; Nettelblad, C.; et al. Femtosecond X-ray Fourier holography imaging of free-flying nanoparticles. Nat. Photon. 2018, 12, 150–153. [Google Scholar] [CrossRef]
  39. Vidas, L.; Günther, C.M.; Miller, T.A.; Pfau, B.; Perez-Salinas, D.; Martínez, E.; Schneider, M.; Guehrs, E.; Gargiani, P.; Valvidares, M.; et al. Imaging nanometer phase coexistence at defects during the insulator—Metal phase transformation in VO2 thin films by resonant soft X-ray holography. Nano Lett. 2018, 18, 3449–3453. [Google Scholar] [CrossRef] [Green Version]
  40. Burgos-Parra, E.; Bukin, N.; Sani, S.; Figueroa, A.I.; Beutier, G.; Dupraz, M.; Chung, S.; Dürrenfeld, P.; Le, Q.T.; Mohseni, S.M.; et al. Investigation of magnetic droplet solitons using x-ray holography with extended references. Sci. Rep. 2018, 8, 11533. [Google Scholar] [CrossRef]
  41. Blukis, R.; Pfau, B.; Günther, C.M.; Hessing, P.; Eisebitt, S.; Einsle, J.; Harrison, R.J. Nanoscale imaging of high-field magnetic hysteresis in meteoritic metal using X-Ray holography. Geochem. Geophys. Geosyst. 2020, 21, 009044. [Google Scholar] [CrossRef]
  42. Geilhufe, J.; Pfau, B.; Günther, C.M.; Schneider, M.; Eisebitt, S. Achieving diffraction-limited resolution in soft-X-ray Fourier-transform holography. Ultramicroscopy 2020, 214, 113005. [Google Scholar] [CrossRef] [PubMed]
  43. Turnbull, L.A.; Birch, M.T.; Laurenson, A.; Bukin, N.; Burgos-Parra, E.O.; Popescu, H.; Wilson, M.N.; Stefančič, A.; Balakrishnan, G.; Ogrin, F.Y.; et al. Tilted X-ray holography of magnetic bubbles in MnNiGa lamellae. ACS Nano 2021, 15, 387–395. [Google Scholar] [CrossRef]
  44. Tegze, M.; Faigel, G. X-ray holography with atomic resolution. Nat. Cell Biol. 1996, 380, 49–51. [Google Scholar] [CrossRef]
  45. Happo, N.; Hada, T.; Kubota, A.; Ebisu, Y.; Hosokawa, S.; Kimura, K.; Tajiri, H.; Matsushita, T.; Hayashi, K. Improvement of graphite crystal analyzer for light elements on X-ray fluorescence holography measurement. Jpn. J. Appl. Phys. 2018, 57, 058006. [Google Scholar] [CrossRef]
  46. Kudo, K.; Ioka, S.; Happo, N.; Ota, H.; Ebisu, Y.; Kimura, K.; Hada, T.; Kimuea, T.; Tajiri, H.; Hosokawa, S.; et al. Impact of local atomic fluctuations on superconductivity of Pr-substituted CaFe2As2 studied by X-ray fluores-cence holography. J. Phys. Soc. Jpn. 2019, 88, 063704. [Google Scholar] [CrossRef]
  47. Stellhorn, J.R.; Hosokawa, S.; Happo, N.; Tajiri, H.; Matsushita, T.; Kaminaga, K.; Fukumura, T.; Hasegawa, T.; Hayashi, K. A valence-selective X-ray fluorescence holography study of an yttrium oxide thin film. J. Appl. Crystallogr. 2017, 50, 1583–1589. [Google Scholar] [CrossRef]
  48. Hosokawa, S.; Stellhorn, J.R.; Matsushita, T.; Happo, N.; Kimura, K.; Hayashi, K.; Ebisu, Y.; Ozaki, T.; Ikemoto, H.; Setoyama, H.; et al. Impurity position and lattice distortion in a Mn-doped Bi2Te3 topological insulator investigated by X-ray fluorescence holography and X-ray absorption fine structure. Phys. Rev. B 2017, 96, 214207. [Google Scholar] [CrossRef]
  49. Hayashi, K.; Korecki, P.J.J.O. X-ray fluorescence holography: Principles, apparatus; applications. J. Phys. Soc. Jpn. 2018, 87, 061003. [Google Scholar] [CrossRef]
  50. Kaulich, B.; Wilhein, T.; Di Fabrizio, E.; Romanato, F.; Altissimo, M.; Cabrini, S.; Fayard, B.; Susini, J. Differential interference contrast X-ray microscopy with twin zone plates. J. Opt. Soc. Am. A 2002, 19, 797–806. [Google Scholar] [CrossRef] [PubMed]
  51. Di Fabrizio, E.; Kaulich, B.; Wilhein, T.; Susini, J. Differential interference contrast for X-ray microscopy: Fabrication and characterization of twin zone plate optics. Surf. Rev. Lett. 2002, 9, 243–248. [Google Scholar] [CrossRef]
  52. Vogt, U.; Lindblom, M.; Jansson, P.A.; Tuohimaa, T.T.; Holmberg, A.; Hertz, H.M.; Wieland, M.; Wilhein, T. Single-optical-element soft-X-ray interferometry with a laser-plasma X-ray source. Opt. Lett. 2005, 30, 2167–2169. [Google Scholar] [CrossRef] [PubMed]
  53. Chang, C.; Sakdinawat, A.; Fischer, P.; Anderson, E.; Attwood, D. Single-element objective lens for soft X-ray differential interference contrast microscopy. Opt. Lett. 2006, 31, 1564–1566. [Google Scholar] [CrossRef] [PubMed] [Green Version]
  54. Bertilson, M.C.; Von Hofsten, O.; Lindblom, M.; Wilhein, T.; Hertz, H.M.; Vogt, U. Compact high-resolution differential interference contrast soft X-ray microscopy. Appl. Phys. Lett. 2008, 92, 064104. [Google Scholar] [CrossRef]
  55. Cui, X.; Lew, M.; Yang, C. Quantitative differential interference contrast microscopy based on structured-aperture interference. Appl. Phys. Lett. 2008, 93, 091113. [Google Scholar] [CrossRef] [Green Version]
  56. Xie, C.; Zhu, X.; Li, H.; Shi, L.; Hua, Y.; Liu, M. Toward two-dimensional nanometer resolution hard X-ray differential-interference-contrast imaging using modified photon sieves. Opt. Lett. 2012, 37, 749–751. [Google Scholar] [CrossRef] [PubMed]
  57. Zhang, Y.; Xie, C.J.O. Differential-interference-contrast digital in-line holography microscopy based on a single-optical-element. Opt. Lett. 2015, 40, 5015–5018. [Google Scholar] [CrossRef]
  58. Matsuda, K.; Lopez, J.C.A.; Rehman, S.; Misawa, M.; Suzuki, Y.; Takeuchi, A.; Yasumoto, M.; Hibino, K.; Roy, M.; Hanayama, R.; et al. Differential interference contrast microscopy for cells using hard X-ray holography. Appl. Opt. 2018, 57, 4795–4801. [Google Scholar] [CrossRef] [PubMed]
  59. Miao, J.; Charalambous, P.; Kirz, J.; Sayre, D. Extending the methodology of X-ray crystallography to allow imaging of micrometre-sized non-crystalline speci-mens. Nature 1999, 400, 342–344. [Google Scholar] [CrossRef]
  60. Miao, J.; Sandberg, R.L.; Song, C. Coherent X-ray diffraction imaging. IEEE J. Sel. Top. Quantum Electron. 2012, 18, 399–410. [Google Scholar] [CrossRef]
  61. Gerchberg, R.W.; Saxton, W.O. A practical algorithm for the determination of phase from image and diffraction plane pictures. Optik 1972, 35, 237–246. [Google Scholar]
  62. Nam, D.; Park, J.; Gallagher-Jones, M.; Kim, S.; Kim, S.; Kohmura, Y.; Naitow, H.; Kunishima, N.; Yoshida, T.; Ishikawa, T.; et al. Imaging fully hydrated whole cells by coherent X-ray diffraction microscopy. Phys. Rev. Lett. 2013, 110, 098103. [Google Scholar] [CrossRef] [PubMed] [Green Version]
  63. Takahashi, Y.; Suzuki, A.; Zettsu, N.; Oroguchi, T.; Takayama, Y.; Sekiguchi, Y.; Kobayashi, A.; Yamamoto, M.; Nakasako, M. Coherent diffraction imaging analysis of shape-controlled nanoparticles with focused hard X-ray free-electron laser pulses. Nano Lett. 2013, 13, 6028–6032. [Google Scholar] [CrossRef]
  64. Kourousias, G.; Bozzini, B.; Gianoncelli, A.; Jones, M.W.M.; Junker, M.; Van Riessen, G.; Kiskinova, M. Shedding light on electrodeposition dynamics tracked in situ via soft X-ray coherent diffraction imaging. Nano Res. 2016, 9, 2046–2056. [Google Scholar] [CrossRef]
  65. Glownia, J.M.; Natan, A.; Cryan, J.P.; Hartsock, R.; Kozina, M.; Minitti, M.P.; Nelson, S.; Robinson, J.; Sato, T.; Van Driel, T.; et al. Self-referenced coherent diffraction X-ray movie of Ångstrom- and Femtosecond-scale atomic motion. Phys. Rev. Lett. 2016, 117, 153003. [Google Scholar] [CrossRef] [Green Version]
  66. Cha, W.; Ulvestad, A.; Allain, M.; Chamard, V.; Harder, R.; Leake, S.J.; Maser, J.; Fuoss, P.H.; Hruszkewycz, S.O. Three dimensional variable-wavelength X-ray bragg coherent diffraction imaging. Phys. Rev. Lett. 2016, 117, 225501. [Google Scholar] [CrossRef] [PubMed] [Green Version]
  67. Faulkner, H.M.L.; Rodenburg, J.M. Movable aperture lensless transmission microscopy: A novel phase retrieval algorithm. Phys. Rev. Lett. 2004, 93, 023903. [Google Scholar] [CrossRef] [Green Version]
  68. Rodenburg, J.M.; Faulkner, H.M.L. A phase retrieval algorithm for shifting illumination. Appl. Phys. Lett. 2004, 85, 4795–4797. [Google Scholar] [CrossRef] [Green Version]
  69. Pfeiffer, F. X-ray ptychography. Nat. Photon. 2017, 12, 9–17. [Google Scholar] [CrossRef]
  70. Shi, X.; Burdet, N.; Chen, B.; Xiong, G.; Streubel, R.; Harder, R.; Robinson, I.K. X-ray ptychography on low-dimensional hard-condensed matter materials. Appl. Phys. Rev. 2019, 6, 011306. [Google Scholar] [CrossRef] [Green Version]
  71. Hill, M.O.; Calvo-Almazan, I.; Allain, M.; Holt, M.V.; Ulvestad, A.; Treu, J.; Koblmueller, G.; Huang, C.; Huang, X.; Yan, H.; et al. Measuring three-dimensional strain and structural defects in a single InGaAs nanowire using coherent X-ray multiangle bragg projection ptychography. Nano Lett. 2018, 18, 811–819. [Google Scholar] [CrossRef] [PubMed] [Green Version]
  72. Wu, J.; Zhu, X.; West, M.M.; Tyliszczak, T.; Shiu, H.-W.; Shapiro, D.; Berejnov, V.; Susac, D.; Stumper, J.; Hitchcock, A.P. High-resolution imaging of polymer electrolyte membrane fuel cell cathode layers by soft X-ray spectro-ptychography. J. Phys. Chem. C 2018, 122, 11709–11719. [Google Scholar] [CrossRef]
  73. Hirose, M.; Ishiguro, N.; Shimomura, K.; Nguyen, D.-N.; Matsui, H.; Dam, H.C.; Tada, M.; Takahashi, Y. Oxygen-diffusion-driven oxidation behavior and tracking areas visualized by X-ray spectro-ptychography with unsupervised learning. Commun. Chem. 2019, 2, 50. [Google Scholar] [CrossRef]
  74. Bossers, K.W.; Valadian, R.; Zanoni, S.; Smeets, R.; Friederichs, N.; Garrevoet, J.; Meirer, F.; Weckhuysen, B.M. Correlated X-ray ptychography and fluorescence nano-tomography on the fragmentation behavior of an individual catalyst particle during the early stages of olefin polymerization. J. Am. Chem. Soc. 2020, 142, 3691–3695. [Google Scholar] [CrossRef] [Green Version]
  75. Polo, C.C.; Pereira, L.; Mazzafera, P.; Flores-Borges, D.N.A.; Mayer, J.L.S.; Guizar-Sicairos, M.; Holler, M.; Barsi-Andreeta, M.; Westfahl, H.; Meneau, F. Correlations between lignin content and structural robustness in plants revealed by X-ray ptychography. Sci. Rep. 2020, 10, 6023. [Google Scholar] [CrossRef]
  76. Lo, Y.H.; Zhou, J.; Rana, A.; Morrill, D.; Gentry, C.; Enders, B.; Yu, Y.-S.; Sun, C.-Y.; Shapiro, D.A.; Falcone, R.W.; et al. X-ray linear dichroic ptychography. Proc. Natl. Acad. Sci. USA 2021, 118, 118. [Google Scholar] [CrossRef] [PubMed]
  77. Yao, Y.; Jiang, Y.; Klug, J.A.; Wojcik, M.; Maxey, E.R.; Sirica, N.S.; Roehrig, C.; Cai, Z.; Vogt, S.; Lai, B.; et al. Multi-beam X-ray ptychography for high-throughput coherent diffraction imaging. Sci. Rep. 2020, 10, 1–8. [Google Scholar] [CrossRef]
  78. Momose, A.; Fukuda, J. Phase-contrast radiographs of nonstained rat cerebellar specimen. Med. Phys. 1995, 22, 375–379. [Google Scholar] [CrossRef] [PubMed]
  79. Takeda, T.; Momose, A.; Wu, J.; Yu, Q.; Zeniya, T.; Lwin, T.-T.; Yoneyama, A.; Itai, Y. Vessel imaging by interferometric phase-contrast X-ray technique. Circulation 2002, 105, 1708–1712. [Google Scholar] [CrossRef] [PubMed]
  80. Yoneyama, A.; Takeda, T.; Tsuchiya, Y.; Wu, J.; Koizumi, A.; Hyodo, K.; Itai, Y. A phase-contrast X-ray imaging system—With a 60 × 30 mm field of view—Based on a skew-symmetric two-crystal X-ray interferometer. Nucl. Instrum. Methods Phys. Res. Sect. A 2004, 523, 217–222. [Google Scholar] [CrossRef]
  81. Takeda, T.; Yoneyama, A.; Wu, J.; Lwin, T.T.; Tsuchiya, Y.; Hyodo, K. In-vivo imaging of cancer implanted in nude mice by two-crystal interferometer-based phase-contrast X-ray computed tomography. Jpn. J. Appl. Phys. 2004, 43, L1144–L1146. [Google Scholar] [CrossRef]
  82. Takeda, T.; Yoneyama, A.; Wu, J.; Momose, A.; Hyodo, K. In vivo physiological saline-infused hepatic vessel imaging using a two-crystal-interferometer-based phase-contrast X-ray technique. J. Synchrotron Radiat. 2012, 19, 252–256. [Google Scholar] [CrossRef] [PubMed]
  83. Yoneyama, A.; Hyodo, K.; Takeda, T. Feasibility test of Zeff imaging using X-ray interferometry. Appl. Phys. Lett. 2013, 103, 204108. [Google Scholar] [CrossRef]
  84. Mkrtchyan, V.P.; Gasparyan, L.G.; Dadalyan, T.K.; Balyan, M.K.; Kuyumchyan, A.V. Measurement of the refractive index of nematic liquid crystals 5CB by means of X-ray interferometry. In Proceedings of the SPIE—The International Society for Optical Engineering, Bellingham, WA, USA, 1–7 August 2014; p. 920714. [Google Scholar]
  85. Lwin, T.-T.; Yoneyama, A.; Hara, A.; Ohbu, M.; Maruyama, H.; Taguchi, M.; Esashi, S.; Matsushima, T.; Terazaki, K.; Hyodo, K.; et al. Spontaneous brain tumor imaging of aged rat by crystal X-ray interferometer-based phase-contrast X-ray CT. Acta Radiol. Open 2016, 5, 2058460115626958. [Google Scholar] [CrossRef] [Green Version]
  86. Yoneyama, A.; Hyodo, K.; Baba, R.; Takeya, S.; Takeda, T. Feasibility study of phase-contrast X-ray laminography using X-ray interferometry. J. Synchrotron Radiat. 2018, 25, 1841–1846. [Google Scholar] [CrossRef]
  87. Momose, A. Phase-contrast X-ray imaging based on interferometry. J. Synchroton Radiat. 2002, 9, 136–142. [Google Scholar] [CrossRef] [Green Version]
  88. Lider, V.V. X-ray crystal interferometers. Phys. Uspekhi 2014, 57, 1099–1117. [Google Scholar] [CrossRef]
  89. Pfeiffer, F.; Herzen, J.; Willner, M.; Chabior, M.; Auweter, S.; Reiser, M.; Bamberg, F. Grating-based X-ray phase contrast for biomedical imaging applications. Z. Med. Phys. 2013, 23, 176–185. [Google Scholar] [CrossRef]
  90. Pfeiffer, F.; Weitkamp, T.; Bunk, O.; David, C. Phase retrieval and differential phase-contrast imaging with low-brilliance X-ray sources. Nat. Phys. 2006, 2, 258–261. [Google Scholar] [CrossRef]
  91. Momose, A.; Yashiro, W.; Kido, K.; Kiyohara, J.; Makifuchi, C.; Ito, T.; Nagatsuka, S.; Honda, C.; Noda, D.; Hattori, T.; et al. X-ray phase imaging: From synchrotron to hospital. Philos. Trans. R. Soc. A Math. Phys. Eng. Sci. 2014, 372, 20130023. [Google Scholar] [CrossRef] [Green Version]
  92. Itoh, H.; Nagai, K.; Sato, G.; Yamaguchi, K.; Nakamura, T.; Kondoh, T.; Ouchi, C.; Teshima, T.; Setomoto, Y.; Den, T. Two-dimensional grating-based X-ray phase-contrast imaging using Fourier transform phase retrieval. Opt. Express 2011, 19, 3339–3346. [Google Scholar] [CrossRef]
  93. Ge, Y.; Li, K.; Garrett, J.; Chen, G.-H. Grating based X-ray differential phase contrast imaging without mechanical phase stepping. Opt. Express 2014, 22, 14246–14252. [Google Scholar] [CrossRef]
  94. Birnbacher, L.; Willner, M.; Velroyen, A.; Marschner, M.; Hipp, A.; Meiser, J.; Koch, F.; Schröter, T.; Kunka, D.; Mohr, J.; et al. Experimental realisation of high-sensitivity laboratory X-ray grating-based phase-contrast computed tomography. Sci. Rep. 2016, 6, 1–8. [Google Scholar] [CrossRef]
  95. Yashiro, W.; Noda, D.; Kajiwara, K. Sub-10-ms X-ray tomography using a grating interferometer. Appl. Phys. Express 2017, 10, 52501. [Google Scholar] [CrossRef] [Green Version]
  96. Gradl, R.; Morgan, K.S.; Dierolf, M.; Jud, C.; Hehn, L.; Gunther, B.; Moller, W.; Kutschke, D.; Yang, L.; Stoeger, T.; et al. Dynamic in vivo chest X-ray dark-field imaging in mice. IEEE Trans. Med. Imaging 2018, 38, 649–656. [Google Scholar] [CrossRef] [PubMed]
  97. Arboleda, C.; Wang, Z.; Jefimovs, K.; Koehler, T.; Van Stevendaal, U.; Kuhn, N.; David, B.; Prevrhal, S.; Lång, K.; Forte, S.; et al. Towards clinical grating-interferometry mammography. Eur. Radiol. 2020, 30, 1419–1425. [Google Scholar] [CrossRef] [Green Version]
  98. Wen, H.H.; Bennett, E.E.; Kopace, R.; Stein, A.F.; Pai, V. Single-shot X-ray differential phase-contrast and diffraction imaging using two-dimensional transmission gratings. Opt. Lett. 2010, 35, 1932–1934. [Google Scholar] [CrossRef] [PubMed] [Green Version]
  99. Tahir, S.; Bashir, S.; Macdonald, C.; Petruccelli, J.C. Mesh-based phase contrast Fourier transform imaging. Opt. Commun. 2017, 389, 103–109. [Google Scholar] [CrossRef]
  100. Morgan, K.S.; Paganin, D.M.; Siu, K.K.W. X-ray phase imaging with a paper analyzer. Appl. Phys. Lett. 2012, 100, 124102. [Google Scholar] [CrossRef]
  101. Pisano, E.D.; Johnston, R.E.; Chapman, D.; Geradts, J.; Iacocca, M.V.; Livasy, C.A.; Washburn, D.B.; Sayers, D.E.; Zhong, Z.; Kiss, M.Z.; et al. Human breast cancer specimens: Diffraction-enhanced imaging with histologic correlation—Improved con-spicuity of lesion detail compared with digital radiography. Radiology 2000, 214, 895–901. [Google Scholar] [CrossRef] [PubMed]
  102. Dilmanian, A.F.; Zhong, Z.; Ren, B.; Wu, X.Y.; Chapman, L.D.; Orion, I.; Thomlinson, W.C. Computed tomography of X-ray index of refraction using the diffraction enhanced imaging method. Phys. Med. Biol. 2000, 45, 933–946. [Google Scholar] [CrossRef]
  103. Mollenhauer, J.; Aurich, M.; Zhong, Z.; Muehleman, C.; Cole, A.; Hasnah, M.; Oltulu, O.; Kuettner, K.; Margulis, A.; Chapman, L. Diffraction-enhanced X-ray imaging of articular cartilage. Osteoarthr. Cartil. 2002, 10, 163–171. [Google Scholar] [CrossRef] [Green Version]
  104. Oltulu, O.; Zhong, Z.; Hasnah, M.; Wernick, M.N.; Chapman, D. Extraction of extinction, refraction and absorption properties in diffraction enhanced imaging. J. Phys. D Appl. Phys. 2003, 36, 2152–2156. [Google Scholar] [CrossRef]
  105. Kelly, M.E.; Coupal, D.J.; Beavis, R.C.; Schultke, E.; Romanchuk, K.; Juurlink, B.H.J.; Zhong, Z.; Chapman, L.D. Diffraction-enhanced imaging of a porcine eye. Can. J. Ophthalmol. 2007, 42, 731–733. [Google Scholar] [CrossRef] [PubMed]
  106. Kao, T.; Connor, D.; A Dilmanian, F.; Faulconer, L.; Liu, T.; Parham, C.; Pisano, E.D.; Zhong, Z. Characterization of diffraction-enhanced imaging contrast in breast cancer. Phys. Med. Biol. 2009, 54, 3247–3256. [Google Scholar] [CrossRef]
  107. Muehleman, C.; Li, J.; Connor, D.; Parham, C.; Pisano, E.; Zhong, Z. Diffraction-enhanced imaging of musculoskeletal tissues using a conventional X-ray tube. Acad. Radiol. 2009, 16, 918–923. [Google Scholar] [CrossRef] [Green Version]
  108. Faulconer, L.; Parham, C.; Connor, D.M.; Zhong, Z.; Kim, E.; Zeng, D.; Livasy, C.; Cole, E.; Kuzmiak, C.; Koomen, M.; et al. Radiologist evaluation of an X-ray tube-based diffraction-enhanced imaging prototype using full-thickness breast specimens. Acad. Radiol. 2009, 16, 1329–1337. [Google Scholar] [CrossRef]
  109. Nesch, I.; Fogarty, D.P.; Tzvetkov, T.; Reinhart, B.; Walus, A.C.; Khelashvili, G.; Muehleman, C.; Chapman, D. The design and application of an in-laboratory diffraction-enhanced X-ray imaging instrument. Rev. Sci. Instrum. 2009, 80, 93702. [Google Scholar] [CrossRef]
  110. Parham, C.; Zhong, Z.; Connor, D.M.; Chapman, L.D.; Pisano, E.D. Design and implementation of a compact low-dose diffraction enhanced medical imaging system. Acad. Radiol. 2009, 16, 911–917. [Google Scholar] [CrossRef]
  111. Zhou, W.; Majidi, K.; Brankov, J.G. Analyzer-based phase-contrast imaging system using a micro focus X-ray source. Rev. Sci. Instrum. 2014, 85, 85114. [Google Scholar] [CrossRef] [PubMed] [Green Version]
  112. Ando, M.; Nakao, Y.; Jin, G.; Sugiyama, H.; Sunaguchi, N.; Sung, Y.; Suzuki, Y.; Sun, Y.; Tanimoto, M.; Kawashima, K.; et al. Improving contrast and spatial resolution in crystal analyzer-based x-ray dark-field imaging: Theoretical con-siderations and experimental demonstration. Med. Phys. 2020, 47, 5505–5513. [Google Scholar] [CrossRef]
  113. Li, J.; Zhong, Z.; Lidtke, R.; Kuettner, K.E.; Peterfy, C.; Aliyeva, E.; Muehleman, C. Radiography of soft tissue of the foot and ankle with diffraction enhanced imaging. J. Anat. 2003, 202, 463–470. [Google Scholar] [CrossRef]
  114. Majumdar, S.; Issever, A.S.; Burghardt, A.; Lotz, J.; Arfelli, F.; Rigon, L.; Heitner, G.; Menk, R.-H. Diffraction enhanced imaging of articular cartilage and comparison with micro-computed tomography of the underlying bone structure. Eur. Radiol. 2004, 14, 1440–1448. [Google Scholar] [CrossRef]
  115. Fernández, M.; Keyriläinen, J.; Serimaa, R.; Torkkeli, M.; Karjalainen-Lindsberg, M.L.; Leidenius, M.; von Smitten, K.; Tenhunen, M.; Fiedler, S.; Bravin, A.; et al. Human breast cancer in vitro: Matching histo-pathology with small-angle X-ray scattering and diffraction enhanced X-ray imaging. Phys. Med. Biol. 2005, 50, 2991. [Google Scholar] [CrossRef] [PubMed]
  116. Antunes, A.; Honnicke, M.; Safatle, A.; Cusatis, C.; Barros, P.M.; Morelhao, S.L. Diffraction enhanced X-ray imaging of mammals crystalline lens. Nucl. Instrum. Methods Phys. Res. Sect. B Beam Interact. Mater. Atoms 2005, 238, 28–31. [Google Scholar] [CrossRef]
  117. Yin, H.; Gao, X.; Luo, S.; Liu, B.; Gao, X.; Zhu, P.; Shu, H. Diffraction enhanced X-ray imaging for observing guinea pig cochlea. In Proceedings of the 2005 IEEE Engineering in Medicine and Biology 27th Annual Conference; Orlando, FL, USA, 31 October–3 November 2005, Institute of Electrical and Electronics Engineers (IEEE): Piscataway, NJ, USA, 2005; Volume 6, pp. 5699–5701. [Google Scholar]
  118. Bravin, A.; Keyriläinen, J.; Fernandez, M.; Fiedler, S.; Nemoz, C.; Karjalainen-Lindsberg, M.-L.; Tenhunen, M.; Virkkunen, P.; Leidenius, M.; Von Smitten, K.; et al. High-resolution CT by diffraction-enhanced X-ray imaging: Mapping of breast tissue samples and comparison with their histo-pathology. Phys. Med. Biol. 2007, 52, 2197–2211. [Google Scholar] [CrossRef]
  119. Fogarty, D.P.; Reinhart, B.; Tzvetkov, T.; Nesch, I.; Williams, C. In-laboratory diffraction-enhanced X-ray imaging of an equine hoof. J. Equine Veter. Sci. 2011, 31, 365–369. [Google Scholar] [CrossRef]
  120. Cooper, D.M.; Bewer, B.; Wiebe, S.; Wysokinski, T.W.; Chapman, D. Diffraction enhanced X-ray imaging of the distal radius: A novel approach for visualization of trabecular bone architecture. Can. Assoc. Radiol. J. 2011, 62, 251–255. [Google Scholar] [CrossRef] [Green Version]
  121. Mizuno, K.; Kobayashi, T.; Fujiki, F.; Okamoto, H.; Furuya, Y.; Hirano, K. Visualization of hydrides in titanium by means of diffraction-enhanced X-ray imaging. J. Alloy. Compd. 2005, 402, 109–114. [Google Scholar] [CrossRef]
  122. Mizuno, K.; Furuya, Y.; Hirano, K.; Okamoto, H. Hydrogen diffusion in titanium-hydride observed by the diffraction-enhanced X-ray imaging method. Phys. Status Solidi 2007, 204, 2734–2739. [Google Scholar] [CrossRef]
  123. Lang, S.; Zanette, I.; Dominietto, M.; Langer, M.; Rack, A.; Schulz, G.; Le Duc, G.; David, C.; Mohr, J.; Pfeiffer, F.; et al. Experimental comparison of grating- and propagation-based hard X-ray phase tomography of soft tissue. J. Appl. Phys. 2014, 116, 154903. [Google Scholar] [CrossRef]
  124. Preissner, M.; Murrie, R.P.; Pinar, I.; Werdiger, F.; Carnibella, R.P.; Zosky, G.R.; Fouras, A.; Dubsky, S. High resolution propagation-based imaging system for in vivo dynamic computed tomography of lungs in small animals. Phys. Med. Biol. 2018, 63, 08NT03. [Google Scholar] [CrossRef] [PubMed]
  125. Kalasová, D.; Zikmund, T.; Pína, L.; Takeda, Y.; Horváth, M.; Omote, K.; Kaiser, J. Characterization of a laboratory-based X-ray computed nanotomography system for propagation-based meth-od of phase contrast imaging. IEEE Proc. 2019, 69, 1170–1178. [Google Scholar]
  126. Longo, R.; Arfelli, F.; Bonazza, D.; Bottigli, U.; Brombal, L.; Contillo, A.; Cova, M.A.; Delogu, P.; Di Lillo, F.; Di Trapani, V.; et al. Advancements towards the implementation of clinical phase-contrast breast computed tomography at Elettra. J. Synchrotron Radiat. 2019, 26, 1343–1353. [Google Scholar] [CrossRef] [PubMed] [Green Version]
  127. Bidola, P.; Morgan, K.; Willner, M.; Fehringer, A.; Allner, S.; Prade, F.; Pfeiffer, F.; Achterhold, K. Application of sensitive, high-resolution imaging at a commercial lab-based X-ray micro-CT system using propagation-based phase retrieval. J. Microsc. 2017, 266, 211–220. [Google Scholar] [CrossRef]
  128. Baran, P.; Pacile, S.; Nesterets, I.Y.; Mayo, S.C.; Dullin, C.; Dreossi, D.; Arfelli, F.; Thompson, D.; Lockie, D.; McCormack, M.; et al. Optimization of propagation-based X-ray phase-contrast tomography for breast cancer imaging. Phys. Med. Biol. 2017, 62, 2315–2332. [Google Scholar] [CrossRef]
  129. Carrel, M.; Beltran, M.A.; Morales, V.L.; Derlon, N.; Morgenroth, E.; Kaufmann, R.; Holzner, M. Biofilm imaging in porous media by laboratory X-ray tomography: Combining a non-destructive contrast agent with propagation-based phase-contrast imaging tools. PLoS ONE 2017, 12, e0180374. [Google Scholar] [CrossRef] [PubMed] [Green Version]
  130. Töpperwien, M.; Gradl, R.; Keppeler, D.; Vassholz, M.; Meyer, A.; Hessler, R.; Achterhold, K.; Gleich, B.; Dierolf, M.; Pfeiffer, F.; et al. Propagation-based phase-contrast X-ray tomography of cochlea using a compact synchrotron source. Sci. Rep. 2018, 8, 1–12. [Google Scholar] [CrossRef]
  131. Krenkel, M.; Töpperwien, M.; Dullin, C.; Alves, F.; Salditt, T. Propagation-based phase-contrast tomography for high-resolution lung imaging with laboratory sources. AIP Adv. 2016, 6, 035007. [Google Scholar] [CrossRef]
  132. Olivo, A.; Arfelli, F.; Cantatore, G.; Longo, R.; Menk, R.H.; Pani, S.; Prest, M.; Poropat, P.; Rigon, L.; Tromba, G.; et al. An innovative digital imaging set-up allowing a low-dose approach to phase contrast applications in the medi-cal field. Med. Phys. 2001, 28, 1610–1619. [Google Scholar] [CrossRef] [Green Version]
  133. Olivo, A.; Diemoz, P.C.; Bravin, A. Amplification of the phase contrast signal at very high X-ray energies. Opt. Lett. 2012, 37, 915–917. [Google Scholar] [CrossRef]
  134. Diemoz, P.C.; Endrizzi, M.; Zapata, C.E.; Pešić, Z.D.; Rau, C.; Bravin, A.; Robinson, I.K.; Olivo, A. X-ray phase-contrast imaging with nanoradian angular resolution. Phys. Rev. Lett. 2013, 110, 138105. [Google Scholar] [CrossRef]
  135. Diemoz, P.C.; Hagen, C.K.; Endrizzi, M.; Olivo, A. Sensitivity of laboratory based implementations of edge illumination X-ray phase-contrast imaging. Appl. Phys. Lett. 2013, 103, 244104. [Google Scholar] [CrossRef] [Green Version]
  136. Diemoz, P.C.; Vittoria, F.A.; Olivo, A. Spatial resolution of edge illumination X-ray phase-contrast imaging. Opt. Express 2014, 22, 15514–15529. [Google Scholar] [CrossRef] [PubMed]
  137. Zamir, A.; Hagen, C.; Diemoz, P.C.; Endrizzi, M.; Vittoria, F.; Chen, Y.; Anastasio, M.A.; Olivo, A. Recent advances in edge illumination X-ray phase-contrast tomography. J. Med. Imaging 2017, 4, 040901. [Google Scholar] [CrossRef] [PubMed] [Green Version]
  138. Olivo, A.; Speller, R. A coded-aperture technique allowing x-ray phase contrast imaging with conventional sources. Appl. Phys. Lett. 2007, 91, 074106. [Google Scholar] [CrossRef] [Green Version]
  139. Marenzana, M.; Hagen, C.K.; Borges, P.D.N.; Endrizzi, M.; Szafraniec, M.B.; Ignatyev, K.; Olivo, A. Visualization of small lesions in rat cartilage by means of laboratory-based X-ray phase contrast imaging. Phys. Med. Biol. 2012, 57, 8173–8184. [Google Scholar] [CrossRef]
  140. Hagen, C.K.; Diemoz, P.C.; Endrizzi, M.; Rigon, L.; Dreossi, D.; Arfelli, F.; Lopez, F.C.M.; Longo, R.; Olivo, A. Theory and preliminary experimental verification of quantitative edge illumination X-ray phase contrast tomog-raphy. Opt. Express 2014, 22, 7989–8000. [Google Scholar] [CrossRef]
  141. Modregger, P.; Cremona, T.P.; Benarafa, C.; Schittny, J.C.; Olivo, A.; Endrizzi, M. Small angle X-ray scattering with edge-illumination. Sci. Rep. 2016, 6, 30940. [Google Scholar] [CrossRef] [Green Version]
  142. Havariyoun, G.; Vittoria, A.F.; Hagen, C.K.; Basta, D.; Kallon, G.K.; Endrizzi, M.; Massimi, L.; Munro, P.R.T.; Hawker, S.; Smit, B.; et al. A compact system for intraoperative specimen imaging based on edge illumination X-ray phase contrast. Phys. Med. Biol. 2019, 64, 235005. [Google Scholar] [CrossRef]
Figure 1. Sketch of Zernike’s phase-contrast microscope.
Applsci 11 02971 g001
Figure 2. (a) Diffracted light (indicated in blue) has a −90° phase shift compared to the background (indicated in red). The interfered wave (indicated in purple) is the vector sum of the diffracted light and the background. It has an intensity (indicated as the magnitude of the vector) similar to the background. (b) The phase ring has been inserted so that the undiffracted light is phase-shifted by −90°compared to (a). The intensity of the interfered wave is the sum of undiffracted and diffracted light, which results in an increase in intensity with constructive interference. (c) Opposite to the condition in (b) where the background wave is phase-shifted by 90°.
Applsci 11 02971 g002
Figure 3. Sketch of (a) writing and (b) reading of in-line holography. The blue lines represent the reference wave, and the red lines represent the object wave. The green (solid) and yellow lines (dotted) represent the diffracted reference wave that forms the real (green) and virtual (yellow) images.
Applsci 11 02971 g003
Figure 4. Sketch of the prism interferometer.
Applsci 11 02971 g004
Figure 5. Sketch of the differential interference contrast (DIC) microscope.
Applsci 11 02971 g005
Figure 6. Sketch of the twin zone plates under Wilhein’s X-ray DIC microscope.
Applsci 11 02971 g006
Figure 7. Sketch of the coherent diffraction imaging (CDI) setup.
Applsci 11 02971 g007
Figure 8. Flow of the iterative procedure of the CDI method.
Applsci 11 02971 g008
Figure 9. Sketch of (a) the crystal interferometer instrument and (b) its wave paths.
Applsci 11 02971 g009
Figure 10. Sketch of the grating interferometer (Adapted with permission from [11], Copyright 2015 The Optical Society).
Applsci 11 02971 g010
Figure 11. (a) X-ray Talbot–Lau phase-imaging system installed in a hospital and resultant (b) absorption image and (c) differential phase image. (d) Zoomed image of the rectangle shown in (c). (e) Visibility image of a part of the palm of the first author in this study. X-ray refraction in the vertical direction of the images is sensed. The cartilage in a joint is revealed as indicated by the arrows in (d). The blurry feature at the upper right of (c) is considered due to movement during the measurement (online version in color). This figure is reproduced with permission from [91] published by A. Momose in Mathematical, Physical and Engineering Science in 2014, Figure 2).
Applsci 11 02971 g011
Figure 12. Sketch of the mesh-based phase-imaging setup. The X-ray beam that is deflected by the object creates displacement of the mesh lines on the camera.
Applsci 11 02971 g012
Figure 13. Sketch of diffraction-enhanced imaging (DEI) setup. Two crystals work as monochromator and analyzer.
Applsci 11 02971 g013
Figure 14. Sketch of propagation-based imaging setup.
Applsci 11 02971 g014
Figure 15. Sketch of the edge illumination setup. (a) Edge illumination (EI) method with synchrotron radiation. (b) EI method with conventional X-ray source.
Applsci 11 02971 g015
Publisher’s Note: MDPI stays neutral with regard to jurisdictional claims in published maps and institutional affiliations.

