Article

Cold Crystallization Kinetics and Thermal Degradation of PLA Composites with Metal Oxide Nanofillers

by
Evangelia Tarani
1,
Klementina Pušnik Črešnar
2,
Lidija Fras Zemljič
2,*,
Konstantinos Chrissafis
1,
George Z. Papageorgiou
3,
Dimitra Lambropoulou
4,
Alexandra Zamboulis
5,
Dimitrios N. Bikiaris
5 and
Zoi Terzopoulou
5,*
1
Department of Physics, Aristotle University of Thessaloniki, GR54124 Thessaloniki, Greece
2
Faculty of Mechanical Engineering, University of Maribor, 2000 Maribor, Slovenia
3
Department of Chemistry, University of Ioannina, P.O. Box 1186, GR45110 Ioannina, Greece
4
Laboratory of Environmental Pollution Control, Department of Chemistry, Aristotle University of Thessaloniki, GR54124 Thessaloniki, Greece
5
Laboratory of Chemistry and Technology of Polymers and Dyes, Department of Chemistry, Aristotle University of Thessaloniki, GR54124 Thessaloniki, Greece
*
Authors to whom correspondence should be addressed.
Appl. Sci. 2021, 11(7), 3004; https://doi.org/10.3390/app11073004
Submission received: 24 February 2021 / Revised: 22 March 2021 / Accepted: 23 March 2021 / Published: 27 March 2021
(This article belongs to the Special Issue Applications and Development of Bioplastics)

Abstract

:

Featured Application

PLA nanocomposites are explored as antimicrobial bio-nanocomposites for food packaging or biomedical applications.

Abstract

Poly(lactic acid) (PLA) nanocomposites with antimicrobial fillers have been increasingly explored as food packaging materials that are made of a biobased matrix and can minimize food loss due to spoilage. Some of the most commonly studied fillers are zinc oxide (ZnO), titanium dioxide (TiO2), and silver nanoparticles (AgNPs). In this work, nanocomposites with 1 wt.% of each filler were prepared by melt mixing. An extensive study of thermally stimulated processes such as crystallization, nucleation, degradation, and their kinetics was carried out using Differential Scanning Calorimetry (DSC) and Thermogravimetric Analysis (TGA). In detail, non-isothermal cold crystallization studies were performed with DSC and polarized light microscopy (PLM), and kinetics were analyzed with multiple equations. The activation energy of the non-isothermal cold crystallization was calculated with the methods of Kissinger and Friedman. The latter was used to also determine the Hoffman–Lauritzen parameters (Kg and U*) by applying the Vyazovkin method. Additionally, effective activation energy and kinetic parameters of the thermal decomposition process were determined by applying the isoconversional differential method and multivariate non-linear regression method. According to TGA results, metal oxide nanofillers affected the thermal stability of PLA and caused a decrease in the activation energy values. Moreover, the fillers acted as heterogenous nucleating agents, accelerating the non-isothermal crystallization of PLA, thus reducing its activation energy. It can be concluded that metal oxide nanofillers catalytically affect the thermal degradation and crystallization of PLA samples.

Graphical Abstract

1. Introduction

With the shift of modern society from a linear to a circular economy model, biobased polymers (i.e., polymers from renewable resources) have emerged as alternatives to the common, petroleum-sourced polymers that are an integral part of everyday life. Both demand and production of biobased polymers are continuously growing. Poly(lactic acid) (PLA) is leading the biobased polymers market, and it makes up for 18.7% of the global biobased polymer production capacities [1]. Even if the production of PLA has significantly increased during recent years [2], in 2019 it sold out [3], confirming the increasing demand for this environmentally-friendly polymer. The popularity of PLA arises from its desirable characteristics (biobased, compostable, bioabsorbable, biocompatible, recyclable, eco-friendly synthesis, easy melt processing) as well as the versatility of its applications. Currently, the main markets where PLA finds applications are packaging, biomedical materials and three-dimensional (3D)-printing filaments [4,5]. To compensate for the drawbacks of PLA, and in particular its poor toughness, slow degradation rate, weak gas barrier properties, hydrophobicity, and slow crystallization, PLA has been extensively combined with numerous types and combinations of nanofillers [6,7,8,9,10]. Polymer nanocomposites are materials with multifunctional properties that can be tuned depending on the desired application [11].
PLA nanocomposites with antimicrobial fillers are in the forefront of food packaging research as they can minimize food loss while being friendly to the environment [12]. Some of the most common antimicrobial nanofillers are clays as well as metals and metal oxides [13,14], such as Ag nanoparticles (AgNPs), titanium dioxide (TiO2), and zinc oxide (ZnO) [15,16,17,18,19]. While their effect on the antimicrobial activity and the mechanical and thermal properties of PLA have been widely explored [17,18,20,21,22,23,24,25], their influence on crystallization and thermal degradation kinetics has been the topic of only a handful of studies [26,27,28,29,30,31]. Understanding of crystallization is crucial, not only because it affects processing parameters, but also significantly controls the properties of PLA, such as degradation, thermal stability, optical, mechanical, and barrier properties [32].
PLA has a slow crystallization rate, especially when its molecular weight is high, which is essential for many of its applications, such as food packaging and 3D-printing. Cold crystallization of polymers, also known as crystallization from the glass, is commonly performed on thermoplastic polymer pellets during solid state polymerization (SSP), where fast rates are required. According to the manufacturers, PLA with high molecular weight and L-content is sold in the form of amorphous pellets that must be crystallized before their processing, so it does not become sticky and form clumps during drying [33]. Nanoparticles are well known for their ability to accelerate polymer crystallization by acting as heterogenous nucleation agents, and they have been added in PLA to increase its nucleation density [32].
In this work, the effect of three metal oxide nanofillers on the cold crystallization of PLA was studied with differential scanning calorimetry (DSC) and polarized light microscopy (PLM). The fillers used were AgNPs, ZnO, and TiO2 in 1 wt.% content, as this has been proven to be an adequate amount to impart antimicrobial activity [18,19,22]. Non-isothermal crystallization kinetics were analyzed with the help of theoretical models. Effective activation energy and nucleation activity of the composites were evaluated. Moreover, the effect of various types of metal oxide nanofillers on the thermal stability and thermal degradation of PLA composites, along with a decomposition kinetics study, was performed using thermogravimetric analysis (TGA). A detailed study has been performed for the calculation of the activation energy using Friedman’s isoconversional differential method and Ozawa, Flynn, and Wall’s integral analysis. Finally, the kinetic model and the kinetic parameters of the thermal decomposition process were determined by the multivariate non-linear regression method.

2. Materials and Methods

2.1. Materials

PLA (Ingeo™ Biopolymer 3052D, NatureWorks, Minnetonka, MN, USA) was kindly donated by Plastika Kritis S.A., Heraklion, Greece. It has an L-monomer content of ~96%, M ¯ n = 103,000 g/mol, specific gravity 1.24 (ASTM D792), melt flow rate 14 g/10 min at 210 °C, and relative viscosity 3.3. The fillers were silver NPs (Ag) of 99.95% purity and ~10 nm in size, supplied by Inframat Advanced materials (Manchester, NH, USA), zinc oxide (ZnO) NPs of <100 nm in size, specific surface area 10–25 m2/g, purchased from Sigma—Aldrich (Taufkirchen, Germany), and titanium dioxide (TiO2) NPs type CCA 100 BS of 3–5 nm in size [34], supplied by Cinkarna Celje (Celje, Slovenia). All other chemicals were of reagent grade and supplied by Sigma–Aldrich, Darmstadt, Germany.

2.2. Preparation of PLA composites

PLA composites with filler content 1 wt.% were prepared by melt compounding in a twin-screw co-rotating extruder at 30 rpm, 195 °C for 10 min. Both PLA and the fillers were dried under vacuum before their processing to remove traces of moisture.

2.3. Characterization

2.3.1. Differential Scanning Calorimetry

A PerkinElmer Pyris DSC-6 differential scanning calorimeter, calibrated with pure indium and zinc standards, was used. Samples of 5 ± 0.1 mg, sealed in aluminum pans, were used, and all experiments were performed under N2 atmosphere with a flow of 20 mL/min.
For the non-isothermal cold crystallization, the samples were melted at T = Tm + 20 °C, where Tm is the melting peak temperature, and cooled from the melt at 50 °C/min to 30 °C. After equilibration, the samples were heated to 180 °C with heating rates 2.5, 5, 7.5, 10, 15, and 20 °C/ min.
The degree of crystallinity (Xc) of the neat PLA and PLA composites was calculated using the equation:
X c = ( Δ H m Δ H 0 m ) · ( 1 w )
where ΔHm is the experimental heat of fusion determined from DSC, ΔH0 is the theoretical heat of fusion of the 100% crystalline PLA (93 J/g), and w is the weight fraction of PLA in the composites.

2.3.2. Polarizing Light Microscopy (PLM)

A polarizing light microscope (Nikon, Optiphot-2), equipped with a Linkam THMS 600 heating stage, a Linkam TP 91 control unit, and a Jenoptic ProgRes C10Plus camera with the Jenoptik ProgRes® CapturePro software, were used for PLM observations.

2.3.3. Thermogravimetric Analysis (TGA)

Thermogravimetric analysis (TGA) of PLA composites with antimicrobial nanofillers was carried out using a SETARAM SETSYS TG-DTA 16/18 instrument. The samples (6 ± 0.5 mg) were placed in alumina crucibles and heated from 25 °C to 600 °C in a 50 mL/min flow of N2 at heating rates of 5, 10, 15, and 20 °C/min. Continuous recordings of sample temperature, sample mass, first derivative, and heat flow were taken. For the kinetic analysis study [35], the NETZSCH Kinetics Neo software package was used to calculate the values of the kinetic triplet (activation energy E, pre-exponential factor A, and reaction model f(α)) [36]. The model-fitting kinetic method aims to find a kinetic model that describes the kinetics of the complete degradation reaction quantitatively with minimal adjustable parameters.

3. Results and Discussion

3.1. Non-Isothermal Cold Crystallization

Cold crystallization of PLA and its composites occurred during all the applied heating rates, up to 20 °C/min. The scans are presented in Figure S1, and the thermal characteristics in Table S1.
In Figure 1, the effect of the heating rate on the final % crystallinity and the peak temperature of cold crystallization are presented. Increasing the heating rate leads to increase of the Tcc (cold crystallization peak temperature), while the onset of melting remains unaffected (Figure S1). The Tcc increases because of thermal delay, which occurs at fast heating rates in all polymers. In the slow heating rates up to 5 °C/min for PLA and 7.5 °C/min for its composites, multiple melting is observed, which is caused by the presence of two populations of lamellae, a typical multiple melting behavior for PLA [37,38]. First, there was small lamellae melt in the temperature range of the first melting peak, followed by the melting of the more perfected crystals. With a further increase of the heating rate, both crystallization and melting peaks decrease significantly in size, as there is not enough time for the macromolecular chains to reorganize and form crystals. As a result, the multiple melting behavior also disappears, with the second melting peak gradually shifting to lower temperatures and finally merging with the first one. Consequently, the larger the heating rate, the less perfected the formed crystals of PLA. Similarly, as shown in Figure 1, the Tcc decreases in the presence of the fillers in slow heating rates only. This lower recrystallization temperature implies that the nanocomposites have more nuclei [22,39]. More specifically, Ag and TiO2 decrease the Tcc in heating rates 2.5–10 °C/min, and ZnO in heating rates 2.5 and 5 °C/min. The increase of the degree of crystallinity is also more prominent in the small heating rates. This suggests that the fillers can efficiently act as cold crystallization nucleation sites in these heating rates [40,41].
Based on the assumption that the evolution of crystallinity is linearly proportional to the evolution of heat released during the crystallization, the relative crystallinity, X(t), can be calculated according to the equation:
X ( t ) = 0 t ( d H c d t ) d t 0 ( d H c d t ) d t  
where dHc is the measured enthalpy of crystallization during an infinitesimal time interval, dt. The limits t and denote the elapsed time during crystallization and at the end of the crystallization process, respectively.
The crystallization temperature, Tc, can be converted to crystallization time, t, with the well-known relationship for non-isothermal crystallization that is strictly valid when the sample experiences the same thermal history as designed by the DSC furnace:
t = ( T o T c ) α  
where α is the constant heating rate, To is the temperature at the beginning of crystallization, and Tc is the crystallization temperature at time, t. The relative crystallinity of the samples as a function of time is shown in Figure S2, and the resulting crystallization half-times are presented in Figure 2. All fillers reduce the t1/2 of PLA during non-isothermal cold crystallization, revealing their role as sites of heterogenous nucleation. ZnO was able to also accelerate the crystallization half-time of poly(3-hydroxybutyrate) during non-isothermal cold crystallization [42]. The mathematical analysis of the non-isothermal cold crystallization was performed by applying the models of Ozawa and Mo in order to evaluate their suitability in describing the cold-crystallization kinetics of PLA and its nanocomposites.

3.1.1. Ozawa Theory

The Ozawa theory is very popular amongst the methods for analyzing non-isothermal crystallization data [43]. Accordingly, the relative crystallinity, Xt, at temperature, T, is given by the equation:
X ( t ) = 1 exp ( K ( T ) α m )  
where m is the Ozawa exponent and K(T) is the heating rate function. By fitting the double logarithmic form of Equation (4), the values of m and K(T) can be obtained. This model presumes that non-isothermal crystallization is composed of many infinitesimal isothermal steps. It can provide insights on non-isothermal crystallization kinetics as it is substantiated theoretically, but the plots can often be non-linear and prevent the estimation of the exponent [44]. The results of the Ozawa analysis are presented in Figure S3 and Table 1. The Ozawa plots of neat PLA show good linearity, but m is not constant and therefore the Ozawa model cannot accurately describe the non-isothermal crystallization of PLA. Additionally, no linearity appears for the nanocomposites where, in most cases, insufficient R2 values were obtained, or not enough points were available to draw safe conclusions. The inadequacy of the Ozawa theory, when applied to the data of the nanocomposites, suggests that secondary crystallization might occur and that the fold length of the polymer chain depends on the temperature [45,46,47,48,49].

3.1.2. Mo Theory

The approach of Mo [50] for the analysis of non-isothermal crystallization behavior of polymers is derived by a combination of the Avrami and Ozawa equations:
l n α = l n F ( T ) b   l n t  
where b is the ratio of the Avrami and the Ozawa exponents and F(T) is equal to [K(T)/Zt]1/m, where Zt is the rate constant and is a kinetic parameter that refers to the rate required to reach a defined Xc in a given time, related to the diffusivity of crystallization. However, because of their deconvoluted meaning, both F(T) and b cannot be interpreted in a straightforward manner. However, the appearance of Mo plots may hint at changes in the crystallization mechanism [44].
By plotting lnα vs. lnt, the slope and the intercept of the resulting lines give lnF(T) and −b, respectively. The Mo plots of PLA and its nanocomposites are presented in Figure S4, and the corresponding Mo parameters are in Table S2. The values of lnF(t) are in general smaller for the nanocomposites. It has been suggested that smaller F(t) means that, to achieve a certain Xc, the nanocomposites require slower heating rates [51,52]. This model describes the non-isothermal cold crystallization of the PLA composites better than the Ozawa model, especially the sample PLA/TiO2, but the relatively small R2 values of the linear fitting on the data of PLA and its nanocomposites with ZnO and Ag (Table S2) suggest a change of the crystallization mechanism at around 120 °C.

3.2. Activation Energy of Non-Isothermal Cold Crystallization

The activation energy of the non-isothermal cold crystallization of PLA and its composites was calculated with two different methods, those of Kissinger and Friedman. Kissinger’s method determines the activation energy for the transport of the macromolecular segments to the growing surface, which is obtained from the maximum conversion rate. The corresponding formula is [53]:
ln ( α Τ p 2 ) = c o n s t Ε α R T p  
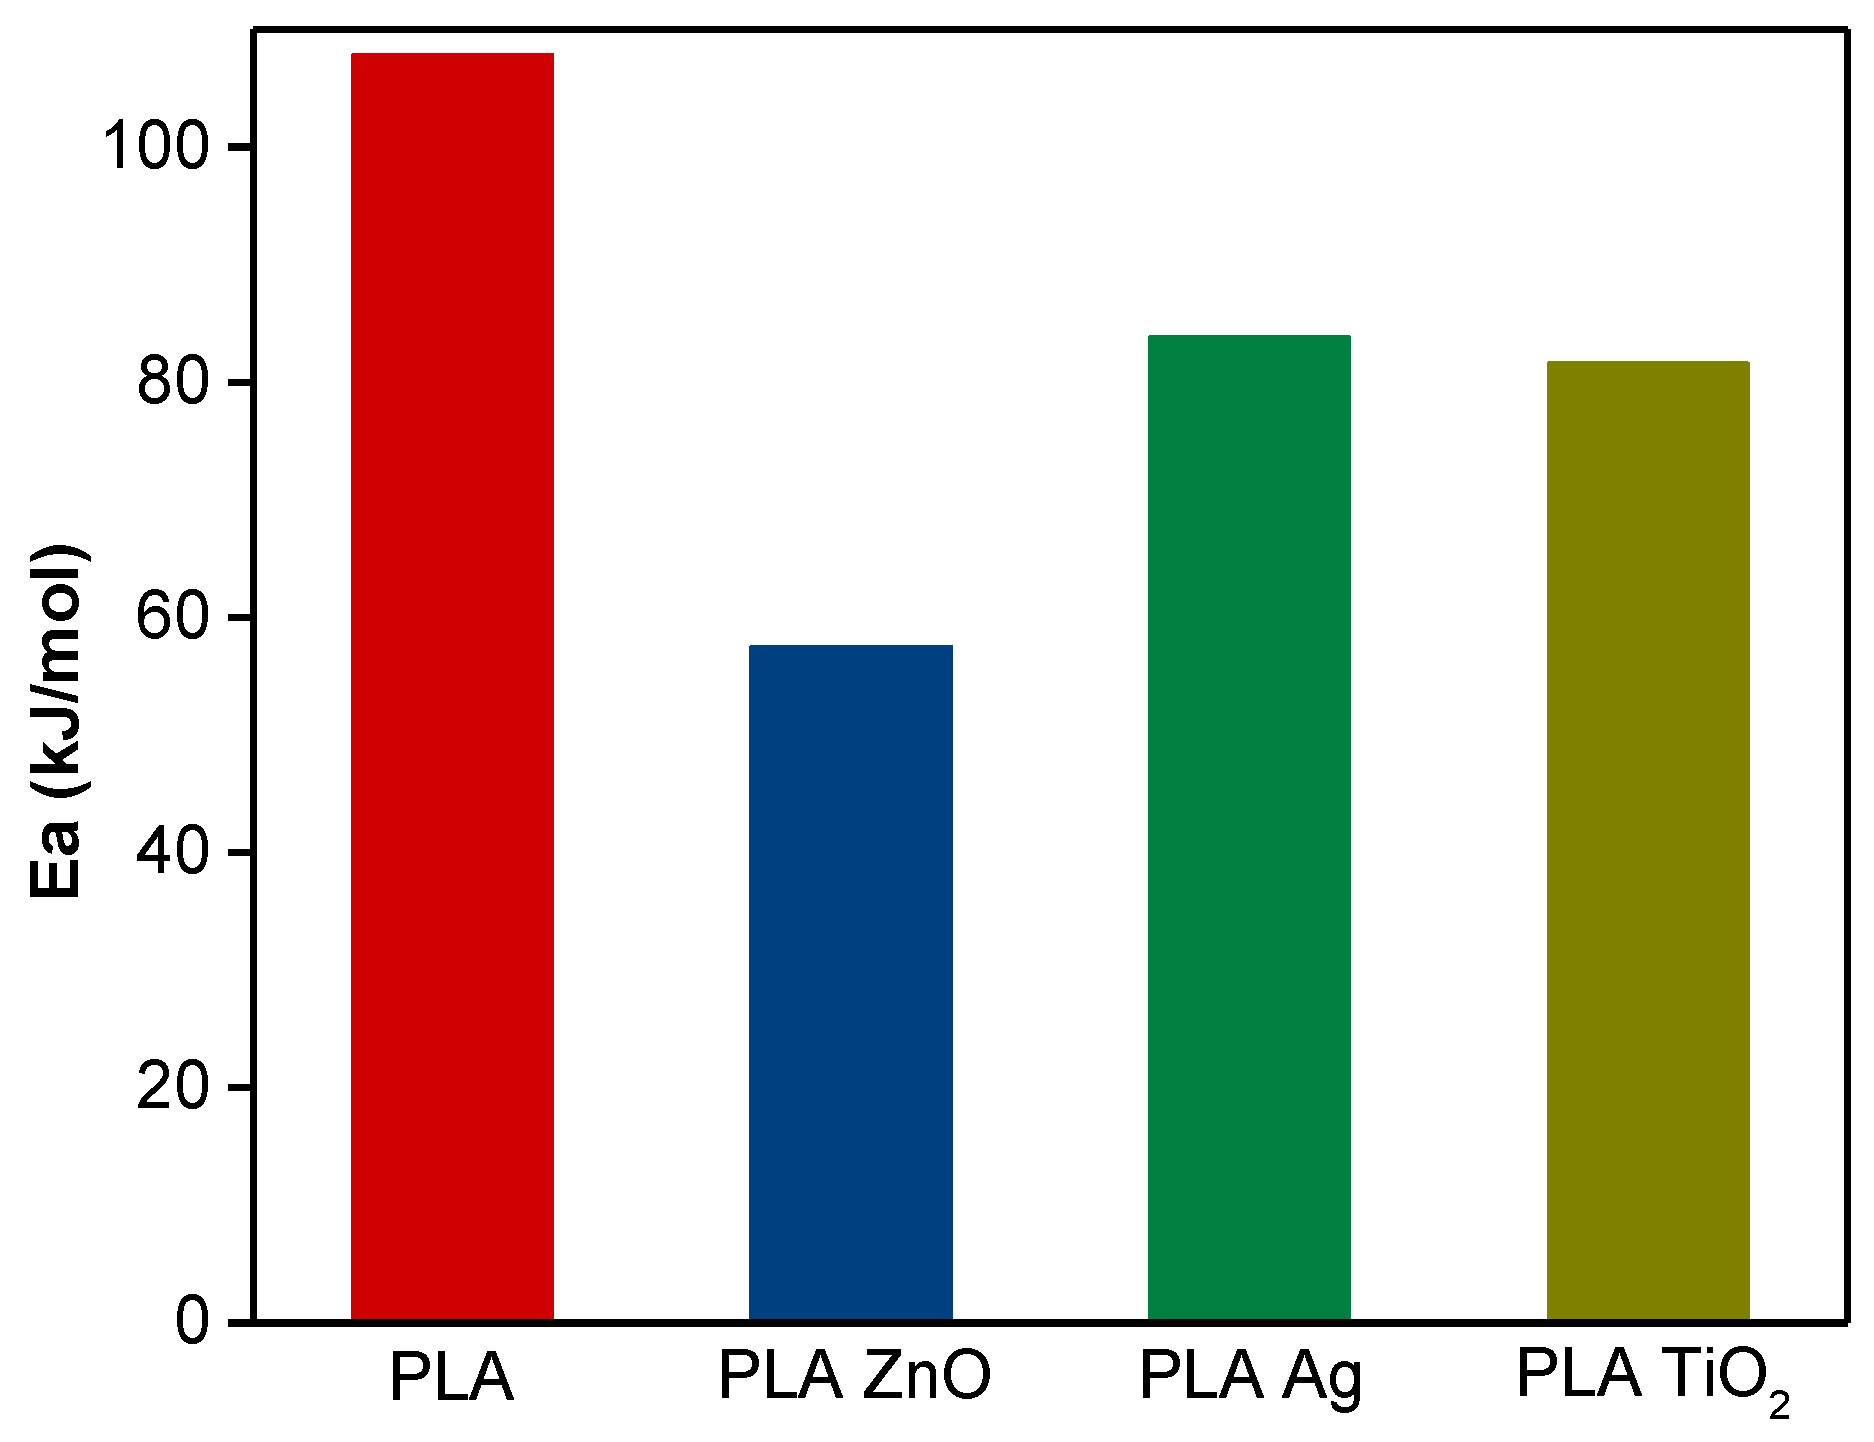
By plotting the left hand of Equation (6) vs. 1/Tp, the graph of Figure S5 is obtained. The Eα values of Figure 3 were calculated by the slope after linear fitting of the data (slope = −Eα/R). The Kissinger method assumes that the process occurs as single-step kinetics and does not describe adequately the complex temperature dependence of the crystallization rate [54,55]. The calculated value of activation energy corresponds to the peak temperature of the crystallization curve and is equal to 107.8 kJ/mol for PLA, in agreement with other studies [56]. All nanocomposites have smaller Eα, suggesting that the filler reduced the energy barrier of the non-isothermal cold crystallization of PLA.
The error caused by the dependence of the extent of conversion on the heating rate when using the Kissinger equation is eliminated by using isoconversional methods [55]. The isoconversional method developed by Friedman [57] is the most common differential method used to calculate activation energy of non-isothermal crystallization [58]. The Friedman method allows the calculation of a conversion dependent Eα. The Eα values for different Xt can be calculated by the equation:
ln ( d X d t ) X , i = C o n s t Δ Ε x R T X , i  
where dX/dt is the instantaneous crystallization rate as a function of time at a given conversion X, ΔEX is the effective activation energy at a given conversion X, TX,i is the set of temperatures related to a given conversion X at different heating rates αi, and the subscript i refers to each individual heating rate used. By plotting the left-hand side of the logarithmic form of Equation (7) with respect to 1/TX, the graphs of Figure S6 were obtained, with a slope equal to −ΔEX/R. The effective activation energy is the sum of the activation energies of nucleation and crystal growth. The resulting ΔEX for different relative crystallinity is shown in Figure 4a. According to the ICTAC Kinetics Committee recommendations for performing kinetic computations on thermal analysis data, estimating the Εα vs. rate dependence is sufficient for making kinetic descriptions [35]. By calculating the average temperature at each relative crystallinity, the temperature dependence of the effective activation energy was extracted and is presented in Figure 4b. It is clear that Eα depends on the temperature, which implies a complex crystallization mechanism. Eα decreases until Xt reaches 50%, and then increases until the completion of crystallization. The same effect is noticed with the variation of crystallization temperature. From Figure 4b, it is evident that all nanocomposites crystallized in a lower average temperature range. This inverted bell shaped curve of the cold-crystallization ΔEx dependency on relative crystallinity and time has been reported before for PLA [48,59,60,61,62] and other aliphatic polyesters [63,64]. Bosq et al. suggested that this deviation from the expected reduction of Eα with the increase of T, which is not consistent with the Hoffman–Lauritzen theory, may be a sign of secondary crystallization [63,65]. All nanocomposites show smaller Εα than neat PLA. The curves of the nanocomposites of Figure 4 shift to lower values almost parallel to the curve of PLA, suggesting their crystallization mechanism is comparable [42]. Similar curves and Εα values have been reported for PLA in the literature [48]. All methods show the same trend in the reduction of Ea, which follows the order: PLA > PLA Ag > PLA TiO2 > PLA ZnO, regardless of the temperature and the conversion.
The method of Friedman can be used to study the Eα-Τ dependence [66]. The resulting values were used for the calculation of the Hoffman–Lauritzen parameters by fitting the equation developed by Vyazovkin and Sbirrazzuoli onto the data [66,67]:
E α = U * T 2 ( T T ) 2 + K g R T m 0 2 T 2 T m 0 T ( T m 0 T ) 2 T
where U* is the activation energy of the segmental jump, T = Tg ─ 30 K, T is the average temperature at a given relative crystallinity, Tm0 is the equilibrium melting temperature (calculated by the linear Hoffman–Weeks method at 443 K, similar to values reported in the literature [68,69,70]), and Kg is the nucleation constant. In contrast with the models derived from the Avrami equation, such as the Ozawa and Mo models, which ignore secondary crystallization and calculate exponents with questionable physical meaning, the U* and Kg are parameters that are physically meaningful in the context of polymer crystallization. The analysis would be more complete with additional data from non-isothermal melt crystallization, but the type of PLA used crystallizes extremely slowly from the melt. The Levenberg–Marquardt method was used as a non-linear fitting algorithm (from the built-in software of Origin Pro 9, from OriginLab Corporation), using only data points corresponding to X < 60% to increase the fit quality [64,71]. In that temperature range, PLA crystallizes according to Regime III, a high-rate nucleation stage where the mean separation of nuclei approaches the width of molecular stems [72]. The resulting values for Kg and U* appear in Table 2.
The U* values are of the same order as the universal value (6.27 kJ/mol). The U* values of PLA nanocomposites were lower than those of PLA, suggesting that the transportation of PLA chains in the presence of the fillers is faster [59]. Both U* and Kg values of neat PLA are in good agreement with those reported in the literature [59]. It was found that Kg values decrease with the incorporation of various fillers, decreasing the energy barrier of the nucleation process [73,74]. This result is consistent with the analysis of crystallization half times, and the measured effective activation energy, as described above.

3.3. Nucleation Activity

Dobreba and Gutzow [75,76] introduced a semi empirical model for the determination of the nucleation activity, φ, of foreign substrates in polymer melts from DSC measurements. φ is a factor by which the word of 3D nucleation decreases with the addition of a foreign substance. When φ ≈ 0 the substance is extremely active, and when φ ≈ 1 then the filler is considered inert. Nucleation activity, φ, can be calculated as follows:
φ = Β * Β
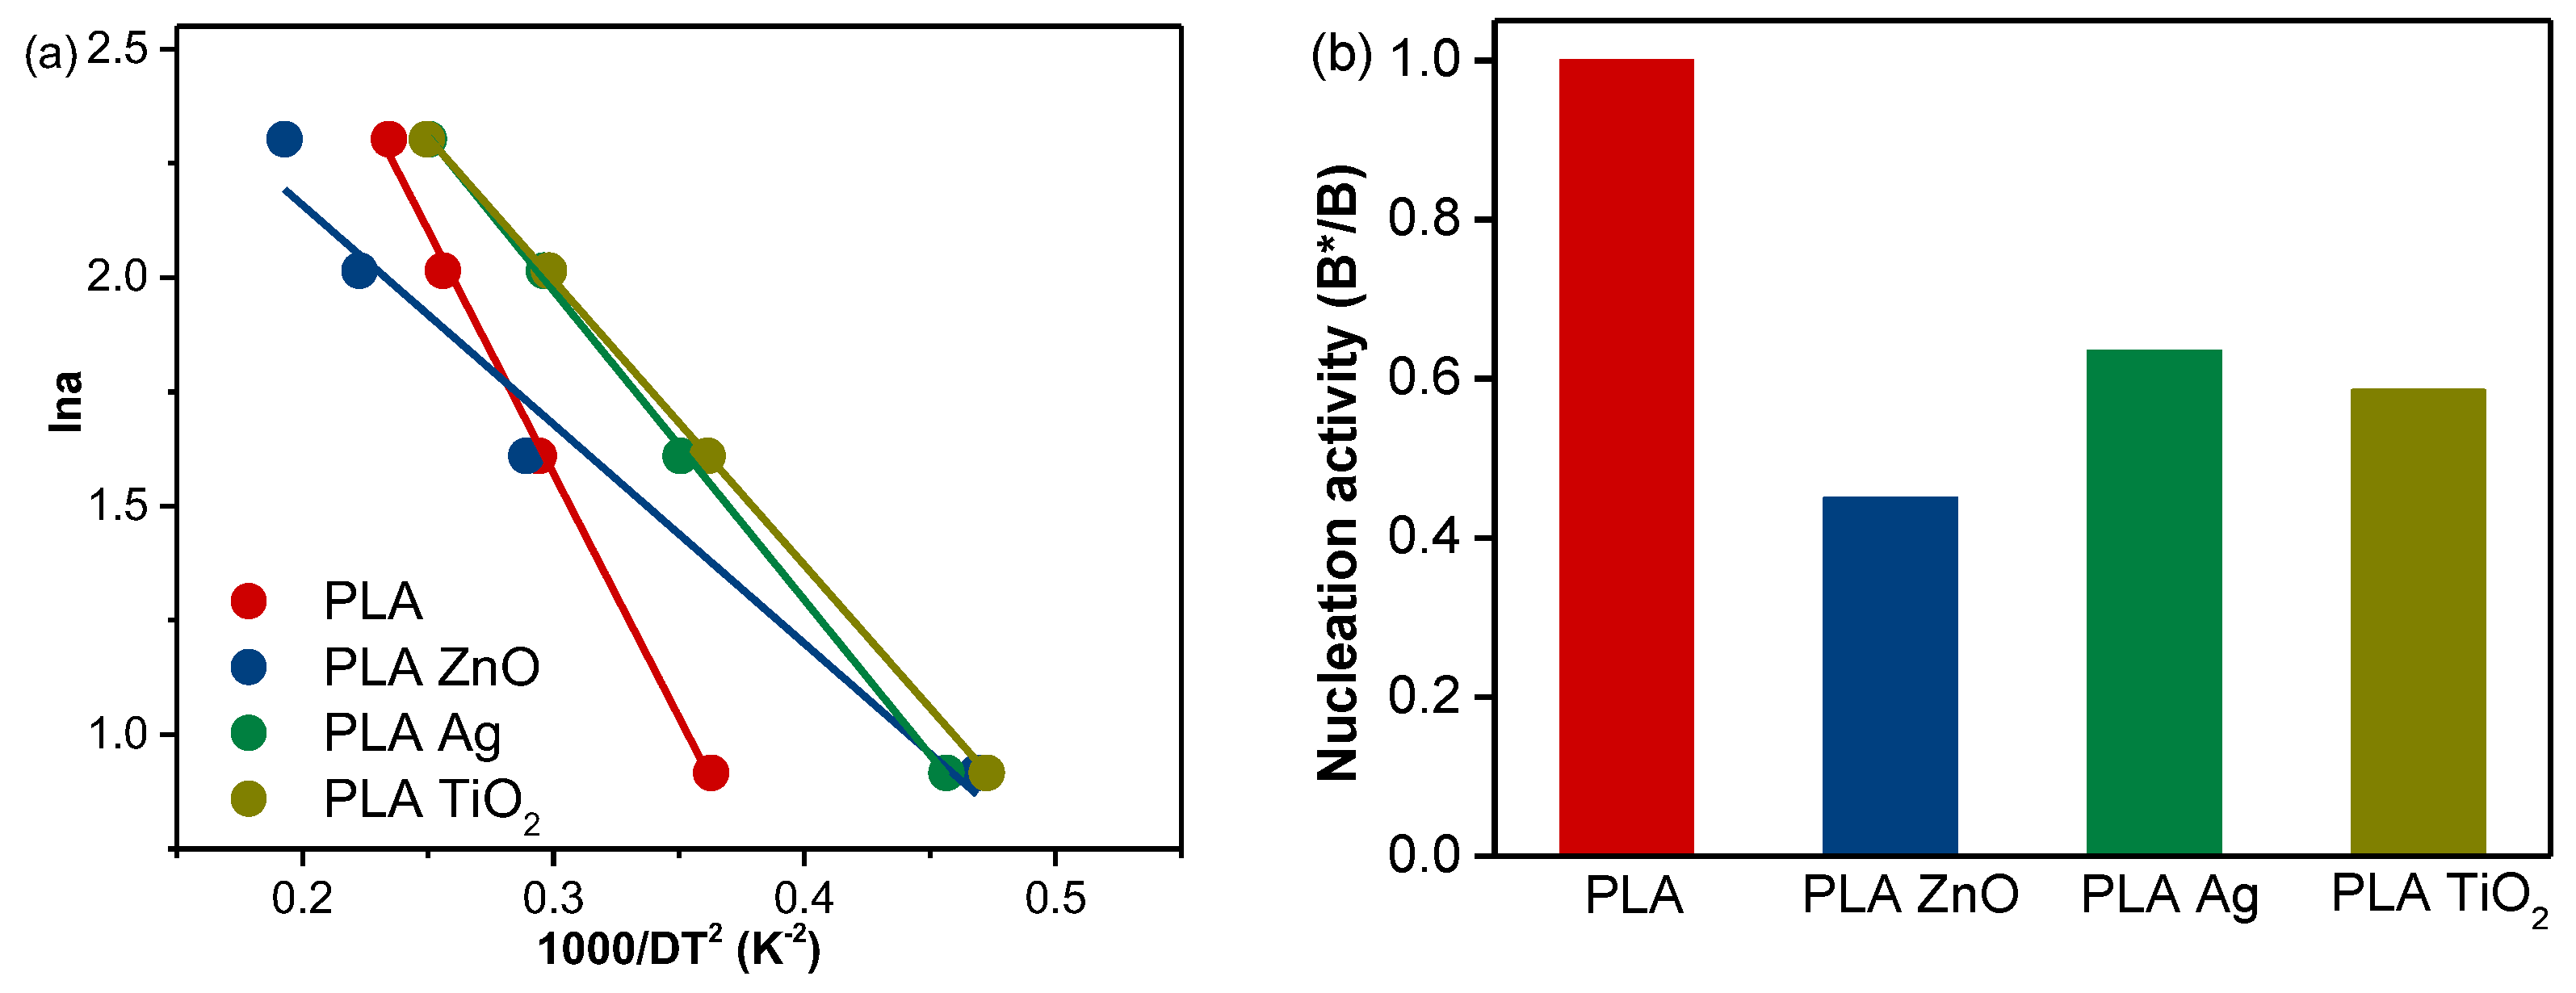
where B is a parameter that can be experimentally determined by the slope of Equation (9) after plotting lnα vs. 1/ΔΤp2, where Tp = TccTg because, in cold crystallization, the TccTg difference is the determining parameter.
l n α = C o n s t B Δ Τ p 2  
In the presence of a nucleating agent, B is replaced by B* in Equation (10). The Dobreva plots of PLA and its nanocomposites are presented in Figure 5a and the calculated φ values in Figure 5b. All nanocomposites have reduced nucleation activity factor φ in comparison with neat PLA, which means they enhanced 3D nucleation and are active as heterogenous nucleating agents. The trend observed for φ is consistent with the trend of activation energy, implying that the activity of the fillers as nucleating agents for the non-isothermal cold crystallization of PLA follows the order ZnO > TiO2 > Ag.

3.4. PLM Observations

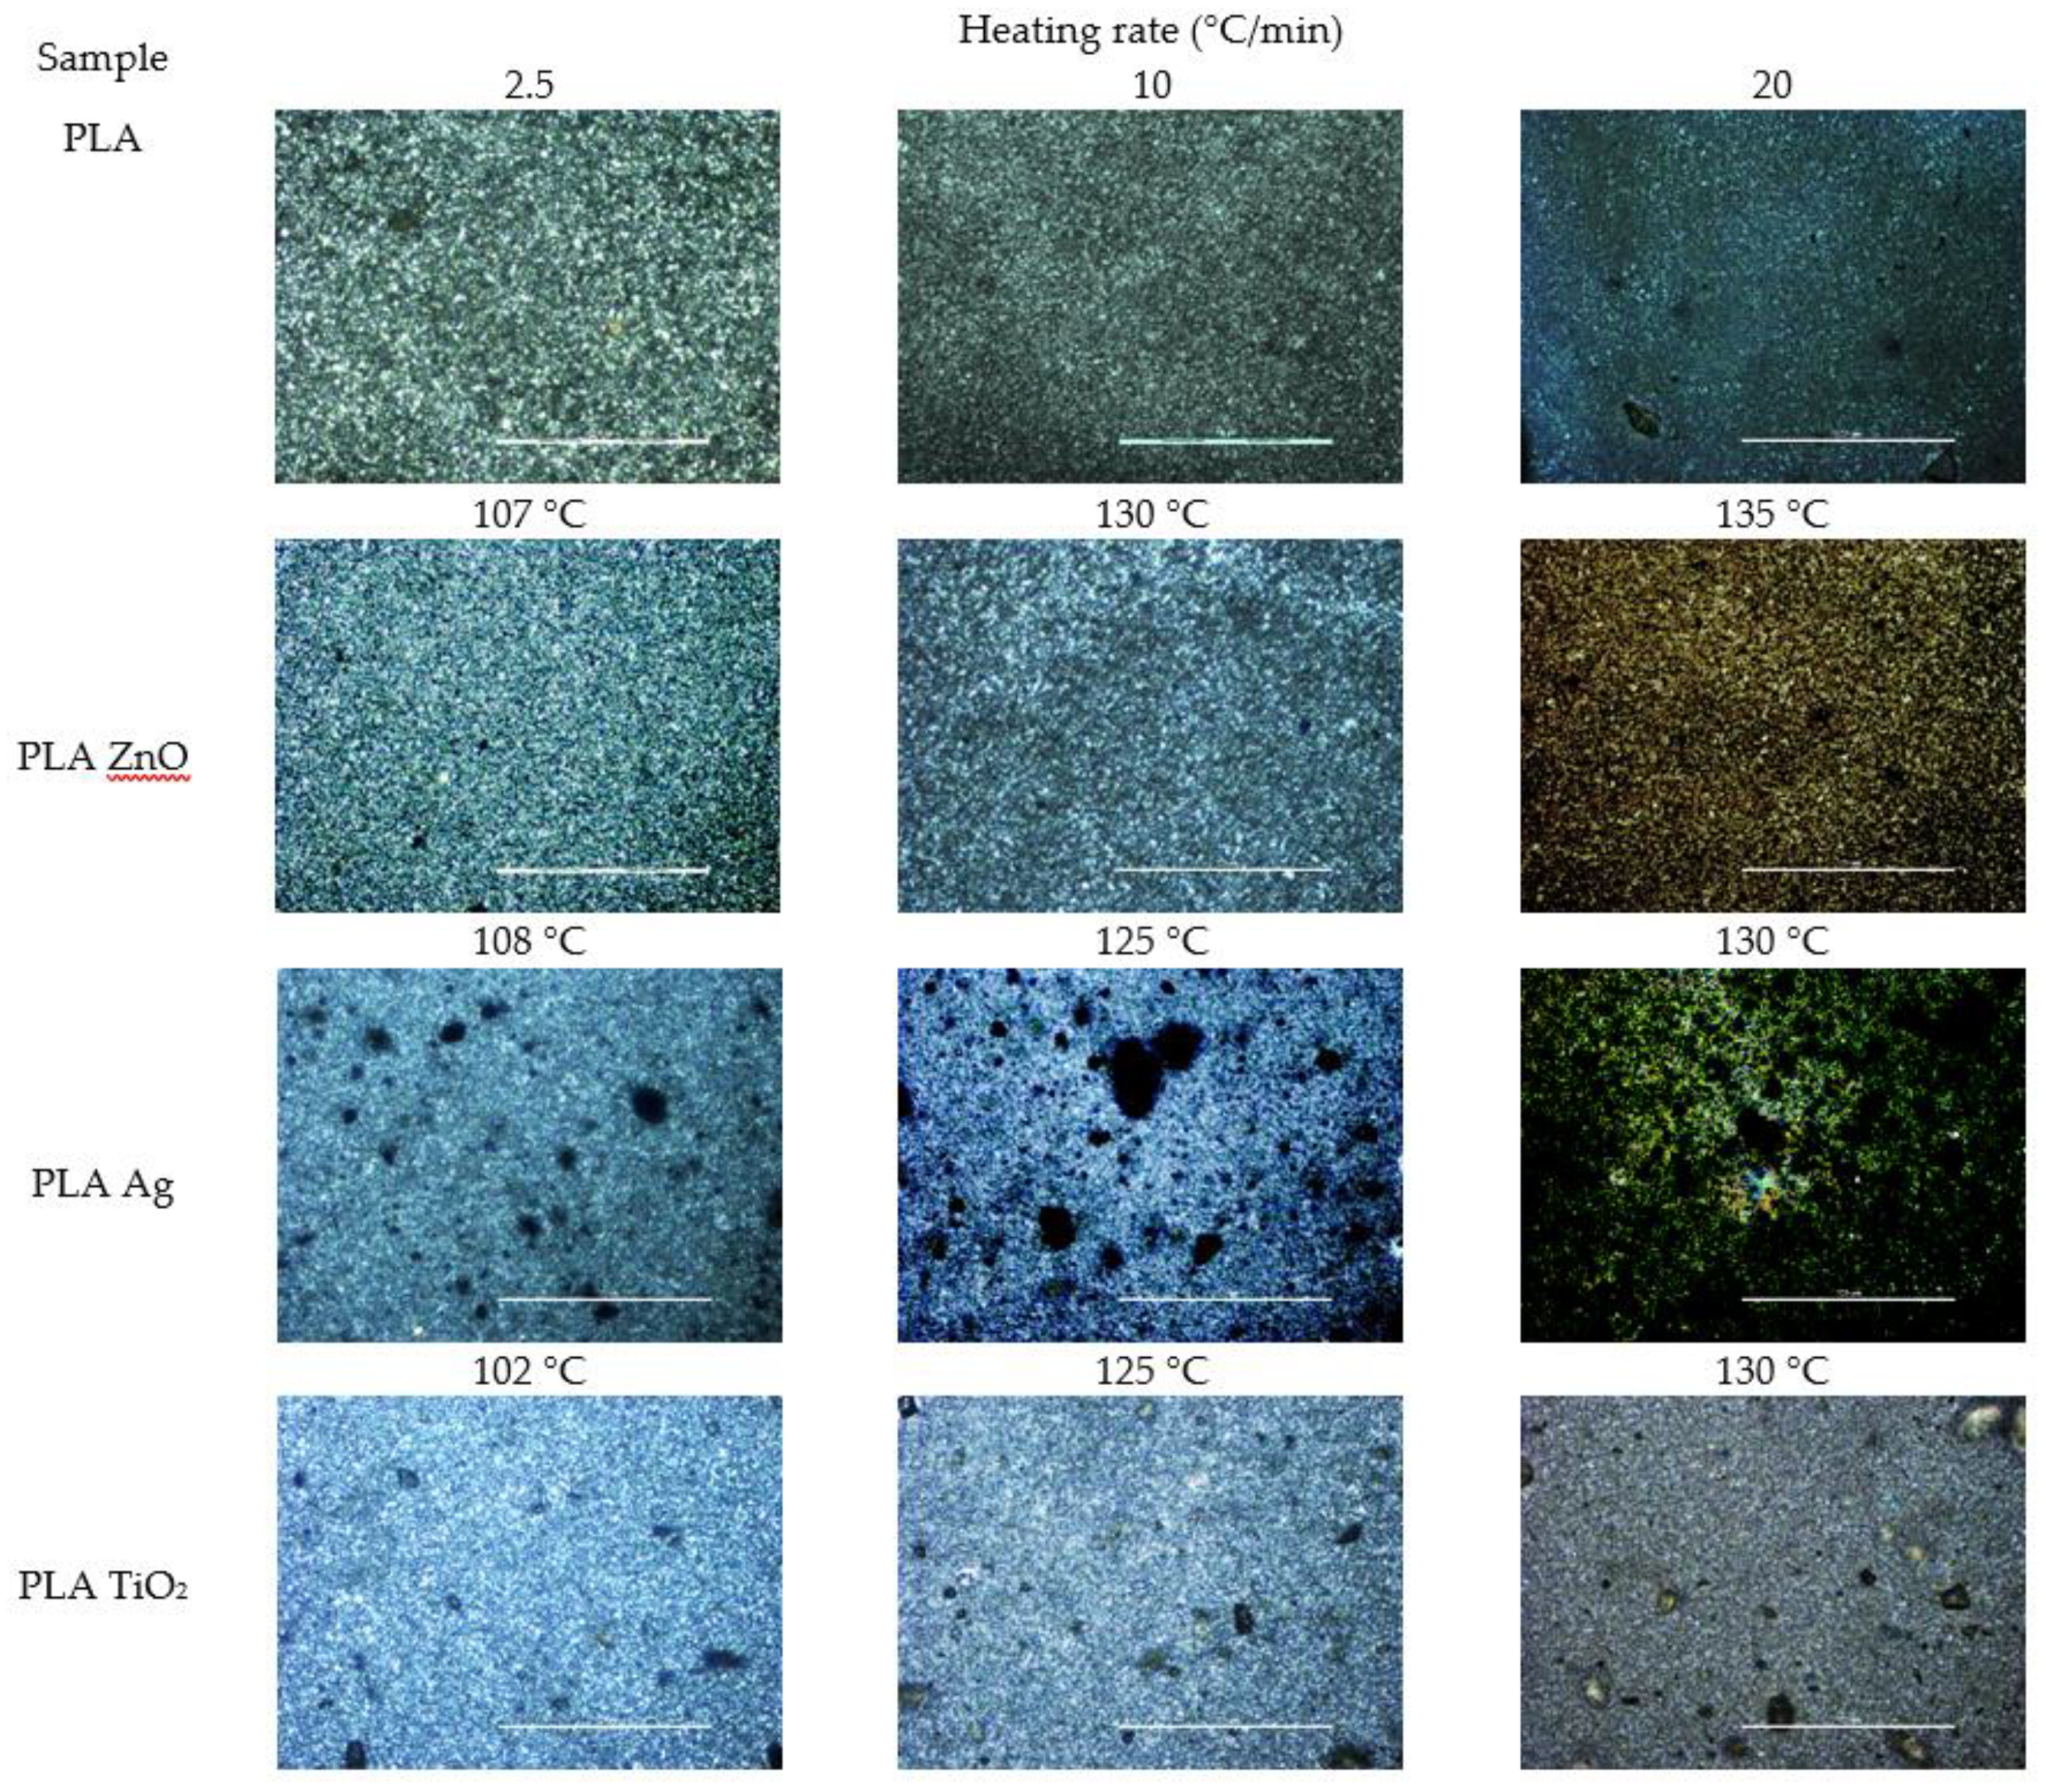
PLM was used to observe the morphology, size, and density of the spherulites formed during the non-isothermal cold crystallization of PLA. In Figure 6, images recorded at heating rates 2.5, 5, and 20 °C/min are shown, along with the temperature at the moment each image was recorded. All samples show small, overlapping spherulites that formed when the appropriate temperature was reached, in agreement with the crystallization temperature ranges of the DSC measurements (Figure S1). The size of the spherulites is slightly smaller in all in comparison with neat PLA; a typical effect of nucleating agents [77,78], which agrees with the faster crystallization rates of the nanocomposites during the non-isothermal cold crystallization. The large aggregates that are visible in the images of PLA Ag might be responsible for it having the smallest effect on the nucleation activity of PLA.

3.5. Thermal Degradation Study of PLA Composites

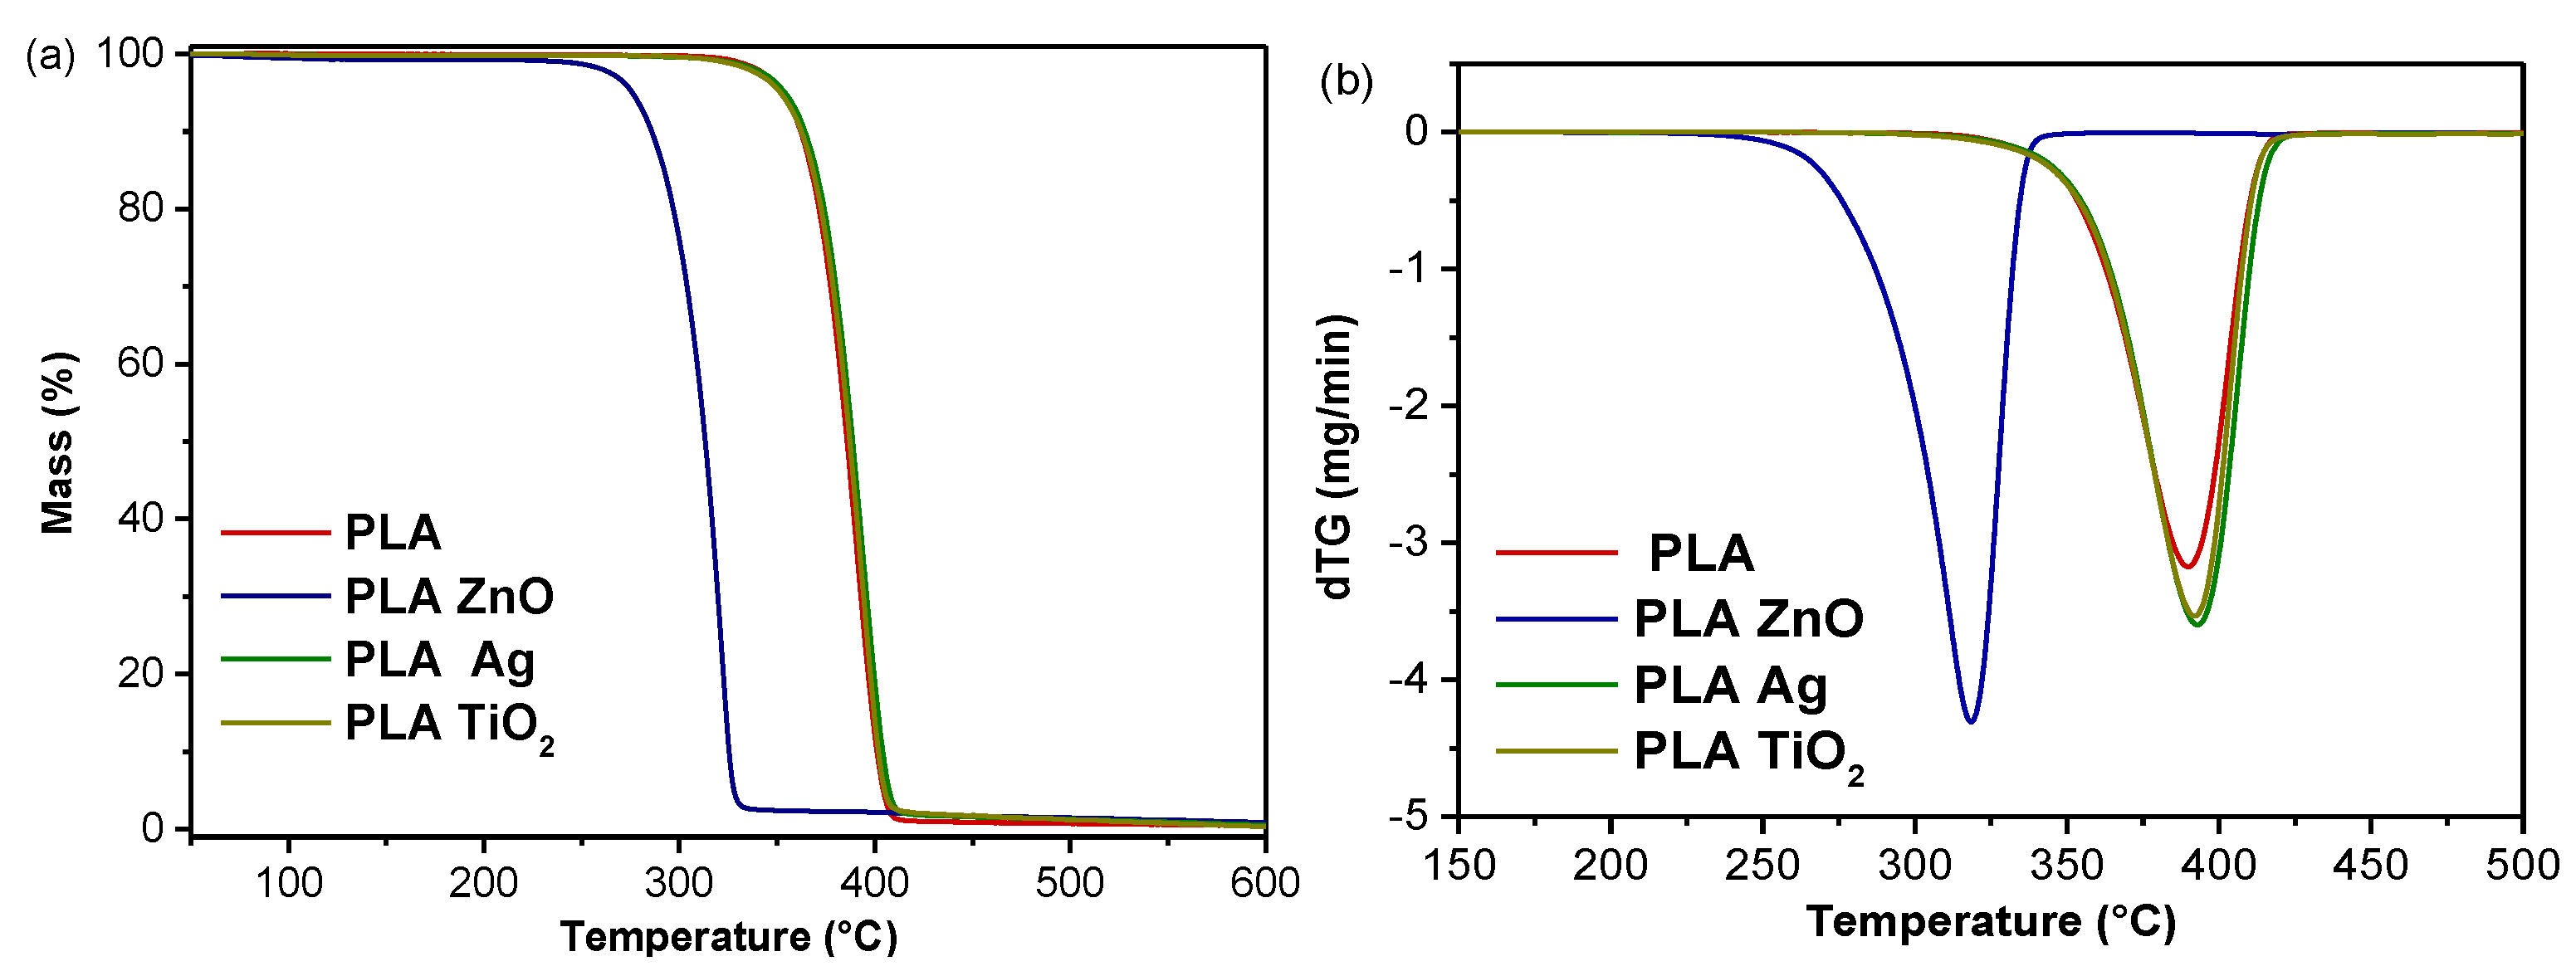
Figure 7 shows the TGA thermograms and Derivative Mass loss (dTG) curves of PLA composites with different metal oxide nanofillers at a heating rate of 20 °C/min. According to Figure 7a, there is no remarkable mass loss until 290 °C for PLA TiO2 and PLA Ag composites, demonstrating their good thermal stability, while the mass loss curves of the samples are almost identical, suggesting a one-step procedure of thermal degradation. The presence of nanofillers is also confirmed by the residue content as the residual amount of the PLA composites was found to be close to the added filler content (1%). It may be noted that the metal oxides are inorganic and thermally stable under the applied conditions, while neat PLA is found to completely burn off. From the dTG curves in Figure 7b, the highest decomposition rates were found to be 389.5 °C, 391.9 °C, and 392.9 °C for neat PLA, PLA TiO2, and PLA Ag composites, respectively, suggesting that the temperature of the maximum decomposition rate increases due to the presence of the TiO2 and Ag nanoparticles. Because only one peak is shown in Figure 7sb, the degradation is carried out as a one-step process for all the PLA composites. For the PLA ZnO composite, the thermal degradation and the maximum decomposition rate were found at 235 °C and 318.6 °C, respectively, far lower than the previous ones. Additionally, the dTG results indicate the catalytic effect of adding ZnO onto the PLA matrix. It can be concluded that ZnO nanoparticles cause a stronger catalytic effect than the TiO2 and Ag fillers, thus decreasing PLA thermal stability [26].
The reaction rate can be defined using the general equation of solid-state reactions:
d a d t = k ( T ) f ( a )
where k(T) is the reaction rate constant, f(α) is the reaction model, and α is the degree of conversion. The kinetic model, f(α), is an algebraic expression that describes the kinetics of the solid-state reaction. The dependence of temperature on the rate of reaction is defined by the Arrhenius equation:
k ( T ) = A e E / R T
where E is the apparent activation energy (kJ/mol), R is the gas constant (8.314 J/mol·K), A is the pre-exponential factor (s−1), and T is the absolute temperature (K).
Thermal decomposition kinetics is performed in two stages: the isoconversional and the model-fitting methods [79]. The basis of the isoconversional methods is the assumption that the conversion function, f(α), does not alter with the change of the heating rate for the entire range of the degree of conversion α. The isoconversional methods are divided into differential and integral methods. The most frequently used methods are the Ozawa, Flynn, and Wall (OFW) analysis [43,80] and the Friedman equation [57]. The accuracy of differential methods is sometimes limited due to a determination limit on the baseline that the method takes, and sometimes they reveal numerical instability compared to integral one. Generally, if the calculated E remains approximately the same for the whole range of the degree of conversion α, a single-step reaction can be concluded with certainty. A variation of E with the degree of conversion α suggests a complex reaction mechanism of two or more steps, which invalidates the separation of variables. These complications are quite important, particularly in the case where competitive mechanisms are involved in the entire reaction.
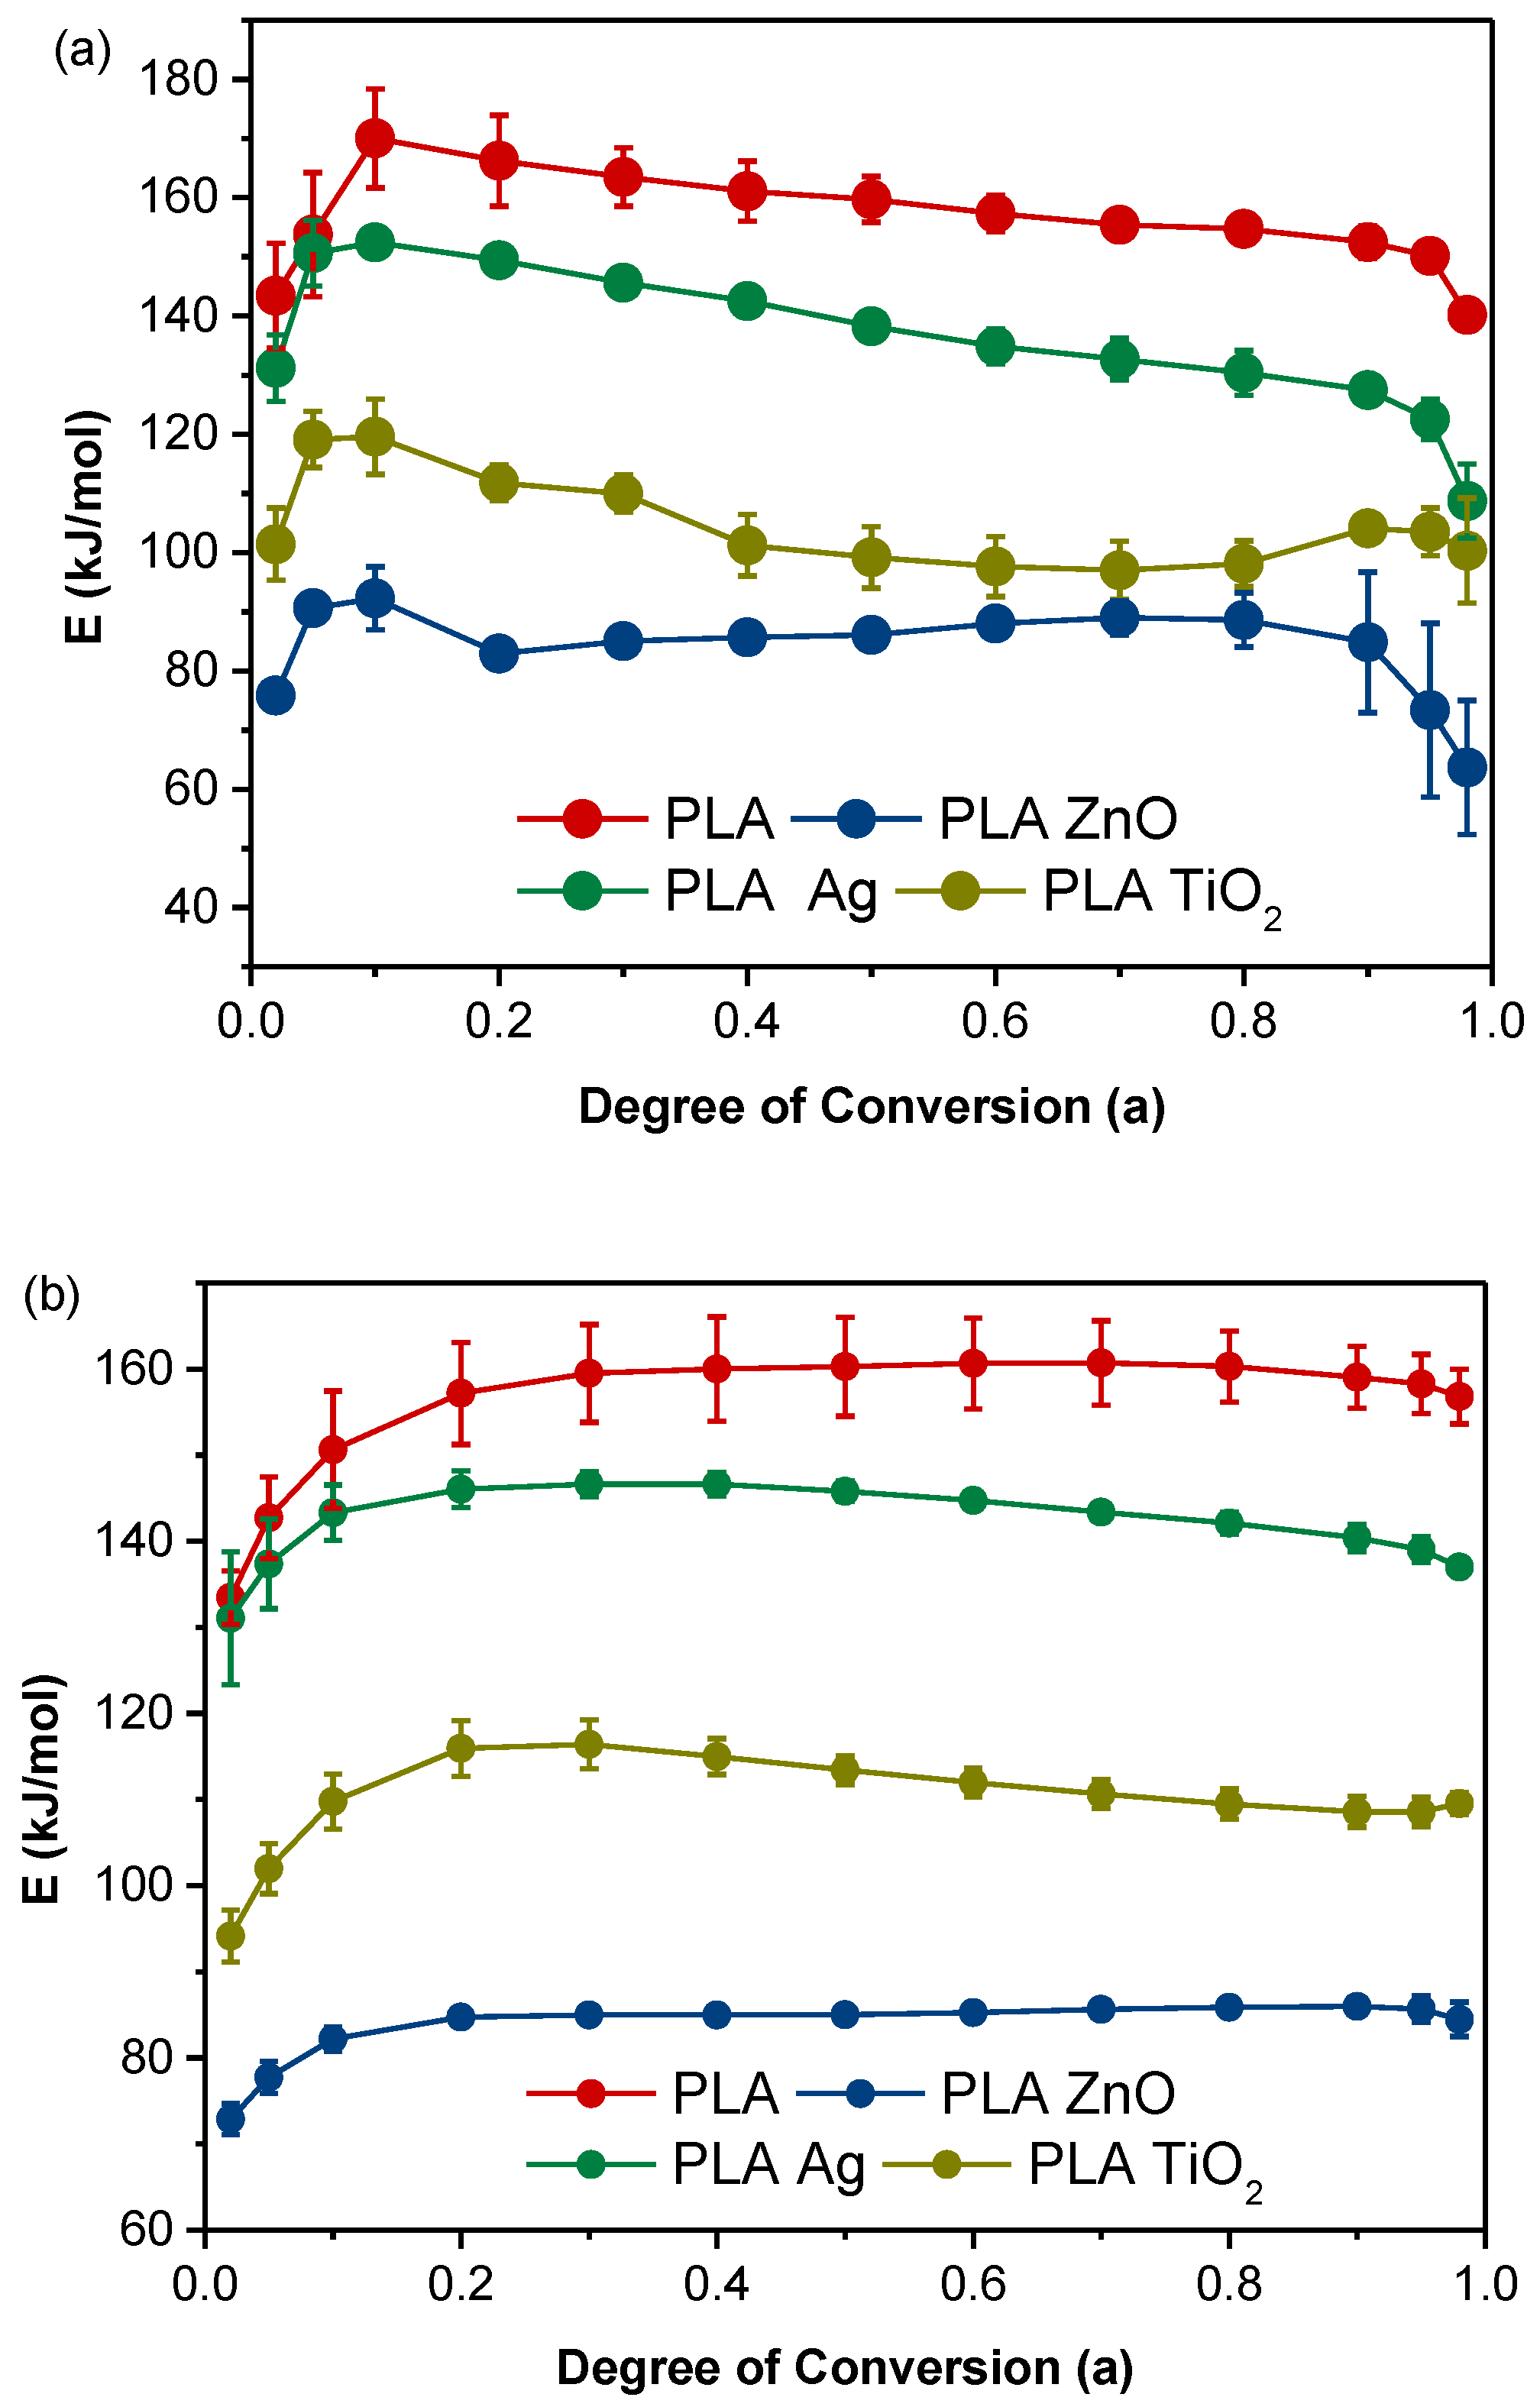
Figure 8 shows the calculated E values versus the degree of conversion α for neat PLA and PLA composites filled with metal oxide nanofillers. The mean E values of neat PLA and PLA TiO2, PLA Ag, and PLA ZnO composites, calculated by the Friedman method, were found to be 156, 136, 105, and 84 kJ/mol, respectively, while the E values were 155, 142, 110, and 84 kJ/mol using the OFW method. The E values for neat PLA and its nanocomposites remain almost constant over the entire conversion range, indicating that one process takes place during the thermal degradation of the samples. Such consideration is plausibly reasonable because similar implications can also be drawn from TGA and 1st dTG results. All PLA nanocomposites have lower E values than neat PLA, followed by the nano-Ag, TiO2, and the nano ZnO, requiring less activation energy to undergo thermal degradation. The trend observed for calculated values is consistent with the trend of non-isothermal cold crystallization analysis, and such catalytic effect follows the order ZnO > TiO2 > Ag, in agreement with literature results [26].
The multivariate non-linear regression method, or model-fitting method, was used to determine the kinetic triplet and the degradation mechanism of PLA composites filled with metal oxide nanofillers [79,81]. The efficiency of each reaction model is estimated by the correlation quality between the experimental and the theoretical results. In this study, the thermal decomposition of the neat PLA and PLA composites filled with metal oxide nanofillers can be best described by the Cn autocatalysis n-order mechanism ( f ( α ) = ( 1 α ) n ( 1 + K c a t X ) ), Figure 9. The addition of the fillers into the PLA matrix has led to no change in the decomposition process, but the catalytic effect turns to prevail over the stabilizing effect, especially in the case of the ZnO filler.
Table 3 presents the calculated E values, pre-exponential factor, and the reaction order for neat PLA and PLA composites with metal oxide nanofillers. It should be noted that that the E values were found to be similar to those determined by the OFW analysis and Friedman’s method (Figure 8). The calculated E value of neat PLA was found to be 159.7 kJ/mol, in agreement with the literature [82,83]. Moreover, the calculated E values of PLA composites suggest that the metal oxide nanofillers, added to the polymer matrix, have led to greatly decreased E and resulted in a substantially higher decomposition rate constant. Once again, all methods show the same trend in the reduction of E, which follows the order: PLA > PLA Ag > PLA TiO2 > PLA ZnO. The pre-exponential factor of the PLA composites presents lower values than neat PLA, in accordance with the calculated E values. This means that the rate constant of PLA composites is significantly larger than that of neat PLA, accelerating the thermal degradation. However, it should be noted that the TiO2 and Ag nanoparticles cause a decrease in the E values of the PLA matrix without affecting the thermal degradation process and thermal stability.

4. Conclusions

The influence of three different metal oxide nanofillers on PLA thermal properties has been studied. Experimental results demonstrated a reduction in the t1/2 of PLA composites during non-isothermal cold crystallization, revealing the heterogenous nucleation efficiency of nanofillers. The Hoffman–Lauritzen theory, combined with the isoconversional approach of Friedman, was applied on the DSC data to study the kinetics of non-isothermal cold crystallization. All nanocomposites show smaller Εα and reduced nucleation activity factor φ compared to neat PLA, which means they enhanced 3D nucleation and are active as heterogeneous nucleating agents. According to PLM observations, the size of the spherulites of nanocomposites was found to be slightly smaller in comparison with neat PLA, which agrees with the faster crystallization rates of the nanocomposites during the non-isothermal cold crystallization. Additionally, the kinetic analysis was performed on PLA nanocomposites through thermogravimetry using the isoconversional and model-fitting methods. The calculated E values of PLA composites suggest that the metal oxide nanofillers, added to the polymer matrix, have led to greatly decreased E and resulted in a substantially higher decomposition rate constant. All methods show the same trend in the reduction of E, which follows the order: PLA > PLA Ag > PLA TiO2 > PLA ZnO. We can conclude that the TiO2 and Ag nanoparticles cause a decrease in the E values of the PLA matrix without affecting the thermal stability and thermal degradation process in the polymer matrix.

Supplementary Materials

The following are available online at https://www.mdpi.com/article/10.3390/app11073004/s1: Figure S1. DSC heating scans of PLA and its composites with heating rates (a) 2.5 °C/min, (b) 5 °C/min, (c) 7.5 °C/min, (d) 10 °C/min, (e) 15 °C/min, (f) 20 °C/min. Figure S2. Relative crystallinity (Xt) as a function of time during non-isothermal cold crystallization. Figure S3. Ozawa plots of the non-isothermal cold crystallization of PLA and its nanocomposites. Figure S4. Mo plots of the non-isothermal cold crystallization of PLA and its nanocomposites. Figure S5. Kissinger plots for the non-isothermal cold crystallization of PLA and its nanocomposites. Figure S6. Friedman plots of PLA and its nanocomposites. Table S1. Thermal characteristics of PLA and its composites obtained from the DSC scans of Figure S1. Table S2. Results of the Mo analysis of the non-isothermal cold crystallization of PLA and its nanocomposites.

Author Contributions

Conceptualization, D.N.B., Z.T., K.C., and L.F.Z.; methodology, Z.T. and E.T.; software, Z.T. and E.T.; validation, Z.T. and E.T.; formal analysis, Z.T., G.Z.P., and E.T.; investigation, K.P.Č., Z.T., A.Z. and E.T.; resources, D.N.B. and L.F.Z.; writing—original draft preparation, Z.T., K.P.Č., and E.T.; writing—review and editing, D.N.B., L.F.Z., Z.T., D.L., and E.T.; visualization, Z.T. and E.T.; supervision, D.N.B., K.C., and L.F.Z. All authors have read and agreed to the published version of the manuscript.

Funding

This research received no external funding.

Institutional Review Board Statement

Not applicable.

Informed Consent Statement

Not applicable.

Data Availability Statement

The data presented in this study are available in the supplementary materials.

Conflicts of Interest

The authors declare no conflict of interest.

References

  1. European Bioplastics e.V. (EUBP), Bioplastics Market Development Update 2020. 2020. Available online: https://www.european-bioplastics.org/news/publications/#MarketData (accessed on 10 February 2021).
  2. Jem, K.J.; Tan, B. The development and challenges of poly (lactic acid) and poly (glycolic acid). Adv. Ind. Eng. Polym. Res. 2020, 3, 60–70. [Google Scholar] [CrossRef]
  3. Chinthapalli, R.; Skoczinski, P.; Carus, M.; Baltus, W.; De Guzman, D.; Käb, H.; Raschka, A.; Ravenstijn, J. Biobased Building Blocks and Polymers—Global Capacities, Production and Trends, 2018–2023. Ind. Biotechnol. 2019, 15, 237–241. [Google Scholar] [CrossRef]
  4. Farah, S.; Anderson, D.G.; Langer, R. Physical and mechanical properties of PLA, and their functions in widespread applicationsA comprehensive review. Adv. Drug Deliv. Rev. 2016, 107, 367–392. [Google Scholar] [CrossRef] [Green Version]
  5. Ngo, T.D.; Kashani, A.; Imbalzano, G.; Nguyen, K.T.Q.; Hui, D. Additive manufacturing (3D printing): A review of materials, methods, applications and challenges. Compos. Part B Eng. 2018, 143, 172–196. [Google Scholar] [CrossRef]
  6. Banerjee, R.; Ray, S.S. An overview of the recent advances in polylactide-based sustainable nanocomposites. Polym. Eng. Sci. 2021. [Google Scholar] [CrossRef]
  7. Sanusi, O.M.; Benelfellah, A.; Bikiaris, D.N.; Aït Hocine, N. Effect of rigid nanoparticles and preparation techniques on the performances of poly(lactic acid) nanocomposites: A review. Polym. Adv. Technol. 2021, 32, 444–460. [Google Scholar] [CrossRef]
  8. Klonos, P.; Terzopoulou, Z.; Koutsoumpis, S.; Zidropoulos, S.; Kripotou, S.; Papageorgiou, G.Z.; Bikiaris, D.N.; Kyritsis, A.; Pissis, P. Rigid amorphous fraction and segmental dynamics in nanocomposites based on poly(L–lactic acid) and nano-inclusions of 1–3D geometry studied by thermal and dielectric techniques. Eur. Polym. J. 2016, 82, 16–34. [Google Scholar] [CrossRef]
  9. Klonos, P.; Kripotou, S.; Kyritsis, A.; Papageorgiou, G.Z.; Bikiaris, D.; Gournis, D.; Pissis, P. Glass transition and segmental dynamics in poly(l-lactic acid)/graphene oxide nanocomposites. Thermochim. Acta 2015, 617, 44–53. [Google Scholar] [CrossRef]
  10. Nerantzaki, M.; Prokopiou, L.; Bikiaris, D.N.; Patsiaoura, D.; Chrissafis, K.; Klonos, P.; Kyritsis, A.; Pissis, P. In situ prepared poly(DL-lactic acid)/silica nanocomposites: Study of molecular composition, thermal stability, glass transition and molecular dynamics. Thermochim. Acta 2018, 669, 16–29. [Google Scholar] [CrossRef]
  11. Shen, X.; Zheng, Q.; Kim, J.K. Rational design of two-dimensional nanofillers for polymer nanocomposites toward multifunctional applications. Prog. Mater. Sci. 2021, 115, 100708. [Google Scholar] [CrossRef]
  12. Zhong, Y.; Godwin, P.; Jin, Y.; Xiao, H. Biodegradable polymers and green-based antimicrobial packaging materials: A mini-review. Adv. Ind. Eng. Polym. Res. 2020, 3, 27–35. [Google Scholar] [CrossRef]
  13. Sarfraz, J.; Gulin-Sarfraz, T.; Nilsen-Nygaard, J.; Pettersen, M.K. Nanocomposites for food packaging applications: An overview. Nanomaterials 2021, 11, 10. [Google Scholar] [CrossRef]
  14. Garcia, C.V.; Shin, G.H.; Kim, J.T. Metal oxide-based nanocomposites in food packaging: Applications, migration, and regulations. Trends Food Sci. Technol. 2018, 82, 21–31. [Google Scholar] [CrossRef]
  15. Liao, C.; Li, Y.; Tjong, S.C. Antibacterial activities of aliphatic polyester nanocomposites with silver nanoparticles and/or graphene oxide sheets. Nanomaterials 2019, 9, 1102. [Google Scholar] [CrossRef] [PubMed] [Green Version]
  16. Azeredo, H.M.C.d. Nanocomposites for food packaging applications. Food Res. Int. 2009, 42, 1240–1253. [Google Scholar] [CrossRef] [Green Version]
  17. Zhang, H.; Hortal, M.; Jordá-Beneyto, M.; Rosa, E.; Lara-Lledo, M.; Lorente, I. ZnO-PLA nanocomposite coated paper for antimicrobial packaging application. LWT Food Sci. Technol. 2017, 78, 250–257. [Google Scholar] [CrossRef]
  18. Shankar, S.; Wang, L.F.; Rhim, J.W. Incorporation of zinc oxide nanoparticles improved the mechanical, water vapor barrier, UV-light barrier, and antibacterial properties of PLA-based nanocomposite films. Mater. Sci. Eng. C 2018, 93, 289–298. [Google Scholar] [CrossRef]
  19. González, E.A.S.; Olmos, D.; Lorente, M.Á.; Vélaz, I.; González-Benito, J. Preparation and characterization of polymer composite materials based on PLA/TiO2 for antibacterial packaging. Polymers 2018, 10, 1365. [Google Scholar] [CrossRef] [Green Version]
  20. Pantani, R.; Gorrasi, G.; Vigliotta, G.; Murariu, M.; Dubois, P. PLA-ZnO nanocomposite films: Water vapor barrier properties and specific end-use characteristics. Eur. Polym. J. 2013, 49, 3471–3482. [Google Scholar] [CrossRef]
  21. Huang, Y.; Wang, T.; Zhao, X.; Wang, X.; Zhou, L.; Yang, Y.; Liao, F.; Ju, Y. Poly(lactic acid)/graphene oxide-ZnO nanocomposite films with good mechanical, dynamic mechanical, anti-UV and antibacterial properties. J. Chem. Technol. Biotechnol. 2015, 90, 1677–1684. [Google Scholar] [CrossRef]
  22. Chu, Z.; Zhao, T.; Li, L.; Fan, J.; Qin, Y. Characterization of antimicrobial poly (lactic acid)/nano-composite films with silver and zinc oxide nanoparticles. Materials 2017, 10, 659. [Google Scholar] [CrossRef] [PubMed] [Green Version]
  23. Erem, A.D.; Ozcan, G.; Erem, H.H.; Skrifvars, M. Antimicrobial activity of poly(l-lactide acid)/silver nanocomposite fibers. Text. Res. J. 2013, 83, 2111–2117. [Google Scholar] [CrossRef]
  24. De Silva, R.T.; Pasbakhsh, P.; Lee, S.M.; Kit, A.Y. ZnO deposited/encapsulated halloysite-poly (lactic acid) (PLA) nanocomposites for high performance packaging films with improved mechanical and antimicrobial properties. Appl. Clay Sci. 2015, 111, 10–20. [Google Scholar] [CrossRef]
  25. Sirotkin, N.A.; Gurina, D.L.; Khlyustova, A.V.; Costerin, D.Y.; Naumova, I.K.; Titov, V.A.; Agafonov, A.V. Experimental and computational investigation of polylactic acid/silver-NP nanocomposite with antimicrobial activity prepared by plasma in liquid. Plasma Process. Polym. 2020. [Google Scholar] [CrossRef]
  26. Wang, X.J.; Huang, Z.; Wei, M.Y.; Lu, T.; Nong, D.D.; Zhao, J.X.; Gao, X.Y.; Teng, L.J. Catalytic effect of nanosized ZnO and TiO2 on thermal degradation of poly(lactic acid) and isoconversional kinetic analysis. Thermochim. Acta 2019, 672, 14–24. [Google Scholar] [CrossRef]
  27. Petchwattana, N.; Narupai, B. Synergistic Effect of Talc and Titanium Dioxide on Poly(lactic acid) Crystallization: An Investigation on the Injection Molding Cycle Time Reduction. J. Polym. Environ. 2019, 27, 837–846. [Google Scholar] [CrossRef]
  28. Mendoza, G.; Peña-Juárez, M.G.; Gonzalez-Calderon, J.A.; Pérez, E. Use of chemically modified titanium dioxide particles to mediate the non-isothermal cold crystallization of poly(latic acid). J. Mex. Chem. Soc. 2020, 64, 44–63. [Google Scholar] [CrossRef]
  29. Nomai, J.; Suksut, B.; Karl Schlarb, A. Crystallization Behavior of Poly(lactic acid)/Titanium Dioxide Nanocomposites. KMUTNB Int. J. Appl. Sci. Technol. 2015, 1–8. [Google Scholar] [CrossRef] [Green Version]
  30. Luyt, A.S.; Gasmi, S. Influence of TiO2 Nanoparticles on the Crystallization Behaviour and Tensile Properties of Biodegradable PLA and PCL Nanocomposites. J. Polym. Environ. 2018, 26, 2410–2423. [Google Scholar] [CrossRef]
  31. Bussiere, P.O.; Therias, S.; Gardette, J.L.; Murariu, M.; Dubois, P.; Baba, M. Effect of ZnO nanofillers treated with triethoxy caprylylsilane on the isothermal and non-isothermal crystallization of poly(lactic acid). Phys. Chem. Chem. Phys. 2012, 14, 12301–12308. [Google Scholar] [CrossRef]
  32. Saeidlou, S.; Huneault, M.A.; Li, H.; Park, C.B. Poly(lactic acid) crystallization. Prog. Polym. Sci. 2012, 37, 1657–1677. [Google Scholar] [CrossRef]
  33. NatureWorks, Crystallizing and Drying of PLA, Tech. Resour. 2007. Available online: http://www.natureworksllc.com/Technical-Resources/4-Series.aspx (accessed on 23 March 2021).
  34. Makovec, D.; Sajko, M.; Selišnik, A.; Drofenik, M. Magnetically recoverable photocatalytic nanocomposite particles for water treatment. Mater. Chem. Phys. 2011, 129, 83–89. [Google Scholar] [CrossRef]
  35. Vyazovkin, S.; Burnham, A.K.; Criado, J.M.; Pérez-Maqueda, L.A.; Popescu, C.; Sbirrazzuoli, N. ICTAC Kinetics Committee recommendations for performing kinetic computations on thermal analysis data. Thermochim. Acta 2011, 520, 1–19. [Google Scholar] [CrossRef]
  36. Kinetics Neo; How Fast Are Your Chemical Reactions? Available online: https://kinetics.netzsch.com/en/ (accessed on 18 February 2021).
  37. Su, Z.; Liu, Y.; Guo, W.; Li, Q.; Wu, C. Crystallization behavior of poly(lactic acid) filled with modified carbon black. J. Macromol. Sci. Part B Phys. 2009, 48, 670–683. [Google Scholar] [CrossRef]
  38. Fortunati, E.; Armentano, I.; Zhou, Q.; Puglia, D.; Terenzi, A.; Berglund, L.A.; Kenny, J.M. Microstructure and nonisothermal cold crystallization of PLA composites based on silver nanoparticles and nanocrystalline cellulose. Polym. Degrad. Stab. 2012, 97, 2027–2036. [Google Scholar] [CrossRef]
  39. Trasi, N.S.; Taylor, L.S. Effect of polymers on nucleation and crystal growth of amorphous acetaminophen. CrystEngComm 2012, 14, 5188–5197. [Google Scholar] [CrossRef]
  40. Papageorgiou, G.Z.; Terzopoulou, Z.; Bikiaris, D.; Triantafyllidis, K.S.; Diamanti, E.; Gournis, D.; Klonos, P.; Giannoulidis, E.; Pissis, P. Evaluation of the formed interface in biodegradable poly(l-lactic acid)/graphene oxide nanocomposites and the effect of nanofillers on mechanical and thermal properties. Thermochim. Acta 2014, 597, 48–57. [Google Scholar] [CrossRef]
  41. Chen, P.; Zhou, H.; Liu, W.; Zhang, M.; Du, Z.; Wang, X. The synergistic effect of zinc oxide and phenylphosphonic acid zinc salt on the crystallization behavior of poly (lactic acid). Polym. Degrad. Stab. 2015, 122, 25–35. [Google Scholar] [CrossRef]
  42. Ries, A.; Canedo, E.L.; Souto, C.R.; Wellen, R.M.R. Non-isothermal cold crystallization kinetics of poly(3-hydoxybutyrate) filled with zinc oxide. Thermochim. Acta 2016, 637, 74–81. [Google Scholar] [CrossRef]
  43. Ozawa, T. Kinetics of non-isothermal crystallization. Polymer 1971, 12, 150–158. [Google Scholar] [CrossRef]
  44. Vyazovkin, S. Nonisothermal crystallization of polymers: Getting more out of kinetic analysis of differential scanning calorimetry data. Polym. Cryst. 2018, 1, e10003. [Google Scholar] [CrossRef]
  45. Li, M.; Hu, D.; Wang, Y.; Shen, C. Nonisothermal crystallization kinetics of poly(lactic acid) formulations comprising talc with poly(ethylene glycol). Polym. Eng. Sci. 2010, 50, 2298–2305. [Google Scholar] [CrossRef]
  46. Somsunan, R.; Mainoiy, N. Isothermal and non-isothermal crystallization kinetics of PLA/PBS blends with talc as nucleating agent. J. Therm. Anal. Calorim. 2020, 139, 1941–1948. [Google Scholar] [CrossRef]
  47. Li, Y.; Han, C.; Yu, Y.; Xiao, L.; Shao, Y. Isothermal and nonisothermal cold crystallization kinetics of poly(l-lactide)/functionalized eggshell powder composites. J. Therm. Anal. Calorim. 2018, 131, 2213–2223. [Google Scholar] [CrossRef]
  48. dos Santos Silva, I.D.; Schäfer, H.; Jaques, N.G.; Siqueira, D.D.; Ries, A.; de Souza Morais, D.D.; Haag, K.; Koschek, K.; Carvalho, L.H.; Ramos Wellen, R.M. An investigation of PLA/Babassu cold crystallization kinetics. J. Therm. Anal. Calorim. 2020, 141, 1389–1397. [Google Scholar] [CrossRef]
  49. Wu, D.; Wu, L.; Wu, L.; Xu, B.; Zhang, Y.; Zhang, M. Nonisothermal cold crystallization behavior and kinetics of polylactide/clay nanocomposites. J. Polym. Sci. Part B Polym. Phys. 2007, 45, 1100–1113. [Google Scholar] [CrossRef]
  50. Liu, T.; Mo, Z.; Wang, S.; Zhang, H. Isothermal melt and cold crystallization kinetics of poly(aryl ether ether ketone ketone) (PEEKK). Eur. Polym. J. 1997, 33, 1405–1414. [Google Scholar] [CrossRef]
  51. Durmus, A.; Ercan, N.; Soyubol, G.; Deligöz, H.; Kaşgöz, A. Nonisothermal crystallization kinetics of poly (ethylene terephthalate)/clay nanocomposites prepared by melt processing. Polym. Compos. 2010, 31, 1056–1066. [Google Scholar] [CrossRef]
  52. Xiong, H.; Gao, Y.; Li, H.M. Non-isothermal crystallization kinetics of syndiotactic polystyrene–polystyrene functionalized SWNTs nanocomposites. Lett 2007, 1, 416–426. [Google Scholar] [CrossRef]
  53. Blaine, R.L.; Kissinger, H.E. Homer Kissinger and the Kissinger equation. Thermochim. Acta 2012, 540, 1–6. [Google Scholar] [CrossRef]
  54. Wellen, R.M.R.; Canedo, E.L. On the Kissinger equation and the estimate of activation energies for non-isothermal cold crystallization of PET. Polym. Test. 2014, 40, 33–38. [Google Scholar] [CrossRef] [Green Version]
  55. Vyazovkin, S. Kissinger Method in Kinetics of Materials: Things to Beware and Be Aware of. Molecules 2020, 25, 2813. [Google Scholar] [CrossRef]
  56. Jin, X.; Chen, X.; Cheng, Q.; Zhang, N.; Cai, S.; Ren, J. Non-isothermal crystallization kinetics of ramie fiber-reinforced polylactic acid biocomposite. RSC Adv. 2017, 7, 46014–46021. [Google Scholar] [CrossRef] [Green Version]
  57. Friedman, H.L. Kinetics of thermal degradation of char-forming plastics from thermogravimetry. Application to a phenolic plastic. J. Polym. Sci. Part C Polym. Symp. 2007, 6, 183–195. [Google Scholar] [CrossRef]
  58. Vyazovkin, S. Activation energies and temperature dependencies of the rates of crystallization and melting of polymers. Polymers 2020, 12, 1070. [Google Scholar] [CrossRef] [PubMed]
  59. El-Taweel, S.H.; Abboudi, M. Nonisothermal crystallization kinetics of PLA/nanosized YVO4 composites as a novel nucleating agent. J. Appl. Polym. Sci. 2020, 137, 48340. [Google Scholar] [CrossRef]
  60. Papageorgiou, G.Z.; Beslikas, T.; Gigis, J.; Christoforides, J.; Bikiaris, D.N. Crystallization and enzymatic hydrolysis of PLA grade for orthopedics. Adv. Polym. Technol. 2010, 29, 280–299. [Google Scholar] [CrossRef]
  61. Patwa, R.; Singh, M.; Kumar, A.; Katiyar, V. Kinetic modelling of thermal degradation and non-isothermal crystallization of silk nano-discs reinforced poly (lactic acid) bionanocomposites. Polym. Bull. 2019, 76, 1349–1382. [Google Scholar] [CrossRef]
  62. Zhao, Y.; Qiu, Z.; Yan, S.; Yang, W. Crystallization behavior of biodegradable poly (L-lactide)/multiwalled carbon nanotubes nanocomposites from the amorphous state. Polym. Eng. Sci. 2011, 51, 1564–1573. [Google Scholar] [CrossRef]
  63. Bosq, N.; Guigo, N.; Aht-Ong, D.; Sbirrazzuoli, N. Crystallization of poly (butylene succinate) on rapid cooling and heating: Toward enhanced nucleation by graphene nanosheets. J. Phys. Chem. C 2017, 121, 11915–11925. [Google Scholar] [CrossRef]
  64. Papageorgiou, G.Z.; Bikiaris, D.N.; Achilias, D.S. Effect of molecular weight on the cold-crystallization of biodegradable poly (ethylene succinate). Thermochim. Acta 2007, 457, 41–54. [Google Scholar] [CrossRef]
  65. Bosq, N.; Guigo, N.; Persello, J.; Sbirrazzuoli, N. Melt and glass crystallization of PDMS and PDMS silica nanocomposites. Phys. Chem. Chem. Phys. 2014, 16, 7830–7840. [Google Scholar] [CrossRef] [PubMed]
  66. Vyazovkin, S.; Sbirrazzuoli, N. Isoconversional Approach to Evaluating the Hoffman–Lauritzen Parameters (U* and Kg) from the Overall Rates of Nonisothermal Crystallization. Macromol. Rapid Commun. 2004, 25, 733–738. [Google Scholar] [CrossRef]
  67. Vyazovkin, S.; Sbirrazzuoli, N. Isoconversional Kinetic Analysis of Thermally Stimulated Processes in Polymers. Macromol. Rapid Commun. 2006, 27, 1515–1532. [Google Scholar] [CrossRef]
  68. Jandas, P.J.; Mohanty, S.; Nayak, S.K. Thermal properties and cold crystallization kinetics of surface-treated banana fiber (BF)-reinforced poly (lactic acid)(PLA) nanocomposites. J. Therm. Anal. Calorim. 2013, 114, 1265–1278. [Google Scholar] [CrossRef]
  69. Boonying, S.; Sutapun, W.; Suppakarn, N.; Ruksakulpiwat, Y. Crystallization behavior of vetiver grass fiber-polylactic acid composite. Adv. Mater. Res. 2012, 410, 55–58. [Google Scholar] [CrossRef]
  70. Lee, S.-H.; Wang, S.; Teramoto, Y. Isothermal crystallization behavior of hybrid biocomposite consisting of regenerated cellulose fiber, clay, and poly(lactic acid). J. Appl. Polym. Sci. 2008, 108, 870–875. [Google Scholar] [CrossRef]
  71. Codou, A.; Guigo, N.; van Berkel, J.; de Jong, E.; Sbirrazzuoli, N. Non-isothermal Crystallization Kinetics of Biobased Poly(ethylene 2,5-furandicarboxylate) Synthesized via the Direct Esterification Process. Macromol. Chem. Phys. 2014, 215, 2065–2074. [Google Scholar] [CrossRef]
  72. Papageorgiou, G.Z.; Achilias, D.S.; Nanaki, S.; Beslikas, T.; Bikiaris, D. PLA nanocomposites: Effect of filler type on non-isothermal crystallization. Thermochim. Acta 2010, 511, 129–139. [Google Scholar] [CrossRef]
  73. D’Amico, D.A.; Cyras, V.P.; Manfredi, L.B. Non-isothermal crystallization kinetics from the melt of nanocomposites based on poly(3-hydroxybutyrate) and modified clays. Thermochim. Acta 2014, 594, 80–88. [Google Scholar] [CrossRef]
  74. Tarani, E.; Papageorgiou, G.Z.; Bikiaris, D.N.; Chrissafis, K. Kinetics of crystallization and thermal degradation of an isotactic polypropylene matrix reinforced with graphene/glass-fiber filler. Molecules 2019, 24, 1984. [Google Scholar] [CrossRef] [PubMed] [Green Version]
  75. Dobreva, A.; Gutzow, I. Activity of substrates in the catalyzed nucleation of glass-forming melts. II. Experimental evidence. J. Non. Cryst. Solids 1993, 162, 13–25. [Google Scholar] [CrossRef]
  76. Dobreva, A.; Gutzow, I. Activity of substrates in the catalyzed nucleation of glass-forming melts. I. Theory. J. Non. Cryst. Solids 1993, 162, 1–12. [Google Scholar] [CrossRef]
  77. Li, C.; Dou, Q.; Bai, Z.; Lu, Q. Non-isothermal crystallization behaviors and spherulitic morphology of poly(lactic acid) nucleated by a novel nucleating agent. J. Therm. Anal. Calorim. 2015, 122, 407–417. [Google Scholar] [CrossRef]
  78. Terzopoulou, Z.; Papageorgiou, D.G.; Papageorgiou, G.Z.; Bikiaris, D.N. Effect of surface functionalization of halloysite nanotubes on synthesis and thermal properties of poly(ε-caprolactone). J. Mater. Sci. 2018, 53, 6519–6541. [Google Scholar] [CrossRef]
  79. Terzopoulou, Z.; Tarani, E.; Kasmi, N.; Papadopoulos, L.; Chrissafis, K.; Papageorgiou, D.G.; Papageorgiou, G.Z.; Bikiaris, D.N. Thermal decomposition kinetics and mechanism of in-situ prepared bio-based poly(propylene 2,5-furan dicarboxylate)/graphene nanocomposites. Molecules 2019, 24, 1717. [Google Scholar] [CrossRef] [Green Version]
  80. Ozawa, T. A New Method of Analyzing Thermogravimetric Data. Bull. Chem. Soc. Jpn. 1965, 38, 1881–1886. [Google Scholar] [CrossRef] [Green Version]
  81. Tarani, E.; Terzopoulou, Z.; Bikiaris, D.N.; Kyratsi, T.; Chrissafis, K.; Vourlias, G. Thermal conductivity and degradation behavior of HDPE/graphene nanocomposites: Pyrolysis, kinetics and mechanism. J. Therm. Anal. Calorim. 2017, 129, 1715–1726. [Google Scholar] [CrossRef]
  82. Chrissafis, K. Detail kinetic analysis of the thermal decomposition of PLA with oxidized multi-walled carbon nanotubes. Thermochim. Acta 2010, 511, 163–167. [Google Scholar] [CrossRef]
  83. Zou, H.; Yi, C.; Wang, L.; Liu, H.; Xu, W. Thermal degradation of poly(lactic acid) measured by thermogravimetry coupled to Fourier transform infrared spectroscopy. J. Therm. Anal. Calorim. 2009, 97, 929–935. [Google Scholar] [CrossRef]
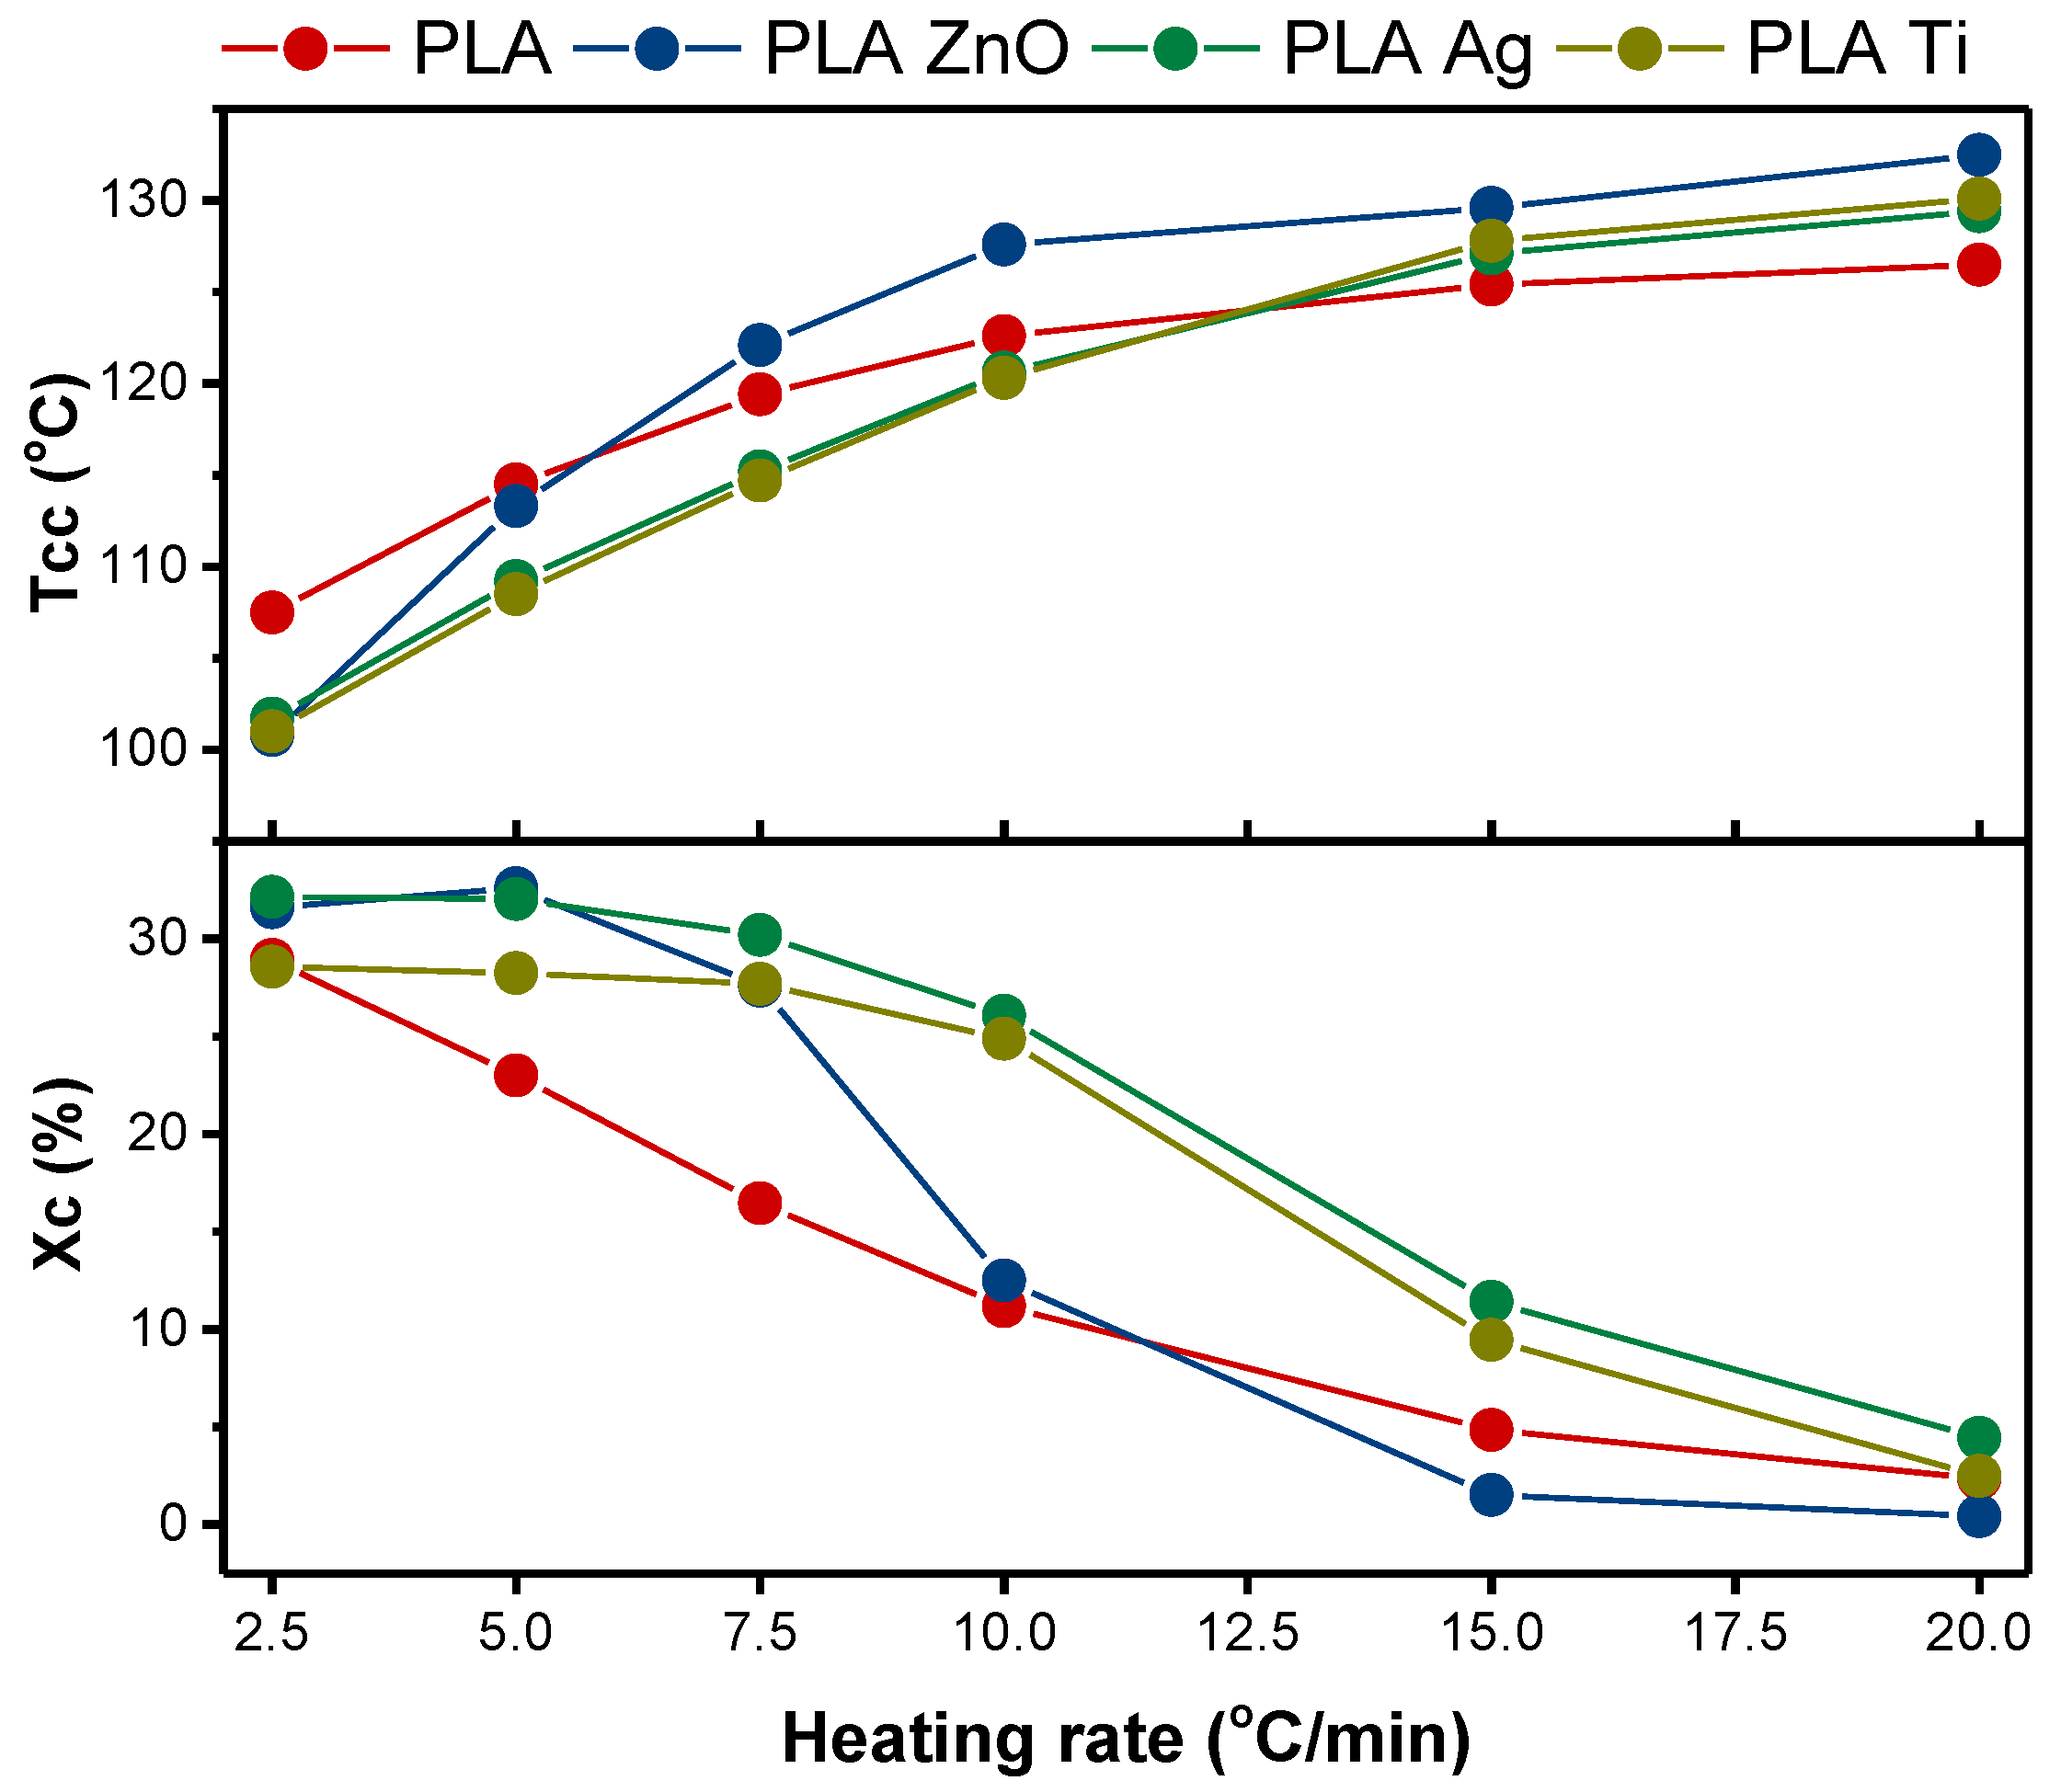
Figure 1. Effect of the heating rate and fillers on the final % crystallinity and the peak temperature of cold crystallization.
Applsci 11 03004 g001
Figure 2. Effect of filler and heating rate on the crystallization half-time of poly(lactic acid) (PLA) during non-isothermal cold crystallization.
Applsci 11 03004 g002
Figure 3. Activation energy of the non-isothermal cold crystallization of PLA and its nanocomposites calculated by the Kissinger method.
Applsci 11 03004 g003
Figure 4. Dependence of the Friedman effective activation energy on (a) relative crystallinity and (b) the average temperature for PLA and its nanocomposites.
Applsci 11 03004 g004
Figure 5. (a) Dobreva plots and (b) nucleation activity of PLA and its nanocomposites during their non-isothermal cold crystallization after fitting the data of the heating rates 2.5, 5, 7.5, and 10 °C/min.
Applsci 11 03004 g005
Figure 6. PLM images of PLA and its nanocomposites after non-isothermal cold crystallization at various heating rates. The bars represent 100 μm.
Applsci 11 03004 g006
Figure 7. (a) Thermogravimetric analysis (TGA) thermograms and (b) Derivative Mass loss (dTG) curves of PLA and its nanocomposites.
Applsci 11 03004 g007
Figure 8. Calculated activation energy (E) for the thermal degradation of neat PLA and its nanocomposites by using (a) the Friedman method, and (b) the Ozawa, Flynn, and Wall analysis.
Applsci 11 03004 g008
Figure 9. Mass (%) curves and the corresponding fitting curves of (a) neat PLA, (b) PLA ZnO, (c) PLA Ag, and (d) PLA TiO2 at various heating rates.
Applsci 11 03004 g009
Table 1. Ozawa parameters for the non-isothermal cold crystallization of PLA.
Temperature (°C)100105110115120125130
m2.102.281.701.331.090.920.90
K(T)0.593.214.155.286.738.5613.93
R20.953590.978030.999070.998980.997930.996840.97468
Table 2. Calculated Kg and U* values according to the Hoffman–Lauritzen theory combined with the isoconversional approach (R2 ≥ 0.94).
SampleKg (K2)U* (kJ/mol)
PLA3.07 × 105 ± 5.9 × 1045.52 ± 0.21
PLA ZnO1.98 × 105 ± 4.8 × 1042.56 ± 0.25
PLA Ag2.96 × 105 ± 5.6 × 1044.45 ± 0.25
PLA TiO22.41 × 105 ± 5.2 × 1043.76 ± 0.19
Table 3. Activation energy, pre-exponential factor, and reaction order of neat PLA and PLA composites.
SampleMechanismActivation
Energy/(kJ/mol)
Pre-Exponential
Factor/s−1
Reaction Order/nLog KcatRegression
Coefficient
PLACn159.711.490.980.800.9997
PLA ZnOCn84.54.860.641.170.9996
PLA AgCn143.58.960.880.920.9998
PLA TiO2Cn110.96.010.921.330.9998
Publisher’s Note: MDPI stays neutral with regard to jurisdictional claims in published maps and institutional affiliations.