Article

CO2 Carbonation of Olivine-Admixed Marine Clay: Suitability for Bottom Liner Application

1
Civil Engineering Discipline, School of Engineering, Monash University Malaysia, Jalan Lagoon Selatan, Bandar Sun way, Subang Jaya 47500, Selangor, Malaysia
2
Institute of Energy Infrastructure, Universiti Tenaga Nasional, Jalan IKRAM-UNITEN, Kajang 43000, Selangor, Malaysia
3
Civil Engineering Discipline, International College of Auckland, 520 Queen Street, Auckland 1010, New Zealand
*
Authors to whom correspondence should be addressed.
Appl. Sci. 2021, 11(7), 3164; https://doi.org/10.3390/app11073164
Submission received: 11 February 2021 / Revised: 6 March 2021 / Accepted: 16 March 2021 / Published: 2 April 2021

Abstract

:
This paper focuses on employing an optimization approach in evaluating the hydraulic conductivity (HC) of CO2-carbonated olivine-admixed marine clay for possible utilization as a hydraulic barrier in engineered landfills to minimize leachate migration. The attainable region technique was used to optimize the olivine particle size during the grinding process before treating the soil, while the response surface methodology was used in designing the experiments, evaluating the results, and optimizing the variables responsible for reducing the HC of the CO2-carbonated olivine-treated clay. The effects of the control factors (olivine content, carbonation time, and carbonation pressure) on the response (HC) were studied by variance analysis. The factors and the response were related by a developed regression model. Predicted values from the model were in concurrence with their experimental counterparts. The results show that the HC of the CO2-carbonated olivine-treated clay samples met the Malaysian regulatory specification of ≤10−8 m/s for liner utilization. The optimum conditions were 24.7% olivine content, 20.1 h carbonation time, and 161 kPa carbonation pressure, which decreased the HC by approximately 98%. CO2-carbonation and olivine blend proved to be a sustainable technique to reduce the clay’s HC for possible application as a liner material in engineered landfills.

1. Introduction

Engineered landfills are among the most common and frequently used methods for the disposal of municipal solid waste (MSW) due to their simplicity, reliability, and cost-effectiveness [1,2,3]. Nonetheless, due to three major bioprocesses (hydrolysis, aerobic, and anaerobic degradation), a large amount of leachate with high concentrations of ammonia, heavy metals, organic and inorganic compounds that are harmful to the environment and human health are generated in landfills [4,5]. Besides the production of leachate, landfills also generate a substantial amount of carbon dioxide (CO2) resulting from the decomposition of the wastes deposited in the fill, which accounts for approximately 40–60% v/v of total landfill gas [6,7,8], thus constituting an urgent environmental issue [7]. These generated by-products (leachate and CO2), therefore, have the potential of contaminating the environment, groundwater, and soil if not adequately managed. Consequently, the prevention of soil and groundwater contamination and environmental degradation by the generated leachate and CO2 is still a critical issue associated with engineered landfills.
To isolate the waste in the landfill from the surrounding environment, thereby minimizing soil and groundwater contamination, as well as environmental degradation, various types of hydraulic barriers have been proposed and used in engineered landfills [1,9,10,11,12,13,14]. Over the past years, although landfill technology has seen major advancements, such as the development of synthetic liner materials, compacted clay liners (CCLs), however, still remain a critical component of liner systems in engineered landfills [1,3,12,15]. CCLs are commonly employed in barrier systems owing to their availability, low hydraulic conductivity, excellent compatibility with the permeating leachate, high attenuation capacity, and cost-effectiveness [8,9,16]. However, in the field, CCLs can be damaged during installation. Likewise, after installation, failure mechanisms and environmental conditions including day-night temperature variations, freeze/thaw and dry/wet cycling’s, intrusion of biota, piping, hydraulic fracturing, unequal settlement, and desiccation can cause cracks in the CCLs [12,17,18,19]. These cracks can result in a decrease in the liner strength and an increase in hydraulic conductivity, leading to an increased possibility of groundwater and soil contamination. To improve the liner properties, natural, artificial, and waste materials, as well as advanced techniques, have been of great interest to researchers in recent decades.
Consequently, several studies have been conducted to address the aforementioned problem, among them include the modification of liner properties with various natural, synthetic, and waste additives such as lime, sand, bentonite, fly ash, fuel ash, zeolite, red mud, sepiolite, shale, silica fume, and pozzolan, cement, bagasse ash, etc., [1,18,20,21,22,23,24,25,26,27,28]. A review of the above studies indicates that the various materials can be used to minimize the use of clays as liner materials and improve the liner’s engineering and hydraulic properties. Despite these efforts, there is still no sustainable and cost-effective way to seal cracks and maintain a low permeability throughout the liner’s required operational span. Therefore, developing innovative techniques to overcome this challenge has become of the utmost necessity. Under such circumstances, self-repairing or self-sealing of liner cracks without onerous labor and capital requirement is of great attraction and a state-of-the-art solution for addressing this challenge.
A self-sealing or self-repairing liner is one with the ability to lessen the increased hydraulic conductivity by forming precipitates of low permeability to fill up the pores resulting from the developed cracks [29]. As the precipitates fill the pores, they reduce the hydraulic conductivity and consequently increase the liner’s strength. In recent years, a novel technique employed for minimizing industrial greenhouse emissions involves capturing CO2 by reactive minerals to produce stable products such as carbonates and bicarbonates [30,31]. Studies by Cai et al. [32], Yi et al. [33], Wang et al. [34] indicate that the stable carbonates and bicarbonates produced during this process can minimize the soil voids and increase the strength of soils if such reactive minerals are utilized as additives.
CO2, the most common component of landfill gas constituting about 40–60% v/v after methane, is considered the predominant greenhouse gas on earth due to its adverse effects on the environment. Engineered landfills are generally designed with gas collection systems to capture the generated CO2. Nonetheless, complete capture is not feasible (approximately 84% v/v gas capture for closed landfills, and 67% v/v for open landfills) [6]. Therefore, utilization of this adverse gas by reactive soil liners to improve their strength and hydraulic performance as well as their self-sealing efficiency through mineral carbonation seems a logical option and an innovative technique for counteracting the anthropogenic emissions of CO2 and simultaneously preventing the contamination of groundwater and soil, as well as environmental degradation.
According to ASTM D5370, olivine is a sustainable, cost-effective, and widely available pozzolanic material (material with the ability to form cementitious compounds in the presence of water after reacting) with the potential to enhance soil strength characteristics owing to its strong affinity for CO2 adsorption leading to the formation of stable carbonates with strength enhancement properties [10,35,36]. Olivine carbonation has been and is still a leading mineral for the sequestration process, which involves converting magnesium-rich minerals to stable magnesium carbonate precipitates after reacting with CO2 in the presence of water [37]. The carbonated products may potentially bond the soil particles together, increase strength and reduce hydraulic conductivity. Recently, studies on carbonated olivine-admixed soils focus mainly on the strength characteristic [38,39,40]. However, few if any studies have evaluated the hydraulic conductivity of carbonated olivine soils, which is one of the most critical parameters in assessing the suitability of a material for liner application. Moreover, knowledge about the required olivine particle size to be utilized for carbonation to achieve significant hydraulic conductivity reduction is also lacking. Furthermore, no study has attempted to employ a global optimization technique to optimize the control factors (olivine content, carbonation time, and carbonation pressure) so as to achieve maximum hydraulic conductivity reduction for the carbonated olivine-treated soil. As a result, the right combinations of the control factors for optimum reduction in carbonated-olivine treated soil’s hydraulic conductivity are not obvious.
In view of this, the purpose of the current study was to assess the suitability of CO2 carbonated olivine-admixed marine clay for use as a bottom liner material in engineered landfills to reduce leachate migration while sequestering CO2 from the landfill. The influence of carbonation time, carbonation pressure, and olivine content on the hydraulic conductivity of CO2-carbonated olivine-admixed marine clay was assessed using the attainable region (AR) and response surface methodology (RSM) techniques. The AR method was used to optimize the olivine particle size during the grinding process to get olivine particles in a defined particle size class (−75 µm) before treating the marine clay. The RSM approach was used to design the experiments, analyze the performance, and optimize the factors responsible for achieving significant hydraulic conductivity reduction of the CO2-carbonated olivine-admixed clay. The findings of this study will assist geotechnical and geoenvironmental engineers in designing a smart liner material that would be economically viable, socially acceptable, and environmentally sustainable with the potential to sequester landfill CO2, thus making it superior to the current conventional compacted clay liners. The findings of the study would also promote the use of marine clay typically considered as construction waste to value-added application as a liner material in engineered landfills. The results of the study would also open up a promising perspective for the use of AR and RSM to define the optimal olivine particle size and olivine content in targeting optimum hydraulic conductivity of the olivine-admixed soil during field application.

2. Materials and Methods

2.1. Materials

The basic engineering properties of the marine clay are given in Table 1. The marine clay from Jeram, Selangor, Malaysia, was collected from trial pits at a depth of 3 m. Per the Unified Soil Classification System (USCS), the clay is classified as clay of high plasticity (CH). The plasticity characteristics, grading, standard compaction, and particle density tests were conducted as per [41] standard specification. Silica (SiO2), alumina (Al2O3), and ferric oxide (Fe2O3) were the dominant oxides in the clay, constituting about 75.84% of the total concentration. Quartz and montmorillonite were the dominant clay minerals, with kaolinite, illite, and feldspar occurring in minor phases [35]. The geotechnical characteristics of the clay have been investigated in the past. The results suggest that the clay possesses suitable geotechnical characteristics in terms of grading, plasticity characteristics, and specific gravity, to be used in the construction of a landfill liner material [3].
MAHA Chemicals Sdn Bhd Selangor, Malaysia, supplied the olivine used in the investigation. The olivine had a coarse sand particle size in its received state, which required more grinding to increase the olivine and clay reactivity before adding to the soft marine clay. The significant oxides of the olivine obtained from X-ray fluorescence (XRF) analysis are presented in Table 2. Alpha Gas Solution Sdn. Bhd. Selangor, Malaysia, supplied the CO2 gas (concentration of 99.9%) to carry out the experiments on carbonation.

2.2. Methods

2.2.1. Soil and Olivine Preparation

The marine clay samples were dried in an oven at 105 °C for three days, by which the clay had reached a constant weight. The dried clays were then crushed before testing. The crushed clay samples passing through 2-mm sieve size were blended with the required quantity of olivine according to the experimental design by dry soil mass, prior to CO2-carbonation and hydraulic conductivity testing.
Foreign particles were first removed from the procured olivine by handpicking. The olivine was later sorted by particle size, where batches of about 1.5 kg of olivine were screened using a stack of sieves. Finally, the different masses obtained, ready for testing, were split to constitute about 3000 g representative feed olivine samples (−2000 + 420 µm). The feed samples were kept in plastic bags and stored in the laboratory.

2.2.2. Olivine Comminution Employing the LA Abrasion Test and AR Technique

A Los Angeles (LA) abrasion machine was used to grind the olivine particles to smaller sizes before applying them to the clay so as to improve the reactivity between the olivine and the clay, making it suitable for hydration and subsequent carbonation. The AR technique was employed to optimize the olivine sand particles during the breakage process so as to get particles in a define particle size class. Particles in the fine-sized class (−75 μm) were used to mix with the clay in the current study to promote effective reactivity between the clay and the olivine since the reactivity between olivine and the soil increases with the olivine particle size decreasing.
The representative feed olivine sand particles (approximately 3000 g), together with the grinding steel balls, were fed into an Eco-smartz Los Angeles Abrasion machine (Code: NL 1008 X/003) (see Figure 1) for grinding. The technical specifications of the abrasion machine are given elsewhere [43]. The abrasion machine was adequately cleaned before feeding the olivine particles to prevent contamination, and the machine was then set to begin the grinding. After each grinding duration (200 min), the abrasion machine was stopped, and the contents were removed cautiously and poured into a tray. This procedure was repeated for all the representative feed samples. In this study, 9 steel balls of 0.441 kg, on a 3000 g bed of olivine sand particles upon grinding for 200 min is ideal for obtaining fine olivine size particles (−75 µm), based on our previous investigation [43]. The particle size distribution of the product from the breakage process were then analyzed using the sieve analyses. Precaution was taken to ensure that the sieves were not clogged, and a sieving time of 20 min was employed using a mechanical sieve shaker. Details about the comminution of olivine sand particles using the Los Angeles abrasion test and employing the AR method for the analysis are given elsewhere [43]. In order to better understand the application of the AR method in the optimization of olivine sand comminution, the authors would therefore like to invite interested readers to visit the study. In summary, the AR analysis of our previous study demonstrated that the use of 9 steel balls of 0.441 kg on a 3000 g bed of olivine sand particles upon grinding for 200 min is ideal for obtaining fine olivine size particles (−75 µm), which are required for achieving significant hydraulic conductivity reduction since the reactivity between the soil and olivine increases with the fineness of the olivine particles.

2.2.3. Response Surface Methodology

RSM is a set of mathematical and statistical techniques used for approximating and optimizing stochastic models. The correlation between various control factors and one or more response variables can be investigated by RSM. RSM’s key concept is to use a series of designed experiments to obtain an optimal response. Optimization by RSM constitutes three major steps. First, for tolerable and accurate calculation of the response of interest, conduct statistically designed experiments. Secondly, establish a mathematical relationship between the dependent variable and the independent variable, and finally, predict the response through two-and three-dimensional plots and check the model adequacy [44].

Experimental Design

To design the experiments and model the correlation between the independent variables and the response, a three-factor, three-level Box–Behnken experimental design (BBD) was employed. Olivine content (A), carbonation time (B), and carbonation pressure (C) were the independent variables since olivine CO2 mineralization is significantly influenced by CO2 exposure time and pressure [45]. The response variable was the hydraulic conductivity. To explore the full capacity of the carbonation setup, the high and low levels of the carbonation pressure was selected to cover the operational capacity of the apparatus. The independent variables were set at three levels (+1, −1, 0). Table 3 display the independent variables and their levels in actual and coded values. Fifteen (15) runs, including the three replicated centre points (runs 13–15), were conducted for the randomized order design. The centre points were replicated three times to determine experimental reproducibility. The complete experimental design matrix developed utilizing the software package Design-Expert Version 12 (Stat-Ease, Inc., Minneapolis, MN, USA), along with their obtained experimental responses, are given in Table 4.

Model Development

To determine the relationship between the independent variables and the response, RSM requires a mathematical model. In the current study, the response is well modeled by the following quadratic equation given in Equation (1) [46].
Y = β O + i = 1 n β i X i + i = 1 n β i i X i 2 + i = 1 n j = 1 n β i j X i X j + e
where; Y is the response, n is the number of factors studied, i and j are the index numbers of the factors, β O is the intercept term, β i is the linear coefficient, X i and X j are the coded independent variables, β i i is the quadratic coefficient, β i j is the interaction coefficient, and e is the random error between the predicted and the real experimental values.

Optimization and Validation of Optimized Conditions

Using the desirability function (D) method, numerical optimization was carried out, as shown in Equation (2).
D = d 1 × d 2 × d m 1 / m = i = 1 m d i 1 / m
where m is the number of responses used in the optimization analysis, and di indicates the desirability of the response. D is the function of desirability that reflects how desirable (well-matched) the dependent variables are at a selected level of independent variables. D has a value ranging from zero to one. If D reaches a value different from zero, it is possible to consider all the variables that are optimized simultaneously to have a desirable value. If one or more responses, on the other hand, fall beyond the target limits, di = 0, then D will be zero. Supplementary duplicate tests were performed using the optimized conditions to verify the consistency and reliability of the optimization, and their mean was compared with the predicted values.

Statistical Analysis

Using variance analysis (ANOVA), the significance of the independent variables and their interactions were checked. To assess the statistical significance in all analyses, an alpha (α) of 0.05 was used. The effects of the control factors and their interactions on the response at a specific point in the design space were investigated by perturbation plots. The parameters used to verify the efficacy of the model were: sum of squares, degree of freedom (DoF), prediction error sum of squares (PRESS), mean squares, p-value, and F-value. To assess the fitting extend of the experimental data, regression coefficient (R2) and adjusted R2 were evaluated. From a statistical perspective, the p-values confirmed the accuracy of the model. Also, by evaluating the F-value, the variance of data about the mean was calculated. Moreover, the lack of fit of the established model was estimated at a 95% confidence interval. To visualize the simultaneous effect of each variable on the response while keeping the value of the third variable fixed at the central (0) level, response surface and contour plots were generated.

2.2.4. Carbonation Setup and Hydraulic Conductivity Testing Procedures

The falling-head method was adopted in this study to assess the hydraulic conductivity of the uncarbonated and carbonated olivine-admixed clay specimens, following standard protocols reported in [42]. A schematic diagram of the hydraulic conductivity test setup and the carbonation system used to infuse pressurized gaseous CO2 through the olivine-treated specimens is shown in Figure 2. The samples were prepared by remoulding them at OMC into sample moulds. To minimize the impact of side-wall leakage during testing and to ensure good contact between the compacted sample and the mold, a thin layer of grease was applied to the interior surfaces of the mold before remolding. In order to allow optimum saturation of the specimens, the remolded samples in the molds were submerged in a water tank for a minimum duration of one week, and the specimens were restrained from swelling vertically during saturation. The saturated specimens were then mounted to the falling head permeameter connected to a permeant liquid (tap water) in a flexible tube using the first inlet valve before starting the permeation process. Permeation continued until flow stabilization, and the termination criteria stated in ASTM D 5084 was achieved (i.e., when there was no significant change in hydraulic conductivity over time). Concurrently, during permeation, the specimens were subjected to accelerated downward CO2-carbonation through the second inlet valve, under different carbonation pressures and carbonation times (see Table 4), with the outflow tube placed underwater to detect the gas flow. The outflow valve was closed when the gas flow was detected in the outflow tube while keeping the inlet open, and the carbonation timing began; carbonation then proceeded under the various carbonation pressures for the different carbonation times.
Duplicate tests were conducted on each specimen, and the average hydraulic conductivity was reported. Hydraulic conductivity tests were also conducted on uncarbonated-treated specimens (10%, 20%, and 30% olivine content) after 3, 7, and 14 days curing duration. Using Equation (3), the hydraulic conductivity was calculated.
K = 2.3 a A × L t l o g h 1 h 2
where K is the hydraulic conductivity (cm/s); A is the cross-sectional area of the specimens (cm/s); a is the cross-sectional area of the flexible tube (cm/s); L is the height of the specimen (cm); h1 is the initial height of permeant; h2 is the final height of permeant; ∆t is the time required for the total head to drop from h1 to h2.

3. Results and Discussion

3.1. Hydraulic Conductivity

3.1.1. Hydraulic Conductivity of Olivine-Admixed Soil after Curing

In order to assess the hydraulic conductivity variations of the carbonated and cured specimens, the hydraulic conductivity tests were conducted for different curing durations, using the same olivine content obtained from the experimental design. Figure 3 depicts the effect of olivine content (10%, 20%, and 30%) on the hydraulic conductivity of the treated clay specimens after three, seven, and 14 days of curing. The hydraulic conductivity of the natural clay (8.26 × 10⁻¹⁰ m/s) is presented in Table 1. As observed in Figure 3, the hydraulic conductivity declines steadily with an increase in olivine content and curing time. Nevertheless, the reduction was still within the same order of magnitude (×10−10) as with the natural clay, except for the 30% olivine-admixed specimen after 14 days of curing, which recorded a value of 9.08 × 10⁻¹¹ m/s. The hydraulic conductivity reduced from 8.26 × 10⁻¹⁰ m/s for the natural clay to 8.09 × 10⁻¹⁰ m/s, 7.89 × 10⁻¹⁰ m/s, and 5.97 × 10⁻¹⁰ m/s for 10%, 20%, and 30% olivine-admixed clay samples, respectively, after three days of curing. This finding suggests that, for the test conditions, the stabilization process began after 72 h of curing. The decrease in the size of the inter-aggregate pores due to the formation of the hydration products (M-S-H and M-A-H) is responsible for reducing the hydraulic conductivity at the early stage of curing (three days curing) [35]. This concurs with the trivial decrease in the hydraulic conductivity of the treated specimens relative to the untreated sample.
Similarly, the hydraulic conductivity of the olivine-admixed samples decreased further after seven and 14 days of curing (see Figure 3). The hydraulic conductivity declined from 8.26 × 10⁻¹⁰ m/s for the natural clay to 2.74 × 10⁻¹⁰ m/s, 1.02 × 10⁻¹⁰ m/s, and 9.08 × 10⁻¹¹ m/s for 10%, 20%, and 30% olivine-admixed clay samples, respectively, after 14 days of curing. This finding also indicates that, with an increase in curing duration, the sizes of the inter-aggregate pores decrease, due to the excessive formation of the hydration products, which fills the pores and bind the clay particles together, forming packed and compacted clay particles, thus decreasing the hydraulic conductivity.

3.1.2. Hydraulic Conductivity of Olivine-Admixed Soil after Carbonation

The hydraulic conductivity test results of the olivine-admixed clay at various carbonation times and carbonation pressure are shown in Table 4. As seen from the table, an increase in olivine content, carbonation time, and carbonation pressure reduces the hydraulic conductivity. The lowest hydraulic conductivity of 6.34 × 10⁻¹¹ m/s was recorded for a sample containing 30% olivine content after a carbonating duration of 23.5 h and under a carbonation pressure of 150 kPa. This hydraulic conductivity reduction may be due to the formation of hydrated magnesium carbonates, including nesquehonite (MgCO3.3H2O), hydromagnesite ((Mg)5(CO3)4(OH)2.4H2O), and dypingite ((Mg)5(CO3)4(OH)2.5H2O), as depicted in Equations (4)–(8) [38,40], which fills the pores and binds the clay particles together, forming packed and compacted clay particles. However, it is worth noting that the formation of the various hydrated magnesium carbonate phases is a function of the carbonation pressure and carbonation duration.
Mg 2 SiO 4 + 4 H 2 O 2 Mg OH 2 + H 4 SiO 4
Mg OH 2 + CO 2 MgCO 3 H 2 O
Mg OH 2 + CO 2 + 2 H 2 O MgCO 3 · 3 H 2 O   nesquehonite
5 Mg OH 2 + 4 CO 2 + H 2 O Mg 5 CO 3 4 OH 2 · 5 H 2 O   dypingite
5 Mg OH 2 + 4 CO 2 Mg 5 CO 3 4 OH 2 · 4 H 2 O   hydromagnesite
Cai et al. [47] suggested that magnesium oxide (MgO) carbonation products could promote the filling of pores and soil particle cementation, resulting in structural pores being refined, void ratio reduced, and hydraulic conductivity subsequently reduced. The hydrated magnesium carbonates also form massive crystals with well-ramified networks and effective binding ability, hence resulting in hydraulic conductivity reduction.
A comparative analysis of the hydraulic conductivity of the carbonated olivine-admixed clay and the cured olivine-treated clay was investigated. It is seen from Table 4 and Figure 3 that the hydraulic conductivity of both carbonated olivine-admixed clay and the cured olivine-treated clay samples decline with an increase in olivine content. Nonetheless, the carbonated olivine-admixed clay specimens’ hydraulic conductivities are lower than that of cured olivine-admixed clay specimens at the various olivine contents. For instance, after 14.8 h of carbonation, the percentage decrease in the hydraulic conductivity of both 20% (9.08 × 10⁻¹¹ m/s) and 30% (8.07 × 10⁻¹¹ m/s) olivine-admixed specimens, compared with the corresponding 7 days cured 20% (4.05 × 10⁻¹⁰ m/s) and 30% (2.31 × 10⁻¹⁰ m/s) olivine-stabilized specimens, were approximately 78% and 65%, respectively. The lower hydraulic conductivity values recorded for the carbonated specimens is due to the formation of extra magnesium carbonate phases, including nesquehonite, hydromagnesite, and dypingite, which filled the pores and bind the soil particles together. The findings demonstrate that carbonated olivine-admixed soils could, in a few hours, achieve significant hydraulic conductivity reduction, which is suitable for liner application. The study further confirms olivine as a sustainable soil binder through the sequestration of CO2. It is worth noting that the hydraulic conductivity recorded for both carbonated and cured olivine-admixed clay specimens satisfy the Malaysian regulatory requirement of ≤10−8 m/s for liner utilization specified by the regulatory authority [48].

3.2. Model Development and Statistical Analysis

3.2.1. Model Development

The quadratic model was considered the best fitted and non-aliased model between the control factors and response by applying the regression analysis on the design matrix and the response. The regression model for the hydraulic conductivity (HC) is described in Equations (9) and (10) in terms of actual and coded factors, respectively.
H C = 1.81452 ×   10 9 4.43447 × 10 11 × olivine content 6.97041 × 10 11 × carbonation time 6.95504 × 10 12 × carbonation pressure + 7.35429 × 10 13 × olivine content × carbonation time + 2.16500 × 10 14 × olivine content × carbonation pressure + 3.12571 × 10 14 × carbonation time × carbonation pressure + 5.18583 × 10 13 × olivine content   2 + 1.13578 × 10 12 × carbonation time 2 + 1.90533 × 10 14 × carbonation pressure 2
H C = 9.053 ×   10 11 9.506 × 10 11 × A 1.470 × 10 10 × B 1.725 × 10 11 × C + 6.435 × 10 11 × A B + 1.082 × 10 11 × A C + 1.368 × 10 11 × B C + 5.186 × 10 11 × A 2 + 8.696 × 10 11 × B 2 + 4.763 × 10 11 × C 2
where A, B, and C are the coded terms of the independent variables, olivine content, carbonation time, and carbonation pressure, respectively. In terms of coded factors, the above model is useful for identifying the relative impact of the factors by comparing the factor coefficients. Likewise, in terms of actual factors, the model helps make predictions about the response for each factor given level.

3.2.2. Statistical Analysis

Lack of fit test, test for significance of coefficients of the quadratic model, and the individual model terms were performed to ascertain the model’s accuracy. Commonly, grounded on the F or p-values at 95% confidence level, the significant factors are determined. ANOVA for the hydraulic conductivity quadratic model was performed, and the findings are presented in Table 5.

Statistical Analysis for Response Surface Quadratic Model for Hydraulic Conductivity

Table 5 shows that the model is statistically significant. The F and p-values are respectively 274.17 and <0.0001. There is only a chance of 0.01% probability that an F-value of this magnitude will occur due to noise. Only when the p-values are <0.05 are the model terms significant. In this case, A, B, C, AB, A2, B2, and C2 are significant model terms. Other model terms with p-values > 0.05 are insignificant. Adequate precision, obtained by comparing the range of the predicted value to the average prediction error at the design points, indicates the signal to noise ratio. Normally, a ratio greater than 4 is optimal. The ratio of 53.2329 suggests an adequate signal in this case. Hence, the model can be used to navigate the design space. The determination coefficient (R2) gives a measure of the model’s precision. The model’s R2-value of 0.9980 is close to 1. This implies that 99.80% sample variance is due to the independent variables, and only about 0.2% of the total variation cannot be explained by the model. Therefore, the model’s general ability and accuracy are sound. The predicted R2 of 0.9677 agrees reasonably with the adjusted R2 of 0.9943, i.e., the difference is <0.2. This indicates a high correlation between the observed and predicted values. The coefficient of variations (C.V. %) recorded a low value of 5.86, indicating a high precision of the developed model. These findings indicate that the regression model offers an excellent description of the correlation between the independent variables and the response (hydraulic conductivity).

Model Verification and Adequacy

The residual plots (Figure 4, Figure 5, Figure 6 and Figure 7) were analyzed to check the developed model’s adequacy. The plot of the normal probability versus the internally studentized residuals is shown in Figure 4. As portrayed in the figure, the internally studentized residuals do not deviate considerably from the normal probability line as they are distributed along vertical trajectories, suggesting that they were normally distributed in the model response. Thus, indicating the model’s accuracy in describing the relationship between the independent and dependent variables. A suitable model can also be determined based on the distribution of data points around the mean of the response variable. Figure 5 displays the internally studentized residuals versus the predicted values. From the figure, a random distribution of the residuals between ±3.0 is noted. Thus, indicating that the approximation of the fitted model to the response is reasonably valid with no data recording high error; hence the model is good and reliable in predicting the response. Figure 6 illustrates the relationship between the values of the predicted response and the actual values. It is observed from the figure that the predicted values are in good agreement with the actual values in the operating variable range since most of the values lie along the diagonal line. Therefore, the model is accurately describing the experimental data. Figure 7 portrays the internally studentized residuals versus the run number to assess the satisfactory fit of the developed model. An arbitrary pattern was detected in the residuals vs. run plot, and all the data points fell within the range of control limits (i.e., ±3.0). This indicates the experiments were conducted randomly, thus minimizing any chance of errors and ensuring a good fit. From the observed pattern in Figure 4, Figure 5, Figure 6 and Figure 7, it is evident that the established model can reliably predict the experimental data.
To demonstrate the correlation between the response (hydraulic conductivity) and the independent variables, a perturbation chart (Figure 8) was generated to evaluate the individual and shared effects on the response. It can be observed from Figure 8 that, by increasing the contents of the independent variables, the hydraulic conductivity of the carbonated specimen decreases gradually. Nonetheless, the hydraulic conductivity reduction with increasing carbonation pressure (C) was not very pronounced relative to the other two factors (olivine content (A) and carbonation time (B)). This is also confirmed with a relatively high p-value for carbonation pressure (0.0072) relative to the olivine content (<0.0001) and carbonation time (<0.0001) from the ANOVA analysis.

3.3. The Influence of Independent Variables on the Hydraulic Conductivity

To examine the effect of the independent variables on the response, three-dimensional (3D) surface and contour plots were produced. To this effect, two variables were varying at a time, while the third variable was kept constant at the central (0) level.

The Effect of Independent Variables on the Hydraulic Conductivity

Figure 9 depicts the surface and contour plots of the interactive effect of olivine content and carbonation time on the hydraulic conductivity at constant carbonation pressure (150 kPa). As seen from the figure, the hydraulic conductivity has a decreasing trend at constant carbonation pressure as the olivine content and carbonation time increases within the experimental range. Besides, the olivine content effectiveness on the hydraulic conductivity is more significant at higher carbonation durations, in contrast to the specimen’s carbonated at shorter carbonation durations. Since olivine carbonation and the hydration activity of olivine, leading to the formation of hydrated magnesium carbonates, depends on the CO2 exposure time, hence carbonation duration should be considered a vital parameter of carbonated-olivine-treated soil. Therefore, the interaction of olivine content and carbonation time is vital in decreasing the hydraulic conductivity of olivine-admixed soils.
Figure 10 depicts the effect of carbonation time and carbonation pressure on the hydraulic conductivity of the carbonated admixed-clay at constant olivine content (20%). As observed from the figure, the interactive effect of carbonation time and carbonation pressure is less considerable to decrease the hydraulic conductivity of the carbonated treated-clay relative to the interactive effect of olivine content and carbonation duration (as seen in Figure 9). This could be due to the constant olivine content (20%), which is not the optimum olivine content to facilitate adequate carbonation and the subsequent hydration leading to the formation of the hydrated magnesium carbonates, which contribute to hydraulic conductivity reduction. Nonetheless, increasing carbonation time and carbonation pressure at constant olivine content intensifies the positive impact of each other on decreasing the hydraulic conductivity of the carbonated treated specimen.
The effect of olivine content and carbonation pressure on the hydraulic conductivity at constant carbonation time (14.8 h) is demonstrated in Figure 11 by surface and contour plots. As seen from the figure, the hydraulic conductivity decreases when olivine content increases from 10% to 30% and carbonation pressure increase from 100 to 200 kPa. The formation of hydrated magnesium carbonates is responsible for the decline in the hydraulic conductivity upon adding olivine under varying carbonation pressure at constant carbonation time. These findings demonstrate that olivine content, carbonation time, and carbonation pressure play a critical role in the reduction of the hydraulic conductivity of carbonated-olivine admixed soils since olivine carbonation, and the hydration activity of olivine leading to the formation of hydrated magnesium carbonates depends on the olivine content, CO2 exposure time, and carbonation pressure.

3.4. Optimization and Validation of Optimized Conditions

Table 6 depicts the optimization criteria between the independent variables and the corresponding response employed in the study. From the experimental design, the lower and upper limits were obtained for the independent variables (see Table 3). While the upper limit was set at ≤10−8 m/s for the response, in accordance with [48]. The individual desirability functions (di) for the response and the calculated geometric mean as the maximum overall desirability (D = 1) for solution number 1 is represented in the bar graph as shown in Figure 12. As seen from the figure, both the independent variables and the response all have a desirability function equal to 1. Hence, indicating how well-matched the response is at a selected level of independent variables.
The use of the desirability function for each factor with the pre-selected goal gave an optimized specific response value (see Table 7) and presented in Figure 13 for solution number 1. The ideal hydraulic conductivity value of 2.0 × 10⁻¹¹ m/s was attained at 24.7% olivine content, 20.1 h carbonation time, and 161 kPa carbonation pressure, with a designated maximum desirability function (D = 1.0). Furthermore, 100 desirable solutions for attaining suitable hydraulic conductivity values are recommended. However, only the first 20 of the suggested solutions are reported in this manuscript for the sake of simplicity (see Table 7).
Using the optimal conditions for solutions 1–10, extra duplicate experiments were carried out to compare the predicted results with their experimental equivalents. The mean values of the hydraulic conductivity and the percentage error compared to the model values are presented in Table 8. There is a strong agreement between the experimental values and predicted optimized values of the established model based on the findings. Hence, it can be concluded that the established model is relatively precise for predicting the hydraulic conductivity of the carbonated olivine-admixed clay.

4. Summary and Conclusions

This work investigates the hydraulic conductivity of CO2-carbonated olivine-admixed marine clay for potential use as a liner material in engineered landfills. The AR technique was used to optimize the olivine particle size during the grinding process to get olivine particles in a defined particle size class before treating the marine clay, while RSM was used in designing the experiments, evaluating the results, and optimizing the variables responsible for reducing the hydraulic conductivity of the carbonated olivine-admixed clay. The effects of various factors, including olivine content, carbonation time, and carbonation pressure on the hydraulic conductivity, were studied by ANOVA. The major findings from the study are summarized as follows:
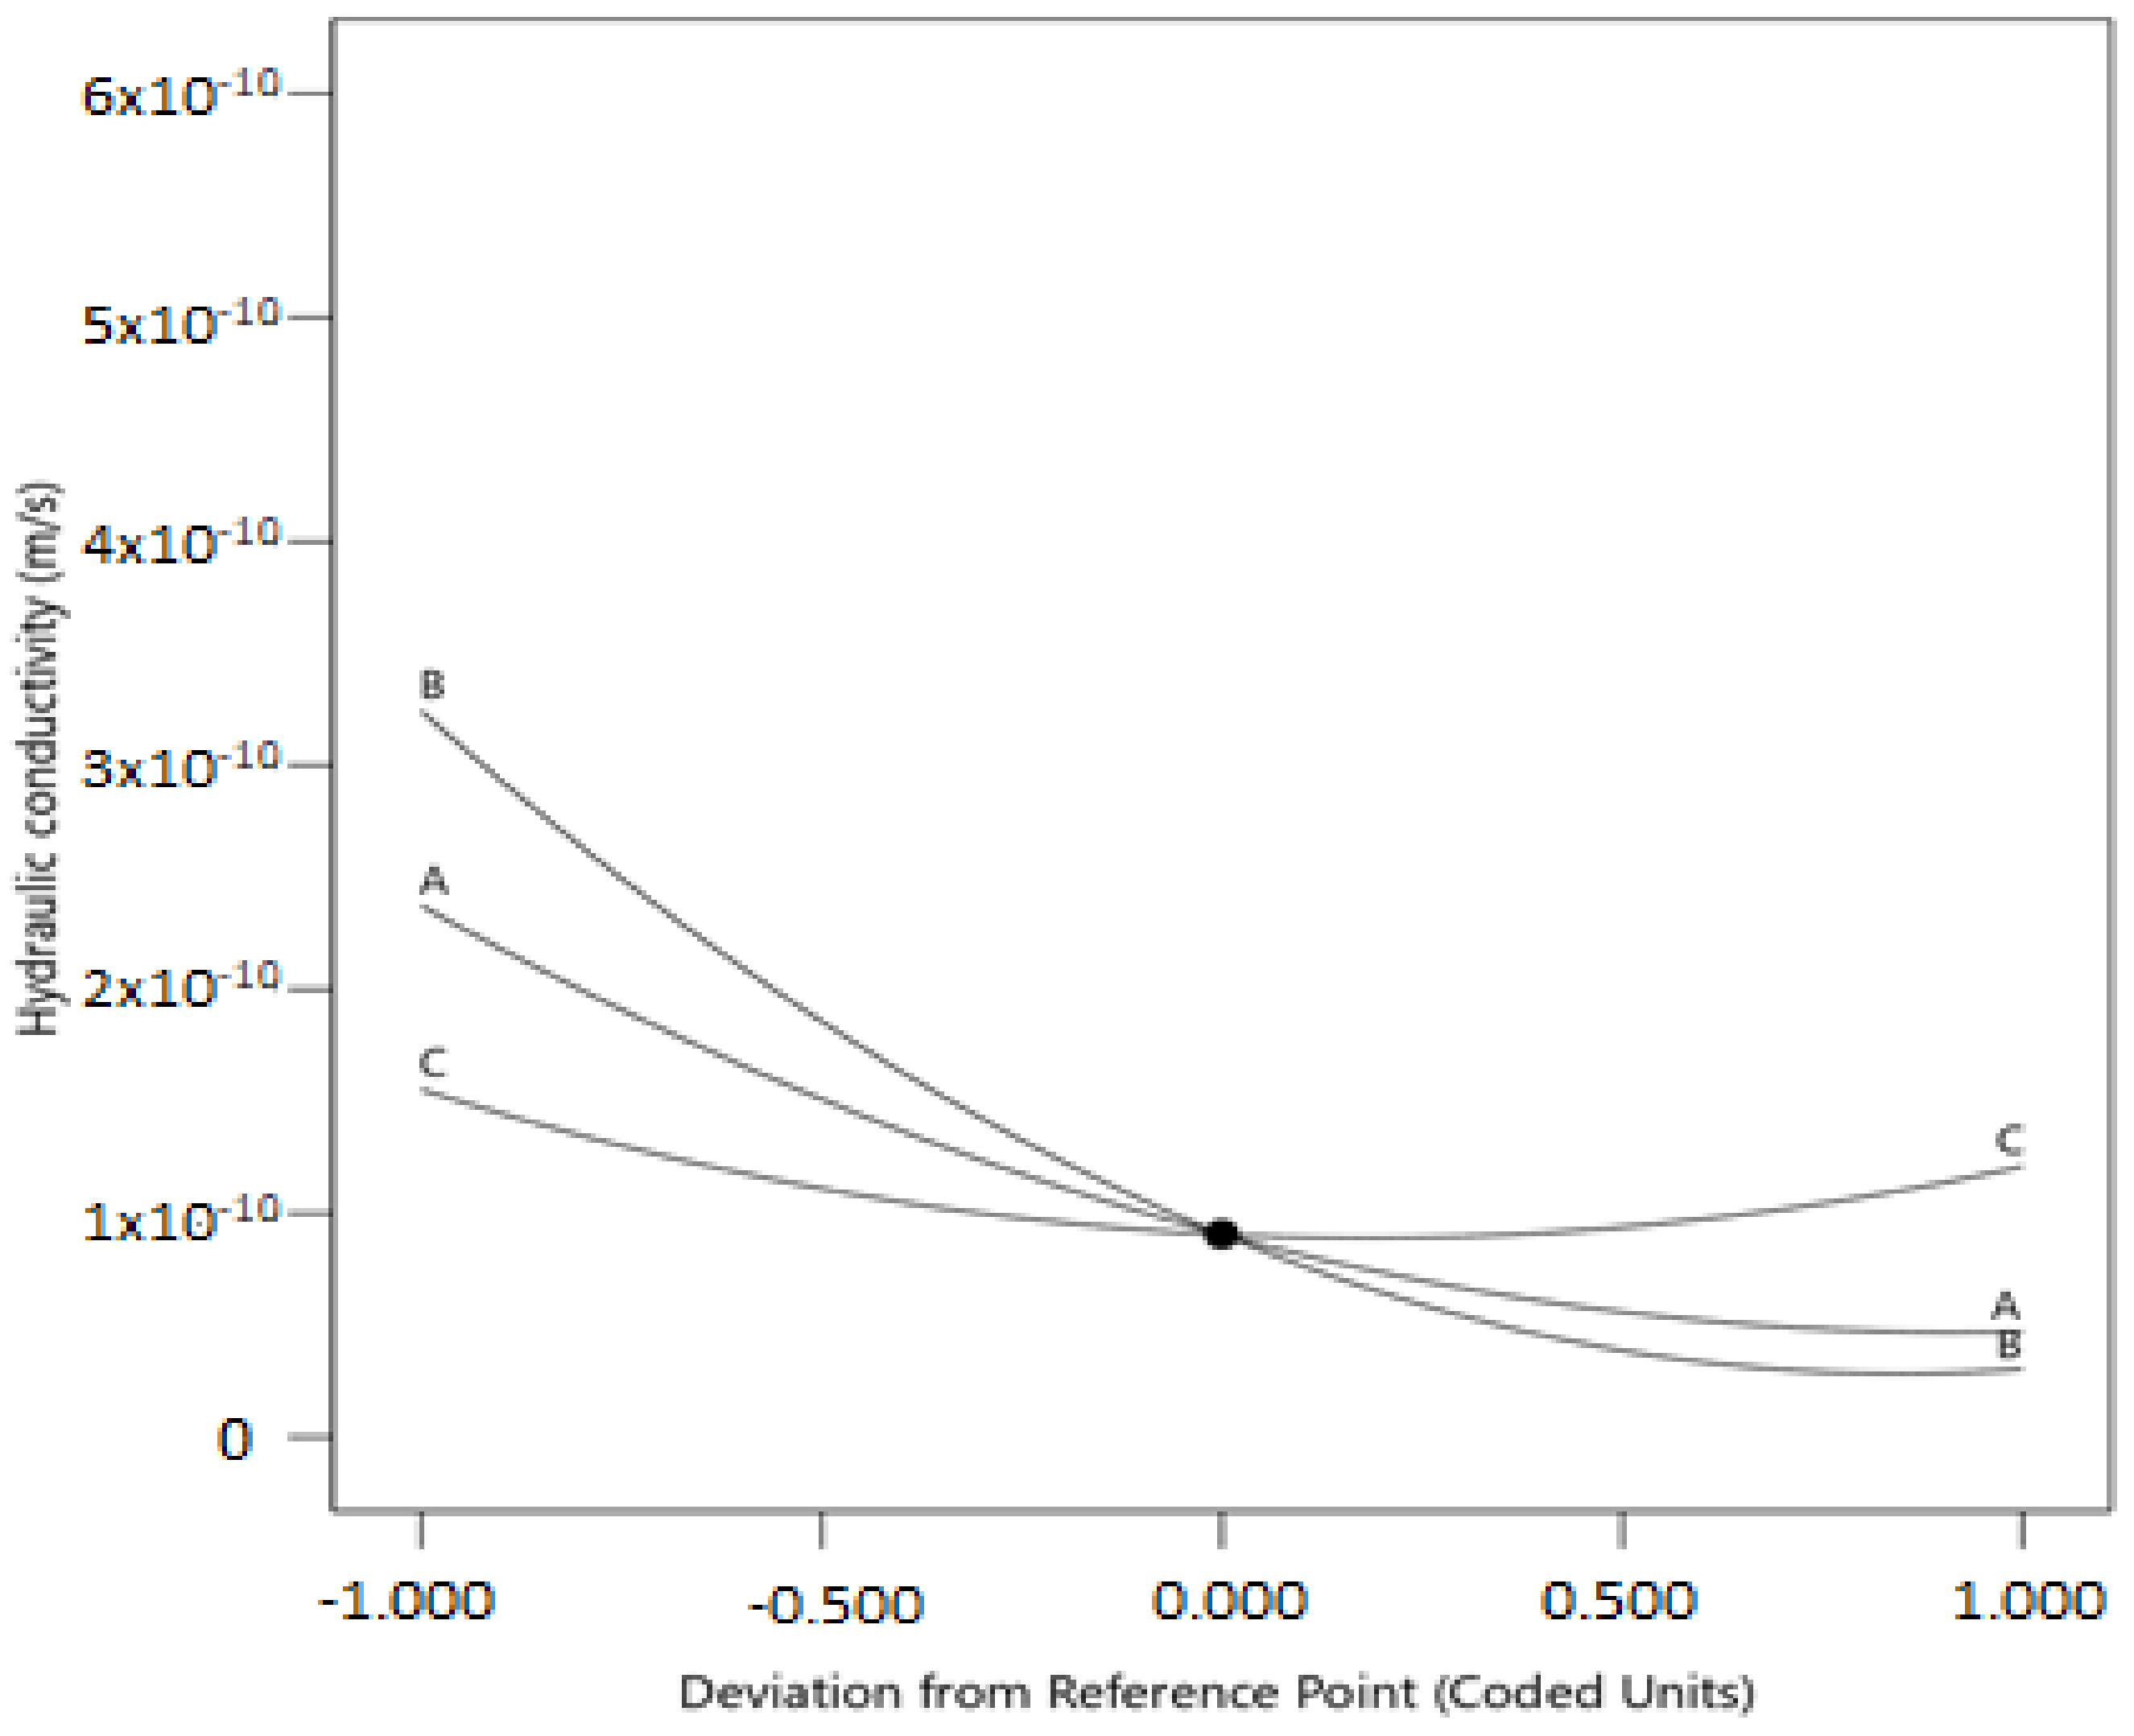
  • With increasing olivine content, carbonation time, and pressure, the hydraulic conductivity of the treated-clay decreased. The decrease in the hydraulic conductivity is due to the hydration reaction that resulted in the formation of M-S-H and M-A-H phases. Further hydraulic conductivity reduction is attributed to the formation of more carbonates, including nesquehonite, hydromagnesite, and dypingite.
  • The quadratic model was considered the best fitted and non-aliased model between the control factors and response. ANOVA analyses revealed that the main and quadratic effects of olivine content, carbonation time, and carbonation pressure significantly affected the hydraulic conductivity.
  • It was found that the predicted values from the model are in strong agreement with their experimental counterparts. Within the set of conditions applied in the current study, the model can be used for prediction.
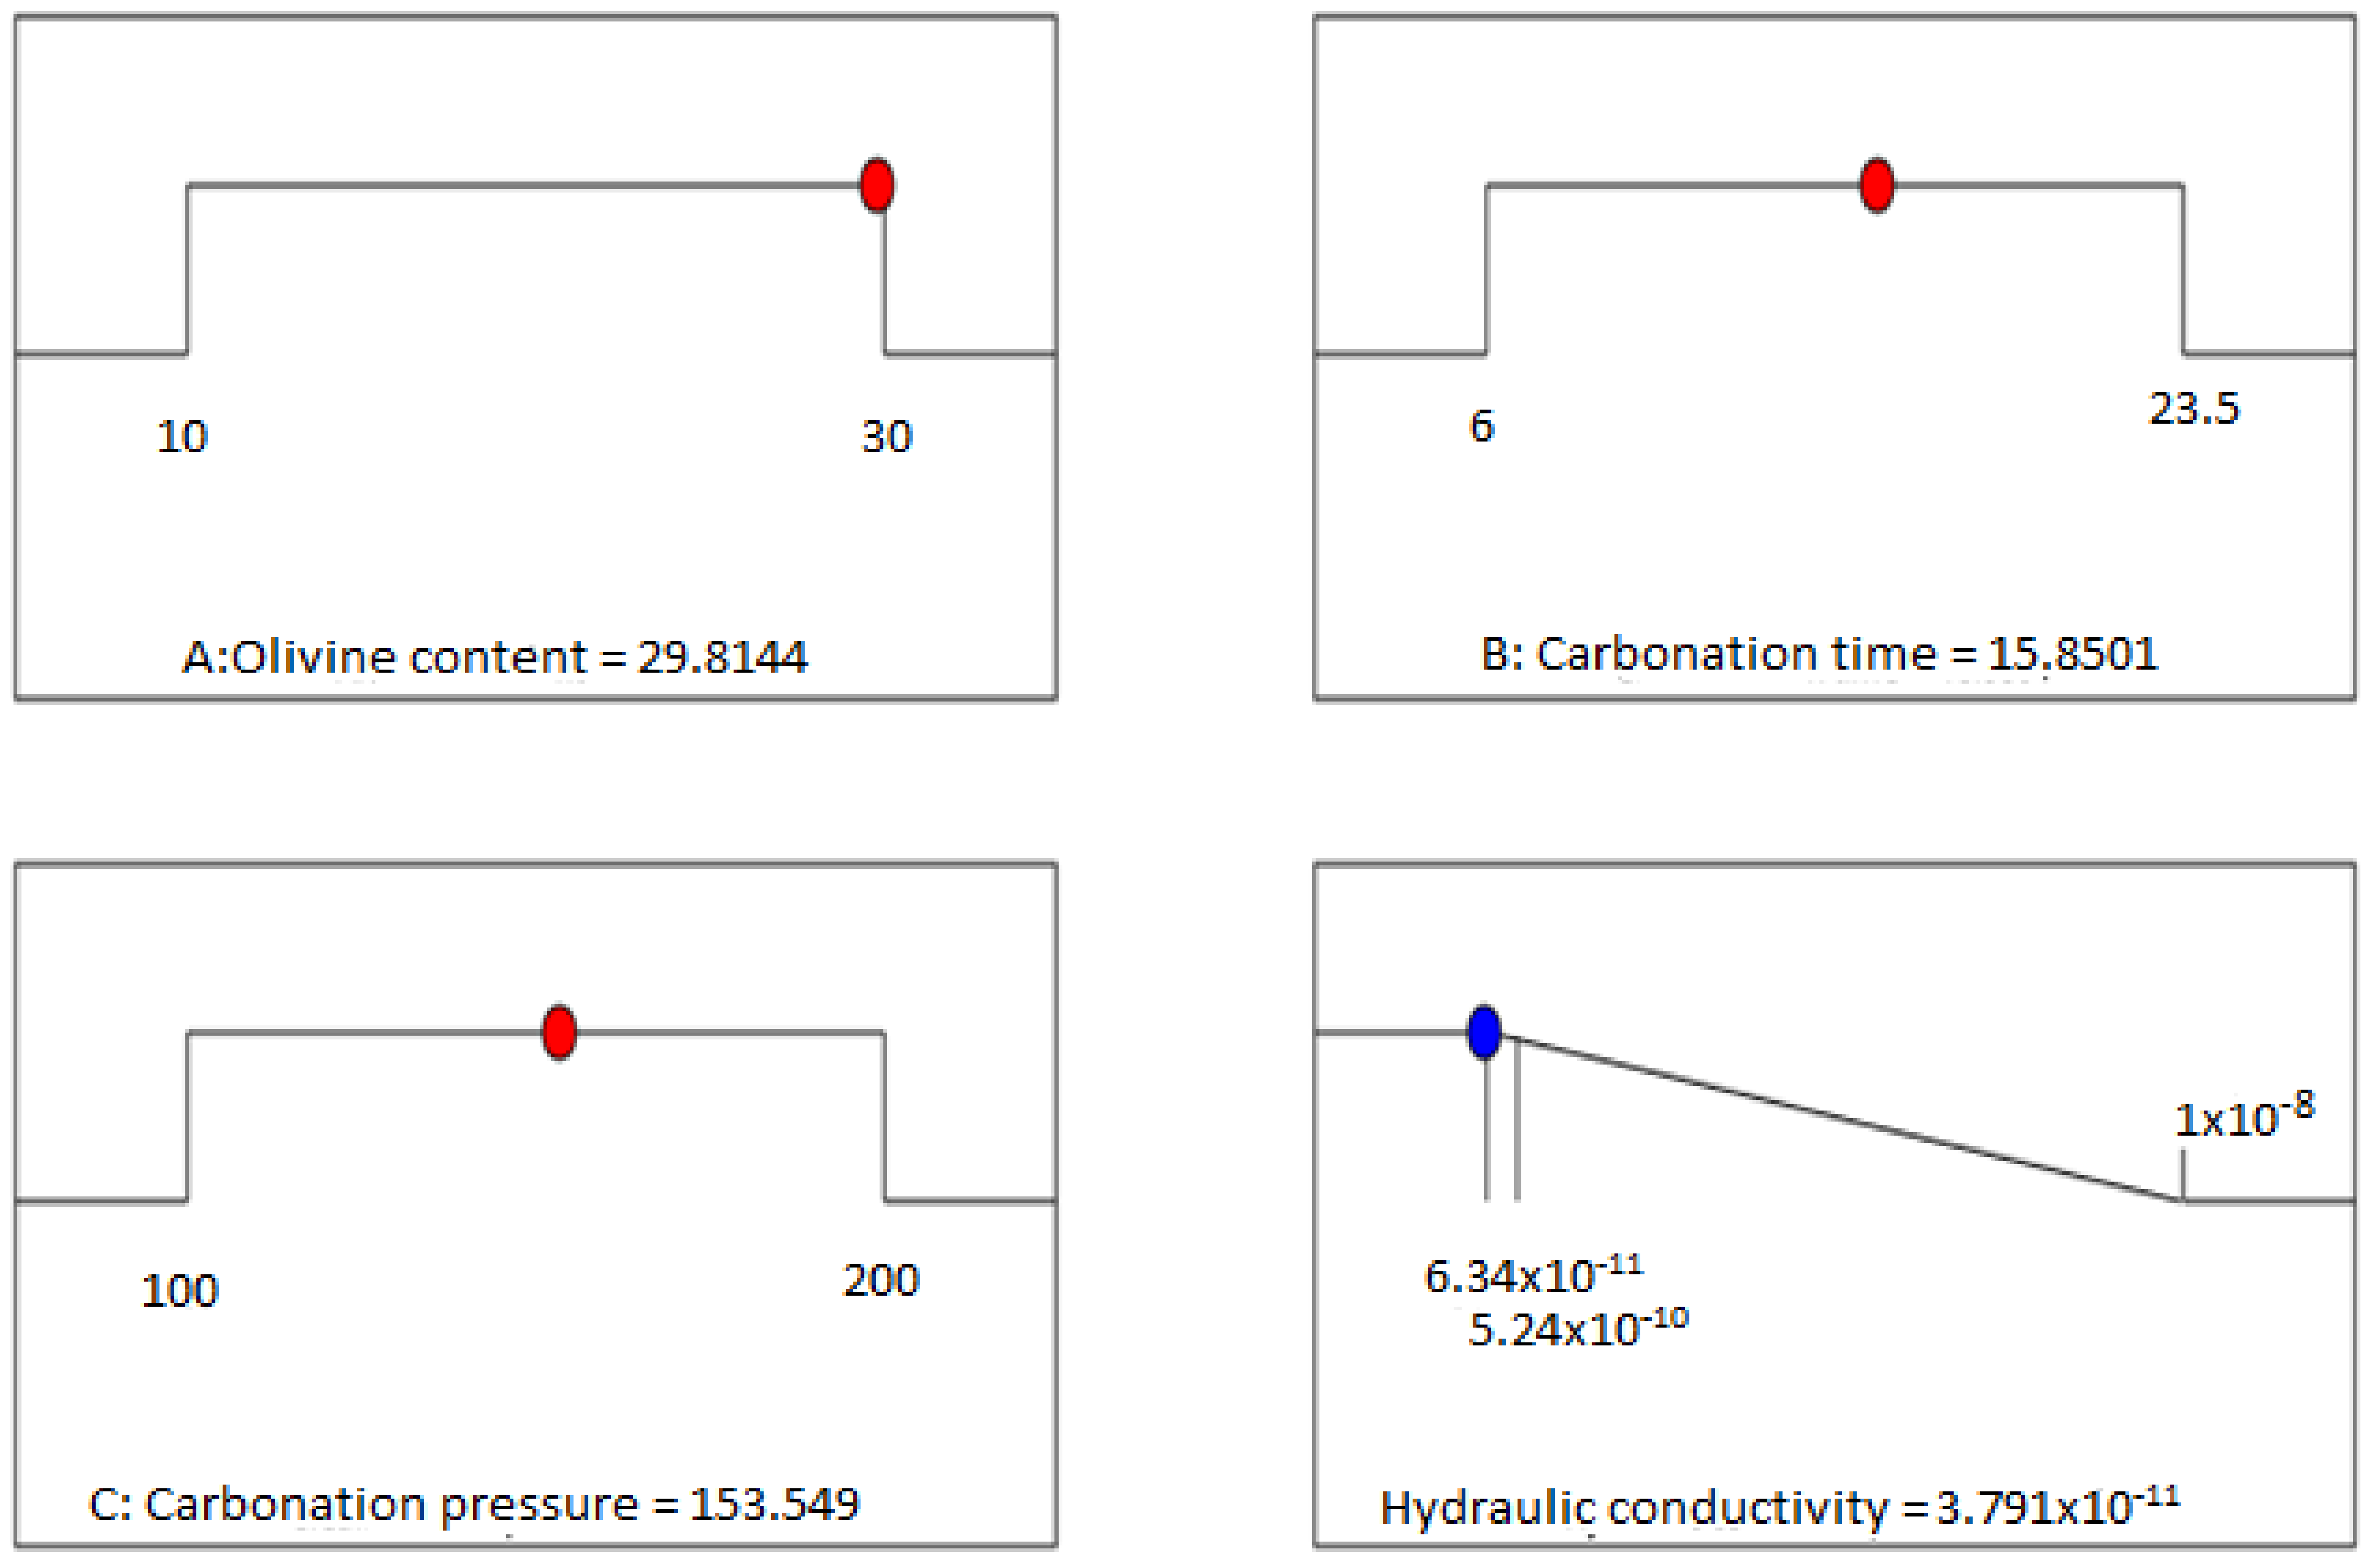
  • Based on the optimization study, the optimum value of the hydraulic conductivity was suggested as 2.0 × 10⁻¹¹ m/s and was attained under the following operating conditions: 24.7% olivine content, 20.1 h carbonation time, and 161 kPa carbonation pressure, with a designated maximum desirability function (D = 1.0).
  • Comparative analyses of the hydraulic conductivity reduction of the carbonated samples and cured specimens demonstrate that CO2-carbonated olivine-admixed soils have a great capacity to sequestrate CO2 and minimize CO2 emissions while rapidly decreasing the hydraulic conductivity of soils significantly relative to cured specimens.
In summary, CO2-carbonation and olivine blend have proven to be a sustainable technique to reduce the hydraulic conductivity of marine clay, while employing the AR technique to optimize the olivine particle size and RSM to design the experiment and obtain optimum operating conditions in achieving maximum hydraulic conductivity reduction. The results indicate that the carbonated olivine-admixed clay can be used as a liner material in engineered landfills with the potential of sequestering landfill CO2. However, the above results are based mainly on the outcome of laboratory experiments under limited operating conditions. Hence, future studies are recommended to extend the tests to a broader range of conditions and to carry out prototype and field trials to establish techniques for its in-situ application. Consequently, it might also provide a clue on the cost-estimate of the technique. Moreover, studies are also recommended considering the application of this carbonation technique to soil specimens prone to cracking and using leachate as the permeating fluid. Finally, future studies are also recommended to elucidate this hydraulic conductivity reduction through microstructural investigations.

Author Contributions

Conceptualization, E.E., V.A. and A.A.; methodology, E.E.; software, E.E.; validation, E.E.; formal analysis, E.E.; investigation, E.E. and V.A.; resources, E.E. and V.A.; data curation, E.E.; writing—original draft preparation, E.E.; writing—review and editing, V.A., A.S. and A.A.; visualization, E.E. and V.A.; supervision, V.A., A.S. and A.A.; project administration, V.A., A.S. and A.A.; funding acquisition, V.A. and A.S. All authors have read and agreed to the published version of the manuscript.

Funding

This research received no external funding.

Institutional Review Board Statement

Not applicable.

Informed Consent Statement

Not applicable.

Data Availability Statement

Data is contained within the article.

Acknowledgments

The authors gratefully acknowledge BOLD REFRESH 2025 Centre of Excellence, Universiti Tenaga Nasional (UNITEN) through Grant No. J5100D4103.

Conflicts of Interest

The authors declare no conflict of interest.

References

  1. Li, L.; Lin, C.; Zhang, Z. Utilization of shale-clay mixtures as a landfill liner material to retain heavy metals. Mater. Design. 2017, 144, 73–82. [Google Scholar] [CrossRef] [Green Version]
  2. Khodary, S.M.; Negm, A.M.; Tawfik, A. Geotechnical properties of the soils contaminated with oils, landfill leachate, and fertilizers. Arab. J. Geosci. 2018, 11, 1113. [Google Scholar] [CrossRef]
  3. Emmanuel, E.; Anggraini, V.; Raghunandan, M.E.; Asadi, A. Utilization of marine clay as a bottom liner material in engineered landfills. J. Environ. Chem. Eng. 2020, 8, 104048. [Google Scholar] [CrossRef]
  4. Luo, J.; Zhou, J.; Qian, G.; Liu, J. Effective anaerobic biodegradation of municipal solid waste fresh leachate using a novel pilot-scale reactor: Comparison under different seeding granular sludge. Bioresour. Technol. 2014, 165, 152–157. [Google Scholar] [CrossRef]
  5. Bove, D.; Merello, S.; Frumento, D.; Arni, S.A.; Aliakbarian, B.; Converti, A. A critical review of biological processes and technologies for landfill leachate treatment. Chem. Eng. Technol. 2015, 38, 2115–2126. [Google Scholar] [CrossRef]
  6. Speight, J.G. Unconventional gas. Nat. Gas 2019, 59–98. [Google Scholar] [CrossRef]
  7. Pehme, K.M.; Orupõld, K.; Kuusemets, V.; Tamm, O.; Jani, Y.; Tamm, T.; Kriipsalu, M. Field study on the efficiency of a methane degradation layer composed of fine fraction soil from landfill mining. Sustainability 2020, 12, 6209. [Google Scholar] [CrossRef]
  8. Lombardia, L.; Corti, A.; Carnevale, E.; Baciocchi, R.; Zingaretti, D. Carbon dioxide removal and capture for landfill gas up-grading. Energy Procedia 2011, 4, 465–472. [Google Scholar] [CrossRef] [Green Version]
  9. Emmanuel, E.; Anggraini, V.; Gidigasu, S.S.R. A critical reappraisal of residual soils as compacted soil liners. SN Appl. Sci. 2019, 1, 460. [Google Scholar] [CrossRef] [Green Version]
  10. Emmanuel, E.; Anggraini, V.; Asadi, A.; Raghunandan, M.E. Interaction of landfill leachate with olivine-treated marine clay: Suitability for bottom liner application. Environ. Technol. Innov. 2020, 17, 100574. [Google Scholar] [CrossRef]
  11. Chai, J.C.; Prongmanee, N. Barrier properties of a geosynthetic clay liner using polymerized sodium bentonite. Geotext. Geomembr. 2020. [Google Scholar] [CrossRef]
  12. Emmanuel, E.; Anggraini, V. Effects of desiccation-induced cracking and leachate infiltration on the hydraulic conductivity of natural and olivine-treated marine clay. Int. J. Environ. Sci. Technol. 2020, 17, 2259–2278. [Google Scholar] [CrossRef]
  13. Gupt, C.B.; Bordoloi, S.; Sekharan, S.; Sarmah, A.K. A feasibility study of Indian fly ash-bentonite as an alternative adsorbent composite to sand-bentonite mixes in landfill liner. Environ. Pollut. 2020, 114811. [Google Scholar] [CrossRef] [PubMed]
  14. Li, L.; Fall, M.; Fang, K. Shear behavior at interface between compacted clay liner–geomembrane under freeze-thaw cycles. Cold Reg. Sci. Technol. 2020, 172, 103006. [Google Scholar] [CrossRef]
  15. Liu, T.; Hu, L. Organic acid transport through a partially saturated liner system beneath a landfill. Geotext. Geomembr. 2014, 42, 428–436. [Google Scholar] [CrossRef] [Green Version]
  16. Hamdi, N.; Srasra, E. Hydraulic conductivity study of compacted clay soils used as landfill liners for an acidic waste. Waste Manag. 2013, 33, 60–66. [Google Scholar] [CrossRef]
  17. Albrecht, B.A.; Benson, C.H. Effect of desiccation on compacted natural clays. J. Geotech. Geoenviron. Eng. 2001, 127, 67–75. [Google Scholar] [CrossRef]
  18. Kalkan, E. Influence of silica fume on the desiccation cracks of compacted clayey soils. Appl. Clay Sci. 2009, 43, 296–302. [Google Scholar] [CrossRef]
  19. Li, J.H.; Li, L.; Chen, R.; Li, D.Q. Cracking and vertical preferential flow through landfill clay liners. Eng. Geol. 2016, 206, 33–41. [Google Scholar] [CrossRef]
  20. Tay, Y.Y.; Stewart, D.I.; Cousens, T.W. Shrinkage and desiccation cracking in bentonite–sand landfill liners. Eng. Geol. 2001, 60, 263–274. [Google Scholar] [CrossRef]
  21. Tuncan, A.; Tuncan, M.; Koyuncu, H.; Guney, Y. Use of natural zeolites as a landfill liner. Waste Manag. Res. 2003, 21, 54–61. [Google Scholar] [CrossRef]
  22. Shi, C.; Booth, R. Laboratory development and field demonstration of self-sealing/self-healing landfill liner. Waste Manag. 2005, 25, 231–238. [Google Scholar] [CrossRef] [PubMed]
  23. Kalkan, E. Utilization of red mud as a stabilization material for the preparation of clay liners. Eng. Geol. 2006, 87, 220–229. [Google Scholar] [CrossRef]
  24. Amadi, A.A.; Eberemu, A.O. Potential application of lateritic soil stabilized with cement kiln dust (CKD) as liner in waste containment structures. Geotech. Geol. Eng. 2013, 31, 1221–1230. [Google Scholar] [CrossRef]
  25. Eberemu, A.O. Evaluation of bagasse ash treated lateritic soil as a potential barrier material in waste containment application. Acta Geotech. 2013, 8, 407–421. [Google Scholar] [CrossRef]
  26. Guney, Y.; Cetin, B.; Aydilek, A.H.; Tanyu, B.F.; Koparal, S. Utilization of sepiolite materials as a bottom liner material in solid waste landfills. Waste Manag. 2014, 34, 112–124. [Google Scholar] [CrossRef] [PubMed]
  27. Kumar, H.; Mishra, M.K. Optimization and evaluation of fly ash composite properties for geotechnical application. Arab. J. Geosci. 2014, 8, 3713–3726. [Google Scholar] [CrossRef]
  28. Daud, N.N.N.; Muhammed, A.S.; Kundiri, A.M. Hydraulic conductivity of compacted granite residual soil mixed with palm oil fuel ash in landfill application. Geotech. Geol. Eng. 2017, 35, 1967–1976. [Google Scholar] [CrossRef]
  29. Kwon, O.; Park, J. Estimation on the self recovery behavior of low-conductivity layer in landfill final cover by laboratory conductivity tests. Environ. Technol. 2006, 27, 1233–1240. [Google Scholar] [CrossRef] [PubMed]
  30. Unluer, C.; Al-Tabbaa, A. Impact of hydrated magnesium carbonate additives on the carbonation of reactive MgO cements. Cem. Concr. Res. 2013, 54, 87–97. [Google Scholar] [CrossRef]
  31. Cai, G.H.; Du, Y.J.; Liu, S.Y.; Singh, D.N. Physical properties, electrical resistivity, and strength characteristics of carbonated silty soil admixed with reactive magnesia. Can. Geotech. J. 2015, 52, 1699–1713. [Google Scholar] [CrossRef]
  32. Cai, G.H.; Liu, S.Y.; Du, G.Y.; Wang, L.; Qin, C. Permeability Comparison of MgO-Carboanted Soils and Cement-Treated Soils. In Proceedings of the GeoShanghai International Conference, Shanghai, China, 27–30 May 2018; Springer: Singapore, 2018; pp. 105–113. [Google Scholar]
  33. Yi, Y.; Lu, K.; Liu, S.; Al-Tabbaa, A. Property changes of reactive magnesia–stabilized soil subjected to forced carbonation. Can. Geotech. J. 2015, 53, 314–325. [Google Scholar] [CrossRef]
  34. Wang, D.; Zhu, J.; He, F. CO2 carbonation-induced improvement in strength and microstructure of reactive MgO-CaO-fly ash-solidified soils. Constr. Build. Mater. 2019, 229, 116914. [Google Scholar] [CrossRef]
  35. Emmanuel, E.; Anggraini, V.; Raghunandan, M.E.; Asadi, A.; Bouazza, A. Improving the engineering properties of a soft marine clay with forsteritic olivine. Eur. J. Environ. Civ. Eng. 2019, 1–28. [Google Scholar] [CrossRef]
  36. Emmanuel, E.; Yong, L.L.; Asadi, A.; Anggraini, V. Full-factorial two-level design in optimizing the contents of olivine and coir fiber for improving the strength property of a soft marine clay. J. Nat. Fibers 2020, 1–16. [Google Scholar] [CrossRef]
  37. Olajire, A.A. Carbon dioxide sequestration by mineral carbonation technology: A state-of-the-art review. J. Pet. Sci. Eng. 2013, 109, 364–392. [Google Scholar] [CrossRef]
  38. Fasihnikoutalab, M.H.; Asadi, A.; Huat, B.K.; Westgate, P.; Ball, R.J.; Pourakbar, S. Laboratory-scale model of carbon dioxide deposition for soil stabilisation. J. Rock Mech. Geotech. Eng. 2016, 8, 178–186. [Google Scholar] [CrossRef] [Green Version]
  39. Fasihnikoutalab, M.H.; Asadi, A.; Huat, B.K.; Ball, R.J.; Pourakbar, S.; Singh, P. Utilisation of carbonating olivine for sustainable soil stabilisation. Environ. Geotech. 2017, 4, 184–198. [Google Scholar] [CrossRef] [Green Version]
  40. Fasihnikoutalab, M.H.; Asadi, A.; Unluer, C.; Huat, B.K.; Ball, R.J.; Pourakbar, S. Utilization of alkali-activated olivine in soil stabilization and the effect of carbonation on unconfined compressive strength and microstructure. J. Mater. Civ. Eng. 2017, 29, 06017002. [Google Scholar] [CrossRef]
  41. BS 1377, Methods of Testing Soils for Civil Engineering Purposes; British Standards Institution: London, UK, 1990.
  42. Head, K.H.; Epps, R. Manual of Soil Laboratory Testing, 3rd ed.; Pentech Press: London, UK, 1980; p. 499. [Google Scholar]
  43. Emmanuel, E.; Asadi, A.; Anggraini, V. An investigation on the brekage behavior of olivine sand particles: An attainable region technique 2021. Under review.
  44. Güllü, H.; Fedakar, H.I. Response surface methodology for optimization of stabilizer dosage rates of marginal sand stabilized with Sludge Ash and fiber based on UCS performances. KSCE J. Civ. Eng. 2016, 21, 1717–1727. [Google Scholar] [CrossRef]
  45. Kwon, S.; Fan, M.; DaCosta, H.F.; Russell, A.G. Factors affecting the direct mineralization of CO2 with olivine. J. Environ. Sci. 2011, 23, 1233–1239. [Google Scholar] [CrossRef]
  46. Teja, S.P.S.; Damodharan, N. 23 full factorial model for particle size optimization of methotrexate loaded chitosan nanocarriers: A design of experiments (DoE) approach. BioMed Res. Int. 2018, 2018. [Google Scholar] [CrossRef] [Green Version]
  47. Cai, G.H.; Liu, S.Y.; Du, G.Y.; Wang, L.; Li, J.S.; Liu, L. Hydraulic conductivity characteristics of carbonated reactive magnesia-treated silt. Bull. Eng. Geol. Environ. 2020, 79, 3033–3047. [Google Scholar] [CrossRef]
  48. Ministry of Housing and Local Government, Malaysia (MHLGM). The Study on Save Closure and Rehabilitation of Landfill Sites in Malaysia: Final Report; Yachiyo Engineering: Tokyo, Japan, 2004; Volume 5, p. 222.
Figure 1. Eco-smartz Los Angeles Abrasion machine.
Applsci 11 03164 g001
Figure 2. Schematic diagram of the hydraulic conductivity test setup and carbonation.
Applsci 11 03164 g002
Figure 3. Hydraulic conductivity of the olivine-admixed clay at different curing durations (3, 7, and 14 days).
Applsci 11 03164 g003
Figure 4. Normal probability plot of internally studentized residuals.
Applsci 11 03164 g004
Figure 5. Plot of studentized residuals vs. predicted response.
Applsci 11 03164 g005
Figure 6. Plot of predicted response vs. actual value.
Applsci 11 03164 g006
Figure 7. Plot of studentized residuals vs. run number.
Applsci 11 03164 g007
Figure 8. Perturbation chart.
Applsci 11 03164 g008
Figure 9. Response surface and contour plots demonstrating the interactive effects of carbonation time and carbonation pressure on the hydraulic conductivity while keeping olivine content at central level.
Applsci 11 03164 g009
Figure 10. Response surface and contour plots demonstrating the interactive effects of carbonation time and carbonation pressure on the hydraulic conductivity while keeping olivine content at central level.
Applsci 11 03164 g010
Figure 11. Response surface and contour plots demonstrating the interactive effects of olivine content and carbonation pressure on the hydraulic conductivity while keeping carbonation time at central level.
Applsci 11 03164 g011
Figure 12. Bar graph representing individual desirability of all responses (di) in correspondence with combined desirability (D).
Applsci 11 03164 g012
Figure 13. Desirability ramp for numerical optimization for the selected goals for solution number 1.
Applsci 11 03164 g013
Table 1. Basic engineering characteristics of the marine clay.
PropertyValueStandard Method
Sand (%)18.1[41]
Silt (%)43.5[41]
Clay (%)38.4[41]
D50 (mm)0.006-
Fines content (%)81.9-
Liquid limit (%)77.8[41]
Plastic limit (%)34.4[41]
Plasticity index (%)43.4[41]
Activity1.1-
MDD (g/cm3)1.50[41]
OMC (%)20.5[41]
HC (m/s)8.26 × 10−10[42]
pH7.6[41]
Specific gravity2.3[41]
HC = hydraulic conductivity; OMC = optimum moisture content; MDD = maximum dry density.
Table 2. The olivine physico-chemical characteristics.
Major OxidesConcentration (wt%)Standard Method
SiO240.02
Al2O35.98
Fe2O38.04
CaO0.20
MgO44.01
LOI1.75
Sand (%)32.25[41]
Silt (%)67.75[41]
D50(mm)0.018-
Specific gravity2.99[41]
pH8.91[41]
Electrical conductivity (mS/cm)0.17[41]
ColourLight green-
Table 3. Actual and coded values of the independent variables.
Independent Variable Levels of Coded Values
LowMidHigh
Coded Value−10+1
Olivine content (wt.%) 102030
Carbonation time (hours) 614.823.5
Carbonation pressure (kPa) 100150200
Table 4. Experimental design matrix with independent variables expressed in actual units and experimental response.
Standard Run No.A: Olivine Content (%)B: Carbonation Time (Hours)C: Carbonation Pressure (kPa)Hydraulic Conductivity (m/s)
11061505.24 × 10−10
23061502.21 × 10−10
31023.51501.09 × 10−10
43023.51506.34 × 10−11
51014.81003.21 × 10−10
63014.81009.34 × 10−11
71014.82002.65 × 10−10
83014.82008.07 × 10−11
92061004.07 × 10−10
102023.51007.79 × 10−11
112062003.45 × 10−10
122023.52007.06 × 10−11
132014.81509.05 × 10−11
142014.81509.08 × 10−11
152014.81509.03 × 10−11
Table 5. ANOVA for response surface quadratic model for hydraulic conductivity.
SourceSum of SquaresDFMean SquareF-Valuep-ValueRemark
Model3.062 × 10−1993.420 × 10−20274.17<0.0001significant
A-Olivine content7.230 × 10−2017.230 × 10−20582.66<0.0001significant
B-Carbonation time1.729 × 10−1911.729 × 10−191393.50<0.0001significant
C-Carbonation pressure2.381 × 10−2112.381 × 10−2119.190.0072significant
AB1.656 × 10−2011.656 × 10−20133.50<0.0001significant
AC4.687 × 10−2214.687 × 10−223.780.1096
BC7.480 × 10−2217.480 × 10−226.030.0576
A29.930 × 10−2119.930 × 10−2180.030.0003Significant
B22.792 × 10−2012.792 × 10−20225.02<0.0001significant
C28.378 × 10−2118.378 × 10−2167.520.0004significant
Residual6.204 × 10−2251.241 × 10−22
Lack of Fit6.203 × 10−2232.068 × 10−223264.510.0003significant
Pure Error1.267 × 10−2526.333 × 10−26
Correlation Total3.068 × 10−1914R20.9980
Standard deviation1.114 × 10−11 Adjusted R20.9943
PRESS9.924 × 10−21 Predicted R20.9677
C.V. (%)5.86 Adequate precision53.2329
DF = Degree of Freedom; PRESS = Predicted residual sum of squares; CV = Coefficient of variation.
Table 6. Optimization of the individual responses (di) in order to obtain the overall desirability response (D).
NameGoalLower LimitUpper LimitLower WeightUpper WeightImportance
A: Olivine contentin range1030113
B: Carbonation timein range623.5113
C: Carbonation press.in range100200113
Hydraulic conductivityminimize6.34 × 10−111.0 × 10−8114
Table 7. Optimized additive ratios and corresponding responses.
NumberOlivine Content (%)Carbonation Time (hrs)Carbonation Pressure (kPa)Hydraulic Conductivity (m/s)Desirability
129.815.91543.79 × 10−111.000
23023.51505.16 × 10−111.000
320.820.21632.99 × 10−111.000
421.622.91086.12 × 10−111.000
52916.81126.22 × 10−111.000
621.315.91576.09 × 10−111.000
72021.81204.95 × 10−111.000
82816.51905.78 × 10−111.000
916.922.91315.47 × 10−111.000
1017.319.61376.19 × 10−111.000
1121.118.71364.17 × 10−111.000
1221.322.31935.65 × 10−111.000
1320.9171605.05 × 10−111.000
1418.7231613.56 × 10−111.000
1524.720.11612.00 × 10−111.000
1627.916.71185.36 × 10−111.000
1727.917.21224.50 × 10−111.000
1828.319.21864.54 × 10−111.000
1926.421.61322.78 × 10−111.000
2022.821.41223.68 × 10−111.000
Table 8. Validation of optimized model response by experimental runs indicating percentage error.
Solution NumberOptimized Model ValuesExperimental Run ValuesPercentage Error
Hydraulic ConductivityHydraulic Conductivity
m/sm/s(%)
13.79 × 10−113.72 × 10−111.88
25.16 × 10−115.09 × 10−111.38
32.99 × 10−112.93 × 10−112.05
46.12 × 10−116.00 × 10−112.0
56.22 × 10−116.08 × 10−112.30
66.09 × 10−115.93 × 10−112.70
74.95 × 10−114.87 × 10−111.64
85.78 × 10−115.68 × 10−111.76
95.47 × 10−115.34 × 10−112.43
106.19 × 10−116.10 × 10−111.48
Publisher’s Note: MDPI stays neutral with regard to jurisdictional claims in published maps and institutional affiliations.

