Article

A Two-Stage Process for Conversion of Brewer’s Spent Grain into Volatile Fatty Acids through Acidogenic Fermentation

1
UCIBIO-REQUIMTE, Departamento de Química, Faculdade de Ciências e Tecnologia, Universidade NOVA de Lisboa, 2829-516 Caparica, Portugal
2
CBQF—Centro de Biotecnologia e Química Fina—Laboratório Associado, Escola Superior de Biotecnologia, Universidade Católica Portuguesa, Rua Diogo Botelho 1327, 4169-005 Porto, Portugal
*
Author to whom correspondence should be addressed.
Appl. Sci. 2021, 11(7), 3222; https://doi.org/10.3390/app11073222
Submission received: 13 February 2021 / Revised: 26 March 2021 / Accepted: 1 April 2021 / Published: 3 April 2021

Abstract

:
This work is focused on the valorization of brewer’s spent grains (BSG) into volatile fatty acids (VFA) through acidogenic fermentation. VFAs are building blocks for several applications, such as bioplastics’ production. Using acid hydrolysis as pre-treatment, several batch assays were performed and the impact of organic load (OL) and pH on VFA production from BSG hydrolysate was assessed. Regardless of the condition, the produced acids were mainly butyric and acetic acids followed by propionic acid. The OL had a direct impact on the total organic acid concentration with higher concentrations at the highest OL (40 gCOD L−1). pH affected the concentration of individual organic acid, with the highest fermentation products (FP) diversity attained at pH 5.0 and OL of 40 gCOD L−1. To assess the potential application of organic acids for biopolymers (such as polyhydroxyalkanoates) production, the content in hydroxybutyrate (HB) and hydroxyvalerate (HV) monomers was estimated from the respective precursors produced at each pH and OL. The content in HV precursors increased with pH, with a maximum at pH 6.0 (ca. 16% C-mol basis). The acidogenic fermentation of BSG hydrolysate was also assessed in continuous operation, using an expanded granular sludge bed reactor (EGSB). It was shown that the BSG hydrolysate was successfully converted to VFAs without pH control, achieving higher productivities than in the batch operation mode.

1. Introduction

Nowadays, a huge amount of solid wastes and by-products is generated by the beer industry. Brewer’s spent grain (BSG) is one of the most produced by-products, representing ca. 85% of the total beer industry byproducts [1]. BSG is a lignocellulosic material resulting from wort preparation, being mainly composed by 70% fibers (cellulose, hemicellulose and lignin), 30% proteins and some minerals and lipids [2]. Currently, BSG is mainly utilized as animal feed. However, the high amount generated, together with its interesting composition with high biotechnological value, has driven the search for green environmental and sustainable alternatives to this readily available low-cost biomass. Several studies reported the utilization of BSG in different fields of application: biogas and energy production, for the extraction of sugars, proteins and antioxidants, as well as for microorganisms cultivation [1,3]. Fermentation processes using BSG as a carbon and/or nutrient source, can generate several added-value products such as organic acids, amino acids, vitamins, ethanol and butanediol [2].
The production of volatile fatty acids (VFA) through the conversion of the organic material involves the two first stages of the anaerobic process (hydrolytic and acidogenic stages) [4]. VFA production under anaerobic conditions can be performed by pure or mixed cultures starting from several wastes. The use of mixed microbial cultures is advantageous since: (1) possessing a diversity of microbial pathways turns easier the conversion of substrates of complex composition; (2) no necessity of sterilization, thus saving energy [5,6]. As such, BSG can be used as carbon source for VFA production, which can be used for several industrially interesting applications, namely, bioenergy, biological nutrient removal, and bioplastics production, such as polyhydroxyalkanoates (PHA) [4,7].
In the overall process of VFA synthesis, the hydrolysis is the rate-limiting step during the anaerobic conversion of the complex structure and composition of solid waste. A previous study on the acidogenic fermentation of raw BSG demonstrated that the bioconversion of solid BSG into VFA is possible. However, the use of solid waste to feed the fermentation reactor caused some operational constrains, namely, equipment clogging, and the need of using high hydraulic retention times (HRT) values, which limits the process efficiency [8]. To overcome these constrains, several pre-treatments, including physical (crushing and grinding), chemical (alkaline and acid) [9,10], physico-chemical (auto-hydrolysis, hot water, steam and supercritical fluids) and biological methods (enzymes, fungi and bacteria) [10,11] can be applied to the solid feedstocks before their fermentation. These pre-treatments improve the hydrolysis and biodegradability of the feedstock, through the production of a liquor rich in fermentable sugars. Acid catalyzed processes are the commonest used and are divided in two general approaches based on concentrated-acid/low temperature and dilute-acid/high temperature hydrolysis [12]. The efficiency of the hydrolysis step determines the amount of readily available sugars which may impact the fermentation process yield and productivity.
In this study we hypothesized that a two-stage process to convert BSG into organic acids, consisting of an acid hydrolysis followed by acidogenic fermentation, would avoid the operational problems related to the use of solid BSG and would lead to enhance the overall productivity. The first step, consisting of an acid hydrolysis, was performed to extract sugars from solid BSG and thus facilitating the subsequent step of acidogenic fermentation, where organic acids are produced. Given that one of the potential applications for the organic acids is their use as precursors for PHA production, the impact of organic load (OL) and pH in the acidogenic batch fermentation, namely on organic acids profile and concentration, and on foreseen polymer composition was evaluated. Aiming at assessing the possibility of implementing the process in a continuous mode to facilitate production, the batch reactor was replaced by a continuous expanded granular sludge bed (EGSB) reactor. Results of the batch and continuous two-stage processes were compared with the previous single process using solid BSG.

2. Materials and Methods

2.1. BSG Characterization

Raw BSG was supplied by an industrial Portuguese brewery (Super Bock Bebidas S.A., Matosinhos, Portugal) and dried in the oven at 70 °C until reaching a moisture content of less than 10% (w/w). The moisture content was determined by drying a sample (50 mg) at 105 °C for 24 h. When dried, the feedstock material was ground in a hammermill (particle size < 1 mm2) and stored in sealed bags at −20 °C. Both raw dried BSG and dried BSG powder were characterized in terms of particle-size distribution by submitting a sample (50 and 100 g, respectively) through a nest of five different sized sieves (1.0–0.125 mm). Dried BSG powder was also characterized in terms of protein content by the Kjeldahl technique, lipids content using Soxhlet extraction with hexane and inorganic content by incineration at 550 °C, according to the standard methods [13].

2.2. Reactors Setup

2.2.1. BSG Hydrolysate as Feedstock

The dried and milled BSG was mixed with sulfuric acid solution (3% v/v) at a liquid-to-solid ratio of 8 g g−1 in 500 mL flasks and hydrolyzed in an autoclave (121 °C, 20 min). After cooling, the liquid phase was centrifuged for 15 min (10,000× g, 4 °C) and the resulting supernatant was clarified through filtration with commercial paper filter (Silvex, pore size 11–20 µm). Commercial paper filters were selected as no degradation by the remaining acid was observed. The remaining solid phase was subjected to a second hydrolysis at the same conditions. Both liquid phases were mixed and stored at 4 °C. This mixed liquor containing the BSG hydrolysate was neutralized at pH 7.0 using Ca(OH)2. The precipitate was removed by centrifugation for 15 min (10,000× g, 4 °C). The supernatant was collected for further analysis and experiments.

2.2.2. Batch Assays

The experimental setup consisted of lab-scale reactors with a working volume of 500 mL, operated under anaerobic conditions for 7 days. Each reactor was inoculated with anaerobic granules from a wastewater treatment plant of an industrial Portuguese brewery (Super Bock Bebidas S.A., Matosinhos, Portugal) at an initial biomass concentration of 20.0 ± 3.5 gVSS L−1 (20–30% v/v). The reactors were acclimatized overnight to temperature and pH with concomitant redox potential decrease to values of −400 mV, indicating that anaerobic conditions were achieved. Subsequently, the reactors were fed with BSG hydrolysate. Four different organic loads (10, 20, 30 and 40 gCOD L−1) and three different pH values (5.0, 5.5 and 6.0) were tested, in triplicate experiments. The temperature was kept at 30.0 ± 0.1 °C and magnetic stirring provided at 300 rpm. pH was controlled by the automatic addition of 1 M NaOH and 1 M HCl solutions. Redox potential was continuously monitored. No extra nutrients were fed to the batch assays, since BSG contains proteins and other nutrients necessary for the culture metabolism. Samples from the reactor and BSG hydrolysate used as feed were frequently collected for further analyses.

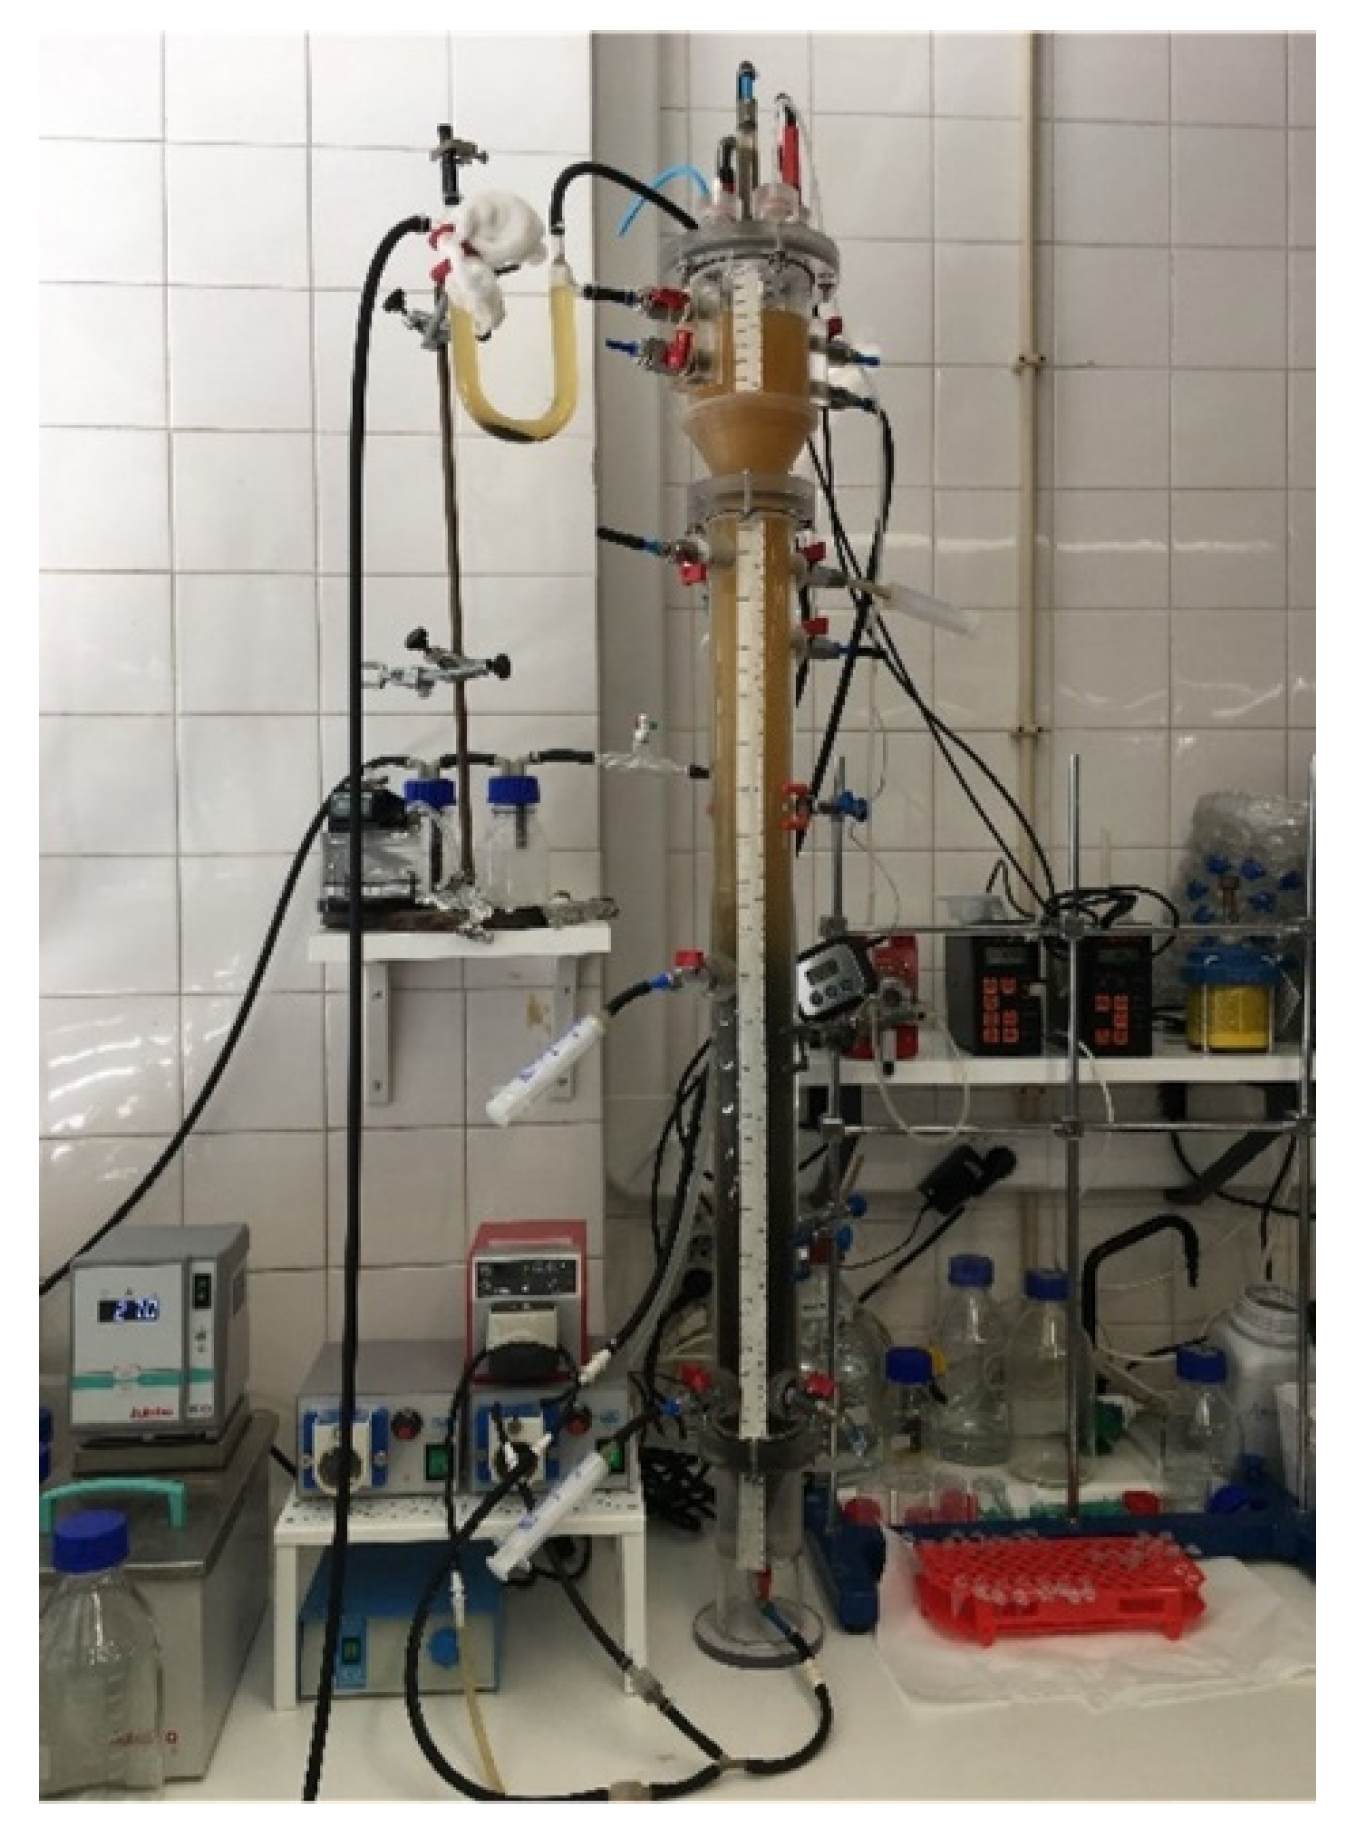
2.2.3. Expanded Granular Sludge Bed Reactor (EGSB)

A lab-scale expanded granular sludge bed reactor (EGSB) with a working volume of 3 L (internal diameter of 5 mm and height of 153 cm) was operated under anaerobic conditions (Figure 1).
The reactor was inoculated with anaerobic granules from an EGSB reactor of an industrial Portuguese brewery (Super Bock Bebidas S.A., Matosinhos, Portugal) at 20–30% v/v [14]. The anaerobic reactor was operated in continuous mode at 30.0 ± 0.1 °C and at an HRT of 2.5 ± 0.2 days. The pH was measured online and continuously monitored, but not controlled, during the whole reactor operation. The EGSB was fed with BSG hydrolysate (Section 2.2.1) at an OLR of 10 gCOD L−1 d−1. No extra nutrients were fed to the BSG hydrolysate since it contains proteins and other nutrients necessary for the culture metabolism. Samples from the reactor and from the feed were taken 3 times per week for further analyses.

2.3. Analytical Methods

BSG hydrolysate and anaerobic reactors samples were characterized in terms of: sugars, namely, xylose (Xyl), arabinose (Ara) and glucose (Glu) concentration; organic acids (HOrgs), including lactic HLac, acetic HAc, propionic HPro, butyric HBut, valeric HVal and isovaleric HIsov acids concentration; ethanol (EtOH); ammonia (NH4+); phosphate (PO43−); and total protein content, as described by Duque et al. [15]. Briefly, sugars, HOrgs and EtOH of filtered samples (VWR, spin filter 0.2 μm) were quantified by high performance liquid chromatography (HPLC) using a Hitachi High-Tech chromatograph (Hitachi High-Tech, Tegama, Japan) equipped with a RI detector, a Micro-Guard Cation H Refill Cartridge #1250129 pre-column (BioRad, Hercules, CA, USA) and an Aminex HPX-87H column (BioRad, Hercules, CA, USA; column temperature 30 °C, 0.01 N H2SO4 eluent, flow rate 0.5 mL min−1). The sugars and HAc concentrations were calculated through a standard calibration curve (31–1000 mg L−1 of each sugar, HOrgs and EtOH). NH4+ and PO43− contents were determined by colorimetry, as implemented in a flow segmented analyzer (Skalar 5100, Skalar Analytical, Breda, The Netherlands) [16]. The total protein content was determined using the colorimetric method described by Lowry et al. [17]. Bovine serum albumin (BSA) standards (0–100 mg L−1) were used for the protein content determination.
BSG hydrolysate was characterized in terms of elements, furfural and 5-HMF content. Briefly, calcium, magnesium and sodium were quantified by inductively coupled plasma atomic emission spectroscopy (ICP-AES) through an Ultima ICP spectrophotometer (Horiba Jobin-Yvon, Bensheim, Germany) equipped with a RF generator (40.68 MHz), a monochromator (1.00 m Czerny-Turner), AS500 automatic sampler and Concomitant Metals Analyzer (CMA) device. Sulphate (SO42−) content was determined by HPLC (ICS-3000, Dionex, Sunnyvale, CA, USA) through an ionPAC AS16 column coupled to a conductivity detector using NaOH 22 mM as eluent at 1.5 mL min−1 flow rate. Furfural and 5-HMF contents were also analyzed by a Surveyor HPLC system (Thermo Finnigan, San Jose, CA, USA) with a UV/Vis detector (Accela λ = 280 nm) through an Aminex 87H column (BioRad 30 °C) using H2SO4 10 mM as eluent with a 0.6 mL min−1 flow rate.
The anaerobic reactors samples were also characterized in terms of chemical oxygen demand (COD), gas content, and biomass concentration. COD was measured using cuvette test kits LCK 914 (5–60 gO2 L−1; Hach-Lange, Düsseldorf, Germany). The composition of the gas produced (CO2, H2, O2, N2 and CH4) was performed using a gas chromatograph (Agilent Technologies 7890B, Agilent Technologies Co., Ltd., Shanghai, China) equipped with a thermal conductivity detector, 50m of CP-Molsieve 5A and 25m Po-raBOND Q columns using the method described by Teixeira et al. [8]. Biomass concentration was determined according to the volatile suspended solids concentration (VSS) procedure described in standard methods [13].

2.4. Calculations

2.4.1. BSG Characterization and Hydrolysis

The BSG carbohydrates content (%, w/w, dry weight basis) was estimated according to Equation (1):
C a r b o h y d r a t e s   ( % ,   w / w ) = 100 ( A s h + P r o t e i n + L i p i d s + L i g n i n )
where, ash, protein and lipids content (%, w/w, dry weight basis) were analytically determined as described in Section 2.1. Lignin content was estimated at 12% w/w according to Kanauchi et al. [18] as both BSG used in the latter study and BSG used in this study have similar chemical composition. The hydrolysis efficiency (%) was calculated by dividing the total amount of sugars extracted (g) by the carbohydrates content in the amount of dried BSG used in the hydrolysis (see Section 2.2.1).

2.4.2. Acidogenic Fermentation

The degree of fermentation (DF, gCOD-FP gCOD1) was calculated by dividing the concentration of fermentation products (FP; HOrgs + EtOH) produced (difference between the amount of total detected outlet fermentation products, FPout (gCOD L−1), and the total inlet fermentation products, FPin (gCOD L−1), converted to COD units) by the influent COD (CODin, gCOD L−1):
D F = F P o u t F P i n   C O D i n  
For the batch tests, FP produced (gCOD L−1) was calculated as the maximum FP concentration minus the initial FP concentration.
The fermentation products yield on substrate (YFP/S, gCOD-FP gCOD−1) was calculated as follows:
Y F P / S   = F P o u t F P i n   ( C O D i n - F P i n ) ( C O D o u t - F P o u t )
where, CODout is the outlet effluent COD (gCOD L−1). For the batch assays, the fermentation products yield was calculated from the linear regression of the experimental data of fermentation products (HOrgs + EtOH) concentration converted to COD units plotted over influent COD (CODin).
Volumetric FP productivity (rFP, mgCOD-FP L−1 h−1), volumetric substrate uptake rate (-rS, mgCOD L−1 h−1), specific substrate uptake (-qS, mgCOD gVSS−1 h−1) and specific FP production rates (qFP, mgCOD-FP gVSS−1 h−1) were calculated as described by Gouveia et al. [19].
Considering the batch assays, maximum volumetric FP fermentation rate (rFPmax, mgCOD-FP L−1 h−1) and maximum volumetric substrate uptake rate (−rSmax, mgCOD L−1 h−1) were calculated from the linear regression of the fermentation products (HOrgs + EtOH) and substrate concentrations, respectively, over time (t in hours). Maximum specific substrate uptake (−qSmax, mgCOD gVSS−1 h−1) and specific production rates (qFPmax, mgCOD-FP gVSS−1 h−1) were calculated by dividing the respective maximum volumetric rates by the biomass concentration. Global FP volumetric productivity (rFP, mgCOD-FP L−1 h−1) and volumetric substrate uptake rate (-rS, mgCOD L−1 h−1) were calculated by dividing the FP produced, and substrate consumed, respectively, converted to COD units, by the length of each batch assay. Global specific substrate uptake (-qS, mgCOD gVSS−1 h−1) and production rates (qFP, mgCOD-FP gVSS−1 h−1) were calculated by dividing the respective volumetric rates by the volatile suspended solids (VSS) concentration.
HLac, HAc and HBut were considered as hydroxybutyrate (HB) precursors whereas HProp, EtOH, HVal and HIsov were used as hydroxyvalerate (HV) precursors. HB and HV monomers concentrations (C-mol L−1) were estimated from the respective precursors based on stoichiometry. HB and HV monomers fractions were calculated by dividing the estimated HB or HV monomers concentrations by the sum of both estimated HB and HV monomers concentrations (%C-mol basis).
For the batch assays, all kinetic parameters were calculated during the exponential phase of the acidogenic fermentation. Considering the EGSB, all the stoichiometric and kinetic parameters were calculated for the last 10 days of operation (between days 20 and 29). The standard deviations associated to all the determined stoichiometric and kinetic parameters were estimated using simple average errors formulas.

3. Results and Discussion

3.1. Raw BSG Characterization and Pretreatment

The raw BSG used presented a moisture of ca. 72% (w/w) that, after drying, decreased to 8.6 ± 0.4% (w/w). The dried BSG was composed of ca. 46% (w/w) carbohydrates, ca. 27% (w/w) proteins, ca. 12% (w/w) lipids and ca. 3% (w/w) inorganic salts content (Table 1).
The composition of the raw BSG used in this study is in the range of values reported for other BSG samples described in the literature (Table 1). The observed minor differences are probably related to the BSG source, the brewery’s operating conditions and ingredients used for brewing.
The dried raw BSG was mostly constituted by particles with an average size above 0.250 mm (ca. 94% w/w), with the largest fraction higher than 0.710 mm (ca. 55% w/w) (Figure 2).
A grinding step was applied to the dried BSG aiming at reducing the particle size, thus improving the particle surface area per unit volume. This facilitates the contact of the acid with the particles and boosts the rate of acidic hydrolysis [11]. Results show that the BSG average particle-size was clearly reduced, with around 80% (w/w) below 0.5 mm (Figure 2).
The ground BSG was then submitted to two sequential acid hydrolysis steps to extract simple sugars from BSG’s carbohydrate fraction. After the first hydrolysis, a second step was performed to the remaining solid residue to increase the total amount of sugars extracted from BSG. The extract resulting from the first hydrolysis had a sugars concentration of 32.4 ± 2.6 g L−1, while the second hydrolysis had a lower concentration, 16.4 ± 2.9 g L−1 (Table 2). Considering the dried BSG carbohydrates content (46.2 ± 0.06% w/w), in the first hydrolysis 56.0% of the sugars were extracted, whereas in the second hydrolysis 64.6% were extracted (Table 2). The global efficiency of the sequential hydrolysis was 84.5%. Singh and Travedi [22] who studied acid and alkaline pretreatment of lignocellulosic biomass reported an efficiency of extraction of reducing sugars of 49, 45 and 40% for rice waste, corn cobs and barley straw, respectively, after acid hydrolysis under 3% H2SO4 (v/v) and 121 °C, for 30 min. These values are lower than those obtained in our study for the first hydrolysis step of BSG.
The first and the second hydrolysates were mixed and the resulting hydrolysate was characterized before neutralization and after neutralization (Table 3). The hydrolysate after neutralization was used as the feed for following fermentation experiments.
The main sugar in the hydrolysate was xylose (12.4 ± 2.8 g L−1) followed by arabinose (6.53 ± 0.60 g L−1) and glucose (3.47 ± 0.19 g L−1) (Table 3), which is in agreement with the reported values for BSG sugar composition [20,23]. Indeed, the xylose concentration is about 55.5% of the total extracted sugars and the sugars extracted account for 41.9% (gCOD gCOD−1) of the total COD in the combined hydrolysates after neutralization. A high content of protein was also observed which can be also used as carbon source. As expected, calcium, magnesium and sodium were detected as they are comprised in BSG constitution [1,3]. A high content of sulfate was also detected, which resulted from the use of sulfuric acid for BSG hydrolysis.
Moreover, acetic acid (HAc), furfural and 5-HMF were also detected at low concentrations (Table 3). Furfural and 5-HMF result from the degradation of hexoses and pentoses during the hydrolysis procedure [24]. HAc usually results from the release of the acetyl groups attached to the hemicellulose backbone [25]. Nevertheless, such compounds are potentially inhibitory to the fermentation process [25]. Generally, furfural is produced from the degradation of pentose sugars (xylose and arabinose) and 5-HMF results from the degradation of hexose sugars (glucose). In this work, low concentrations of furfural and 5-HMF were detected (0.71 ± 0.07 g L−1 and 70 ± 30 mg L−1, respectively), not likely affecting the potential performance of the hydrolysate fermentation.
Since a strong acidic pH of the hydrolysates (resulting from the acid hydrolysis) might negatively impact the fermentation stage, neutralization with Ca(OH)2 was performed [20,24]. As expected, neutralization led to an increase of the calcium content of BSG hydrolysate (Table 3). Concomitantly, the content in sulfate decreased as it was removed in the form of calcium sulphate precipitate [24]. Xylose and arabinose concentrations decreased after neutralization with Ca(OH)2 (Table 3). This sugar decrease can be explained by the fact that the hydrophilic property of sulphate groups in the calcium sulphate precipitate promotes the adsorption of part of the water and monosaccharides present in the neutralized acid hydrolysates to the precipitate [26]. The decrease of protein content might have resulted from the interaction of Ca2+ with proteins, in a reaction pH dependent, and adsorbed on the calcium sulfate precipitate. The phosphate content also decreased with the addition of Ca(OH)2, which can be explained by the reaction between the Ca2+ and the anion PO43− resulting in calcium phosphate precipitate formation [27]. PO43− is an essential nutrient for the fermentation step. Though PO43− content was significantly reduced after neutralization, the ratio C:N:P of the hydrolysate was 100:33:2, which is still in the range of the reference values for anaerobic digestion [28,29].
Furfural and 5-HMF concentrations also decreased with Ca(OH)2 addition (Table 3), probably due to its conversion into other less toxic compounds and/or to its oxidation under alkaline conditions [30,31]. Martinez et al. [31] reported the reduction of furfural and 5-HMF content more than half after hydrolysate treatment with Ca(OH)2, whereas HAc concentration remained the same, which was also observed in the present study. According to the literature, the inhibitory concentrations were above 1 g L−1 and 5 g L−1, for furfural and HAc, respectively [32,33]. 5-HMF was not considered to be inhibitory due to its low concentration. Then, although the decrease in furfural and 5-HMF concentrations with neutralization was desirable, because it reduces the negative impact on fermentation, the concentrations achieved were not inhibitory for the fermentation process.
Results showed that acid hydrolysis is an efficient method for sugars extraction from BSG’s fractions achieving a hydrolysis efficiency of 84.5% (Table 2). Therefore, the BSG hydrolysate rich in sugars represents an excellent carbon source for several biotechnological purposes, namely, for VFAs production through acidogenic fermentation.

3.2. Acidogenic Fermentation

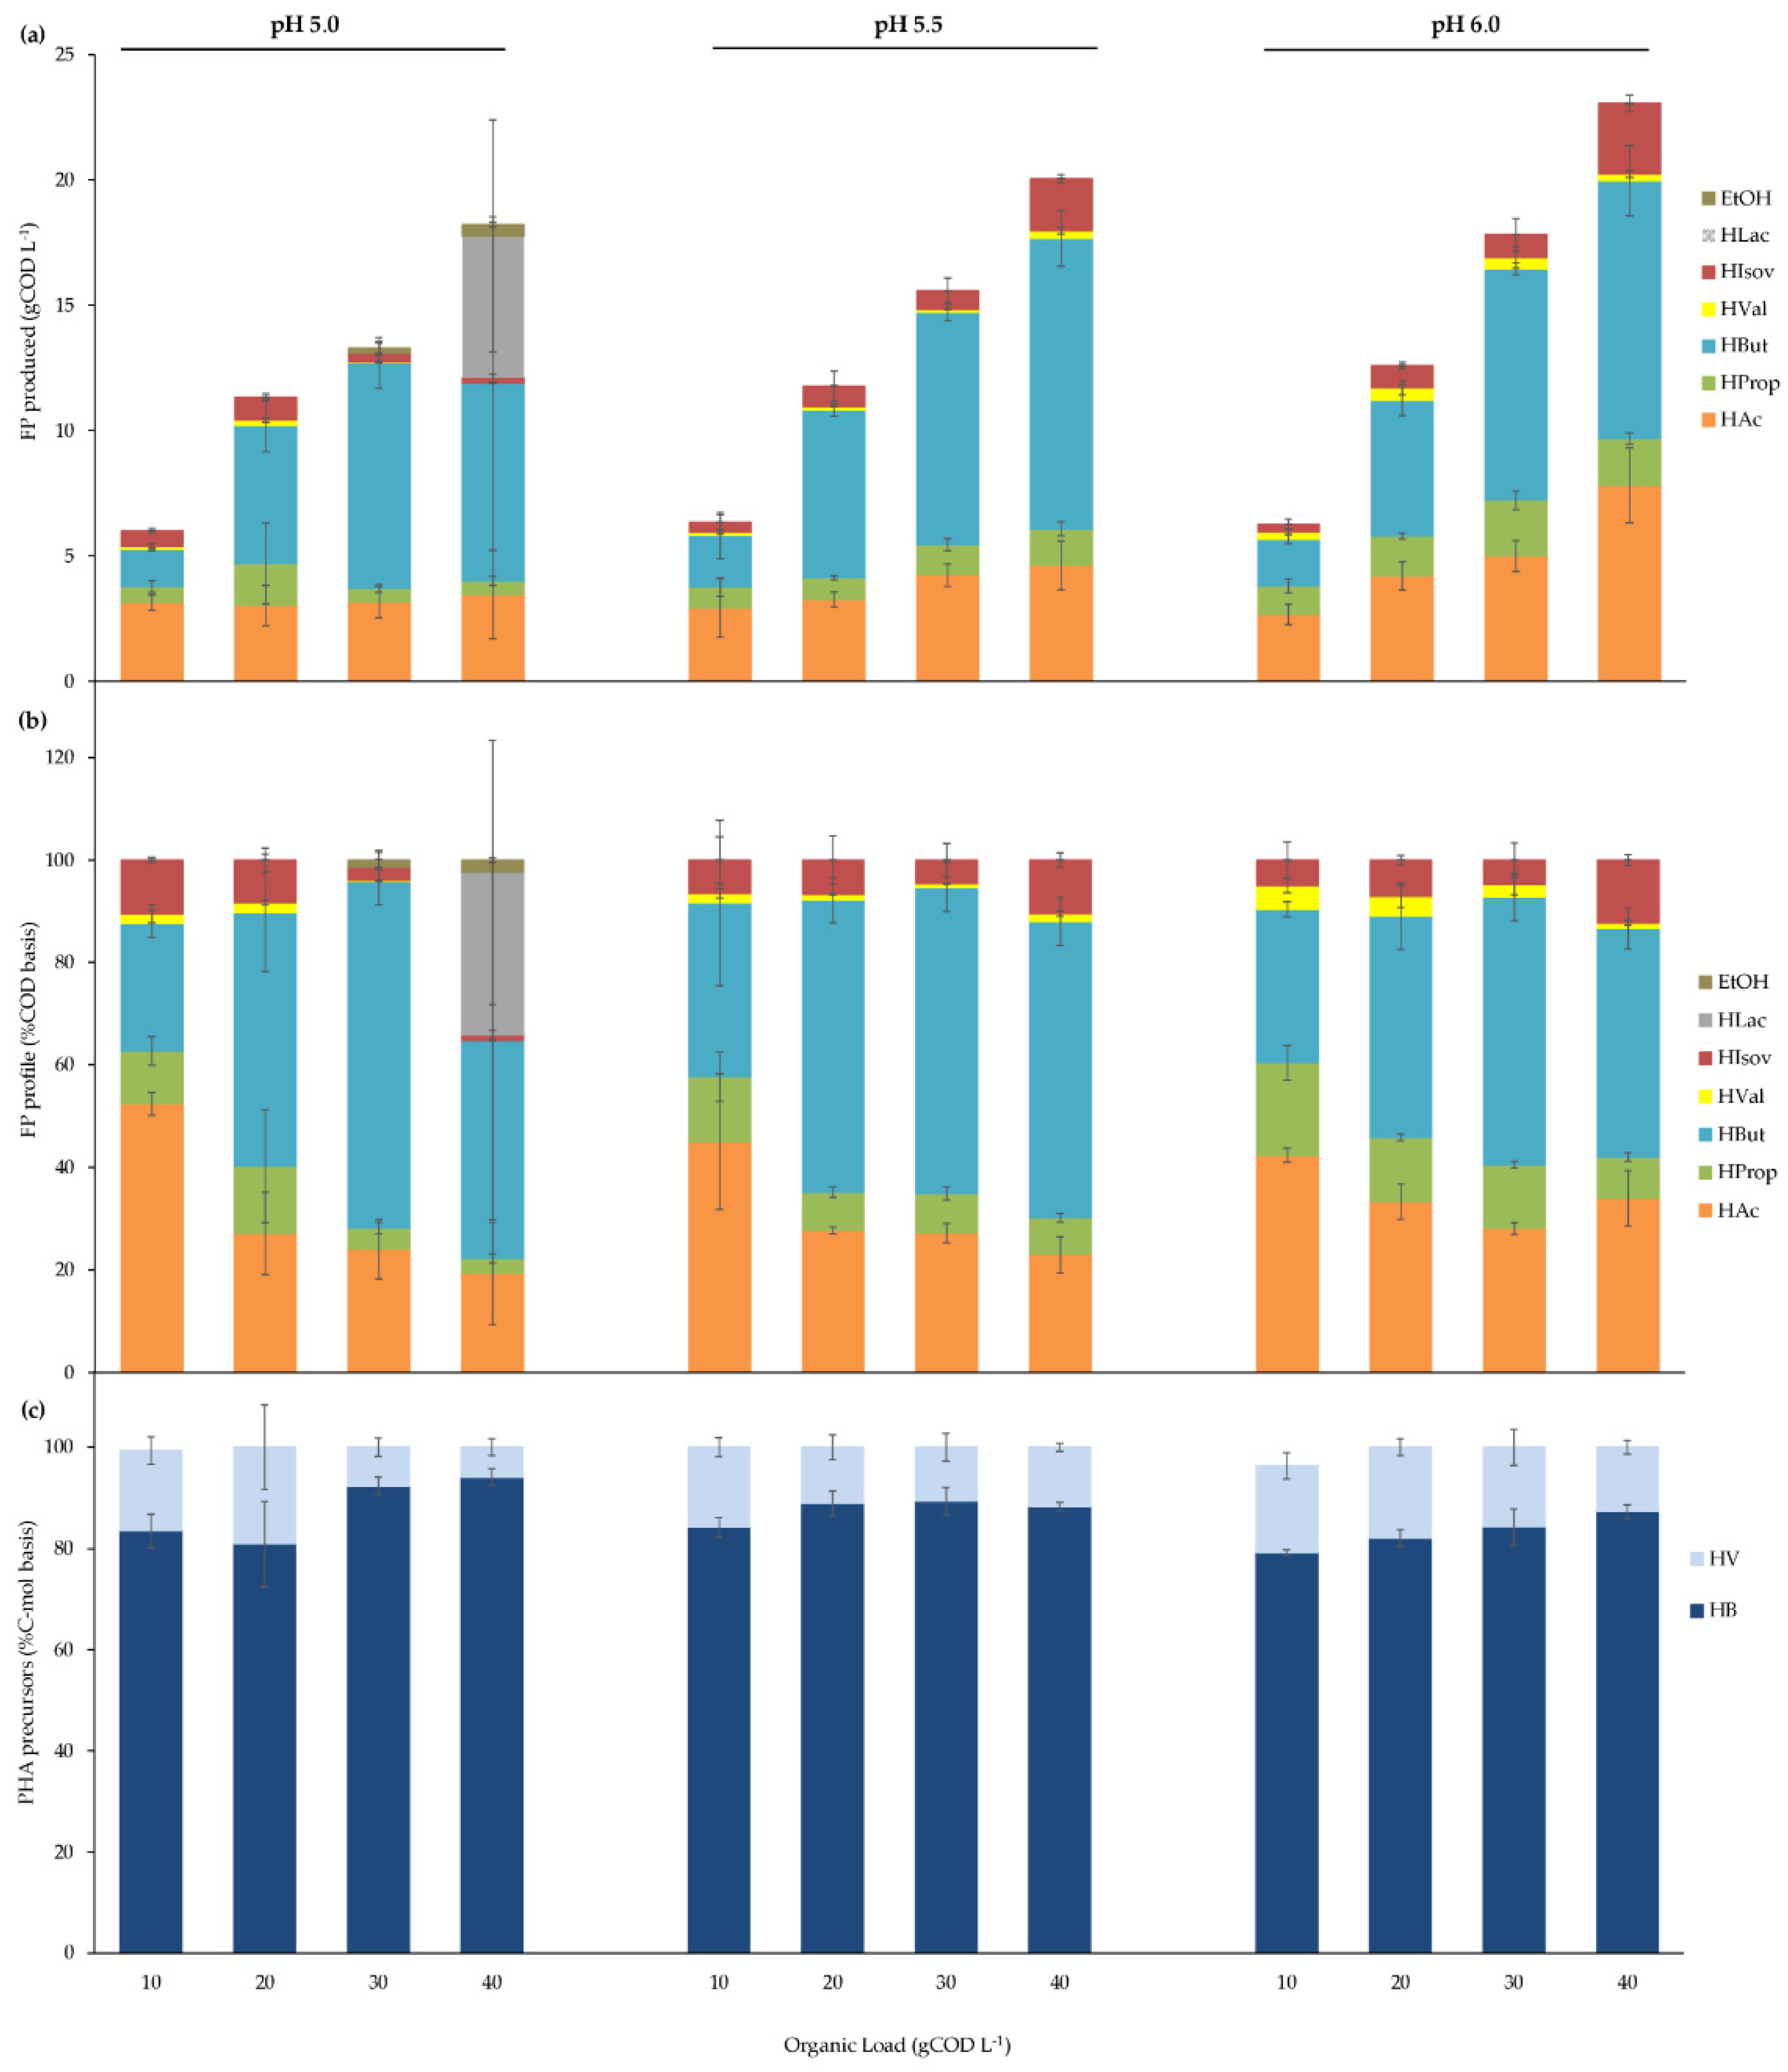
3.2.1. pH and Organic Load Effects on BSG Acidogenic Batch Fermentation

Several batch assays were performed to study the effect of pH (5.0, 5.5 and 6.0) and organic load (OL) (10, 20, 30 and 40 gCOD L−1) on the acidogenic fermentation of BSG hydrolysate (after neutralization).
In order to evaluate the overall batch assays performance, stoichiometric and kinetic parameters were calculated and are presented in Table 4. The maximum concentration of fermentation products (FP) obtained for each assay is shown in Table 4. The results show that the concentration of FP increases with OL and pH. The highest FP concentration (23.1 ± 2.2 gCOD L−1) was reached at OL of 40 gCOD L−1 and pH 6.0.
According to Table 4, there is no clear trend of the impact of pH and OL on the yield of conversion of sugars into FP (YFP/S). Except for pH 5.5 and OL of 40 gCOD L−1, the YFP/S values are between 0.52 and 0.69 gCOD-FP gCOD−1. These values are in the same range of those reported for cheese whey by Gouveia et al. [19] (0.55–0.68 gCOD gCOD−1 at pH 4.5–6.0) and by Tamis et al. [34] for glucose (0.66–0.59 gCOD gCOD−1, at pH 4.5–5.5, respectively).
In all assays, all the sugars (glucose, xylose and arabinose) were totally consumed. However, when the DF was calculated based on the influent total sugars’ concentration (gCOD L−1 basis), most of the values obtained were close or higher than 1, suggesting that other compounds present in the BSG hydrolysate are contributing to acids production. Thus, the DF was calculated using influent soluble COD values. These values ranged from 0.41 to 0.58 gCOD-FP gCOD−1 for all the conditions tested and were not significantly affected either by the OL or by the pH (Table 4). This suggests that efficiency of fermentation is not dependent on the OL and pH, in the range of values used.
Regardless of the pH range tested, generally, both maximum volumetric and specific FP production and sugar consumption rates (rFPmax, qFPmax, −rsmax, −qsmax, respectively) increased with the OL and pH. The highest maximum volumetric and specific rates (rFPmax, qFPmax, −rsmax, −qsmax, respectively) were reached at pH 6.0 under an OL of 40 gCOD L−1 (Table 4). The increase of specific rates (qFPmax, −qsmax) with OL means that the system follows a substrate limiting kinetics in the range of organic concentration used in the feed. Thus, further increase on OL values could be supported by the culture. By increasing the OL, the concentration of furfural and 5-HMF also increased (since they are proportionally present in the feed). This suggests that these compounds were not inhibitory for the culture and thus the acid hydrolysis did not negatively impact the process efficiency. In terms of global volumetric productivity (rFP), the highest value was reached at pH 5.0 and OL of 40 gCOD L−1.
The profile of the FP varies with the pH and OL. The highest FP diversity was achieved at pH 5.0 and OL of 40 gCOD L−1, where all acids were produced except HVal (Figure 3a,b). Nevertheless, regardless of pH or OL, HBut and HAc were the dominant acids produced in all experiments followed by HProp. As the main sugar present in the BSG hydrolysate is xylose, it was already expected to obtain butyrate and acetate as the main acids produced as previously reported by Temudo et al. [35].
HProp, HVal and HIsoval concentrations were higher at pH 6.0. Bengtsson et al. [36] also reported higher concentrations of HProp at pH 6.0 when assessing the effect of pH (3.5–6.0) on the acidogenic fermentation of whey in continuous reactor. Low concentrations of HLac, HVal, HIsov and ethanol were also detected (Figure 3a). Vergine et al. [37], have also reported HAc and HBut as being the main acids produced from a synthetic soft drink wastewater under acidic conditions (3.9 < pH < 5.2). Temudo et al. [38], who investigated the influence of pH in the fermentation of glucose, also achieved HBut and HAc as the main organic acids produced from glucose fermentation within the pH range of 4.0 to 6.5. Furthermore, in the latter study HLac was detected at low pH (4, 4.75 and 5), which was also observed in the present study at pH 5.0 for the OL of 30 and 40 gCOD L−1.
Teixeira et al. [8], in a study on VFA production using raw BSG, achieved HProp and HAc as major organic acids followed by HBut in a fed-batch stirred tank reactor operated under different HRT and OLR. However, as raw BSG was used as feedstock and the reactor configuration and operation mode were different from our study, the synthesis of organic acids can follow different metabolic pathways.
The produced organic acids can be used as building blocks for polyhydroxyalkanoates (PHA) production. The PHA monomeric composition is directly related to the FP used as substrate. In general, hydroxybutyrate (HB) monomers are synthetized from HLac, HAc and HBut, while hydroxyvalerate (HV) monomers are produced from HProp and HVal [15,39]. However, the production of other organic acids can promote the synthesis of different homopolymers or copolymers with improved mechanical properties. The homopolymer P(3HB) has a high crystallinity which results in a very low impact strength and brittle failure. On the other hand, the incorporation of HV chains enable to reach a broader processing window and an improved material flexibility, by decreasing crystallinity, melting temperature and glass transition temperature [40]. Having in mind the final application of the biopolymer, it is possible to manipulate the FP composition to achieve the desired properties of the polymer. Based on the FP profile obtained at each pH and OL, the HB and HV monomers were estimated (Figure 3c). The highest content of HB precursors was achieved at pH 5 (87.7 ± 5.6%C-mol basis) while the HV precursors were higher at pH 6.0 (15.9 ± 2.0%C-mol basis). The HV precursors generally increased (from ca. 15.9–17.0, 7.68–15.8, and 5.91–12.7%C-mol basis, at OL of 10, 30 and 40 gCOD L−1, respectively) with pH increase from 5.0 to 6.0 (Figure 3c), except for the OL of 20 gCOD L−1. Thus, operating conditions such as pH and OL can be manipulated to produce the HB/HV precursors accordingly to the target polymer composition considering VFA application in PHA production. On the other hand, in all the conditions tested butyrate was the dominant FP obtained. This acid is considered as the preferred substrate for PHA production since it is more energetically favorable at a metabolic level than other FP [41,42,43]. Thus, from this point of view the butyric acid is beneficial for the process efficiency. Nevertheless, introduction of HV precursors is envisaged if a more flexible/less rigid polymer is required.
The main aim of this study was to produce organic acids, thus stopping the process before methane production. Therefore, biogas composition analysis was performed along the experiments. The main gases detected were nitrogen (N2) and carbon dioxide (CO2) (data not shown). The presence of hydrogen (H2), oxygen (O2) and methane (CH4) was negligible (data not shown) indicating that acidogenesis was favored over methanogenesis under the applied operating conditions.

3.2.2. Continuous Acidogenic Fermentation of BSG Hydrolysate

In a previous study [8], raw BSG was used to produce VFA in a semicontinuous process operation mode. However, reactor operating constraints resulting from the use of solid waste (namely solid accumulation inside the reactor) limits the process operationality and thus its application at large scale. To overcome these operation limitations and to evaluate the feasibility of operating a continuous process with hydrolyzed BSG, an EGSB was set up. This reactor was continuously fed with hydrolyzed BSG for 30 days at an OLR of 8.11 ± 0.87 gCOD L−1 d−1 (OL of 20.1 ± 2.6 gCOD L−1) and HRT of 2.5 ± 0.2 days. This HRT value was chosen since it allows the biomass to have time to react with the BSG hydrolysate, promoting HOrgs production [4,44], while the OLR was imposed to maintain the same ratio of biomass concentration to reactor volume applied in the batch tests (20–30% v/v). Since as previously observed in the batch assays, the pH did not significantly affect the acidogenic fermentation of BSG hydrolysate, the EGSB in our study was operated without pH control, which will contribute to lower the operating costs when scaling up the process.
The overall EGSB performance and the performance reached between days 20 and 29 is shown in Figure 4 and Table 5, respectively. The pH stabilized at 4.5 ± 0.1 after 4 days of operation and remained constant during all the experimental time (Figure 4a). The FP production in acidogenic fermentation using BSG hydrolysate showed a slight increase during all the experimental time, reaching a stable average value of 9.00 ± 1.59 gCOD-FP L−1 during the last 10 days of operation (Figure 4c).
When comparing the results obtained in the present study with those obtained in a previous study [8] using raw BSG and a fed-batch reactor operated at an OLR of 5.9 gCOD L−1 d−1 and HRT of 19 d, the FP concentration obtained in the present study was lower (9.00 ± 1.59 vs. 15.8 ± 2.0 gCOD-FP L−1). This difference may be explained by the significantly lower HRT used in this study compared with the previous one. This difference has impact in the FP volumetric productivity of both processes. Indeed, the FP volumetric productivity (rFP) reached in this study, in the last 10 days of operation, was 147 ± 24 mgCOD-FP L−1 h−1 (Table 5), which was much higher than that reported by Teixeira et al. [8] with raw BSG (34.9 ± 4.4 and 37.0 ± 5.9 at OLR of 5.9 gCOD L−1 d−1 and HRT of 19 and 41 d, respectively, and 91.3 ± 9.1 mgCOD-FP L−1 h−1 at OLR of 22.1 gCOD L−1 d−1 and HRT of 16 d).
Thus, though a lower FP concentration was obtained, the lower HRT used in this study has a beneficial effect on the process productivity. On the other hand, BSG hydrolysis promotes sugar availability, which enables easier conversion into organic acids, which also contributes to the increase in the volumetric productivity. Furthermore, the volumetric and specific FP productivities (rFP and qFP, respectively) obtained for the EGSB were higher (147 ± 24 mgCOD-FP L−1 h−1 and 13.8 ± 1.7 mgCOD-FP gVSS−1 h−1, respectively) than those obtained for the batch assays operated at the closest conditions, 42.2 ± 5.9, 79.3 ± 14.9 mgCOD-FP L−1 h−1 and 2.72 ± 0.44, 4.45 ± 0.98 mgCOD-FP gVSS−1 h−1, respectively, at pH 5 and OL of 10 and 20 gCOD L−1. These results demonstrate that FP production from hydrolyzed BSG in continuous mode is a better option than the production in batch.
The FP yield (YFP/S) obtained (0.58 ± 0.1 gCOD-FP gCOD−1) in the EGSB (Table 5) is in the range of the values obtained in the batch tests at pH 5 and of those reported by Tamis et al. [34] when using glucose as substrate (0.58 versus 0.66 gCOD-FP gCOD−1 at pH 5.5 and 4.5, respectively). Gouveia et al. [19], who studied the pH effect on acidogenic fermentation of cheese whey using a CSTR, also reported an FP yield of 0.59 ± 0.11 gCOD-FP gCOD−1 at pH 4.5, despite the differences in HRT. Furthermore, the DF achieved in EGSB operation at pH 4.5 was very close to the one obtained in the batch assays at pH 5 (0.49 ± 0.09 and 0.50 ± 0.06 gCOD-FP gCOD−1 for OL of 10 and 20 gCOD L−1, respectively).
Regarding FP profile, HAc and HIsoval were the dominant fermentation products in the last 10 days of operation, with average values of ca. 22% and ca. 69% (COD basis), respectively. Small amounts of EtOH, HProp and HBut were also detected (4, 1.2 and 3% COD basis, respectively) (Table 5). This FP profile was different from the obtained on the batch assays, where HBut and HAc were the main acids produced (ca. 66 and 32% COD basis, respectively, at pH 5.0 and OL of 10 gCOD L−1). Even though both, the batch assays and the EGSB, were inoculated with the same biomass, it is difficult to compare the obtained results. In the batch assays the biomass was not acclimatized to the feedstock contrarily to the EGSB where the biomass is continuously adapting to the feedstock, being the presented results related to the last 10 days of operation. When raw BSG was used, HProp and HAc were the main acids produced in all the conditions tested, suggesting that microorganisms may use different metabolic pathways when a complex solid waste is used [8]. However, the monomeric HB:HV molar fractions of polymer, estimated from the HB and HV precursors (49:51) (Table 5) were in the same range of those (ca. 44–55% HV) reported by Teixeira et al. [8]. Thus, the HB:HV precursors ratio is not affected by the type of substrate (solid vs hydrolyzed) nor by the reactor configuration (EGSB vs CSTR; continuous vs fed-batch), when PHA production is envisaged. The main difference in the estimated polymer precursors is in the batch tests, where the HB monomer was above 80%.
The composition of the biogas produced along the reactor operation was analyzed. CO2 was present during the whole experimental period and it was the most representative component of the biogas (52.1 ± 3.5% mol). H2 and N2 were also present (40.7 ± 3.5% mol and 5.90 ± 0.1% mol, respectively). O2 was detected in minor amounts (1.40 ± 0.02% mol). No CH4 was detected. Batch and EGSB have different gas dynamic behavior inside the reactors which might have also impacted the FP profile.
Results indicate that is possible to operate an EGSB without pH control (Figure 4a), reducing the necessity of pH control by base or acid addition, resulting in costs reduction, and improving the economic feasibility of large-scale implementation. Sugars consumption with concomitant organic acids production demonstrated the potential to perform acidogenic fermentation of BSG hydrolysate using an EGSB reactor towards PHA production (Figure 4b). The two-stage process, where the acid hydrolysis was applied to the BSG as a pre-treatment, produced a liquor rich in fermentable sugars (BSG hydrolysate), reducing the necessity to operate the acidogenic step at high HRT as needed for the single stage process using raw BSG, leading to higher FP volumetric productivities. Furthermore, the reactor operation constraints due to solids accumulation and instability observed in the single stage process were also eliminated in the two-step process.
Hence, the two-step approach was more appealing than using a single raw BSG process, when considering an industrial application.

4. Conclusions

This study demonstrated the possibility of using a two-stage process to produce organic acids from BSG as feedstock. The manipulation of the acidogenic fermentation stage operating conditions, such as organic load and pH, allowed to obtain different organic acids profiles, which is an advantage for their use in different applications, including PHA production. The two-step process, comprising a first step of BSG pre-treatment prior to acidogenesis (second step), using EGSB operated in continuous mode and without pH control, achieved a much higher volumetric productivity than the single step process using raw BSG and fed-batch mode, thus revealing a high potential for the conversion of this feedstock into VFA. This work demonstrated the potential of manipulating the acidogenic operational conditions of a two-step process to produce HB/HV precursors tailored to a target polymer composition when PHA production is envisaged.

Author Contributions

Conceptualization, A.F.D. and E.C.G.; experimental methodology, validation and formal analysis, E.C.G., A.C.O. and S.A.; resources, P.M.L.C.; Writing—Original Draft Preparation, E.C.G.; Writing—Review & Editing, A.F.D., M.A.M.R., F.F. and P.M.L.C.; Supervision, A.F.D., M.A.M.R., F.F.; Project Administration, A.F.D.; Funding Acquisition, A.F.D., M.A.M.R. and P.M.L.C. All authors have read and agreed to the published version of the manuscript.

Funding

This research was funded by Fundação para a Ciência e a Tecnologia (FCT) through the project PTDC/BTA-BTA/31746/2017. Eliana C. Guarda grateful acknowledges FCT for the grant SFRH/BD/136300/2018. This work was supported by the Applied Molecular Biosciences Unit—UCIBIO which is financed by national funds from FCT (UIDP/04378/2020 and UIDB/04378/2020). We would also like to thank the scientific collaboration under the FCT project UIDB/50016/2020.

Acknowledgments

The authors acknowledge Super Bock Bebidas S.A. for supplying the brewer’s spent grain and the anaerobic granules.

Conflicts of Interest

The authors declare no conflict of interest.

References

  1. Mussatto, S.; Dragone, G.; Roberto, I. Brewers’ spent grain: Generation, characteristics and potential applications. J. Cereal Sci. 2006, 43, 1–14. [Google Scholar] [CrossRef]
  2. Mussatto, S.I. Brewer’s spent grain: A valuable feedstock for industrial applications. J. Sci. Food Agric. 2014, 94, 1264–1275. [Google Scholar] [CrossRef] [PubMed] [Green Version]
  3. Aliyu, S.; Bala, M. Brewer’s spent grain: A review of its potentials and applications. Afr. J. Biotechnol. 2011, 10, 324–331. [Google Scholar] [CrossRef]
  4. Lee, W.S.; Chua, A.S.M.; Yeoh, H.K.; Ngoh, G.C. A review of the production and applications of waste-derived volatile fatty acids. Chem. Eng. J. 2014, 235, 83–99. [Google Scholar] [CrossRef]
  5. Liang, S.; Wan, C. Carboxylic acid production from brewer’s spent grain via mixed culture fermentation. Bioresour. Technol. 2015, 182, 179–183. [Google Scholar] [CrossRef] [PubMed]
  6. Reis, M.A.M.; Serafim, L.S.; Lemos, P.C.; Ramos, A.M.; Aguiar, F.R.; Van Loosdrecht, M.C.M. Production of polyhydroxyalkanoates by mixed microbial cultures. Bioprocess Biosyst. Eng. 2003, 25, 377–385. [Google Scholar] [CrossRef]
  7. Atasoy, M.; Owusu-Agyeman, I.; Plaza, E.; Cetecioglu, Z. Bio-based volatile fatty acid production and recovery from waste streams: Current status and future challenges. Bioresour. Technol. 2018, 268, 773–786. [Google Scholar] [CrossRef] [PubMed]
  8. Teixeira, M.R.; Guarda, E.C.; Freitas, E.B.; Galinha, C.F.; Duque, A.F.; Reis, M.A. Valorization of raw brewers’ spent grain through the production of volatile fatty acids. New Biotechnol. 2020, 57, 4–10. [Google Scholar] [CrossRef]
  9. Caetano, N.S.; Moura, R.F.; Meireles, S.; Mendes, A.M.; Mata, T.M. Bioethanol from brewer’s spent grains: Acid pretreatment optimization. Chem. Eng. Trans. 2013, 35, 1021–1026. [Google Scholar] [CrossRef]
  10. Liguori, R.; Soccol, C.R.; Vandenberghe, L.P.D.S.; Woiciechowski, A.L.; Faraco, V. Second Generation Ethanol Production from Brewers’ Spent Grain. Energies 2015, 8, 2575–2586. [Google Scholar] [CrossRef] [Green Version]
  11. Kucharska, K.; Rybarczyk, P.; Hołowacz, I.; Łukajtis, R.; Glinka, M.; Kamiński, M. Pretreatment of Lignocellulosic Materials as Substrates for Fermentation Processes. Molecules 2018, 23, 2937. [Google Scholar] [CrossRef] [Green Version]
  12. Gírio, F.; Fonseca, C.; Carvalheiro, F.; Duarte, L.; Marques, S.; Bogel-Łukasik, R. Hemicelluloses for fuel ethanol: A review. Bioresour. Technol. 2010, 101, 4775–4800. [Google Scholar] [CrossRef] [PubMed]
  13. Apha, A. WEF Standard Methods for the Examination of Water and Wastewater, 21st ed.; American Public Health Association, American Water Works Association, Water Environment Federation: Washington, DC, USA, 2005. [Google Scholar]
  14. Lim, S.J.; Kim, T.-H. Applicability and trends of anaerobic granular sludge treatment processes. Biomass Bioenergy 2014, 60, 189–202. [Google Scholar] [CrossRef]
  15. Duque, A.F.; Oliveira, C.S.; Carmo, I.T.; Gouveia, A.R.; Pardelha, F.; Ramos, A.M.; Reis, M.A. Response of a three-stage process for PHA production by mixed microbial cultures to feedstock shift: Impact on polymer composition. New Biotechnol. 2014, 31, 276–288. [Google Scholar] [CrossRef] [PubMed]
  16. Carvalho, G.; Lemos, P.C.; Oehmen, A.; Reis, M.A. Denitrifying phosphorus removal: Linking the process performance with the microbial community structure. Water Res. 2007, 41, 4383–4396. [Google Scholar] [CrossRef] [PubMed]
  17. Lowry, O.; Rosebrough, N.; Farr, A.L.; Randall, R. Protein measurement with the folin phenol reagent. J. Biol. Chem. 1951, 193, 265–275. [Google Scholar] [CrossRef]
  18. Kanauchi, O.; Mitsuyama, K.; Araki, Y. Development of a Functional Germinated Barley Foodstuff from Brewer’s Spent Grain for the Treatment of Ulcerative Colitis. J. Am. Soc. Brew. Chem. 2001, 59, 59–62. [Google Scholar] [CrossRef]
  19. Gouveia, A.R.; Freitas, E.B.; Galinha, C.F.; Carvalho, G.; Duque, A.F.; Reis, M.A. Dynamic change of pH in acidogenic fermentation of cheese whey towards polyhydroxyalkanoates production: Impact on performance and microbial population. New Biotechnol. 2017, 37, 108–116. [Google Scholar] [CrossRef] [PubMed]
  20. Carvalheiro, F. Production of oligosaccharides by autohydrolysis of brewery’s spent grain. Bioresour. Technol. 2004, 91, 93–100. [Google Scholar] [CrossRef]
  21. Pires, E.J.; Ruiz, H.A.; Teixeira, J.A.; Vicente, A.A. A New Approach on Brewer’s Spent Grains Treatment and Potential Use as Lignocellulosic Yeast Cells Carriers. J. Agric. Food Chem. 2011, 60, 5994–5999. [Google Scholar] [CrossRef] [Green Version]
  22. Singh, D.P.; Trivedi, R.K. Acid and alkaline pretreatment of lignocellulosic biomass to produce ethanol as biofuel. Int. J. Chem.Tech. Res. 2013, 5, 727–734. [Google Scholar]
  23. Paz, A.; Sabo, S.D.S.; Vallejo, M.; Marguet, E.; Oliveira, R.P.D.S.; Domínguez, J.M. Using brewer’s spent grain to formulate culture media for the production of bacteriocins using Patagonian strains. LWT 2018, 96, 166–174. [Google Scholar] [CrossRef]
  24. Lenihan, P.; Orozco, A.; O’Neill, E.; Ahmad, M.; Rooney, D.; Walker, G. Dilute acid hydrolysis of lignocellulosic biomass. Chem. Eng. J. 2010, 156, 395–403. [Google Scholar] [CrossRef]
  25. Mussatto, S.I.; Roberto, I.C. Acid hydrolysis and fermentation of brewer’s spent grain to produce xylitol. J. Sci. Food Agric. 2005, 85, 2453–2460. [Google Scholar] [CrossRef]
  26. Seong, H.A.; Lee, J.S.; Yoon, S.Y.; Song, W.-Y.; Shin, S.-J. Fermentation characteristics of acid hydrolysates by different neutralizing agents. Int. J. Hydrogen Energy 2016, 41, 16365–16372. [Google Scholar] [CrossRef]
  27. Kim, W.; Saito, F. Sonochemical synthesis of hydroxyapatite from H3PO4 solution with Ca(OH)2. Ultrason. Sonochem. 2001, 8, 85–88. [Google Scholar] [CrossRef]
  28. Khalid, A.; Arshad, M.; Anjum, M.; Mahmood, T.; Dawson, L. The anaerobic digestion of solid organic waste. Waste Manag. 2011, 31, 1737–1744. [Google Scholar] [CrossRef]
  29. Gil, A.; Siles, J.A.; Serrano, A.; Chica, A.F.; Martín, M.A. Effect of variation in the C/[N+P] ratio on anaerobic digestion. Environ. Prog. Sustain. Energy 2019, 38, 228–236. [Google Scholar] [CrossRef] [Green Version]
  30. Purwadi, R.; Niklasson, C.; Taherzadeh, M.J. Kinetic study of detoxification of dilute-acid hydrolyzates by Ca(OH)2. J. Biotechnol. 2004, 114, 187–198. [Google Scholar] [CrossRef] [PubMed]
  31. Martinez, A.; Rodriguez, M.E.; York, S.W.; Preston, J.F.; Ingram, L.O. Effects of Ca(OH)2 treatments(“overliming”) on the composition and toxicity of bagasse hemicellulose hydrolysates. Biotechnol. Bioeng. 2000, 69, 526–536. [Google Scholar] [CrossRef]
  32. Roberto, I.; Lacis, L.; Barbosa, M.; de Mancilha, I. Utilization of sugar cane bagasse hemicellulosic hydrolysate by pichia stipitis for the production of ethanol. Process. Biochem. 1991, 26, 15–21. [Google Scholar] [CrossRef]
  33. Taherzadeh, M.J.; Eklund, R.; Gustafsson, L.; Niklasson, A.C.; Lidén, G. Characterization and Fermentation of Dilute-Acid Hydrolyzates from Wood. Ind. Eng. Chem. Res. 1997, 36, 4659–4665. [Google Scholar] [CrossRef]
  34. Tamis, J.; Joosse, B.; Van Loosdrecht, M.; Kleerebezem, R. High-rate volatile fatty acid (VFA) production by a granular sludge process at low pH. Biotechnol. Bioeng. 2015, 112, 2248–2255. [Google Scholar] [CrossRef] [PubMed]
  35. Temudo, M.F.; Mato, T.; Kleerebezem, R.; Van Loosdrecht, M.C.M. Xylose anaerobic conversion by open-mixed cultures. Appl. Microbiol. Biotechnol. 2009, 82, 231–239. [Google Scholar] [CrossRef] [PubMed] [Green Version]
  36. Bengtsson, S.; Hallquist, J.; Werker, A.; Welander, T. Acidogenic fermentation of industrial wastewaters: Effects of chemostat retention time and pH on volatile fatty acids production. Biochem. Eng. J. 2008, 40, 492–499. [Google Scholar] [CrossRef]
  37. Vergine, P.; Sousa, F.; Lopes, M.; Silva, F.; Gameiro, T.; Nadais, H.; Capela, I. Synthetic soft drink wastewater suitability for the production of volatile fatty acids. Process. Biochem. 2015, 50, 1308–1312. [Google Scholar] [CrossRef]
  38. Temudo, M.F.; Kleerebezem, R.; Van Loosdrecht, M. Influence of the pH on (open) mixed culture fermentation of glucose: A chemostat study. Biotechnol. Bioeng. 2007, 98, 69–79. [Google Scholar] [CrossRef]
  39. Lemos, P.C.; Serafim, L.S.; Reis, M.A. Synthesis of polyhydroxyalkanoates from different short-chain fatty acids by mixed cultures submitted to aerobic dynamic feeding. J. Biotechnol. 2006, 122, 226–238. [Google Scholar] [CrossRef]
  40. Avella, M.; Martuscelli, E.; Raimo, M. Review Properties of blends and composites based on poly(3-hydroxy)butyrate (PHB) and poly(3-hydroxybutyrate-hydroxyvalerate) (PHBV) copolymers. J. Mater. Sci. 2000, 35, 523–545. [Google Scholar] [CrossRef]
  41. Marang, L.; Jiang, Y.; van Loosdrecht, M.C.; Kleerebezem, R. Butyrate as preferred substrate for polyhydroxybutyrate production. Bioresour. Technol. 2013, 142, 232–239. [Google Scholar] [CrossRef]
  42. Shi, H.; Shiraishi, M.; Shimizu, K. Metabolic flux analysis for biosynthesis of poly(β-hydroxybutyric acid) in Alcaligenes eutrophus from various carbon sources. J. Ferment. Bioeng. 1997, 84, 579–587. [Google Scholar] [CrossRef]
  43. Kourmentza, C.; Kornaros, M. Biotransformation of volatile fatty acids to polyhydroxyalkanoates by employing mixed microbial consortia: The effect of pH and carbon source. Bioresour. Technol. 2016, 222, 388–398. [Google Scholar] [CrossRef] [PubMed]
  44. Wainaina, S.; Lukitawesa; Awasthi, M.K.; Taherzadeh, M.J. Bioengineering of anaerobic digestion for volatile fatty acids, hydrogen or methane production: A critical review. Bioengineered 2019, 10, 437–458. [Google Scholar] [CrossRef] [PubMed] [Green Version]
Figure 1. EGSB reactor used for the acidogenic fermentation of hydrolyzed BSG.
Applsci 11 03222 g001
Figure 2. BSG-particle size distribution before the grinding process and after the grinding process.
Applsci 11 03222 g002
Figure 3. (a) Fermentation products produced and (b) fermentation products profile obtained at each different pH (5.0, 5.5 and 6.0) and at each different organic load (10, 20, 30 and 40 gCOD L−1); (c) Estimated PHA precursors at each condition tested. Error bars represents standard deviations.
Applsci 11 03222 g003
Figure 4. (a) pH variation, (b) Sugar consumption, and (c) Fermentation products (FP) produced during EGSB operation.
Applsci 11 03222 g004
Table 1. Chemical composition of the BSG used in this study and comparison with literature data.
Components
(%, w/w)
This StudyCarvalheiro et al.
[20]
Pires et al.
[21]
Kanauchi et al.
[18]
Moisture72.2 ± 0.180n.a.n.a.
Asha3.40 ± 0.041.22.22.4
Proteina26.9 ± 0.124.639.124.0
Lipidsa11.5 ± 0.03n.a.10.510.6
Carbohydratesa46.2 ± 0.06 b51.536.247.2
Lignin a12 b21.725.611.9
n.a.—data not available; a dry weight basis; b Estimated values.
Table 2. Monosaccharide content and efficiency of BSG acid hydrolysis.
[Sugars]
(g L−1)
Hydrolysis Efficiency
(%)
Overall Hydrolysis Efficiency a
(%)
1st hydrolysis32.4 ± 2.656.084.5
2nd hydrolysis16.4 ± 2.964.6
a Calculated based on the initial amount of carbohydrates present in BSG.
Table 3. Characterization of BSG hydrolysate before and after neutralization.
Before
Neutralization
After
Neutralization
Calcium (g L−1)1.12 ± 0.044.60 ± 0.33
Magnesium (g L−1)1.76 ± 0.030.38 ± 0.04
Sodium (mg L−1)5.06 ± 0.074.90 ± 0.01
Sulfate (g L−1)66.6 ± 2.94.61 ± 1.8
Furfural (g L−1)0.71 ± 0.070.26 ± 0.05
5-HMF (mg L−1)70 ± 3030 ± 5
Acetic acid (g L−1)1.13 ± 0.141.52 ± 0.001
Glucose
(g L−1)
    (gCOD L−1)

3.47 ± 0.19

3.35 ± 0.31
3.68 ± 0.203.55 ± 0.33
Xylose
(g L−1)
     (gCOD L−1)

12.4 ± 2.8

9.20 ± 0.23
13.2 ± 2.99.75 ± 0.24
Arabinose
(g L−1)
     (gCOD L−1)

6.53 ± 0.60

4.94 ± 0.06
6.92 ± 0.645.23 ± 0.06
Total protein (g L−1)29.6 ± 1.919.7 ± 2.1
NH4+ (gN L−1)0.69 ± 0.050.64 ± 0.001
PO43− (mgP L−1)90 ± 10< 2
COD (gO2 L−1)56.8 ± 0.754.6 ± 0.8
C:N:P ratio
(C-mol:N-mol:P-mol)
100:31:60100:33:2
Table 4. Summary of the results obtained for each acidogenic batch assay. The values listed are averages ± standard deviation (values in brackets).
pH5.05.56.0
Organic Load (OL)
(gCOD L−1)
12.3 (0.4)22.6 (0.6)32.4 (0.6)35.8 (2.9)11.9 (0.3)22.6 (0.4)32.0 (1.5)39.2 (1.3)11.9 (0.5)23.7 (0.7)33.0 (0.1)39.9 (1.2)
FP produced (FP)
(gCOD-FP L−1)
6.01 (0.70)11.3 (1.7)13.3 (0.9)18.2 (0.5)6.34 (0.81)11.8 (0.9)15.6 (0.6)20.0 (1.8)6.27 (0.79)12.6 (0.5)17.8 (2.1)23.1 (2.2)
YFP/S
(gCOD-FP gCOD−1)
0.66 (0.11)0.69 (0.04)0.55 (0.04)0.60 (0.04)0.63 (0.04)0.57 (0.07)0.60 (0.05)0.44 (0.01)0.63 (0.03)0.60 (0.03)0.55 (0.02)0.52 (0.05)
rFP
(mgCOD-FP L−1 h−1)
42.2 (5.9)79.3 (14.9)93.2 (7.5)300 (76)45.0 (7.2)82.8 (8.4)170 (54)141 (15)44.5 (7.1)112 (36)125 (18)162 (19)
rFPmax
(mgCOD-FP L−1 h−1)
270 (34)531 (26)730 (58)915 (85)194 (15)502 (29)555 (14)745 (76)158 (15)383 (38)626 (47)1096 (82)
−rsmax
(mgCOD L−1 h−1)
405 (82)785 (50)1323 (128)1529 (119)300 (30)869 (251)916 (299)1692 (152)245 (24)609 (83)1146 (61)2104 (179)
qFP
(mgCOD-FP gVSS−1 h−1)
2.72 (0.44)4.45 (0.98)5.11 (0.83)16.2 (7.2)2.89 (0.51)4.29 (0.68)9.15 (3.07)9.78 (2.83)2.85 (0.73)6.45 (2.20)6.73 (1.42)10.3 (4.0)
qFPmax
(mgCOD-FP gVSS−1 h−1)
17.1 (3.4)29.8 (4.7)37.3 (7.4)50.2 (15.8)12.4 (1.8)24.5 (6.7)28.4 (9.8)48.0 (5.3)9.40 (1.70)20.2 (3.6)32.4 (6.6)71.6 (24)
−qsmax
(mgCOD gVSS−1 h−1)
25.5 (3.5)44.1 (1.4)67.3 (0.9)83.8 (7.2)19.1 (0.4)42.5 (5.8)46.8 (7.7)108 (4)14.7 (1.6)32.7 (1.2)59.5 (2.5)133 (13)
Degree of fermentation (DF)
(gCOD-FP gCOD−1)
0.49 (0.04)0.50 (0.06)0.41 (0.03)0.51 (0.06)0.53 (0.06)0.52 (0.04)0.49 (0.03)0.51 (0.03)0.52 (0.05)0.53 (0.01)0.54 (0.07)0.58 (0.05)
Table 5. EGSB performance in the last 10 days of operation (between days 20 and 29 of operation).
OLR
(gCOD L−1 d−1)
8.64 ± 0.60
FP produced (FP)
(gCOD L−1)
9.00 ± 1.59
rFP
(mgCOD-FP L−1 h−1)
147 ± 24
-rS
(mgCOD L−1 h−1)
360 ± 22
qFP
(mgCOD-FP gVSS−1 h−1)
13.8 ± 1.7
-qS
(mgCOD gVSS−1 h−1)
34.2 ± 5.5
FP profile [HAc/HProp/ETOH /HBut/HIsov/HVal]
(%COD basis)
22/1.2/4/3/69/2
HB:HV a
(%C-mol basis)
49:51
YFP/S
(gCOD-FP gCOD−1)
0.58 ± 0.1
Degree of Fermentation (DF)
(gCOD-FP gCOD−1)
0.41 ± 0.09
The values listed are averages ± standard deviation. a Estimated HB and HV values from the HB and HV precursors produced.
Publisher’s Note: MDPI stays neutral with regard to jurisdictional claims in published maps and institutional affiliations.

