Abstract
Highway systems play a key role in providing mobility to society, especially during emergency situations, including earthquakes. Bridges in highway systems are susceptible to damage from earthquakes, causing traffic capacity loss leading to a serious impact on surrounding areas. To better prepare for such scenarios, it is important to estimate capacity loss and traffic disruptions from earthquakes. For this purpose, a traffic-capacity-analysisbased methodology was developed to model the performance of a transportation network immediately following an earthquake using a macroscopic multi-level urban traffic planning simulation model EMME4. This method employs the second order linear approximation (SOLA) traffic assignment and calculates total system travel time for various capacity loss scenarios due to bridge damage from earthquakes. It has been applied to Pohang City in Korea to evaluate the performance of traffic networks in various situations. The results indicate a significant increase in travel time and a decrease in travel speed as the intensity of an earthquake increases. However, the impact on traffic volume varies depending on the bridges. It is assumed that the location of the bridges and traffic routing patterns might be the main reason. The results are expected to help estimate the impact on transportation networks when earthquakes cause traffic capacity loss on bridges.
1. Introduction
An earthquake is defined as a ‘’natural disaster’’ in accordance with the Framework Act on Disaster and Safety Management [1], and it can negatively impact structures, communication, and traffic. The frequency of earthquakes in Korea has increased, and since 1999, an average of 69.9 occurrences of earthquakes have occurred per year [2]. Furthermore, the frequency of occurrences and the magnitude of earthquakes have increased significantly since 2015. Therefore, more attention needs to be directed to mitigate various impact from earthquakes.
Recent earthquakes in Korea have been concentrated near Pohang City in Gyeongsangbuk-do. The following figure shows where earthquakes of magnitude 3.0 or higher occurred from 1 January 1990, to 30 March 2020 [2]. As shown in the figure, 15 earthquakes have occurred with greater number of earthquakes on land than at sea. Table 1 shows details of the earthquakes depicted in Figure 1.

Table 1.
Earthquakes with magnitude 3.0 and above in Pohang City [2].
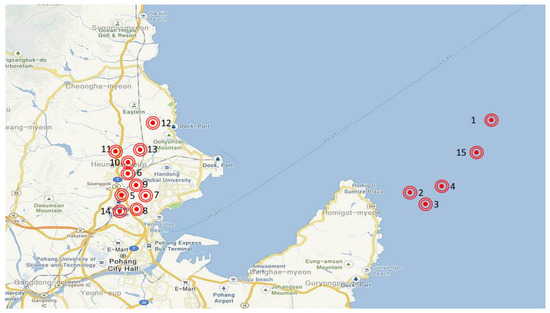
Figure 1.
Epicenter of 15 earthquakes in Pohang City (Source: Google Map [3]).
A bridge’s structural failure can disrupt traffic flow and degrade network performance [1]. One of the biggest impacts during earthquakes is disconnection of bridge transport networks, which could hamper post-earthquake emergency responses, such as the movement of emergency vehicles. Hence, analysis of traffic network is needed to better understand the overall impact caused by structural damages to bridges from earthquakes.
2. Literature Review
In the last several decades, various researchers have modeled structural damage to bridges using different analysis methods. Hosseini et al. proposed a multi-objective optimization algorithm (non-dominated sorting genetic algorithm (NSGA)-II) to minimize the deck acceleration and mid-span displacement [4]. In the later work, they proposed a multi-objective optimization algorithm named NSGA-II to determine the optimum radius for shape memory alloy [5]. They optimized the radius for the shape memory alloy and implemented a benchmark bridge to reduce excessive displacements.
While structural damages from earthquakes have been investigated in various capacities, other researchers have focused on estimating the performance of highway networks due to bridge damage from earthquakes. They examined the impact of traffic networks and the resilience of bridges after earthquakes. Tak et al. presented a new methodology for seismic severity assessment using the probabilistic seismic hazard analysis (PSHA) method, measured system-level performance using matrix-based frameworks, and evaluated seismic risk using total probability theorem, thus providing the bridges in Pohang with new methodologies, such as the magnitude of earthquakes and uncertainties following the past earthquake cases and uncertainty [6]. Byun emphasized the need to efficiently adjust the evacuation of residents in case of emergency and strengthen the joint response system of civilian, government, and military officials. The research was conducted with the aim of finding ways to minimize damage and social damage of residents in the event of a disaster [7].
Yoon et al. proposed an artificial-neural-network-based surrogate model for accelerated seismic risk assessment of a system-level bridge transportation network. Total system travel time was analyzed as a performance index to evaluate the performance of the bridge network. It was stated that total system travel time calculation was to be adopted as a performance index due to high calculation costs [8]. Yeom performed a one-to-one algorithm for dynamic evacuation routes searching under events of natural disasters. For the analysis, the moving cell model was applied to find dynamic routes [9]. Kim et al. proposed a method of assessing changes in traffic flow after earthquakes in California and developed a probability model to quantify degree of damage to traffic networks after bridge repair and reinforcement. Structural damage of bridges was analyzed based on delay time using capacity and changing initial speed [10]. Na et al. proposed a method to prioritize seismic reinforcement of bridges within road networks in California and created probabilistic earthquake scenarios to evaluate the effects of seismic reinforcement by measuring traffic delay for various scenarios [11].
Lee proposed a methodology to select disaster evacuation roads after the Great East Japan Earthquake. The disaster response transportation plan was developed by separating emergency transportation routes [12]. Chang et al. developed a scenario-based methodology to integrate trip distribution and an assignment model to measure the performance of post-earthquake transportation systems. The proposed model was applied to the Sioux Falls road network [13].
While structural damages from earthquakes have been investigated in various capacities, there has been a limited examination of the impact on traffic networks and the resilience of bridges after earthquakes [14,15,16,17,18,19,20,21,22,23,24,25,26,27]. Additionally, most impact analyses of traffic networks have been based on the simplified application of traffic capacity. To better analyze traffic networks impacted by structural damage to bridges from earthquakes, various speed restrictions and lane closure scenarios are examined in this study.
3. Model Development
Traffic simulation software packages have been widely used in modelling, planning, and analysis of traffic networks and systems [28,29,30,31]. Traffic simulation models generally can be classified into microscopic, mesoscopic, and macroscopic models. Microscopic traffic simulation programs model individual vehicles of transportation systems, while macroscopic simulation programs aggregate characteristics of traffic elements with more simplified networks. In this study, large-scale performance of traffic network is investigated for various capacity loss scenarios due to bridge damage from earthquakes. Since aggregate characteristics of traffic elements such as total system travel time and average speed are compared with difference scenarios, macroscopic approach is selected for the investigation. Among many other macroscopic traffic simulation models, EMME4 was selected for the analysis [32,33]. EMME4 is a multimodal traffic planning prediction system consisting of complementary software applications. This model is used by planners to implement a mobility model allowing virtual laboratories to test the impact and interactions of traffic policies, demographics, and urban geography on available traffic infrastructure. Among various allocation techniques in the EMME4 program, input data for EMME include origin/destination trip matrix and highway network data with detailed information about each highway link, for example, node, length, link type, number of lanes, speed limit, and volume-delay function. Output from the model include traffic volume, travel speed, and travel time for each link. Detailed information about the program can be found in [34,35]. Among many available assignment tools provided in EMME4, second line approximation (SOLA) assignment was used in this study. SOLA is an extremely efficient implementation of linear approximation transformation, a method that is rapidly converted into a finer solution than other linear approximation. Additionally, this method provides significant performance benefits to multiprocessing systems. The definition of SOLA allocation techniques is described in [32] as follows: “The algorithm that has been influenced in the Second Line Approximation (SOLA) traffic assignment tool is an efficient multi-threaded adjustment of the bi-conjugate line expansion method for operation of the solution”. Ref. [36]. The behavioral assumption of the problem with the equilibrium allocation method is that each user chooses the path they know best. If there is a shorter route than the one on which the driver is travelling, the driver will choose that route. This leads to a flow that satisfies the Wardrop’s user-optimal principle that no user can improve travel time by changing paths. Recently, it has been demonstrated by empirical studies using GPS and GIS technologies that people’s actual route choice practice has discrepancies with the Wardrop’s user-optimal principle [37]. Zhu and Levinson found that about two-thirds of the subject drivers did not use the shortest travel time path during a three-week study time period. However, in most circumstances, people choose routes that were less than 5 min longer than the shortest time routes. Therefore, it can be argued that travelers are still rational following the Wardrop’s user-optimal principle in minimizing their perceived travel time while limited in their capacity to get perfect information. The advantage of the Wardrop’s user-optimal principle is that this behavioral assumption allows traffic simulation software programs to solve the network assignment problems with mathematical computations. For this reason, transportation simulation software programs have been using this concept for decades for network assignment problems. Under this assumption, travel times in all routes actually used are equal and less than those that would be experienced by a single vehicle on any unused route. This principle has been accepted as a sound and simple behavioral principle to describe route choice over alternate routes due to congested traffic conditions [38].
To solve the equilibrium problem, the SOLA method in EMME4 has many advantages, including (1) traffic does not need to be explicitly stored, so there are not many data storage requirements; (2) it is parallelized with new multiprocessor and shared memory architectures; and (3) when fully fused, a quasi-probability path flow—a unique link/turn class flow—is created and proportionality is observed.
To model the Pohang area, Daegu Metropolitan Area Network and Daegu Metropolitan Area Origin/Destination Data distributed by the National Transportation Database Center were used to create a network around Pohang, Gyeongsangbuk-do (Figure 2). In the network model, initial speed and VDF (volume delay function) parameters for each link were modified to represent actual traffic volume on the road.
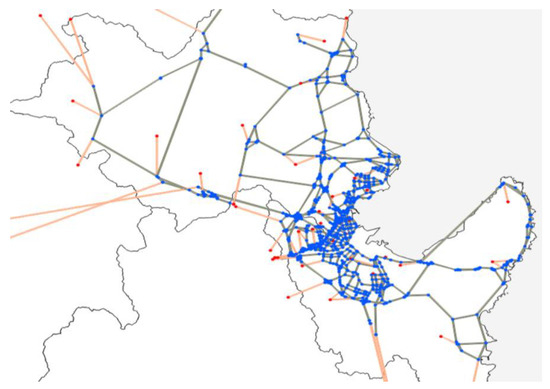
Figure 2.
Network map of Pohang city.
For the analysis of macroscopic traffic network impacted by structural damage to bridges from earthquakes, seven bridges in Pohang City were selected due to their proximity to shelters in the area. Table 2 shows detailed information of the selected bridges and Figure 3 displays location of the selected bridges.
Table 2.
Information of selected bridges.
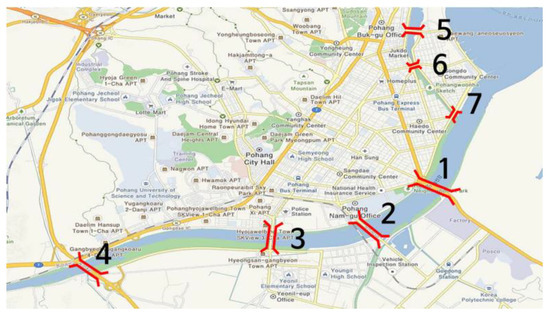
Figure 3.
Location of the selected bridges.
In the event of earthquakes, some lanes will be closed to general purpose vehicles in order to accommodate emergency vehicles. Additionally, speed limit will be imposed to mitigate structural damages to bridges. Therefore, these conditions were included in this study.
Three different structural damage levels to bridges were considered in this study: minor damage, moderate damage, and major damage. Based on this parameter, lanes in use and speed limit were varied to replicate scenarios caused by damage to bridges from earthquakes. For comparison purposes, no damage scenario was included. In this paper, it is assumed that in minor damage scenario, approximately 30% of lanes would be closed and speed limit would be lowered to approximately 70% of the speed limit of “No Damage” scenario. Additionally, in more significant damage scenarios, “Moderate Damage” and “Major Damage”, approximately 60% and 80% of lanes, would be closed and speed limit would be lowered to approximately 30% and 20% of “No Damage” scenario, respectively. Table 3 displays lanes in use and speed limit information for each scenario.
Table 3.
Bridge operation scenarios.
4. Analysis
Simulation output for the no damage scenario is provide in Table 4. According to the results, average travel time ranged from 0.08 min to 0.85 min per bridge and average travel speed ranged from 37.2 km/h to 57.3 km/h. Traffic volume displayed a larger range.
Table 4.
No damage scenario simulation results.
Simulation output for the minor damage scenario is provided in Table 5. According to the results, average travel time ranged from 0.14 min to 2.24 min per bridge and average travel speed ranged from 12.6 km/h to 35.3 km/h. Due to lane closure and reduction in speed limit, average travel time increased while average travel speed decreased in this scenario.
Table 5.
Minor damage scenario simulation results.
Simulation output for the minor damage scenario is provide in Table 6. According to the results, average travel time ranged from 0.25 min to 4.29 min per bridge and average travel speed ranged from 7.6 km/h to 16.9 km/h.
Table 6.
Moderate damage scenario simulation results.
Simulation output for the minor damage scenario is provide in Table 7. According to the results, average travel time ranged from 0.45 min to 17.81 min per bridge and average travel speed ranged from 2.0 km/h to 11.8 km/h.
Table 7.
Major damage scenario simulation results.
Table 8 and Figure 4 display average travel time comparisons for the selected scenarios. As expected, major damage scenario shows the most increase in average travel time. Bridges connecting southern and northern part of the city (Bridges 1 through 4) had greater increase compared to other bridges (Bridges 5 through 7). Table 9 and Figure 5 show average travel speed comparisons. Similar to the travel time comparison, Bridges 1 through 4 demonstrate higher speed reduction. Bridge 5 was less affected by the earthquakes showing the least speed decrease and travel time increase. It is believed that Bridges 1 through 4 are more critical to serve the northbound and southbound traffic, while Bridge 5 is positioned to handle relatively small number of traffic volume in northeast corner of the city.
Table 8.
Travel time comparison.
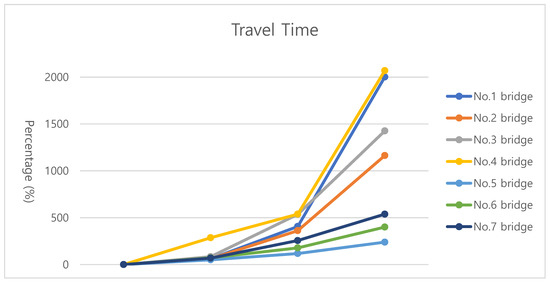
Figure 4.
Travel time comparison.
Table 9.
Travel speed comparison.
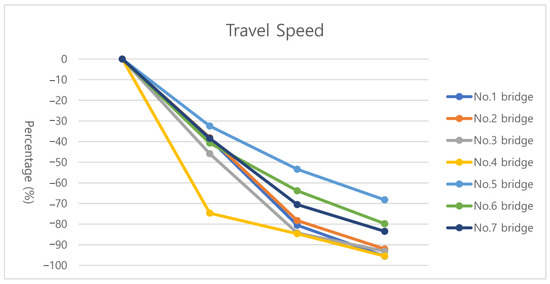
Figure 5.
Travel speed comparison.
Table 10 shows traffic volume comparisons for the selected scenarios. It is apparent that some traffic volumes were diverted to other bridges. For example, higher number of traffic volume passed through Bridges 2 and 4, while there was significant diversion on Bridges 6 and 7. Vehicles that used Bridges 6 or 7 might have taken alternative routes to minimize their travel times. This diversion can be studied with further information of traffic volume on nearby highway links.
Table 10.
Traffic volume comparison.
5. Conclusions
Highway systems play a key role in providing mobility to society, especially during emergency situations including earthquakes. Bridges in highway systems are susceptible to damage from earthquakes, causing traffic capacity loss leading to a serious impact in surrounding areas. To better prepare for such scenarios, it is important to estimate capacity loss and traffic disruptions from earthquakes. For this purpose, a traffic capacity analysis-based methodology is developed to model the performance of a transportation network immediately following an earthquake using a macroscopic multi-level urban traffic planning simulation model EMME4. The proposed method employs the second order linear approximation (SOLA) traffic assignment and calculates total system travel time for various capacity loss scenarios due to bridge damage from earthquakes. The proposed methodology is applied to Pohang City in Korea to evaluate the performance of traffic network for various scenarios. As expected, travel time increases and travel speed decreases significantly as the intensity of earthquake increases. However, similar correlation is not found in traffic volume. It seems that traffic volume of bridges varies depending on the location of the bridge. It is believed that changes in traffic routing at different levels of earthquake scenarios lead to different traffic volume outputs. Based on the traffic volume comparison, there was significant diversion on Bridges 2 and 4 from Bridge 1. Additionally, fewer vehicles have taken Bridges 5 or 6. It is believed that vehicles that used Bridges 5 or 7 might have taken alternative routes to minimize their travel times. From the results, it was readily seen that Bridges 2 and 4 would play a significant role when the functionality of other bridges was impacted by an earthquake. The results are expected to help estimate the impacts on transportation network when earthquakes bring traffic capacity loss on bridges. In this study, the same origin and destination table was utilized for all scenarios. However, travel patterns and behaviors differ greatly in events of natural disasters, including earthquakes. While it is almost impossible to predict this exact travel pattern, it might be advantageous to develop a framework enabling exploration of potential scenarios where travel behaviors are significantly altered due to earthquakes. The outcome of this study should help one analyze the traffic network impact caused by structural damage to bridges due to earthquakes.
Author Contributions
W.S. and Y.-J.L. conceived of the presented idea. J.C. developed the theory and performed the computations. S.M.L. and K.H.S. revised the manuscript. All authors have read and agreed to the published version of the manuscript.
Funding
This work was partially supported by NRF-2020R1A2C1011060 of the Korean government and a grant (21SCIP-B146959-04) from Construction technology research program funded by Ministry of Land, Infrastructure and Transport of Korean government.
Institutional Review Board Statement
Not applicable.
Informed Consent Statement
Not applicable.
Data Availability Statement
Data available on request.
Acknowledgments
This work was supported by NRF-2020R1A2C1011060 of the Korean government and a grant (21SCIP-B146959-04) from Construction technology research program funded by Ministry of Land, Infrastructure and Transport of Korean government.
Conflicts of Interest
The authors declare no conflict of interest.
References
- Public Safety and Security. Framework Act on Disaster and Safety Management; Ministry of Public Safety and Security: Sejong, Korea, 2018. [Google Scholar]
- Korea Meteorological Administration. Earthquake Data; Korea Meteorological Administration: Dongjak-gu, Seoul, Korea, 2020. [Google Scholar]
- Google. Google Map; Google: Menlo Park, CA, USA, 2020. [Google Scholar]
- Hosseini, R.; Rashidi, M.; Hedayati Dezfuli, F.; Karbasi Arani, K.; Samali, B. Seismic assessment of a benchmark highway bridge equipped with optimized shape memory alloy wire-based isolators. Appl. Sci. 2020, 10, 141. [Google Scholar] [CrossRef]
- Hosseini, R.; Rashidi, M.; Bulajić, B.Đ.; Arani, K.K. Multi-Objective Optimization of Three Different SMA-LRBs for Seismic Protection of a Benchmark Highway Bridge against Real and Synthetic Ground Motions. Appl. Sci. 2020, 10, 4076. [Google Scholar] [CrossRef]
- Tak, H.Y.; Suh, W.; Lee, Y.J. System-level seismic risk assessment of bridge transportation networks employing probabilistic seismic hazard analysis. Math. Probl. Eng. 2019, 17. [Google Scholar] [CrossRef]
- Byun, C. Analyzing Effects of Evacuation Strategy in Emergency Situation by Using Traffic Assignment; Hanyang University: Seoul, Korea, 2000. [Google Scholar]
- Yoon, S.; Kim, J.; Kim, M.; Tak, H.Y.; Lee, Y.J. Accelerated System-Level Seismic Risk Assessment of Bridge Transportation Networks through Artificial Neural Network-Based Surrogate Model. Appl. Sci. 2020, 10, 6476. [Google Scholar] [CrossRef]
- Yum, S. A Study on Dynamic Evacuation Route Searching for Traveling Vehicles under Disaster Conditions; Myongji University: Seoul, Korea, 2013. [Google Scholar]
- Kim, S.H.; Massanobu, S.; Kim, J.I. Seismic performance of transportation networks. J. Earthq. Eng. Soc. Korea 2004, 8, 43–52. [Google Scholar]
- Na, U.J.; Park, T.W.; Shinozuka, M. Retrofit Prioritization of Highway Network considering Seismic Risk of System. J. Earthq. Eng. Soc. Korea 2008, 12, 47–53. [Google Scholar]
- Lee, J.A. Study on the Disaster Prevention Road Network System through the Japan Case. Int. J. Highw. Eng 2013, 15, 5–8. [Google Scholar]
- Chang, L.; Peng, F.; Ouyang, Y.; Elnashai, A.S.; Spencer Jr, B. F Bridge seismic retrofit program planning to maximize postearthquake transportation network capacity. J. Infrastruct. Syst. 2012, 18, 75–88. [Google Scholar] [CrossRef]
- Kim, J.; Deshmukh, A.; Hastak, M. A framework for assessing the resilience of a disaster debris management system. Int. J. Disaster Risk Reduct. 2018, 28, 674–687. [Google Scholar] [CrossRef]
- Yoon, S.; Lee, Y.J.; Jung, H.J. A comprehensive approach to flow-based seismic risk analysis of water transmission network. Struct. Eng. Mech. 2020, 73, 339–351. [Google Scholar]
- Choi, E.; Song, J. Development of Multi-Group Non-dominated Sorting Genetic Algorithm for identifying critical post-disaster scenarios of lifeline networks. Int. J. Disaster Risk Reduct. 2019, 41, 101299. [Google Scholar] [CrossRef]
- Sanchez-Silva, M.; Daniels, M.; Lleras, G.; Patino, D. A transport network reliability model for the efficient assignment of resources. Transp. Res. Part B Methodol. 2005, 39, 47–63. [Google Scholar] [CrossRef]
- Hosseini, S.; Barker, K.; Ramirez-Marquez, J.E. A review of definitions and measures of system resilience. Reliab. Eng. Syst. Saf. 2016, 145, 47–61. [Google Scholar] [CrossRef]
- Kammouh, O.; Cimellaro, G.P.; Mahin, S.A. Downtime estimation and analysis of lifelines after an earthquake. Eng. Struct. 2018, 173, 393–403. [Google Scholar] [CrossRef]
- Sharma, N.; Tabandeh, A.; Gardoni, P. Regional resilience analysis: A multiscale approach to optimize the resilience of interdependent infrastructure. Comput. -Aided Civ. Infrastruct. Eng. 2020, 35, 1315–1330. [Google Scholar] [CrossRef]
- Masoomi, H.; Burton, H.; Tomar, A.; Mosleh, A. Simulation-based assessment of postearthquake functionality of buildings with disruptions to cross-dependent utility networks. J. Struct. Eng. 2020, 146, 04020070. [Google Scholar] [CrossRef]
- Zhang, W.; Wang, N.; Nicholson, C. Resilience-based post-disaster recovery strategies for road-bridge networks. Struct. Infrastruct. Eng. 2017, 13, 1404–1413. [Google Scholar] [CrossRef]
- Kilanitis, I.; Sextos, A. Impact of earthquake-induced bridge damage and time evolving traffic demand on the road network resilience. J. Traffic Transp. Eng. 2019, 6, 35–48, (English Edition). [Google Scholar] [CrossRef]
- Lee, Y.J.; Song, J.; Gardoni, P.; Lim, H.W. Post-hazard flow capacity of bridge transportation network considering structural deterioration of bridges. Struct. Infrastruct. Eng. 2011, 7, 509–521. [Google Scholar] [CrossRef]
- Chang, L.; Elnashai, A.S.; Spencer, B.F., Jr. Post-earthquake modelling of transportation networks. Struct. Infrastruct. Eng. 2012, 8, 893–911. [Google Scholar] [CrossRef]
- Zanini, M.A.; Pellegrino, C.; Morbin, R.; Modena, C. Seismic vulnerability of bridges in transport networks subjected to environmental deterioration. Bull. Earthq. Eng. 2013, 11, 561–579. [Google Scholar] [CrossRef]
- Yi, J.H.; Youn, J.Y.; Yun, C.B. Seismic risk assessment of bridges using fragility analysis. J. Earthq. Eng. Soc. Korea 2004, 8, 31–43. [Google Scholar]
- Suh, W.H.; Park, J.W.; Kim, J.R. Traffic safety evaluation based on vision and signal timing data. Proc. Eng. Technol. Innov. 2017, 7, 37–40. [Google Scholar]
- Park, K.S.; An, S.H.; Kim, H.; Joh, C.H.; Suh, W. Spatial Analysis of Subway Ridership: Rainfall and Ridership. Proc. Eng. Technol. Innov. 2016, 4, 1. [Google Scholar]
- Suh, W. Mitigating initialization bias in transportation modeling applications. Proc. Eng. Technol. Innov. 2016, 3, 34. [Google Scholar]
- Suh, W.; Kim, J.R.; Cho, J. Vision Technology Based Traffic Safety Analysis Using Signal Data. Proc. Eng. Technol. Innov. 2019, 13, 20. [Google Scholar]
- INRO, EMME/4. 2020. Available online: https://www.inrosoftware.com/en/products/emme/ (accessed on 17 February 2021).
- Florian, D. Emme 4 Overview: New Features, Demonstrations and Upgrade Details; INRO: Montreal, QC, Canada, 2013. [Google Scholar]
- Babin, A.; Florian, M.; James-Lefebvre, L.; Spiess, H. Emme/2 an interactive graphic method for road and transit planning. Transp. Res. Rec. 1985, 866, 1–9. [Google Scholar]
- Kucirek, P. Sola Traffic Assignment Comparison with Standard Traffic Assignment; University of Toronto: Toronto, ON, Canada, 2014. [Google Scholar]
- Wardrop, J.G. Road paper. some theoretical aspects of road traffic research. Proc. Inst. Civ. Eng. 1952, 1, 325–362. [Google Scholar] [CrossRef]
- Zhu, S.; Levinson, D. Do people use the shortest path? An empirical test of Wardrop’s first principle. PLoS ONE 2015, 10, e0134322. [Google Scholar] [CrossRef]
- Beckmann, M.; McGuire, C.B.; Winsten, C.B. Studies in the Economics of Transportation; RAND Corporation: Santa Monica, CA, USA, 1955. [Google Scholar]


Publisher’s Note: MDPI stays neutral with regard to jurisdictional claims in published maps and institutional affiliations. |
© 2021 by the authors. Licensee MDPI, Basel, Switzerland. This article is an open access article distributed under the terms and conditions of the Creative Commons Attribution (CC BY) license (https://creativecommons.org/licenses/by/4.0/).