Article

A Framework for Diagnosing Urban Rail Train Turn-Back Faults Based on Rules and Algorithms

1
Department of Information Management, School of Economics and Management, Beijing Jiaotong University, Beijing 100044, China
2
Department of Vehicle Engineering, School of Mechanical Engineering, Hebei University of Technology, Tianjin 300401, China
*
Author to whom correspondence should be addressed.
Appl. Sci. 2021, 11(8), 3347; https://doi.org/10.3390/app11083347
Submission received: 18 March 2021 / Revised: 30 March 2021 / Accepted: 2 April 2021 / Published: 8 April 2021

Abstract

:
Although urban rail transit provides significant daily assistance to users, traffic risk remains. Turn-back faults are a common cause of traffic accidents. To address turn-back faults, machines are able to learn the complicated and detailed rules of the train’s internal communication codes, and engineers must understand simple external features for quick judgment. Focusing on turn-back faults in urban rail, in this study we took advantage of related accumulated data to improve algorithmic and human diagnosis of this kind of fault. In detail, we first designed a novel framework combining rules and algorithms to help humans and machines understand the fault characteristics and collaborate in fault diagnosis, including determining the category to which the turn-back fault belongs, and identifying the simple and complicated judgment rules involved. Then, we established a dataset including tabular and text data for real application scenarios and carried out corresponding analysis of fault rule generation, diagnostic classification, and topic modeling. Finally, we present the fault characteristics under the proposed framework. Qualitative and quantitative experiments were performed to evaluate the proposed method, and the experimental results show that (1) the framework is helpful in understanding the faults of trains that occur in three types of turn-back: automatic turn-back (ATB), automatic end change (AEC), and point mode end change (PEC); (2) our proposed framework can assist in diagnosing turn-back faults.

1. Introduction

Urban rail transit is a vehicle transportation system that adopts a track structure to carry and guide passengers. According to the requirements of the overall urban transportation plan, a fully enclosed or partially enclosed dedicated railway line is established. This is a public transportation method that transports a large number of passengers in the form of trains [1]. Any fault of the system may cause significant casualties and property losses. Therefore, fault diagnosis is of great significance to ensure the passengers’ safety and social stability.
The urban rail transit industry has accumulated a large amount of data on intercity railways. Based on data collected from China national knowledge infrastructure (CNKI) and Wanfang Databases, Figure 1 shows the number of lines, total distance, and the number of cities involved in China’s urban rail transit from 2015 to 2019. Detection and resolution of turn-back failures in time to avoid threats to the safety of people is a major challenge for managers. Thus, the diagnosis of train reentry failure is a meaningful research direction.
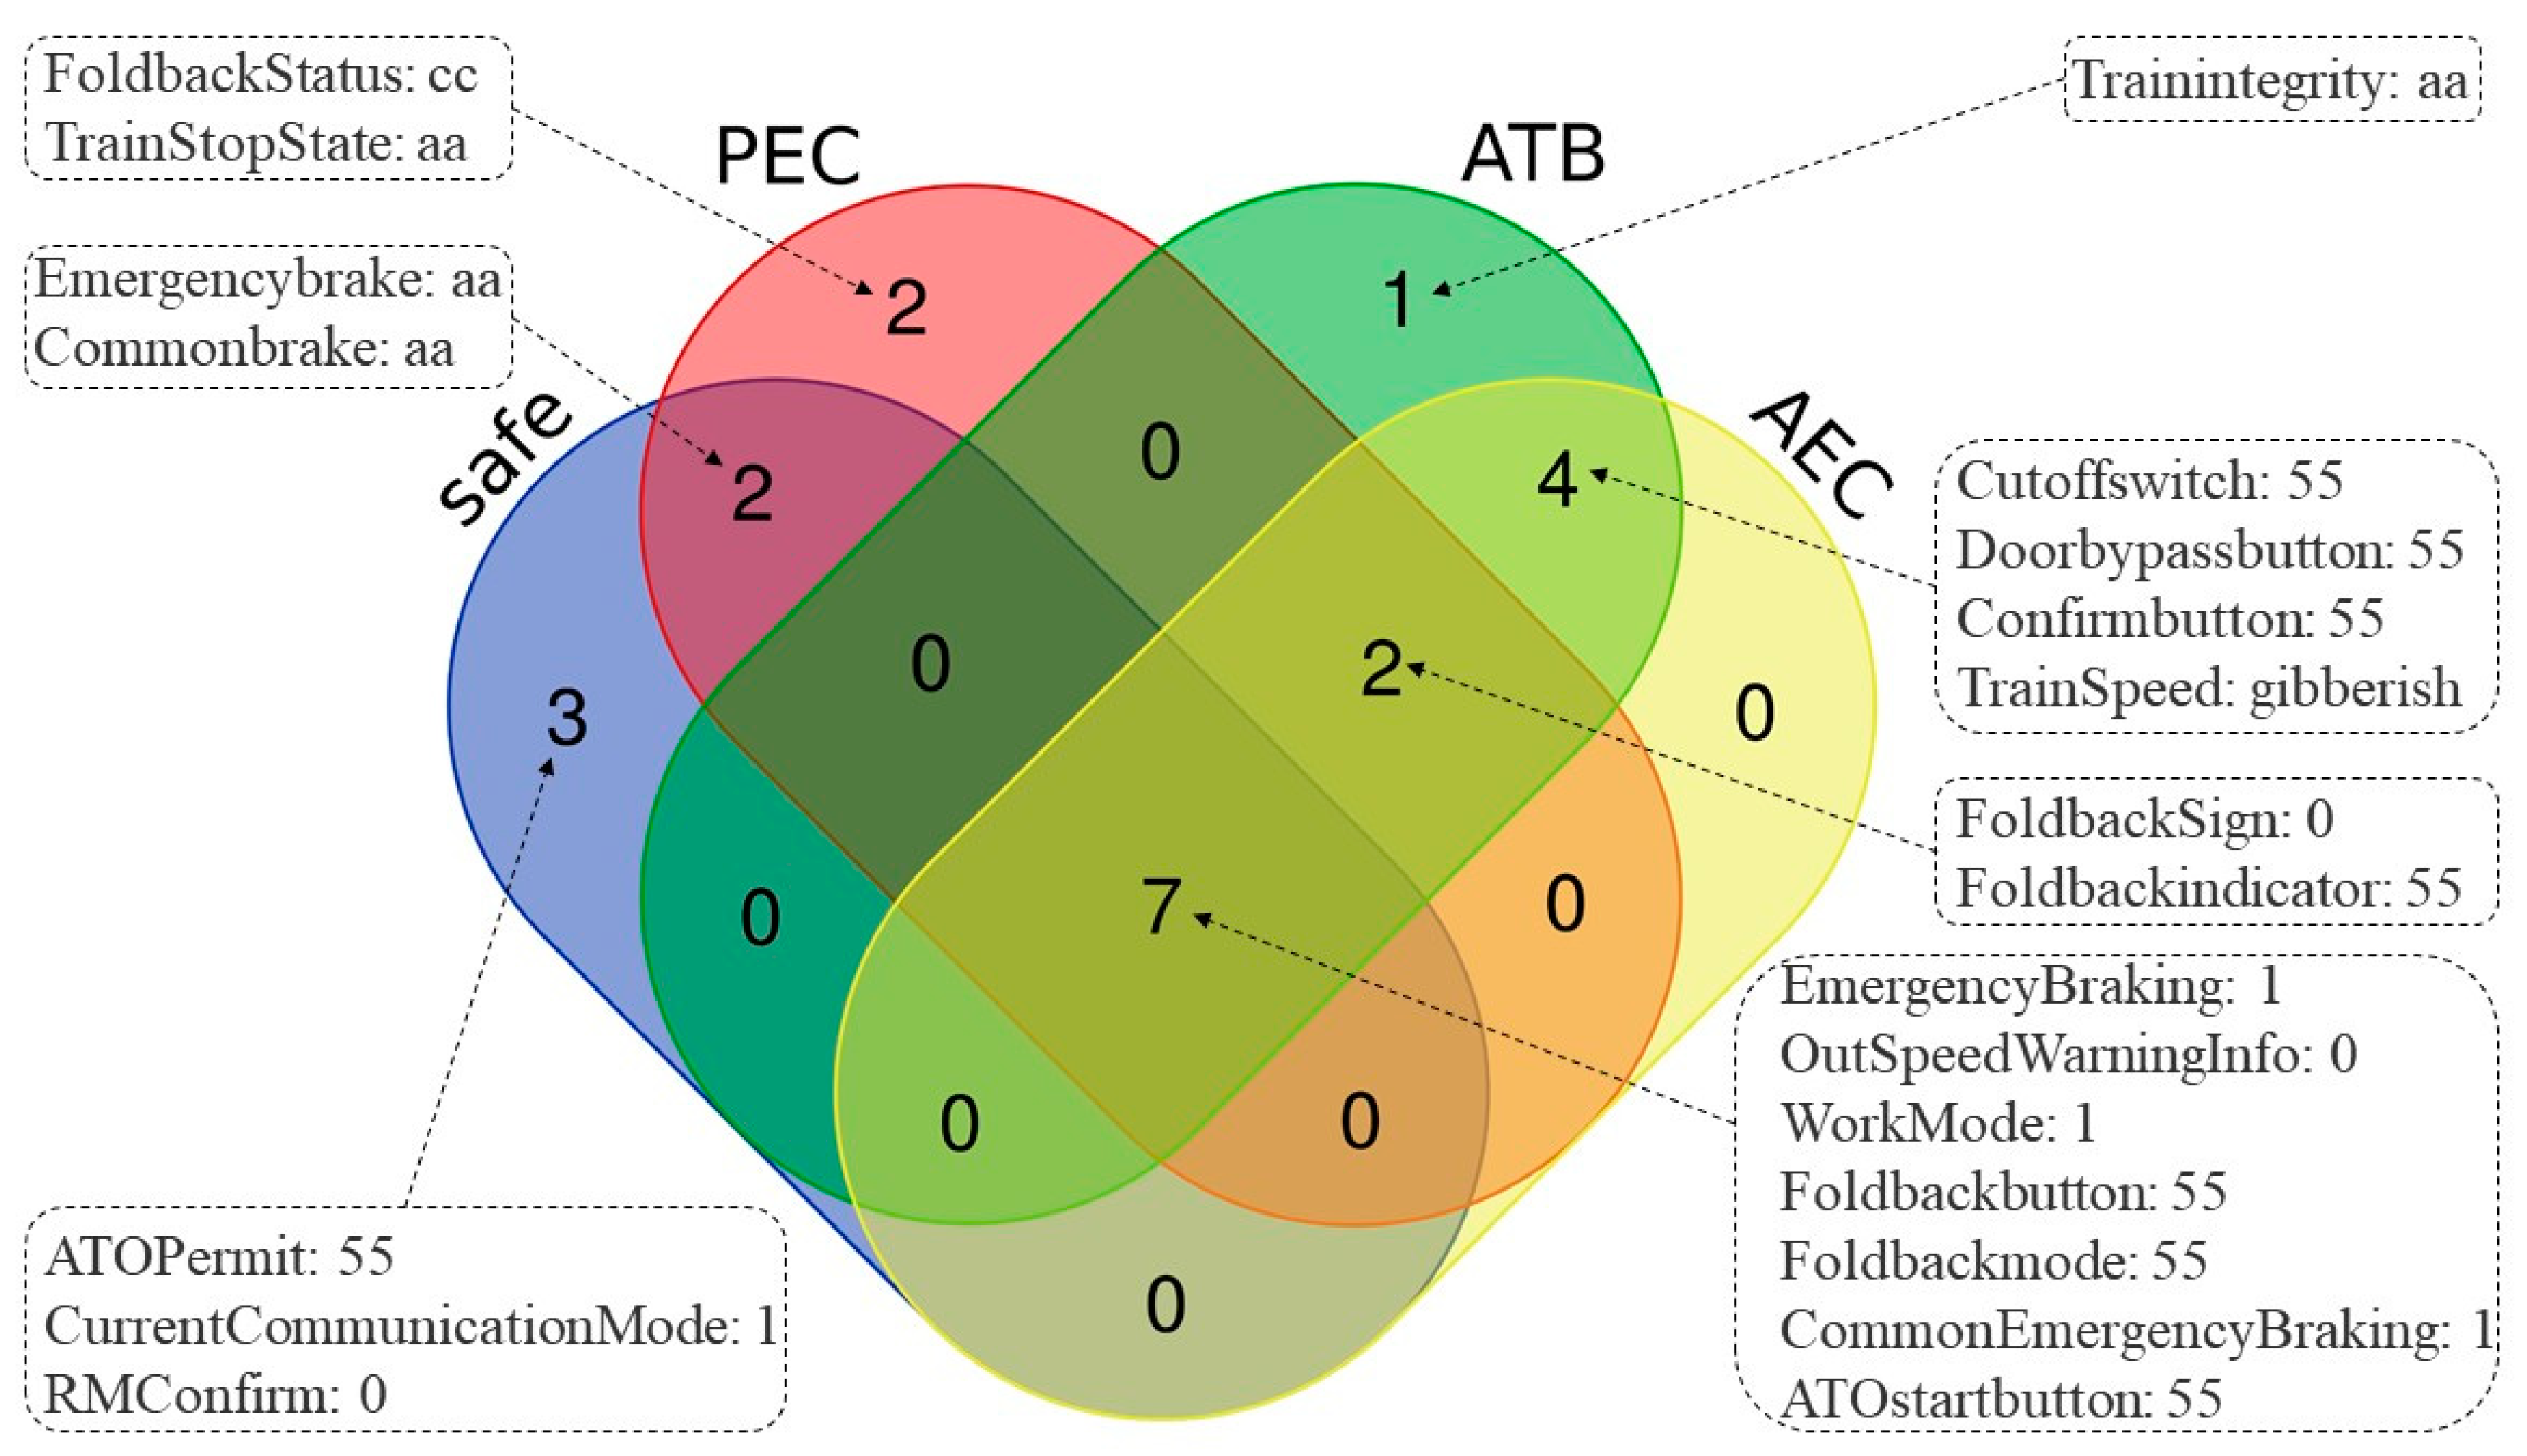
Three types of turn-back faults can occur in the operation of trains, : automatic turn-back (ATB), automatic end change (AEC), and point mode end change (PEC). Failures in the three reentry scenarios lead to major accidents; however, compared with ATB, few studies have been undertaken on AEC and PEC [2,3,4]. In this study, the characteristics of AEC and PEC failures were obtained to contribute to the related research.
Research into the three different kinds of turn-back fault has been undertaken to help the system make an accurate and timely diagnosis. From a data-driven perspective, this research uses an overall framework for understanding train failure during reentry. Specifically, the research on urban rail transit can (1) mine different reentry rules; (2) combine rules and algorithms to improve the quality and accuracy of algorithms; and (3) help testers analyze, understand, and determine the faults.
Based on the urban rail transit system, this study analyzed tabular and text data. We searched and cleaned the data in train work logs and daily work reports of field testers. As implied by the “no free lunch theorem” [5], there is no universal optimal algorithm. This research combined real application scenarios and domain knowledge to conduct a comparative test of classification algorithms. We established a data set containing three types of turn-back failures. This data set is large, and the proportional distribution of fault categories was kept to be consistent with the real scene. The data set containing all three reentry scene failures is valuable for the field of urban rail transit failures.
Understanding these failures can improve the efficiency of the urban rail transit system and ensure the safety of passengers. The frequent itemset generation (FIG) algorithm can be used to mine the rules under different failure scenarios. Classification algorithms, such as random forest (RF) [6], gradient boosting decision tree (GBDT) [7], AdaBoost [8], classification regression tree (CART) [9], logistic regression (LR) [10], support vector machine (SVM) [11], and naïve Bayes [
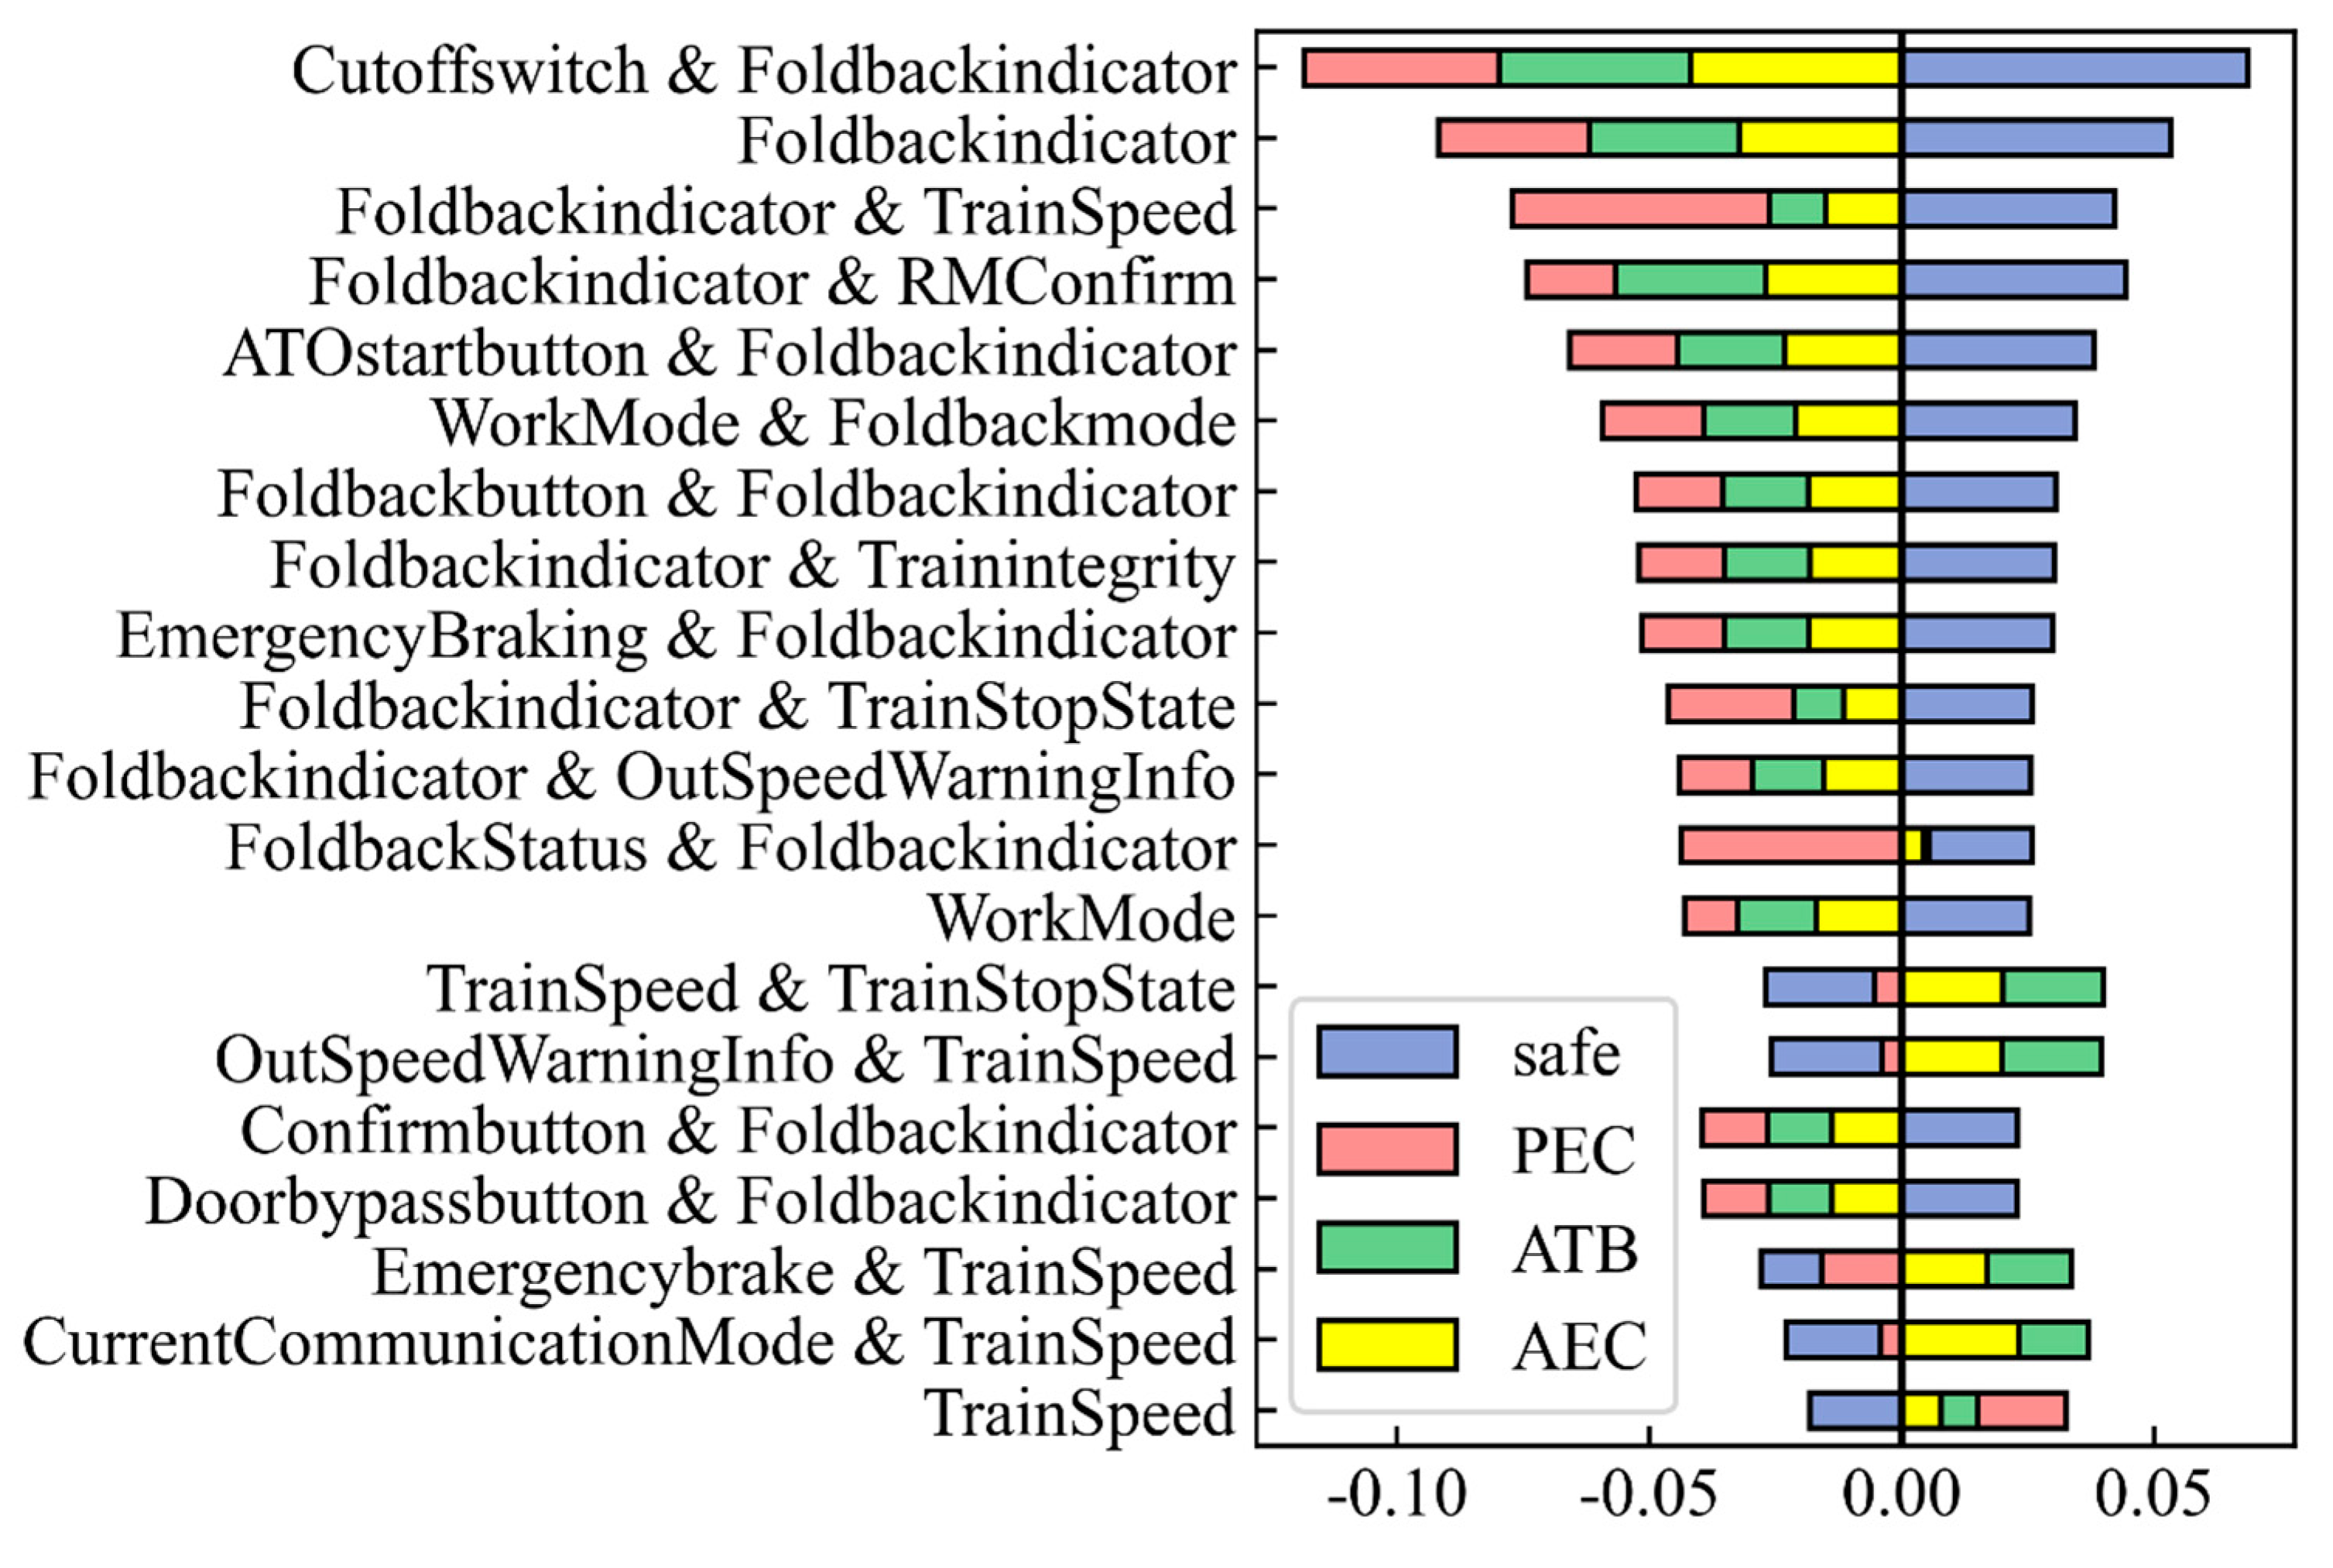
12], are often used in the research of classification problems in industrial scenarios. In this study, we used the frequent itemset generation algorithm based on Spark to mine feature combinations that frequently appeared in the work log and performed feature crossover based on the frequent item sets. Then, we trained the classification algorithm to automatically determine when the failure occurs was an automatic turn-back (ATB), automatic end change (AEC), or point mode end change (PEC).
We used machine learning methods to understand and judge the reentry failures of urban rail transit. In this study, we proposed a framework to (1) generate the fault rules, and classify faults into different return categories based on these rules, and (2) analyze the probability distribution of the topics in the daily work report to understand the characteristics of turn-back faults. The framework can help machines, experts, and testers to cooperate in analyzing the failures of urban rail transit turn-back faults.
The reason for choosing this method in this study is the need to identify the type of failure for more efficient maintenance. Classification algorithms and topic modeling can be of assistance in this process.
The remainder of this paper is organized as follows: Chapter II reviews previous literature on urban rail transit, classification algorithms, and topic modeling. Chapter III describes the turn-back method and communication module of urban rail trains. Chapter IV introduces the data set and presents descriptive statistics. Chapter V presents the design of the overall framework. Chapter VI conducts simulation experiments and compares the results. Chapter VII presents conclusions.

2. Literature Review

Previous research involves three areas: (1) urban rail transit, (2) the classification algorithm, and (3) topic modeling.

2.1. Urban Rail Transit

Research on urban rail has mainly focused on modeling of the communication-based train control (CBTC) system of urban rail transit communication. Huang and Huang proposed the design of the communication subsystem of the urban rail transit CBTC system, which transmits information to trains through two-way channels in real time to ensure the safety of urban rail transit trains [13]. Xiao and Zheng also studied the CBTC system of urban rail transit trains. They reordered the weights of various indicators through fuzzy decision trajectory and evaluation laboratory analysis of the process and the factors’ network, finally improving the service quality of urban rail transit [14]. Srisooksai et al. used the deep learning approach to classify the transmission signal of the CBCT system [15]. Castiglione and Lupu studied system information security issues by quantifying CBTC system signals and external attack signals [16]. Singh and Mishra analyzed and compared the request to send/clear to send (RTS/CTS) media access mechanisms, noting that they are suitable for signal transmission in the CBTC system [17].
Furthermore, other scholars have focused on research of the vehicle on-board controller (VOBC), which is one of CTBC’s subsystems. Gu et al. proposed a cloud sharing idea for real-time diagnostic data based on the diagnostic data of the VOBC system in urban rail transit, which provided a basis for solving the problem of sharing and analyzing these real-time diagnostic data [18]. Wang et al. developed a hybrid online model-based testing (MBT) platform and tested it with real VOBC data [19].
The goal of other researchers was to investigate and analyze the passenger volume of urban rail transit. Li et al. established a traffic flow prediction model using the seasonal autoregressive integrated moving average model (SARIMA) and a support vector machine (SVM). They concluded that the SARIMA-SVM model can fully characterize traffic flow changes and is suitable for the passenger flow prediction of urban rail transit [20]. Su and Li used a hybrid logit model to construct an optimization model for collaborative control of urban rail transit network passenger flow, which describes the online distribution of passenger flow in the urban rail transit network [21].
Our research is based on the above content. The focus of this study is on the analysis and identification of three different kinds of turn-back of urban rail transit trains: automatic end change (AEC), automatic turn-back (ATB), and point mode end change (PEC). We aimed to combine structured data and text data to analyze the return method and the characteristics of the communication code when a failure occurs.

2.2. Classification Algorithm

Various machine learning models have been explored in fault diagnosis to detect the occurrence of faults. There are two broad categories: supervised and unsupervised algorithms. The former is the dominant and more widely used method. The important difference between supervised machine learning and unsupervised machine learning is the existence (or lack thereof) of a training set that has a corresponding target output with multiple given inputs [22].
Supervised learning has been widely used in the field of fault diagnosis. Wang et al. proposed a new hybrid method of random forest classifiers and applied it to the fault diagnosis of rolling bearings. Experiments show that their method has high diagnostic accuracy, but this method can only diagnose a single fault [6]. Li et al. improved the C4.5 decision tree and performed fault classification by extracting fault features in the brake system. In the application scenarios of big data, the classification accuracy of the improved algorithm has been greatly improved [23]. He et al. studied the superconducting fault current limiter and proposed a support vector machine fault diagnosis method, which was applied to a nonlinear regression between AC current and AC voltage [24]. However, this study uses an image-oriented feature extraction method, which is very time-consuming.
Other scholars applied unsupervised learning to the field of fault diagnosis. Yang et al. proposed a fault diagnosis method for the analysis of dissolved gases in power transformers based on association rules and compared it with K-nearest neighbor (KNN), SVM, and other algorithms [25]. Liu et al. used frequent pattern growth (FP-Growth) to propose a method for locating and diagnosing branch line faults in a distribution network with multiple data sources [26]. Bashir et al. proposed a method of using pattern growth to mine fault tolerant frequent patterns. They stored the original data set in a highly concentrated environment, which avoided multiple scans of the data set, and used algorithms such as Apriori for comparison [27]. Shawkat et al. used the FP-Growth algorithm to increase the speed of rule mining for new crown virus diagnosis, but a certain amount of memory overhead was generated during rule generation [28].
Compared with the classification algorithm used in the above study, the combination of fault rules and algorithms is used in this study, which is more accurate than the study using only rules, and it improves the interpretability of supervised algorithms.

2.3. Topic Modeling

The topic model is a statistical model that clusters the hidden semantics in the text through unsupervised learning. It is mainly used by scholars for text mining and text analysis. The latent Dirichlet allocation (LDA) used in this study is one of the typical topic models. It generates each topic by mixing words and each document with mixed topics.
LDA has been used by many scholars for analysis in the field of fault diagnosis. Wei et al. used data mining for vehicle-mounted Chinese Train Control System (CTCS) equipment on the train to establish a fault information database and used an improved label-LDA to extract the semantics in the work log, classifying and comparing classification accuracy through particle swarm optimization (PSO)-SVM, traditional SVM, and KNN [29]. Wang et al. proposed a text mining method based on two-layer feature extraction; that is, the feature weight χ2 was used first, and then the traditional LDA model was used. Finally, it was used in the fault diagnosis of railway maintenance data. However, this method is less effective for the classification of unbalanced data [30]. In the current study, LDA was used to analyze the semantics of daily work reports, so there is no need to consider this issue. Pyo et al. used the topic modeling method based on LDA to propose a unified topic model for grouping similar TV users through TV descriptors and recommending similar TV programs [31]. Based on semi-supervised non-negative matrix factorization (NMF), Choo et al. proposed a topic modeling visual analysis system called UTOPIAN and compared the results with LDA analysis after applying it to different scenarios [32]. Allahyari and Kochut introduced an entity topic modeling method called EntLDA and combined the semantic concepts in DBpedia with unsupervised learning approaches such as LDA [33].
Compared with the above literature, the current research combined domain knowledge and used the LDA model to assist in analyzing the characteristics of the three reentrant failures in daily work reports, focusing on the semantic analysis of the text and the interpretability of the algorithm.
However, the above articles lack an in-depth analysis of the three types of faults during the turn-back faults of urban rail transit, and little attention has been paid to the data combined with the train communication code and the daily work report of testers.

3. Urban Rail Train Turn-Back

3.1. Train Route

In Figure 2, a and b show the head and tail ends of the train, respectively. Turn-back refers to the operation of changing the direction of travel after the train arrives at the terminal of the metro train’s route. After the upward train passes Shuangheqiao Station, it enters the back-turning section behind the station and departs through end b. End change refers to the operation of changing the direction of the current end. The up train enters the Shuangheqiao Car Depot via the entry and exit line of Xianshuigubei Station, uses the bulb-shaped track in the Shuangheqiao Car Depot to change terminals, and continues to depart at end a and drive in the opposite direction.

3.2. Operating System and Communication Modules

Figure 3 shows the main components of the head end and tail end of urban rail transit trains.

3.2.1. Automatic End Change (AEC)

When the automatic train protection (ATP) at the head meets the auto-switch condition, the automatic reverse (AR) light at the head turns on and the man–machine interface (MMI) displays an icon that allows the auto-switch; the driver then presses the turn-back button at the head. The AR light then flashes, the MMI switches to the auto-switch icon, and the parking brake is activated (after pressing the button, the driver can pull out the first key). When the driver at the end presses the button, they also send a “status during reentry” message to the ATP at the end. After the parking brake, the head-end sends the transfer request and positioning information to the tail end, and the AR lamp at the tail end enters an always-on state. After the end acknowledges the request, the end remains the same, and the end registers with the zone controller (ZC) and outputs the activation and AR state of the ZC. After successfully registering with the ZC, the tail sends the activation status to the ZC to activate and the reentry status to the AR. The ZC outputs special control messages or performs mobile authorization. The ZC receives the end of the activation state, which is also successful registration of the end; the end of the first sent activation state becomes a non-activation state. At this point, the tail satisfies the centralized traffic control (CTC) upgrade condition, the tail is upgraded to CTC operational control level, and the AR lights start flashing. After the tail-end driver inserts the key, it outputs the parking brake. The tail-end driver then presses the tail-end to turn the back button. The tail-end changes into the activation mode and sends the command “end turn-back” to the head. After receiving the end of the command to switch to standby (STB) mode, the parking brake eases and the AR lights are turned off; then, the ZC cancellation request begins. After receiving the message, the terminal stops sending the AR state to the ZC, the parking brake begins to ease, and the tail AR lamp is turned off. This concludes the automatic end change process.

3.2.2. Automatic Turn-Back (ATB)

After the automatic train protection (ATP) at the head end satisfies the condition of ATB, the automatic reverse (AR) lamp is always on, and the man–machine interface (MMI) shows the icon of ATB. After the driver at the head end presses the turn-back button, the AR light flashes at the head end, and the MMI icon changes to ATB and begins to output the parking brake. Then, the MMI sends a “turn-back status” message to the tail end. The driver then pulls out the key at the head end, which remains in its current mode, and begins to send a message to the zone controller (ZC), stating that the ATB light is blinking. The driver then presses the ATB button on the platform or the confirmation button on the cab, which sends a message to the ZC stating that the ATB button is always on, and the command “ATB” to the tail end. The tail-end ATP receives the command, disconnects from the ZC and computer interlock (CI), and exits the automatic switchover to ensure the ATB from the head end. At this point, the head end picks up the turn-back relay, gives the automatic train operation (ATO) permission, and relieves the parking brake. The train is automatically driven by ATO. The head end sends the ZC a message stating that the ATB button is off. The train stops on the track, and the head end sends a request to the tail end for switching, in addition to information about the location and the permission of the gate. After receiving the data, the AR light is always on, sucks up the relay in turn-back mode, and outputs the parking brake. The tail end acknowledges the turn-back request to the head end. The tail end initiates the registration with the ZC, sends the activation status to the ZC to be “activated”, and sends the reentry status of AR to the ZC. The ZC then sends a special control message or mobile authorization to the tail end. After receiving the activation status of the tail end, the ZC sends a message to the head end stating that the tail-end registration was successful. After the first end receives the message, it sends the activation state to the ZC requesting to become “deactivated” and sends the “first end deactivated” information to the tail end. After the tail end satisfies the centralized traffic control (CTC) system upgrade condition, the CTC operation control level is upgraded and the AR lights start flashing. The end tail sends the “end retrace” command to the head end, and the head end is initiated with the ZC logout. At the same time, the turn-back mode relay is dropped at the head end, the AR light is turned off, and the means is converted to standby (STB) mode. When the tail end receives the message, it stops sending the AR status to the ZC, which gives the ATO permission and eases the parking brake. Then, the ZC mobile authorizes the relevant section to open, and the train arrives at the platform, stopping in the parking window. After the rear end outputs the parking brake, the driver inserts the rear-end key and presses the turn-back button. The rear AR lamp is turned off, relieving the parking brake and dropping the turn-back mode relay. The process of ATB is complete.

3.2.3. Point Mode End Change (PEC)

After the ATP at the head meets the PEC condition, the AR light at the head is changed to an always-on state, and the MMI shows an icon that can be switched on automatically. The driver at the head end presses the button at the head end to turn back. The driver at the head end sends a “turn-back status” message to the end. Then the AR lights start flashing, and the MMI displays an icon for entering the auto-switch and outputs the parking brake. The head end sends the switch request and the positioning information to the tail end. The AR light at the tail end begins to blink and confirms the switch request to the head end. The driver of the head end pulls out the key and maintains the pattern. The head end issues a “turn-back” command to the tail end, and the head end switches to STB mode to ease the parking brake. The AR lights at the head end are turned off. After receiving the message, the tail end is upgraded to code train operating mode-intermittent mode train control (CM-I) mode. The AR light at the tail end is turned off, the parking brake is relieved, and the switch is completed.

4. Dataset

4.1. Background

The experimental data used in this study were provided by the Tianjin Jinhang Institute of Computing Technology. The work log data of urban rail transit were taken from several different urban rail stations in Jinnan District, Tianjin, China, such as Shuangqiaohe and Beiyangcun Stations. The dates ranged from 1 June 2019 to 30 June 2019, and the data contained approximately 100,000 observations and 57 fields per day on average. The text data used in this study came from the daily work report of the field test of the CBTC signal system. The ratio of the safety, point mode end change (PEC), automatic turn-back (ATB), and automatic end change (AEC) in this data set is approximately 15:1:2:1, which is consistent with the real scenario.

4.2. Tabular Data

The tabular data used in this study were derived from 57 train communication codes of the VOBC signal system. Table 1 shows the form of train turn-back records for each city and the example values of important attributes. The corresponding prompt communication code is in parentheses. In this study, a large amount of communication code data inside the train were used from a microscopic perspective, which reflect the changes in communication information in detail during train operation.

4.3. Tabular Data

The content of the daily work report includes the description of the scene, the preliminary analysis of the fault by the professional maintenance personnel at the location, the subsystems related to the failure, and the detailed information of the professional maintenance personnel analysis. The above data are a quick macro judgment made by security personnel, which can be used to help judge the type of failure from the outside. Table 2 shows the statistics of the number of punctuation marks, the number of characters, the number of words, the word density, and the number of capital letters of the text data. It can be seen that the report is long text with rich semantic information.

5. Framework

5.1. General Framework

Fault diagnosis is related to traffic safety, so two perspectives of the intelligent algorithm and human supervision were combined in the framework in the Figure 4: (1) carrying out detailed and micro-analysis on a large amount of communication code data in the train with rule mining and classification algorithms, and (2) performing a macro-analysis on the text data of the engineer’s diagnosis daily work report by applying topic modeling to obtain the judgement rules that can be used for manual detection.
The framework has four main modules. First, it preprocesses the different communication codes returned in the work log of urban rail trains and then uses rule mining and feature intersection to perform feature engineering. Second, it evaluates the performance of different classification algorithms and analyzes the importance of different features. Third, Chinese text in the daily work report is cleaned by deleting punctuation marks and numbers, changing capitalization, word segmentation, and deleting stop words. Fourth, the topic probability distribution of the text data is calculated, and the characteristics of turn-back with domain knowledge are analyzed. The framework that we used in this study is Spark, and the tool is Spark ML.
The specific data processing, feature extraction, and topic analysis in this framework are described in detail below.

5.2. Diagnostic Type Classification

5.2.1. Rules Generation

The frequent itemset generation (FIG) algorithm was used to mine frequent field combinations in data sets. This study analyzed the frequently excavated fields to obtain the rules of failure occurrence and combined this with prior knowledge in the field of urban rail transit.
Assume that A = a 1 ; a 2 ; ; a m is a collection of items. When the algorithm starts, it first scans all of the item sets in the database and counts them to generate a first-order candidate item set. FIG in turn judges whether they meet the minimum support set artificially. After the second-order candidate item set is generated, the support degree is judged again, and the iterative loop is performed. The number of occurrences of item set I is defined as σ ( X ) = ( b i | X b i , b i B ) , where bi represents one thing and B represents a set of things. The support for generating frequent item sets from X to Y is:
s u p p o r t ( X Y ) = σ ( X Y ) | T |
Finally, all frequent item sets are obtained.
However, because FIG requires constant iterations, its advantages and disadvantages are also obvious. In successive iterations, the FIG algorithm is simple and clear, which is convenient for mining different data sets. Nonetheless, it also has some very obvious shortcomings. In the iterative process, FIG generates a large number of intermediate item sets, which is not time efficient and results in unnecessary comparisons. Spark, which is a big data computing engine, allows users to return independent processes of multiple working nodes to a driver node in a flexible distributed data set, thus significantly saving the time required to run the program [34]. The calculations performed in Spark are executed in the memory, and the intermediate output results are also stored in the memory, which can significantly improve the processing capacity for real-time data. This is highly consistent with the requirements for processing large amounts of real-time data generated by urban rail transit systems. In addition, it can also ensure high fault tolerance and scalability of the cluster. Therefore, using Spark to implement FIG is of great significance to this study.

5.2.2. Feature Cross

The Cartesian product was used in this study to combine individual discrete features.
P × Q = { ( x , y ) | x P y Q }
where P and Q are two features, and x and y are categories that belong to the P and Q features, respectively. Through simple binary crossover, the interaction between discrete features is realized. It can reflect the information interaction between two communication modules in urban rail trains to establish more detailed rules based on the rules mined by frequent item sets.

5.2.3. Classifier

Classification and regression trees (CARTs) can be applied to solve classification and regression problems. In the process of constructing a binary decision tree, a decision tree as large as possible is generated. During the traversal process, each node selects the best attribute to split in order to reduce its impurities [35]. The sample set of the parent node is A, and CART selects feature B for splitting. The corresponding set is D1, D2.
G i n i ( A , B ) = | D 1 | | D | G i n i ( D 1 ) + | D 2 | | D | G i n i ( D 2 )
Finally, the smallest loss function is selected to prune it in order to prevent it from overfitting. The subtree X loss function is:
F α ( X ) = F ( X ) + α | X |
A random forest (RF) is a classifier composed of multiple decision trees. More precisely, a random forest is a strong classifier composed of multiple weak classifiers, and the output category is determined by the mode of the category output by the individual tree [22,36]. Its advantage is that it can handle a large number of input variables and balance errors and, at the same time, produce unbiased estimates for generalized errors internally.
The gradient boosting decision tree (GBDT) is an iterative algorithm composed of multiple decision trees. Its basic idea is that each tree learns the output and residuals (negative gradient) of all previous trees:
F m ( a ) = m = 1 M T ( a ; β m )
where T ( a ; β m ) represents the decision tree, βm is the parameter of the decision tree, and M is the total number of all decision trees. The loss is
L [ b , F m 1 ( a ) + T ( a ; β m ) ] = [ b F m 1 ( a ) T ( a ; β m ) ] 2
AdaBoost trains different weak classifiers and determines the best weak classifier through a threshold. Finally, the weak classifier from each iteration is constructed as a strong classifier. In this algorithm, the training of multiple classifiers gives it the advantages of flexibility and high accuracy. However, it also leads to the disadvantages of longer running time of the algorithm and sensitivity to abnormal samples. Taking binary classification as an example, the weighted error rate of the k-th weak classifier Fi(x) in the calculation is:
e i = P ( F i ( x j ) y j ) = j = 1 n w i j I ( F i ( x j ) y j )
The weight coefficient is:
α i = 1 2 log 1 e i e i
The weight coefficient of the k + 1 weak classifier is:
w i + 1 , j = w i j Z i exp [ α i y j F i ( x j ) ] Z i = j = 1 n w i j exp [ α i y j F i ( x j ) ]
The generated strong classifier is:
g ( x ) = s i g n [ i = 1 I α i F i ( x ) ]
A support vector machine (SVM) is an algorithm for finding the best classification hyperplane [37]. Its basic idea is to construct an objective function based on the principle of structural risk minimization to separate the two modes as much as possible. Its multi-objective function is also regarded as a kernel method. A linear kernel was used in this study:
kernel ( χ , ε ) = χ T ε + c
and radial:
kernel ( χ , ε ) = exp ( β χ ε 2 )
The optimization problem for a soft-margin SVM is expressed as follows:
min α , j 1 2 | | α | | 2 + c i = 1 X F i , F i = max [ 0 , 1 m i ( α T n i + j ) ] s . t . n i ( α T n i + j ) 1 F i
The principle of logistic regression (LR) is very similar to that of SVM. The difference is that SVM does not require any assumptions about data distribution. Logistic regression is a parametric model, which assumes that the data obey a certain distribution, as shown below:
f ( x ) = h ( α T x ) = 1 1 + e α T x
where α is a parameter, and f(x) is the probability of y = 1 when x is a certain value. The loss function is:
g ( α ) = 1 n i = 1 n ( m i log ( f ( x ) ) + ( 1 m i ) log ( 1 f ( x ) )
Naïve Bayes (NB) is the practical application of Bayesian probability theory formulas and characteristic conditions [38]. NB has the characteristics of simplicity and efficiency, and there is no significant difference in classification performance for different data sets. However, at the same time, it has a very strict requirement: the prediction functions must be independent of each other, which is difficult to meet in the real world. Let the sample data set be P = { p 1 , p 2 , , p n } and the feature attribute set be Q = { q 1 , q 2 , , q m } . The class variable is R = { r 1 , r 2 , , r a } . The Bayesian calculation is:
Prob ( r i | q 1 , q 2 , , q m ) = Prob ( r i ) j = 1 m P ( q j | r i ) j = 1 m P ( q j )

5.2.4. Measurement

The F1-score is the harmonic average of recall and accuracy, which is often used in the fields of information retrieval and computer vision [39]. The calculation method of the F1-score is:
F 1 S c o r e = 2 1 p r e c i s i o n + 1 r e c a l l = 2 × p r e c i s i o n × r e c a l l p r e c i s i o n + r e c a l l
The macro F1-score was used in this study; that is, the other three types of faults were combined into one category in this four-category problem. Then, these two types of problems were classified into two categories. Finally, the macro F1-score was obtained by averaging the four F1-scores obtained as a result. This helped us to analyze the F1-score in each type of specific turn-back.
In previous studies, some works of literature used the area under the receiver operating characteristic curve (AUC) indicator. AUC measures the classification ability of the model, so it is highly insensitive to data sets with imbalanced category distribution. However, the macro F1-score is highly sensitive to the category distribution of the data set. Once the data set is imbalanced, it leads to a sharp drop in F1-score.
This study mainly involved the safety management of urban rail transit, so its focus was whether the three kinds of turn-back faults can be identified accurately. In the urban rail transit fault diagnosis scenario, the probability of fault occurrence is small, which leads to an extremely imbalanced distribution of experimental data. In application scenarios involving traffic safety, the focus is on identifying three different types of turn-back failures and accurately distinguishing them. Because AUC and other indicators are not sensitive to data with unbalanced distribution of types, the F1-score was used in this study to analyze the prediction level of models for each category when the category is unbalanced.

5.3. Diagnostic Analysis

5.3.1. Chinese Text Cleaning

The daily work report data set used in this study contains a large number of punctuation marks, Chinese and English characters, and capitalization differences. To prevent word discrepancies, this study first converted the uppercase letters in the daily work report into lowercase letters. The Jieba model was used to segment Chinese text data. For the Chinese punctuation marks and numbers contained in this data set, regex matching was used to locate, count, and then delete them. The three open-source stop word lists of Baidu, Sichuan University, and Harbin Institute of Technology were combined to delete all words that are not related to the failure scenario.

5.3.2. Latent Dirichlet Allocation (LDA)

In this study, latent Dirichlet allocation (LDA) was used to analyze the theme of the daily work report on urban rail transit failures. LDA is a model of document topic generation. Through the assumption of “bag-of-words”, that is, in the same corpus, the order of documents can be interchanged. In the same document, the order of words can be interchanged to simplify the problem. Let the document set be A; each document a in A is a word sequence b 1 , b 2 , , b n , and the topic set is C in the document. First, the number of generated document words n P o s s i o n ( α ) is set, and the topic distribution of document i θ D i r i c h l e t ( β ) is determined. Dirichlet is an extension of the beta distribution in n dimensions, and its probability density function is:
D i r i c h l e t ( θ | β ) = Γ ( p = 1 q β p ) p = 1 q Γ ( β p ) q = 1 Q θ q β q 1
Finally, when generating the field bi in the document, we first choose a topic for it C i ~ M u l t i n o m i a l ( θ ) . The multinomial distribution is a discrete distribution extended by a two-dimensional distribution and a conjugate distribution composed of Dirichlet:
M u l t i n o m i a l ( c | θ , n ) = ( n c 1 , c 2 , , c q ) q = 1 Q δ q m q
and fields with the probability of P ( b n | C n , μ ) are generated.

6. Experiment

6.1. Diagnostic Type Classification

Two main conclusions can be drawn from Figure 5. First, the internal rules of automatic end change (AEC) and automatic turn-back (ATB) are relatively similar. In the real scene, because the train has more data and related rules for automatic turn-back, it is easier to be identified and distinguished by the algorithm. Second, the communication code rules for point mode end change (PEC) and safety are relatively similar, but the safety data are much larger than the data of the other three types of turn-back failures, which makes the safety data easier to distinguish. It is not easy to distinguish the PEC fault data.
As shown in Table 3, the calculated F1-score and average value (macro F1-score) are predicted by the classification algorithm for each category (safety and three types of turn-back failures). The average value causes the displayed score to decrease, but in this business scenario, the performance of the algorithm is better. The F1-score is used with a lower score to show the business difficulties caused by the imbalance of fault categories and overlap of rules more clearly.
Among the eight classification algorithms, the tree-based model and the SVM based on the radial perform better. In business scenarios, tree-based models are more applicable due to their attributes, such as high speed, low cost, and good interpretability.
The predictive performance of the safety category is much better than that of the other categories. This is because, in the experimental design, the category proportion distribution of the data set is maintained to be consistent with the real scene. In reality, the frequency of failures is relatively small, and the algorithm is affected by imbalanced distribution, which makes it difficult to identify the fault. It can also be found that the predictive performance of the Automatic Turn-Back (ATB) failure category is significantly better than that of the other two types of faults, which is in line with the above analysis of the Venn diagram of the fault rule in Figure 5. There are many overlaps in various fault rules composed of a single communication code feature, and it is necessary to construct more synthetic features to more closely reflect the signal interaction between train modules when a fault occurs in order to better distinguish the faults during the three types of reentry.
As shown in Table 4, the F1-score of each category improved after feature interaction. In the urban rail system, the module signals of the train interact with each other, which has a strong correlation with the return. Therefore, the use of feature intersection has practical significance, and the results produced can also be well interpretated.
Among the eight classification algorithms, the gradient boosting decision tree (GBDT) is the best at learning the interactive information of the communication code and has the best prediction performance.
In Figure 6, according to the degree of positive or negative contribution of features to the prediction of each category, it is obvious that the crossed features are relatively important. The foldbackindicator, workmode, and trainspeed features have the best performance. The Venn diagram of the fault rules in Figure 5 shows that the intersection of these three features and other features provides more signal interaction information for the automatic turn-back (ATB) and automatic end change (AEC) fault categories, which is helpful for the classification algorithm to better distinguish two very similar categories, thereby improving the fault accuracy. In future research, if higher accuracy is pursued and certain algorithmic interpretability is not required, more complex rules can be explored based on these important features.

6.2. Diagnostic Analysis

The analysis of the above classifiers is data-oriented and requires a large amount of data. However, through the LDA analysis on the daily report, the maintenance personnel can make rough judgments to better supervise the work of the machine and ensure traffic safety. For the three types of turn-back, LDA analysis produced three tables. According to the previous daily work report, this study extracted ten topics and ten corresponding high-frequency keywords. Domain knowledge in the urban rail field was used to further analyze characteristics of turn-back failures. The LDA mining results of Chinese text are shown in Table A1, Table A2 and Table A3 in the Appendix A.
Table 5 shows the characteristics of automatic end change (AEC) when this type of turn-back fails. It can be observed from topic 0 that the automatic train supervisory (ATS) system prompts the acceptance of the opening direction during the route. The command is interrupted or disappears. It can be seen from topic 1 that the train must meet the safety envelope and completely enter the platform or the track that meets the automatic terminal change before it meets the conditions of AEC. Combining topic 0 and topic 4, it can be observed that when the AEC train is in the incoming section, the head end is prone to failure, which can be regarded as the characteristic of AEC failure.
Table 6 shows the characteristics of automatic turn-back (ATB). According to topic 0, when the ATS of the ATB train drives downward, the process of rail stop is relatively successful. This may indicate that rail stop failure cannot be used as one of the characteristics in determining whether it is an ATB failure. Topic 1 indicates that during the ATB process, the communication process between the original head-end on-board ATP and CI is consistent with the normal communication process. The original tail-end on-board ATP should confirm that the head-end on-board ATP and CI are successfully deregistered or determine whether the head-end on-board ATP has been disconnected from the CI before sending control information to the CI. Prior to this, the heartbeat information should be sent. At the same time, topic 2 and topic 1 consistently contain heartbeat information. Observing topic 8, it appears that the lights are always on when the train is in the station, and the axle counting logic at the head and tail ends fails. This shows that axle counting failure may be a feature of ATB failure.
Table 7 shows the characteristics of point mode end change (PEC). The automatic train operation (ATO) system that appears many times in the table indicates that this is a system where PEC failures often occur in trains. Topic 1 means that the driver presses the down button, the train is inserted into the two down tracks, and the analysis is transferred to the section analysis. Topic 2 indicates that the AR light should be turned on after the on-board ATP judges the automatic terminal swap to be possible. After the AR light is on, the driver presses the “turn-back” button, the AR light at the head end flashes, and the MMI display enters the PEC icon. The head-end ATP starts to send the “returning state” information to the tail end ATP; send the train position, current mode, and other turn-back-related information to the tail end; and output the parking brake at the same time. Topic 4 shows that the train transponder at the National Exhibition Station is faulty, and part of the log is lost, which means that when a train transponder is faulty, the tester can first consider the fault as a PEC type.

7. Conclusions

Focusing on the common faults in urban rail transit systems, we studied the communication code characteristics of three different turn-back failures, established a general framework, and analyzed the topics’ probability distribution in the daily work. The data were provided by a research institute, and the dataset includes the work log of the urban rail train and the daily work report at the location. Our experimental results show that the framework demonstrates good performance in fault classification and topic analysis.
In this study, three types and characteristics of turn-back failures that are of practical significance were studied. Urban rail transit managers can use this framework to better understand the internal and external characteristics of the train when a turn-back failure occurs, thereby speeding up the handling of failures and ensuring the safety of passengers and property.
However, this study has limitations. Research on the maintenance plan for turn-back failures is scarce. Matching different turn-back failures and their maintenance plans will be investigated in the future. In future studies, we will also further exploit the research value of the data set that we established. Natural language processing technology can be applied to analyze and generate maintenance plans for urban rail transit. This framework can also be applied for the research and analysis of other faults of urban rail.

Author Contributions

Writing—original draft and writing—review and editing, S.M.; methodology and software, X.W. (Xin Wang); data curation, X.W. (Xiaochen Wang); funding acquisition, H.L.; conceptualization, R.Z. All authors have read and agreed to the published version of the manuscript.

Funding

This research is partially supported by the 2020 Natural Science Foundation of Beijing and the Fengtai Rail Transit Frontier Research foundation with a joint grant number of L201003.

Institutional Review Board Statement

Not applicable.

Informed Consent Statement

Not applicable.

Data Availability Statement

Data are available from the corresponding author, Runtong Zhang, upon request.

Conflicts of Interest

The authors declare no conflict of interest.

Appendix A

Table A1. Topic analysis of AEC in Chinese.
topic 0:提示开口ATS列车命令中断进路TC接收消失
topic 1:发送数据前方停稳联锁计划点亮包络解后区段ZC
topic 2:ATS列车提示开口接收中断命令TCSR位于
topic 3:ARZC首端流程显示点亮接近注册进路图标
topic 4:ITC头端首端下首停稳级别STB码车控制进路
topic 5:超时打印信息按下RSSP咸水按钮无人断开轨内首端
topic 6:列车控制首端ZC断开报文流程AR成功结束
topic 7:流程AR按钮下首发现ZC本端存活显示MMI
topic 8:首端列车报文成功司机车窗依然ZC流程东沽路
topic 9:向前中断排列恢复轨后MMI日志ITC接收断开
Table A2. Topic analysis of ATB in Chinese.
topic 0:转发下行流程日志轨停超过成功ATS后下场景
topic 1:心跳图标默认值排查北上区段偶发区域延伸按下
topic 2:修改离开干预心跳末端分析场景给出降级符合
topic 3:模式状态首端下行咸北本端激活TC驶入成功
topic 4:首端状态激活模式回复TCCI按钮过程成功
topic 5:首端按钮过程闪烁上行模式判断下首CI流程
topic 6:ATS同步车暂业务到达异常存活符合停准排查
topic 7:首端ARATO本端升级锁闭继电器按下位于前端
topic 8:逻辑路上灯常亮进路此前村站计轴失败头端下首
topic 9:首端按钮CIATO模式命令ATS状态判断时间
Table A3. Topic analysis of PEC in Chinese.
topic 0:列车行进CTC钥匙ATO制动修复北洋采集双桥
topic 1:点式按下分析两个按压轨未下行插入转为区间
topic 2:列车两个CTC重置信息停准驻车场景日志控制
topic 3:按压信息位置停准稳后闪烁发送状态停车点亮
topic 4:条件自动应答器故障判断日志端的紧急丢失国展
topic 5:尾端首端发送故障CM缓解钥匙熄灭处于状态
topic 6:信息首端尾端发送判断停准状态自动列车处于
topic 7:控制下未判断观察站台熄灭获取钥匙信息丢失
topic 8:稳后日志轨未区间停车接收观察获取转为紧急
topic 9:定位拔出停准条件按下点式应答器降级输入国展

References

  1. He, Z.; Lv, S.; Xu, S.; Hu, S.; Cao, W.; Zhou, Y.; Song, J.; Xu, Z.; Chai, J.; Liang, M.; et al. Standard for Classification of Urban Public Transportation; China Architecture & Building Press: Beijing, China, 2007; ISBN CJJ/T 114-2007. [Google Scholar]
  2. Li, C. Automatic Turn-Back Scheme for Shenyang Metro Line No.1. Railw. Signal. Commun. Eng. 2009, 6, 40–41. [Google Scholar]
  3. Zheng, R.; Li, P.; Li, S. Driverless Train Reversal Operation Failure on Guangzhou Metro Line 4 and Solutions. Urban Mass Transit 2017, 20, 69–73. [Google Scholar]
  4. Wang, D.; Liu, Q. Study on Application of Automatic Turn-Back Technology in Intercity Railways. Railw. Commun. Signal Eng. Technol. 2018, 15, 47–52. [Google Scholar] [CrossRef]
  5. Orosz, T.; Rassõlkin, A.; Kallaste, A.; Arsénio, P.; Pánek, D.; Kaska, J.; Karban, P. Robust Design Optimization and Emerging Technologies for Electrical Machines: Challenges and Open Problems. Appl. Sci. 2020, 10, 6653. [Google Scholar] [CrossRef]
  6. Wang, Z.; Zhang, Q.; Xiong, J.; Xiao, M.; Sun, G.; He, J. Fault Diagnosis of a Rolling Bearing Using Wavelet Packet Denoising and Random Forests. IEEE Sens. J. 2017, 17, 5581–5588. [Google Scholar] [CrossRef]
  7. Zhang, M.; Liu, Z.; Dang, X. Fault Diagnosis on Train Brake System Based on Multi-dimensional Feature Fusion and GBDT Enhanced Classification. In Proceedings of the 2018 International Conference on Intelligent Rail Transportation (ICIRT), Singapore, 12–14 December 2018; pp. 1–5. [Google Scholar]
  8. Fu, Q.; Jing, B.; He, P.; Si, S.; Wang, Y. Fault Feature Selection and Diagnosis of Rolling Bearings Based on EEMD and Optimized Elman_AdaBoost Algorithm. IEEE Sens. J. 2018, 18, 5024–5034. [Google Scholar] [CrossRef]
  9. Seera, M.; Lim, C.P.; Ishak, D.; Singh, H. Fault Detection and Diagnosis of Induction Motors Using Motor Current Signature Analysis and a Hybrid FMM–CART Model. IEEE Trans. Neural Netw. Learn. Syst. 2011, 23, 97–108. [Google Scholar] [CrossRef]
  10. Xu, L.; Chow, M.-Y. A Classification Approach for Power Distribution Systems Fault Cause Identification. IEEE Trans. Power Syst. 2006, 21, 53–60. [Google Scholar] [CrossRef] [Green Version]
  11. ElMoaqet, H.; Kim, J.; Tilbury, D.; Ramachandran, S.K.; Ryalat, M.; Chu, C.-H. Gaussian Mixture Models for Detecting Sleep Apnea Events Using Single Oronasal Airflow Record. Appl. Sci. 2020, 10, 7889. [Google Scholar] [CrossRef]
  12. Kim, K.B.; Yi, G.Y.; Kim, G.H.; Song, D.H.; Jeon, H.K. Intelligent Computer-Aided Diagnostic System for Magnifying Endoscopy Images of Superficial Esophageal Squamous Cell Carcinoma. Appl. Sci. 2020, 10, 2771. [Google Scholar] [CrossRef] [Green Version]
  13. Huang, C.; Huang, Y. Research and design of data communication subsystem of urban rail transit CBTC system. Int. J. Syst. Assur. Eng. Manag. 2021, 1–11. [Google Scholar] [CrossRef]
  14. Xiao, H.; Zheng, W. Research on the assessment method CBTC quality of service in urban rail transit. In Proceedings of the 2017 Chinese Automation Congress (CAC), Jinan, China, 20–22 October 2017; pp. 4008–4014. [Google Scholar] [CrossRef]
  15. Srisooksai, T.; Nishida, S.; Nambu, S. A Deep Learning Approach for Wireless Spectrum Sensing in Communications-based Train Control: An Over-fitting Problem and Solution. In Proceedings of the 2020 IEEE 92nd Vehicular Technology Conference (VTC2020-Fall), Victoria, BC, Canada, 18 November–16 December 2020; Institute of Electrical and Electronics Engineers (IEEE): Victoria, BC, Canada, 2020; pp. 1–5. [Google Scholar]
  16. Castiglione, L.M.; Lupu, E.C. Hazard Driven Threat Modelling for Cyber Physical Systems. In Proceedings of the 2020 Joint Workshop on CPS&IoT Security and Privacy, New York, NY, USA, 9–13 November 2020; ACM: New York, NY, USA, 9 November 2020; pp. 13–24. [Google Scholar]
  17. Singh, B. Performance Analysis of DCF—Two Way Handshake vs. RTS/CTS during Train-Trackside Communication in CBTC based on WLAN802.11b. Recent Adv. Comput. Sci. Commun. 2020, 13, 345–352. [Google Scholar] [CrossRef]
  18. Gu, Y.; Zeng, X.; Shen, T.; Wang, W. VOBC Data Storage and Online Diagnosing System Based on Data Cloud. In Proceedings of the 2015 IEEE Twelfth International Symposium on Autonomous Decentralized Systems, Taichung, Taiwan, 25–27 March 2015; pp. 5–8. [Google Scholar]
  19. Wang, Y.; Chen, L.; Kirkwood, D.; Fu, P.; Lv, J.; Roberts, C. Hybrid Online Model-Based Testing for Communication-Based Train Control Systems. IEEE Intell. Transp. Syst. Mag. 2018, 10, 35–47. [Google Scholar] [CrossRef]
  20. Li, W.; Sui, L.; Zhou, M.; Dong, H. Short-term passenger flow forecast for urban rail transit based on multi-source data. EURASIP J. Wirel. Commun. Netw. 2021, 2021, 1–13. [Google Scholar] [CrossRef]
  21. Su, X.; Li, Y. Research on Passenger Flow Control Model of Urban Rail Transit Network. J. Phys. Conf. Ser. 2020, 1601. [Google Scholar] [CrossRef]
  22. Zhang, D.; Zhou, L.; Kehoe, J.L.; Kilic, I.Y. What Online Reviewer Behaviors Really Matter? Effects of Verbal and Nonverbal Behaviors on Detection of Fake Online Reviews. J. Manag. Inf. Syst. 2016, 33, 456–481. [Google Scholar] [CrossRef]
  23. Li, J.; Jiang, S.; Li, M.; Xie, J. A Fault Diagnosis Method of Mine Hoist Disc Brake System Based on Machine Learning. Appl. Sci. 2020, 10, 1768. [Google Scholar] [CrossRef] [Green Version]
  24. He, Y.; Du, C.Y.; Li, C.B.; Wu, A.G.; Xin, Y. Sensor Fault Diagnosis of Superconducting Fault Current Limiter with Saturated Iron Core Based on SVM. IEEE Trans. Appl. Supercond. 2014, 24, 1–5. [Google Scholar] [CrossRef]
  25. Yang, Z.; Tang, W.H.; Shintemirov, A.; Wu, Q.H. Association Rule Mining-Based Dissolved Gas Analysis for Fault Diagnosis of Power Transformers. IEEE Trans. Syst. Man Cybern. Part C 2009, 39, 597–610. [Google Scholar] [CrossRef]
  26. Liu, S.; Su, Y.; Zhang, Y. Open-Line Fault Diagnosis and Positioning Method for 10 kV Power Distribution Network Branch Line Based on FP-Growth Algorithm. Dianwang Jishu/Power Syst. Technol. 2019, 43, 4575–4581. [Google Scholar] [CrossRef]
  27. Bashir, S.; Halim, Z.; Baig, A.R. Mining fault tolerant frequent patterns using pattern growth approach. In Proceedings of the 2008 IEEE/ACS International Conference on Computer Systems and Applications, Doha, Qatar, 31 March–4 April 2008; pp. 172–179. [Google Scholar]
  28. Shawkat, M.; Badawi, M.; Eldesouky, A.I. A Novel Approach of Frequent Itemsets Mining for Coronavirus Disease (COVID-19). Eur. J. Electr. Eng. Comput. Sci. 2021, 5, 5–12. [Google Scholar] [CrossRef]
  29. Wei, S.; Yuan, Y.; Wang, J.; Hu, F. Research of Fault Feature Extraction and Diagnosis Method for CTCS On-Board Equipment (OBE) Based on Labeled-LDA. Tiedao Xuebao/J. China Railw. Soc. 2019, 41, 56–66. [Google Scholar] [CrossRef]
  30. Wang, F.; Xu, T.; Tang, T.; Zhou, M.; Wang, H. Bilevel Feature Extraction-Based Text Mining for Fault Diagnosis of Railway Systems. IEEE Trans. Intell. Transp. Syst. 2016, 18, 49–58. [Google Scholar] [CrossRef]
  31. Pyo, S.; Kim, E.; Kim, M. LDA-Based Unified Topic Modeling for Similar TV User Grouping and TV Program Recommendation. IEEE Trans. Cybern. 2014, 45, 1476–1490. [Google Scholar] [CrossRef] [PubMed]
  32. Choo, J.; Lee, C.; Reddy, C.K.; Park, H. UTOPIAN: User-Driven Topic Modeling Based on Interactive Nonnegative Matrix Factorization. IEEE Trans. Vis. Comput. Graph. 2013, 19, 1992–2001. [Google Scholar] [CrossRef] [PubMed] [Green Version]
  33. Allahyari, M.; Kochut, K. Discovering Coherent Topics with Entity Topic Models. In Proceedings of the 2016 IEEE/WIC/ACM International Conference on Web Intelligence (WI), Omaha, NE, USA, 13–16 October 2016; pp. 26–33. [Google Scholar]
  34. Elkano, M.; Sanz, J.A.; Barrenechea, E.; Bustince, H.; Galar, M. CFM-BD: A Distributed Rule Induction Algorithm for Building Compact Fuzzy Models in Big Data Classification Problems. IEEE Trans. Fuzzy Syst. 2020, 28, 163–177. [Google Scholar] [CrossRef] [Green Version]
  35. Gey, S.; Nedelec, E. Model Selection for CART Regression Trees. IEEE Trans. Inf. Theory 2005, 51, 658–670. [Google Scholar] [CrossRef] [Green Version]
  36. Lv, H.; Feng, Q. A Review of Random Forests Algorithm. J. Hebei Acad. Sci. 2019, 36, 37–41. [Google Scholar] [CrossRef]
  37. Tan, Y.; Wang, J. A support vector machine with a hybrid kernel and minimal vapnik-chervonenkis dimension. IEEE Trans. Knowl. Data Eng. 2004, 16, 385–395. [Google Scholar] [CrossRef]
  38. Zhang, H.; Wen, B.; Liu, J.; Zeng, Y. The Prediction and Error Correction of Physiological Sign During Exercise Using Bayesian Combined Predictor and Naive Bayesian Classifier. IEEE Syst. J. 2019, 13, 4410–4420. [Google Scholar] [CrossRef]
  39. Sepúlveda, J.; Velastin, S. F1 Score Assesment of Gaussian Mixture Background Subtraction Algorithms Using the MuHAVi Dataset. In Proceedings of the 6th International Conference on Imaging for Crime Prevention and Detection (ICDP-15), London, UK, 15–17 July 2015; pp. 1–6. [Google Scholar]
Figure 1. The number of routes and cities, and total distance, in China.
Applsci 11 03347 g001
Figure 2. Train route.
Applsci 11 03347 g002
Figure 3. Schematic diagram of urban rail train interior.
Applsci 11 03347 g003
Figure 4. General framework.
Applsci 11 03347 g004
Figure 5. Venn diagram of generated rules per class.
Applsci 11 03347 g005
Figure 6. Feature importance score per class.
Applsci 11 03347 g006
Table 1. Module field and meaning of communication code.
Module FieldMeaning of Communication Code
ATOPermitPermit (55)/Not permit(AA)
ATOstartbuttonLow Level(55)/High Level(AA)
CommonEmergencyBrakingLow Level(55)/High Level(AA)
CommonbrakeNot Output(55)/Output(AA)
ConfirmbuttonLow Level(55)/High Level(AA)
CurrentCommunicationModeCTC(01)/ITC(02)
CutoffswitchLow Level(55)/High Level(AA)
DoorbypassbuttonLow Level(55)/High Level(AA)
EmergencyBrakingLow Level(55)/High Level(AA)
EmergencybrakeLow Level(55)/High Level(AA)
FoldbackSignNot Output(55)/Output(AA)
FoldbackStatusAutomated(55)/Manual(AA)/No(CC)
FoldbackbuttonLow Level(55)/High Level(AA)
FoldbackindicatorNot Turnback(01)/Enter AEC(02)/Enter ATB(03)
FoldbackmodeNot Output(55)/Output(AA)
OutSpeedWarningInfoNo Warning(00)/Outspeed Warning(01)
RMConfirmDon’t Prompt(00)/Prompt(01)
TrainSpeedConfidence speed processed by idling slip and filtering
TrainStopStateStop Accurate(55)/Not Accurate(AA)
TrainintegrityIntegrity(01)/Not Integrity(02)
Table 2. Descriptive statistics of text data.
PunctuationCharWord Word DensityUppercase Word
Std29.84300.68142.650.0617.44
Min15191961.977
25%41.75351.75164.252.0617.75
50%656282962.0931.50
75%90800.753882.1346.25
Max10210675182.2058
Table 3. F1-score before feature interaction.
RFGBDTAdaBoostCARTLRSVM (Linear)SVM (Radial)NB
Safe0.9504 0.9499 0.8873 0.9504 0.9381 0.9331 0.9496 0.8797
PEC0.6237 0.6210 0.4987 0.6239 0.5723 0.5388 0.6159 0.5045
ATB0.7756 0.7736 0.7545 0.7757 0.7466 0.7409 0.7702 0.6307
AEC0.6268 0.6216 0.6021 0.6268 0.5354 0.5548 0.6107 0.3479
Average0.7441 0.7415 0.6856 0.7442 0.6981 0.6919 0.7366 0.5907
Table 4. F1-score after feature interaction.
RFGBDTAdaBoostCARTLRSVM (Linear)SVM (Radial)NB
Safe0.9509 0.9475 0.9315 0.9509 0.9386 0.9337 0.9500 0.9163
PEC0.6672 0.6927 0.6581 0.6672 0.6523 0.6491 0.6580 0.6228
ATB0.7847 0.7822 0.7639 0.7847 0.7554 0.7543 0.7845 0.6441
AEC0.6442 0.6406 0.5532 0.6442 0.5478 0.5366 0.6233 0.3497
Average0.7618 0.7657 0.7267 0.7618 0.7235 0.7184 0.7539 0.6332
Table 5. Topic analysis of automatic end change (AEC).
topic 0:hintopeningATStraincommandinterruptrouteTCacceptvanish
topic 1:TXDfrontstableinterlockplanlightenenvelopebackupzoneZC
topic 2:ATStrainhintopeningacceptinterruptcommandTCSRlocate
topic 3:ARZCheadflowdisplaylightenapproachregisteraccessicon
topic 4:ITCheadheadright seatstablerankSTBunplannedcontrolaccess
topic 5:overtimetype infopressRSSPXianshuibuttonunmannedbreakin-vehiclehead
topic 6:traincontrolheadZCbreakmessageflowARsucceed over
topic 7:flowARbuttonright seatdiscoverZCterminalsurvivedisplayMMI
topic 8:headtrainmessagesucceeddriverwindowstillZCflowDonggu
topic 9:upwardinterruptarrangerecoverout-railMMIlogITCacceptbreak
Table 6. Topic analysis of automatic turn-back (ATB).
topic 0:transmitdownwardflowlograil stopOvertimesucceedATSafterscenario
topic 1:heartbeaticondefault valuecheckgo northZoneaccidentalareacontinuepress
topic 2:modifiedleaveinterruptheartbeatendAnalysisscenarioprovidedemotionfit
topic 3:modestateheaddownwardXianbeiTerminalactivateTCmovesucceed
topic 4:headstateactivatemodereplyTCCIbuttonprocesssucceed
topic 5:headbuttonprocesstwinkleupwardModeestimateright seatCIflow
topic 6:ATSsynchangingbusinessarriveAnomalysurvivalfitaccuratecheck
topic 7:headARATOterminalupgradeBelockrelaypresslocatehead
topic 8:logictrafficlightaccessbeforevillageaxlefailheadright seat
topic 9:headbuttonCIATOmodecommandATSstateestimatetime
Table 7. Topic analysis of Point mode end change (PEC).
topic 0:trainforwardCTCkeyATOBrakingrepairBeiyanggatherBridge
topic 1:PECpressanalysisdoublePressin-vehicledowninserttransfersection
topic 2:traindoubleCTCresetMessageaccuracyparkingscenariologcontrol
topic 3:pressmessagelocationaccuracyAStwinklesendstateparkLighten
topic 4:conditionautoXPDRfaultEstimatelogendurgencylostGuozhan
topic 5:tail endheadsentfaultCMremissionkeyquenchkeepstate
topic 6:messageheadtail endsendEstimateaccuracystateautotrainkeep
topic 7:controlendestimateobservePlatformquenchacquirekeymessagelost
topic 8:ASlograil endsectionParkacceptobserveacquiretransferurgency
topic 9:locatepull outaccuracyconditionPressPECXPDRdemotioninputGuozhan
Publisher’s Note: MDPI stays neutral with regard to jurisdictional claims in published maps and institutional affiliations.

