Article

Estimation of Mode I Fracture of U-Notched Polycarbonate Specimens Using the Equivalent Material Concept and Strain Energy Density

by
Jafar Albinmousa
1,*,
Jihad AlSadah
2,
Muhammad A. Hawwa
1 and
Hussain M. Al-Qahtani
1
1
Mechanical Engineering Department, King Fahd University of Petroleum & Minerals, Dhahran 31261, Saudi Arabia
2
Physics Department, King Fahd University of Petroleum & Minerals, Dhahran 31261, Saudi Arabia
*
Author to whom correspondence should be addressed.
Appl. Sci. 2021, 11(8), 3370; https://doi.org/10.3390/app11083370
Submission received: 20 February 2021 / Revised: 27 March 2021 / Accepted: 29 March 2021 / Published: 9 April 2021
(This article belongs to the Section Mechanical Engineering)

Abstract

:
Polycarbonate (PC) has a wide range of applications in the electronic, transportation, and biomedical industries. In addition, investigation on the applicability to use PC in superstrate photovoltaic modules is ongoing research. In this paper, PC is envisioned to be used as a material for structural components in renewable energy systems. Usually, structural components have geometrical irregularities, i.e., notches, and are subjected to severe mechanical loading. Therefore, the structural integrity of these components shall consider fracture analysis on notched specimens. In this paper, rectangular PC specimens were machined with straight U-notches having different radii and depths. Eight different notch radii with a depth of 6.0 mm were tested. In addition, three notch depths with a radius of 3.5 mm were considered. Quasi-static fracture tests were performed under displacement-controlled loading with a speed of 5 mm/min. Digital image correlation technique was used to capture the strain fields for un-notched and notched specimens. It was assumed that fracture occurs at the onset of necking. The equivalent material concept (EMC) along with the strain energy density criterion (SED) were employed to estimate the fracture load. The EMC-SED combination is shown to be an effective and practical tool for estimating the fracture load of U-notched PC specimens.

1. Introduction

Polycarbonate is a thermoplastic polymer with an amorphous structure that has applications as a material for load-bearing components in the construction, automotive and aerospace, electronics and telecommunication, and medical fields [1,2]. Polycarbonate (PC) is known for its high transparency and ductility and superior impact resistance. As a result, PC is usually used in applications that require impact protection [3]. In addition to their low density, polycarbonate have essential qualities to be a sustainable material with insignificant effects on the environment. Therefore, researchers have been investigating their mechanical properties, including stiffness, yielding stress, post-yielding behavior and final failure. Due to its photoelasticity, PC is used to study the fracture behavior due to presence of straight and inclined cracks [4,5]. Moreover, dynamic tension behavior is considered vital for evaluating the mechanical quality of polycarbonate, including its failure and fracture behaviors due to impact loading. Thus, high strain rate tensile behavior is at the core of polycarbonate characterization [6] that is usually conducted using the split Hopkinson pressure bar (SHPB) experiment [7]. Sarva and Boyce [8] investigated the characteristics of polycarbonate tensile deformation under large inhomogeneous elongation. Their experimental analysis showed that depending on the geometry and the strain rate, polycarbonate exhibits different necking modes such as single central and double. Sundaram and Tippur [9] performed experimental and numerical analyses to study the mixed-mode dynamic behavior of edge-crack specimens machined from polymethymethacrylate (PMMA) and polycarbonate. Their results showed that polycarbonate samples exhibit ductile fracture features such as visible whitening along the edges of the crack path that were not observed in the PMMA samples. Fu et al. [10] have experimentally proven that polycarbonate yield stress increased with the increase of strain rate. Cao et al. [11] have conducted experiments to investigate the polycarbonate tensile stress–strain relationship under different strain rate conditions, and proposed a viscoelastic constitutive model to describe the tensile behavior of the material. Dwivedi et al. [12] conducted experiments on polycarbonate to determine parameters for the Johnson–Cook and the Zerilli–Armstrong polymer strength models. Safari et al. [13] proposed a constitutive model to predict the stress–strain behavior of polycarbonate at very high strain rates reaching to 10,020 s−1. They showed that there is a competition between thermal softening and strain hardening for strain rate above 8200 s−1. Foster et al. [14] have performed tensile test experiments using specimens with a special conical-type gripping geometry for mitigating wave reflections due to inducing high strain rates. Al-Juaid and Othman [15] have evaluated the adequacy of four constitutive models in predicting the yield stress of polycarbonate under tensile and compressive strain rates. Xu et al. [6] have experimentally investigated the influence of strain rate on the polycarbonate tensile stress–strain relationship, covering the stages of nonlinear deformation yield, strain softening and strain hardening. Wang et al. [16] have proposed an adiabatic model for predicting the mechanical behavior of polycarbonate during impact tests as well as compression tests. Calderón [17] have performed uniaxial monotonic and creep-recovery tensile and compressive tests on polycarbonate, and revealed an instantaneous hypoelastic-like behavior at high strain rates. Zhang and Xu [18] have provided an extension of the polycarbonate uniaxial stress–strain relationship to a three-dimensional constitutive law. They have also presented a polycarbonate constitutive model embracing a stress–strain/force–deformation relationship. Gearing and Anand [19] developed a constitutive model and fracture criteria that can be implemented in finite element software. They used this model to accurately simulate the fracture of blunted and sharp PC specimen subjected to four-point bending loading.
The demand for reliable and economical solar energy solutions is thriving. Solar power is harvested in three forms: (i) electrical power using photovoltaic (PV) modules, which convert solar irradiation directly into electricity, (ii) thermal power flat absorption, and (iii) concentrated thermal power using reflection by using mirrors that concentrate solar power locally (linear absorber in parabolic trough, or a point absorber in parabolic dish) or remotely at a central tower. The solar–thermal system is typically used for electricity generation using pressurized steam. In all of these methods, steering PV cells, and solar reflecting elements increases the solar power generation. Steering is necessary for solar towers and parabolic dishes. For heliostats in solar towers, dual axis orientation control is employed for steering. Thus, a certain amount of energy is consumed on this controlled movement. Employment of lightweight materials such as polycarbonate in the manufacturing and packaging of the steered elements shall require small driving forces, which reduce the power needed for steering. Concentrated solar thermal or photovoltaics require curved surfaces: parabolic troughs or parabolic dishes. Typical silvered glass mirrors have excellent reflectivity and longevity. However, curving glass surfaces is much more difficult compared to curving metallic or plastic surfaces. Thermoforming of plastic materials like polycarbonate is a mature technology [20]. Moreover, plastics are lightweight materials, which is advantageous for transportation and installation. Unlike glass, plastics are generally more resistant to damage [21]. However, polycarbonate is not a reflective material. Therefore, reflection can be achieved by adding a reflective thin layer. Plastic surfaces must be treated for proper adhesion of the reflective film. Alder et al., have developed and tested sputtering method to apply reflective aluminum film to a polycarbonate film followed with a protective resin layer [22].
Still, the presence of notches in structural components is inevitable. For example, cuts and/or holes might be required for the solar surfaces to be fixed to the steering support. Therefore, having an effective engineering design tool capable of estimating the fracture load of notched polycarbonate members is necessary for ensuring the structural integrity of these members. As mentioned earlier, continuum-mechanics based constitutive models describing the mechanical behaviors of PC were developed [8,11,12,13,16,18,19]. However, such models require extensive computational effort. Engineering design models such as the strain energy density (SED) [23] and the theory of critical distance (TCD) [24] have been successfully used to analyze the failure of notched members with different notch geometries and materials, and under both static and cyclic loading [25,26,27,28,29]. A key advantage of these models is that they do not require elastic-plastic or complex computational analyses and yet provide accurate predictions.
In 2012, Torabi [30] proposed the so-called equivalent material concept (EMC) to equate an actual ductile material with a virtual brittle-type material. In principle, the total strain energy density represented by the area under the true stress–strain curve is equated to that of the virtual brittle material. Based on the EMC, the modulus of elasticity, the Poisson’s ratio and the fracture toughness of the virtual material are assumed to be the same as for ductile material. Essentially, the EMC is used to determine the fracture stress of the virtual material. The transformation of a ductile material into a virtual brittle material is key-feature of the EMC because it allows using linear-elastic mechanics for ductile materials. However, the EMC must be incorporated with a notch failure criterion to predict the load carrying capacity for an arbitrary notched component. Torabi [30] used the EMC with the mean stress (MS) criterion and the theory of critical distance (TCD) [24] to estimate the fracture load for V-notched specimen subjected to three-point bending and double V-notched specimens subjected to uniaxial tensile loading. Both specimens were machined from cold-rolled low-carbon steel. The results obtained by the EMC-MS and EMC-TCD are in excellent agreement with the experimental results. Later, Torabi [31] and Torabi et al. [32] showed that the equivalent material concept can be used to predict failure of U-notched metallic specimens exhibiting moderate and large scale yielding. In addition, the EMC was successfully used with the strain energy density criterion proposed by Lazzarin and Zambardi [23] to analyzed mode I fracture of 7075-T6 and 6061-T6 aluminum alloys.
Investigations of tensile fracture of polymeric notched specimens were performed for mode I and mixed mode I/II loading. Gomez et al. [33] proposed a procedure to evaluate the critical load of U-notched PMMA specimens based on cohesive zone-crack concept. The results obtained by Gomez et al., were in excellent agreement with the experimental results. However, PMMA is known to exhibit brittle fracture at room temperature. Tensile fracture analysis of U-notched specimens machined from Araldite LY 5052 epoxy resin was performed by Torabi et al. [34]. The elongation at the ultimate strength of this material is 12.2%. To use the EMC, the authors modified the original formulation of the total strain energy density [34] to capture the plastic behavior of Araldite. The exponential relation between the stress and plastic strain proposed by Bahadur [35] instead of the power-type relation is usually suitable for metallic materials. The authors combined the EMC with both the mean stress (MS) and the maximum tangential stress (MTS) [36] criteria to estimate the fracture load with discrepancies range of 2.7% to 8.1% between theoretical and experimental results. Later, Rahimi et al. [37] investigated the mixed mode I/II fracture of the same material examined by Torabi et al. [34]. Again, using the EMC with both the MS and the MTS criteria the authors were able to achieve an estimate of the fracture loads for U-notches with different inclination angle and radii within 2.7% to 7.5% of that obtained from the experiment. Khosravani and Zolfagharian [38] performed experiments on additively manufactured straight and angled central U-notched specimens using PC and Nylon filaments. The authors successfully used the EMC and the J-integral criterion to estimate the load-carrying capacity of specimens.
Proposing structural elements and protective layers to be made of polycarbonate calls for investigating their fracture performance, since these structural components will be subjected to repeated actuating forces of the solar panel steering servos and could be exposed steady and gusting wind loads. Establishing solar farms in remote desert areas could make the solar surfaces laid open to blowing dust particles. In this paper, we apply the equivalent material concept (EMC) in conjunction with the strain energy density (SED) to evaluate the Mode I fracture load for U-notched polycarbonate representative samples. Thus, polycarbonate sheets are machined into rectangular samples with different U notches with different depths and radii. The samples are then loaded with tension until complete fracture. While performing the tensile tests, the samples are analyzed using digital image correlation system to capture the strain field around the notches. A parallel numerical investigation is performed using a finite element code written in ANSYS Parametric Design Language (APDL) to evaluate the strain energy density of the samples. In general, the obtained results from the EMC-SED method compared well with that from the experiments. Hence, this investigation shall provide engineering design tools for analyzing polycarbonate sheet with geometric discontinuities necessary for clamping purposes in the solar panels.

2. Materials and Methods

2.1. Specimens

A 6 mm thick polycarbonate sheet with 2050 mm width and 3000 mm length was acquired from Rowad National Plastic company in Saudi Arabia. Specimens were cut into rectangular plates that were machined as standard tensile and U-notched specimens. Following the ASTM D36-13 [39] the tensile test specimens were machined with a gauge length and width of 57 mm 19 mm, respectively. Detailed engineering drawing of the specimen is shown in Figure 1. On the other hand, U-notched specimens were machined as rectangular plates with a width and a length of 26 mm and 210 mm, respectively. Straight U notches were machined at one edge with a depth d p and a radius ρ as shown in Figure 2.

2.2. Tests

All tests were performed at standard laboratory conditions. Instron 5569 computer-controlled machine with a static load capacity of 50 kN was used to test the tensile and notched specimens. All tests were performed with crosshead displacement speed of 5 mm/min. Five tensile specimens were tested. Two devices were used to measure the local strain at the gauge section: an extensometer and a digital image correlation system (DIC). To examine the effects of notch radius, ρ , and the notch depth, d p , on the fracture behavior of PC, the matrix listed in Table 1 was considered. All specimens were loaded until complete fracture.

2.3. Theoretical Methods

2.3.1. Equivalent Material Concept (EMC)

The equivalent material concept developed by Torabi [30] (EMC) is based on the principle of equating a ductile material with a virtual brittle material using the strain energy density. Because the equivalent material is assumed to exhibit elastic-type behavior, linear elastic analysis can be performed to estimate the fracture load of notched specimens. In the original formulation of the equivalent material concept, Torabi [30] assumed that the ductile material exhibits power-type hardening. Hence, the total strain energy density,   S E D t o t is
S E D t o t = σ y 2 2 E + K n + 1 ( ( σ u K ) ( n + 1 ) / n ( 0.002 ) n + 1 )
where E is the modulus of elasticity, σ y and σ u are the yield and ultimate strengths, respectively, and K and n are the monotonic strain hardening coefficient and exponent, respectively. The equivalent material concept states that the equivalent brittle material shall have the same values of elastic modulus, E , and plain-strain fracture toughness K I C as for the ductile material. However, the fracture strain ε f * and strength σ f * of the brittle material are unknown. Because the behavior of the equivalent material is assumed to be linear elastic, its strain energy density, S E D * at the fracture can be calculated as [30]
S E D * = σ f * 2 2 E
Using the strain energy density as a fracture criterion, the S E D t o t values for the ductile and the brittle materials, S E D * shall be equal. Hence, combining Equations (1) and (2) gives [30]
σ f * = σ y 2 + 2 E K n + 1 ( ( σ u K ) ( n + 1 ) / n ( 0.002 ) n + 1 )
Basically, Equation (3) can be used to map the fracture strain energy density of the ductile material into a brittle-type material. The value of fracture stress σ f * can then be used in any elastic-based notch fracture criterion to estimate the fracture load for notched specimens.

2.3.2. Strain Energy Density Criterion (SED)

The strain energy density criterion developed by Lazzarin and Zambardi [23] states that fracture in a notched specimens occurs when the strain energy density in a control volume, W ¯ , is equal to a critical strain energy density, W c . The control volume is determined by a circle with a radius R c + r 0 where R c is called the critical radius that can be calculated for plain strain condition from [40]
R c = ( 1 + v ) ( 5 8 v ) 4 π ( K I c σ u ) 2
where v is the Poisson’s ratio and K I c is the plain strain fracture toughness. On the other hand, r 0 is a geometrical parameter that depends on the notch opening angle, 2 α , and the notch radius ρ such that [41]
r 0 = q 1 q ρ
where
q = 2 π 2 α π
As illustrated in Figure 3, the control volume represents a crescent shape. Based on the strain energy density criterion, the critical radius R c is considered as a material property. The critical strain energy density W c is usually determined from standard monotonic tensile tests on smooth specimens by replacing the stress in Equation (2) with the ultimate tensile strength of the material.

2.4. Modeling Polycarbonate

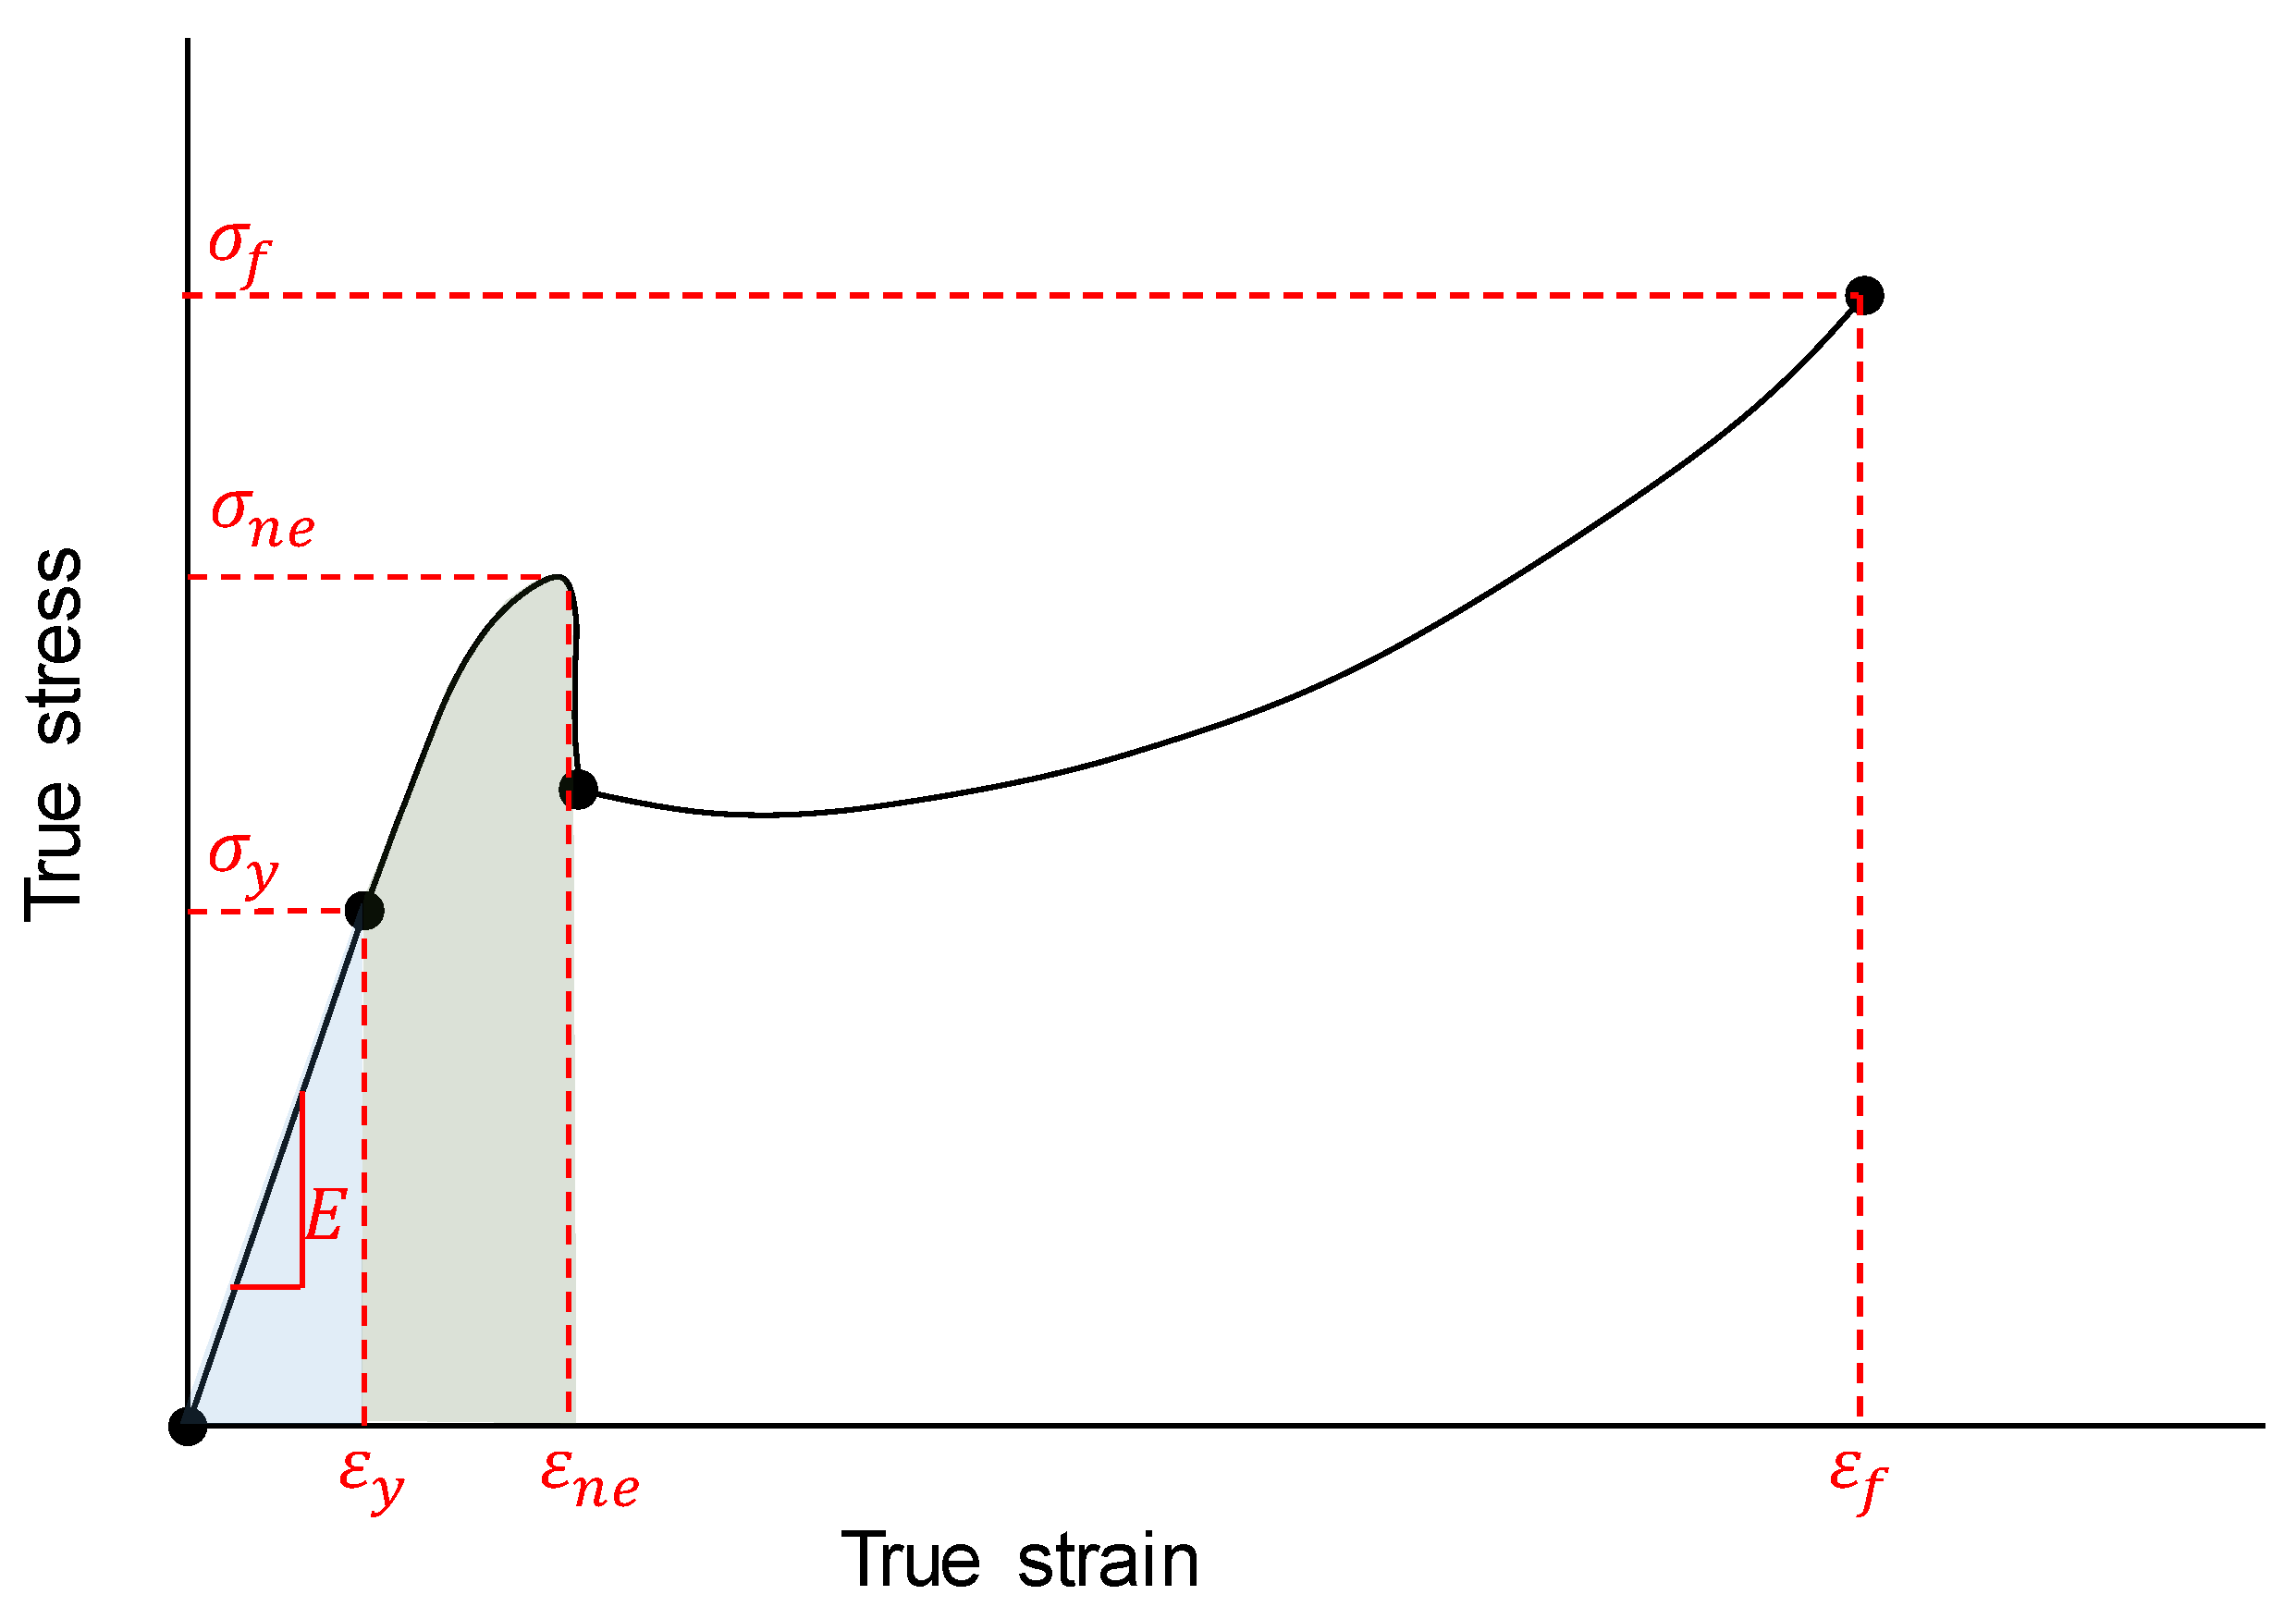
The true stress–strain tensile behavior of polycarbonate is different from that of metals. A typical true stress–strain tensile curve of polycarbonate is shown in Figure 4. To model such a curve, three regions are identified. The first region is the linear elastic region which is governed by one material property, the modulus of elasticity, E . The second region starts at the yielding points, σ y and ends at the necking stress, σ n e . The latter is called the necking stress because it is a very distinctive level of stress at which the cross-sectional area of the tensile specimen suddenly necks at a specific location on the gauge section. This sudden change in the geometry is associated with severe localized plastic flow that results in a drop of the stress level. By observing the sample during the tests, the third region is found to be associated with the progression of the necking over the entire gauge section. As larger part of the gauge section is necking, the cross-sectional area of the gauge section is reduced further. This is associated with an increase in the stress that ultimately reaches to a critical value at which a crack is formed. Once the crack is formed, it grows quickly leading to complete fracture at σ f . It is assumed here that the part of tensile stress curve after the onset of necking is of no practical use as it corresponds to severe change in the geometry and plastic flow. As a result, failure is assumed to occur when the necking stress, σ n e , indicated in Figure 4 is reached. Hence, the strain energy density, W c , is calculated to the stress level σ n e shown by the shaded area in Figure 4. Instead of using Equation (1), MATLAB’s trapezoidal numerical integration function was used such that W c = t r a p z ( ε , σ ) [42].

2.5. Finite Element Analysis

Linear elastic 2D finite element analysis was performed using ANSYS software to evaluate the strain energy density in the control volume for all U-notched specimens. Because the material is assumed to behave elastically, only the modulus of elasticity and the Poisson’s ratio are required for the material model. Plane 182 element was used to mesh the geometry with plane stress with thickness assumption. Due to symmetry, only one-half of the sample was considered. The boundary conditions were applied such that all nodes alongside the notch are restricted in y-direction. The top side of the specimen was restricted in the x-direction and a negative pressure was applied on it as shown in Figure 5a. Although strain energy density method is shown to be mesh-independent [43], the mesh of the control volume was refined to have an average of 6000 nodes as shown in Figure 5b,c.

3. Results

3.1. Monotonic Tensile Specimens

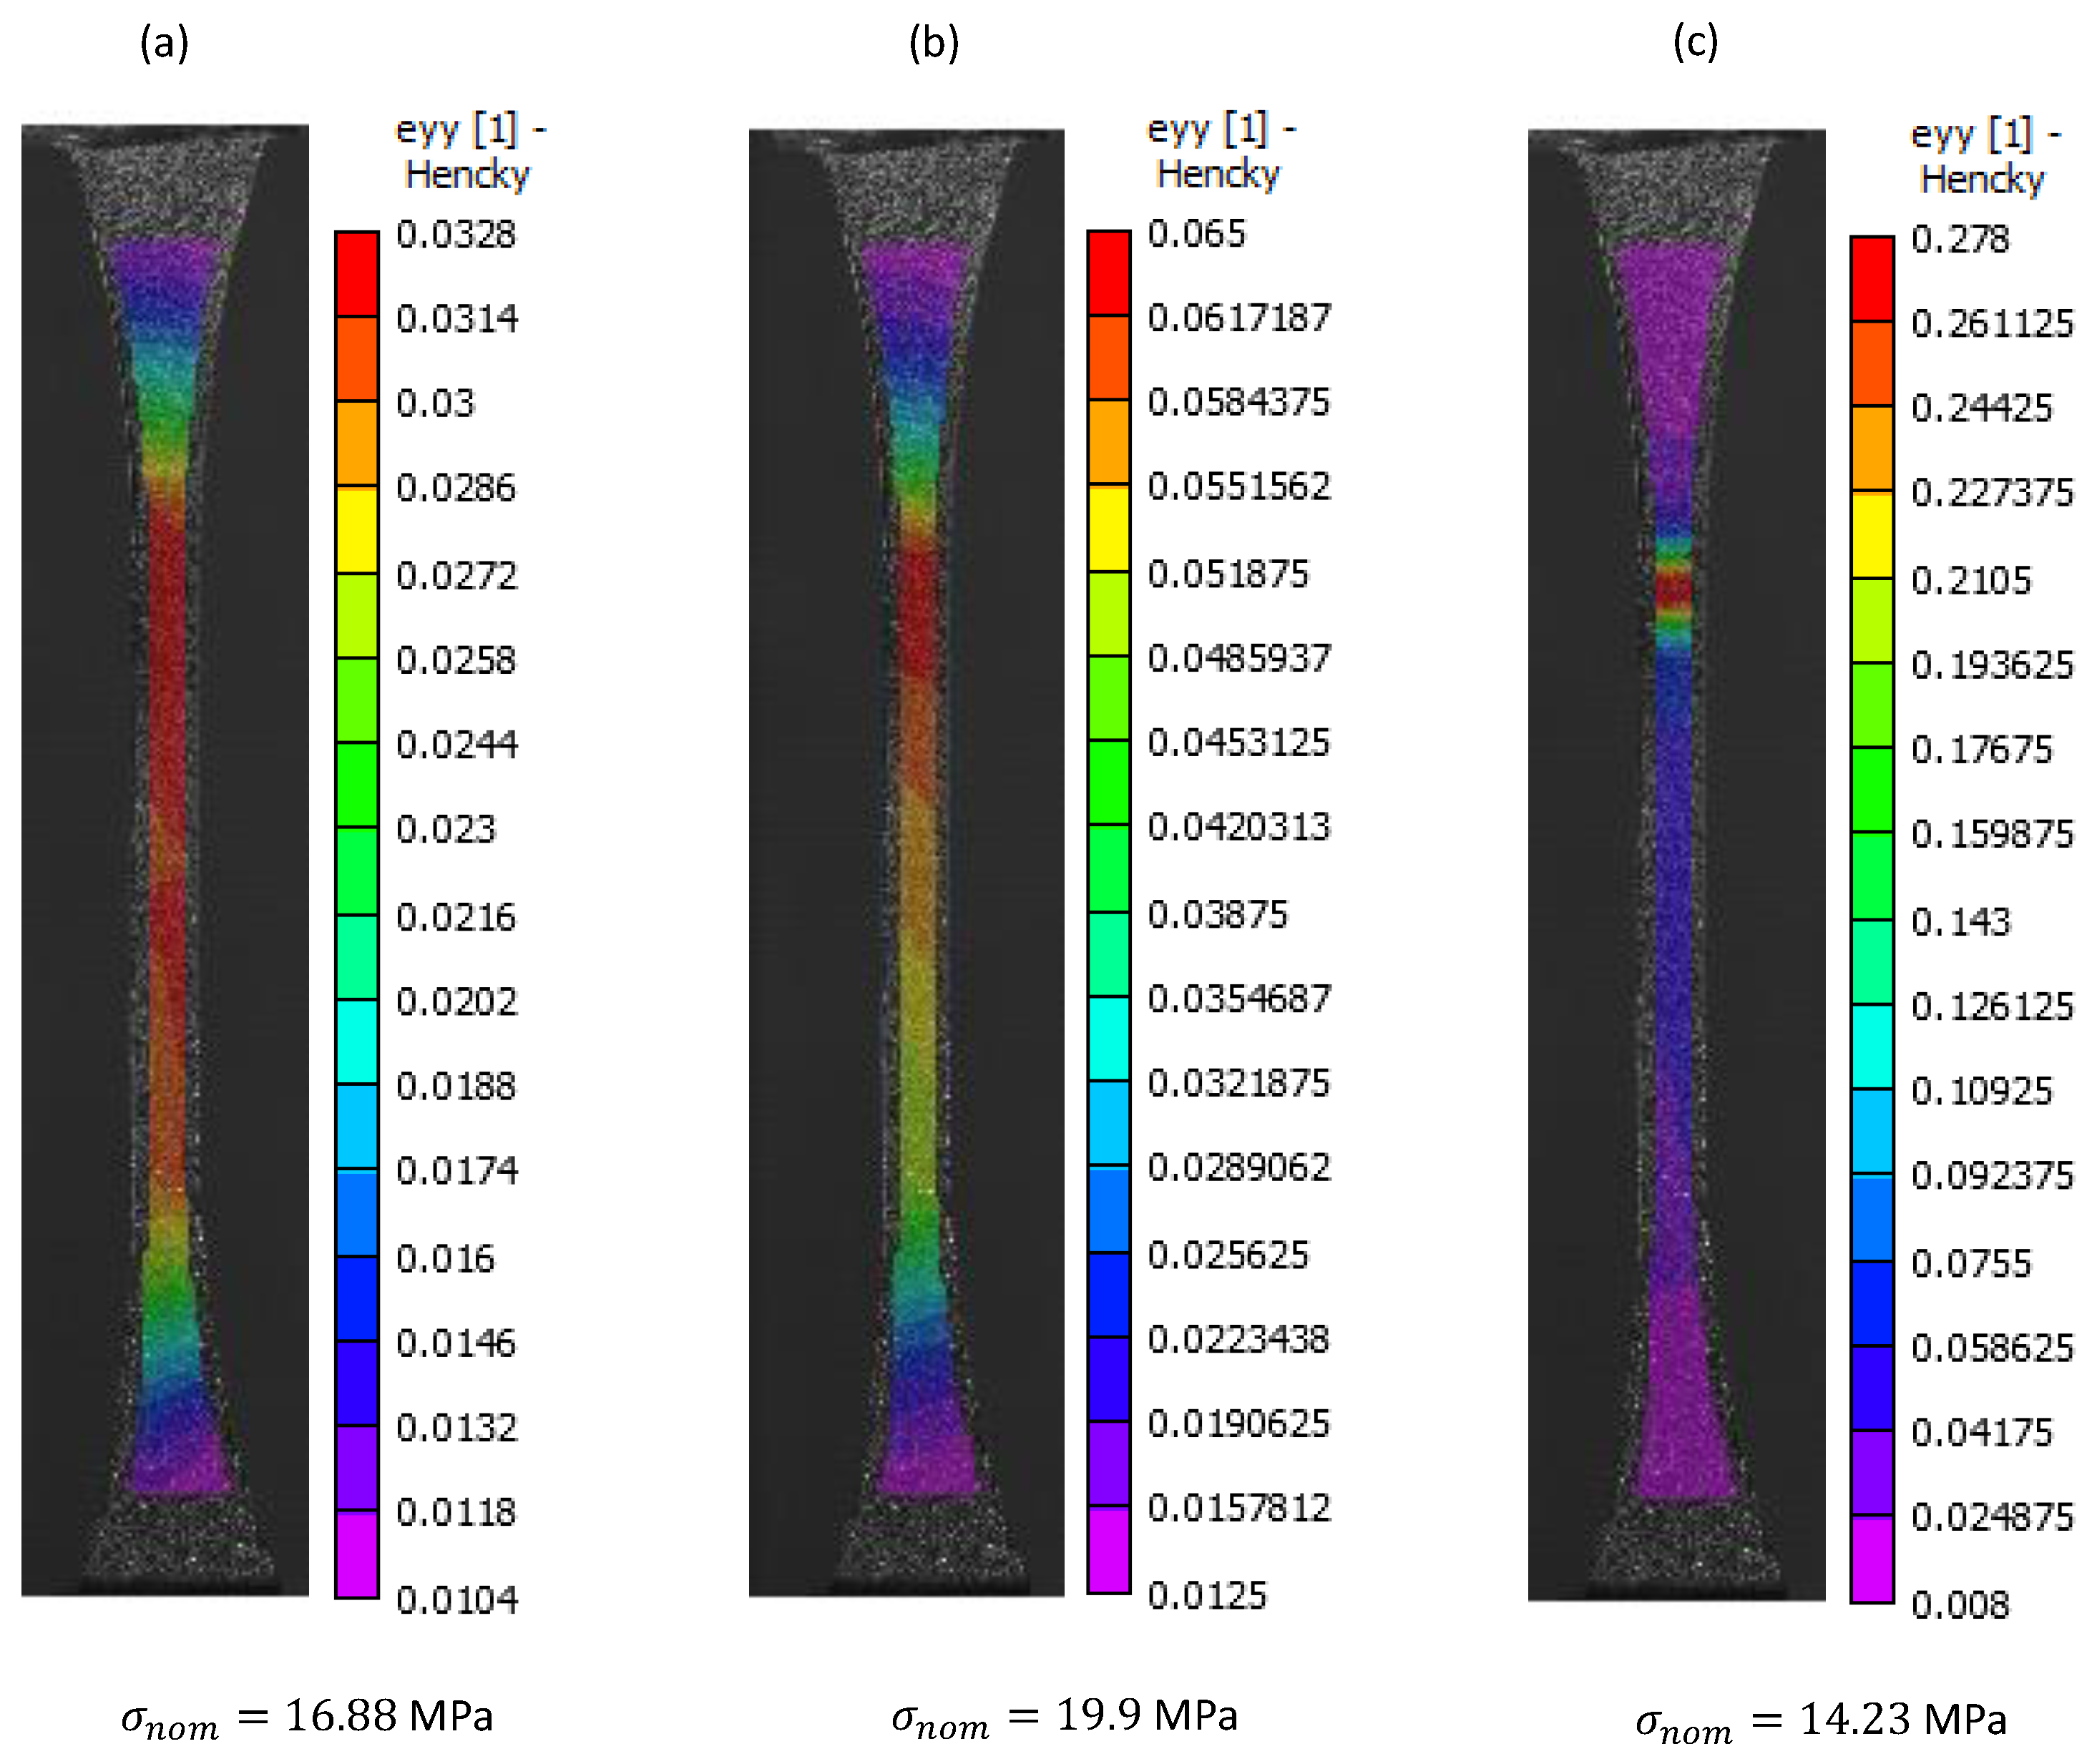
True stress–strain curves obtained from testing the samples with both extensometer and digital image correlation are shown in Figure 6. The curves are plotted to the point when necking starts which is also associated with a sudden drop in the load. The average mechanical properties obtained from the stress–strain curves are listed in Table 2. Figure 7 shows the true strain-field along the loading direction at different loading stages. Figure 7a shows that in early stage of loading the magnitude of true strain along the loading direction is fairly uniform across the gauge section. As the test progresses, Figure 7b, the strain starts to localize in small region at the gauge section. Figure 7c shows the instance when the strain and stress reach their maximum value before necking starts. The localized strain region shown in Figure 7c is the location at which the necking occurs. After that, the reduction of the cross-section propagates to the remaining part of the gauge section as explained previously.

3.2. U-Notched Specimens

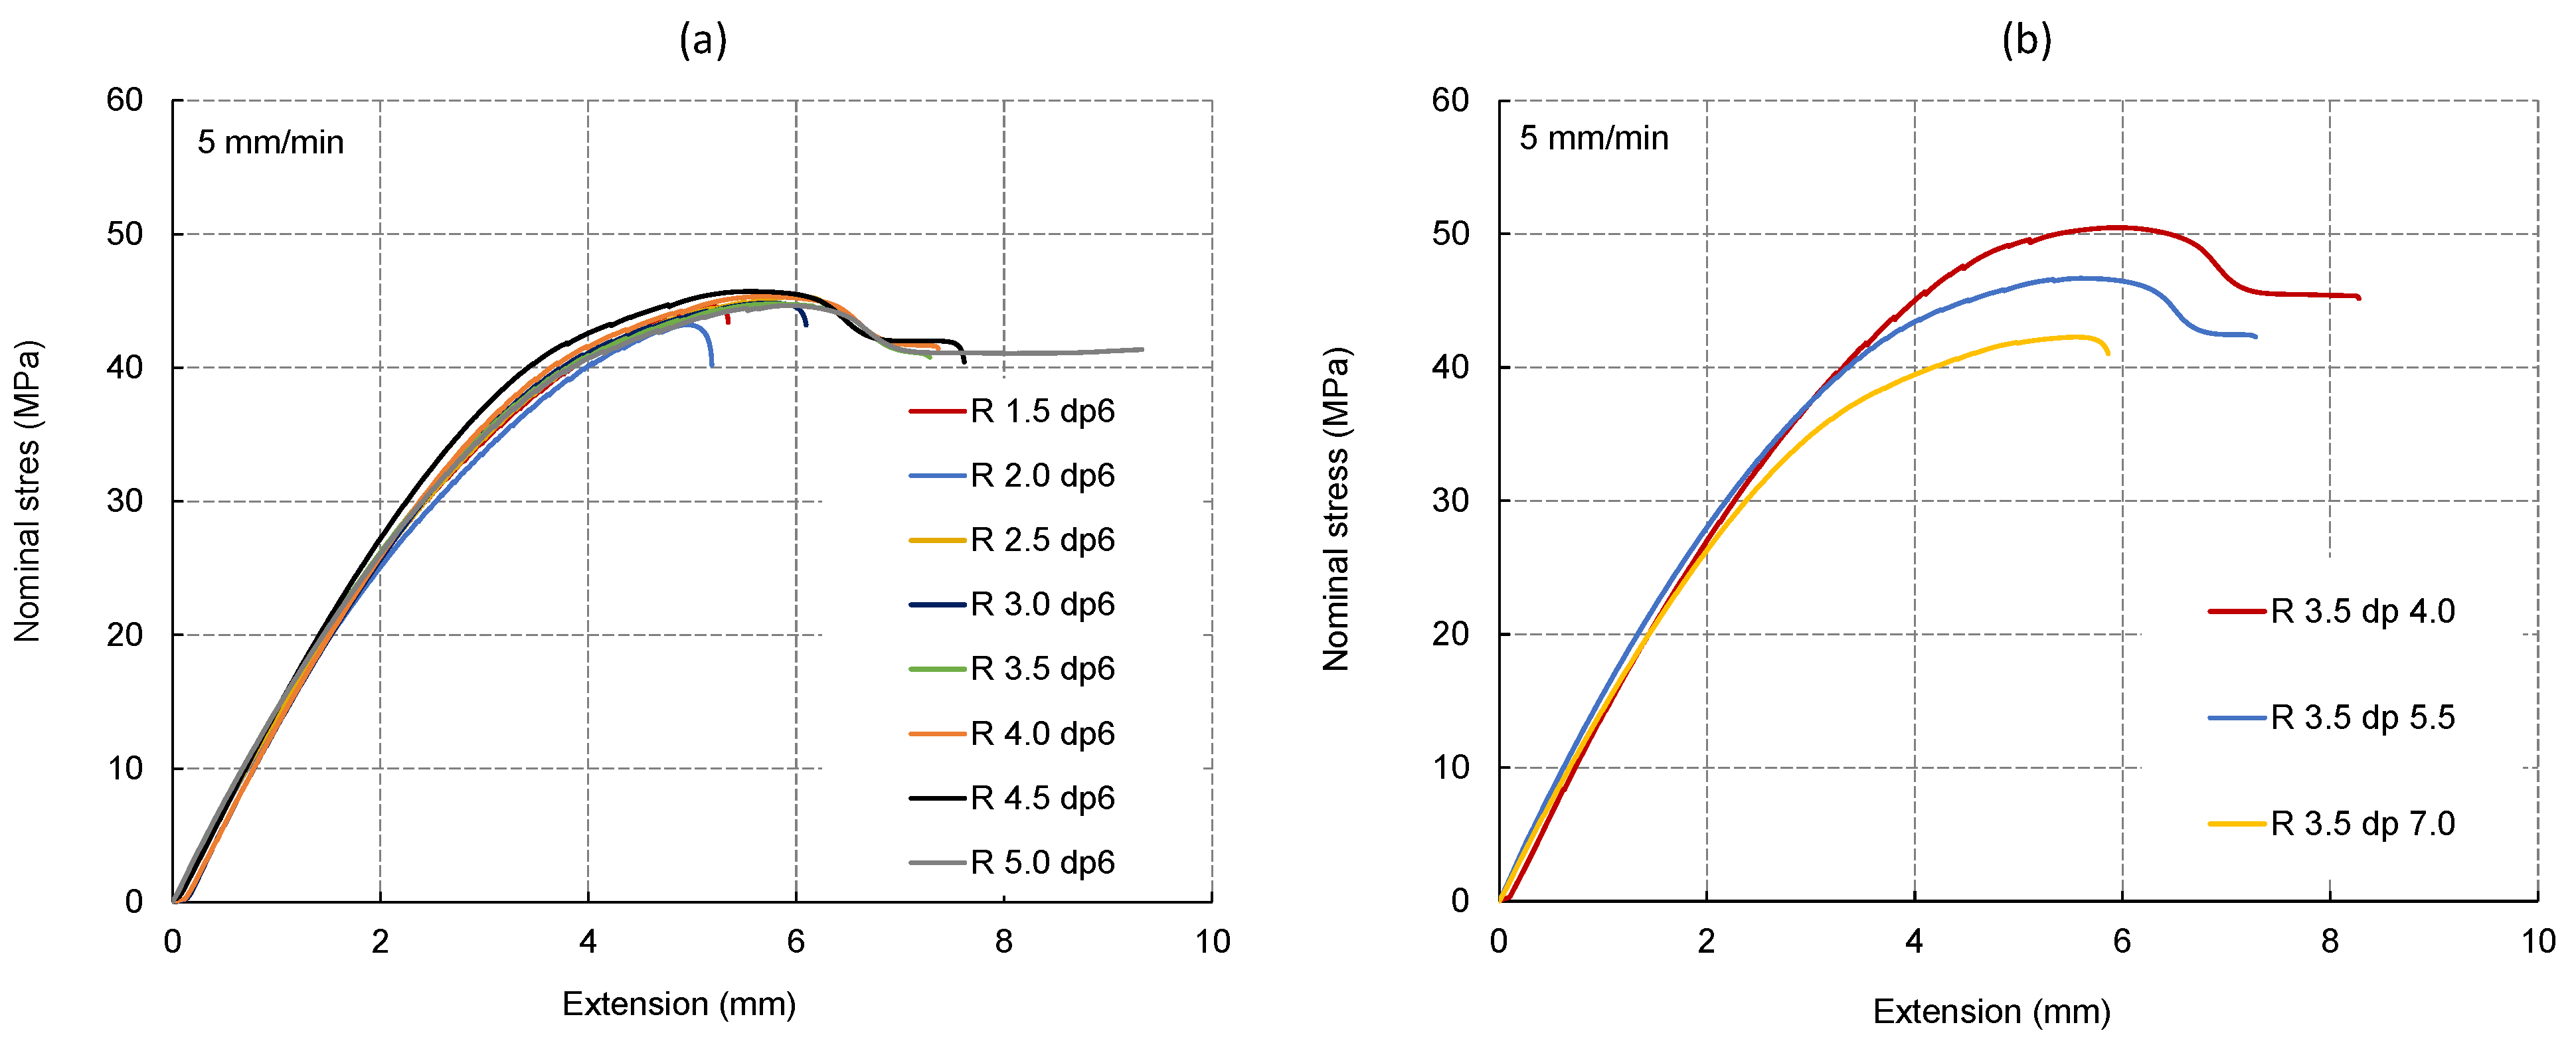
The nominal stress extension curves for the U-notch specimens with different radii and constant depth d p = 6.0 mm are shown in Figure 8a. In addition, the nominal stress extension curves for the U-notch specimens with different depths d p and constant radius ρ = 3.5 mm are shown in Figure 8b.
It can be observed from these two figures that there are two types of failures. In the first type, the stress-extension relation is best described by a second order polynomial type relation. Thus, additional stress is required to induce further plastic deformation until complete failure occurs after reaching the maximum stress capacity. The fracture of specimen with ρ = 1.5 mm and d p = 6.0 mm follows this behavior and is shown in Figure 9.
In the second type, the stress-extension relation can partially be described by a second order polynomial behavior. However, after reaching the maximum stress the load signal drops by nearly 8% after which plastic flow starts as observed from the specimen with ρ = 5.0 mm and d p = 6.0 mm. Extension continues to increase with nearly the same stress level until complete fracture occurs. This behavior is associated with a formation of a large strip with severe plastic deformation as shown in Figure 10. The thickness of this strip is reduced compared to the nominal thickness of the specimen, and it extends to the free end of the sample opposite to the notch tip. The size of the strip continues to increase until complete fracture occurs. The same behavior is observed from specimen ρ = 3.5 mm and d p = 4.0 mm as shown in Figure 11. It can be clearly seen that the fracture behavior observed in Figure 10 for the specimen with ρ = 5.0 mm and d p = 6.0 mm and Figure 11 for the specimen with ρ = 3.5 mm and d p = 4.0 mm is associated with the same nominal stress extension behavior as shown in Figure 8a,b.
Detailed experimental results for all tested specimens including the fracture force for each sample, the average fracture force and the standard deviation are listed in Table 3.

3.3. Predictions of Fracture Load Using EMC-SED

The average strain energy density from the five tested tensile specimens is W c , E M C = 2.357 ± 0.15 MJ/m3. The equivalent fracture stress σ f * can be calculated using
σ f * = ( W c , E M C ) ( 2 E )
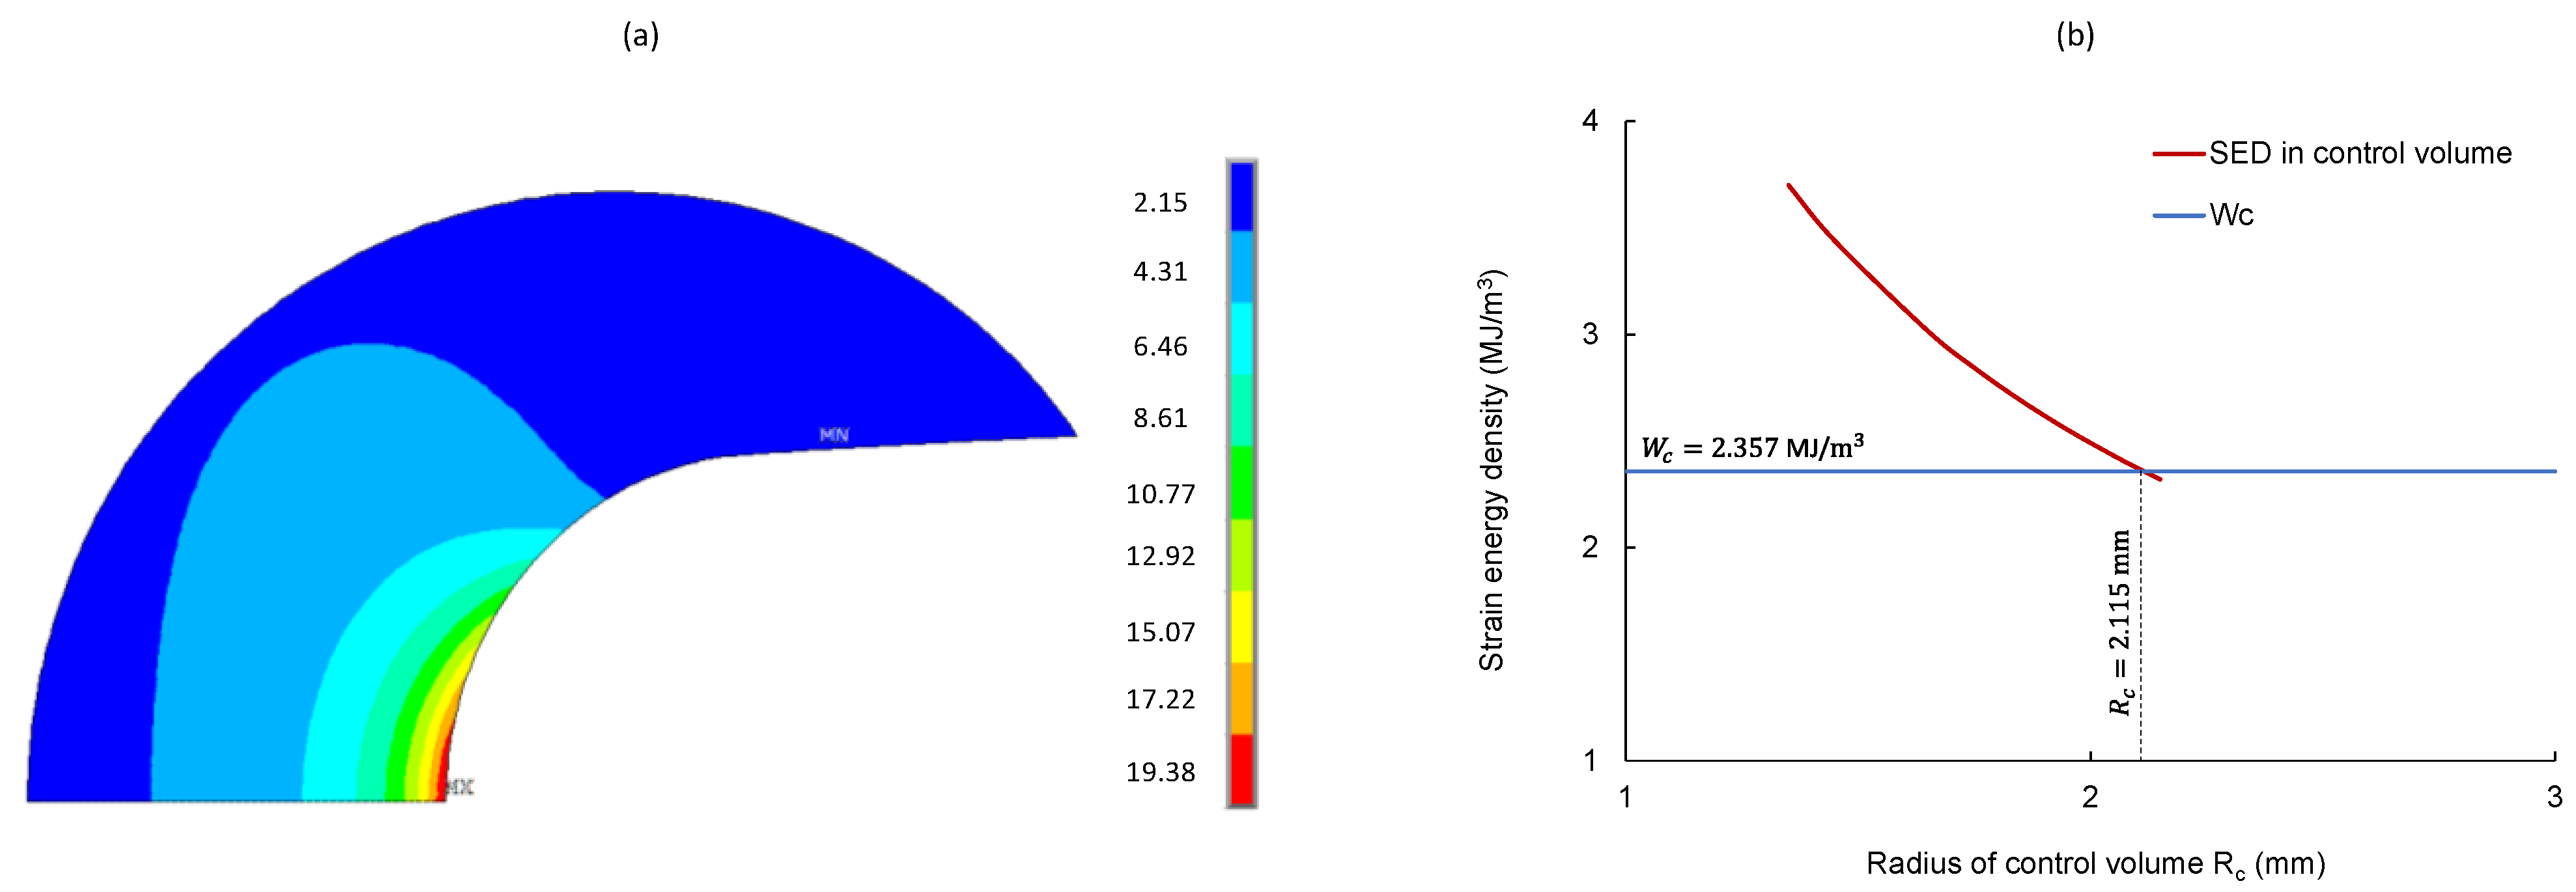
which gives σ f * = 103.39 MPa. The average strain energy density of 2.357 MJ/m3 and the specimen with ρ   = 1.5 mm and d p = 6.0 mm was then used to determine the critical radius of the control volume R c . This was achieved by applying the average fracture force 6885.8 N obtained from the experiment as listed in Table 3 as a load in the finite element model. As mentioned earlier, the material is modeled as linear-elastic. Therefore, the average modulus of elasticity listed in Table 1, E = 2267.6 MPa, and a Poisson’s ratio of 0.38 were used in the material mode. Knowing that the value r 0 for the U-notch geometry is ρ / 2 , the radius R c + r 0 shown in Figure 3 is changed incrementally and the corresponding strain energy and volume enclosed by the produced crescent shapes are evaluated using ANSYS for each increment. By dividing the strain energy over the volume, the strain energy density is obtained for each increment. Because the fracture load is applied, the value of R c + r 0 that produces a strain energy density equal or close to W c , E M C = 2.357 MJ/m3 must corresponds to the onset of failure for the notch specimen. The process for determining the value of the critical radius is shown in Figure 12 and a value of R c = 2.115 mm was obtained. As stated by the strain energy density criterion, the critical radius of the control volume is a material property [23]. Therefore, the size of the crescent for other U-notched specimens is only controlled by r 0 = ρ / 2 .
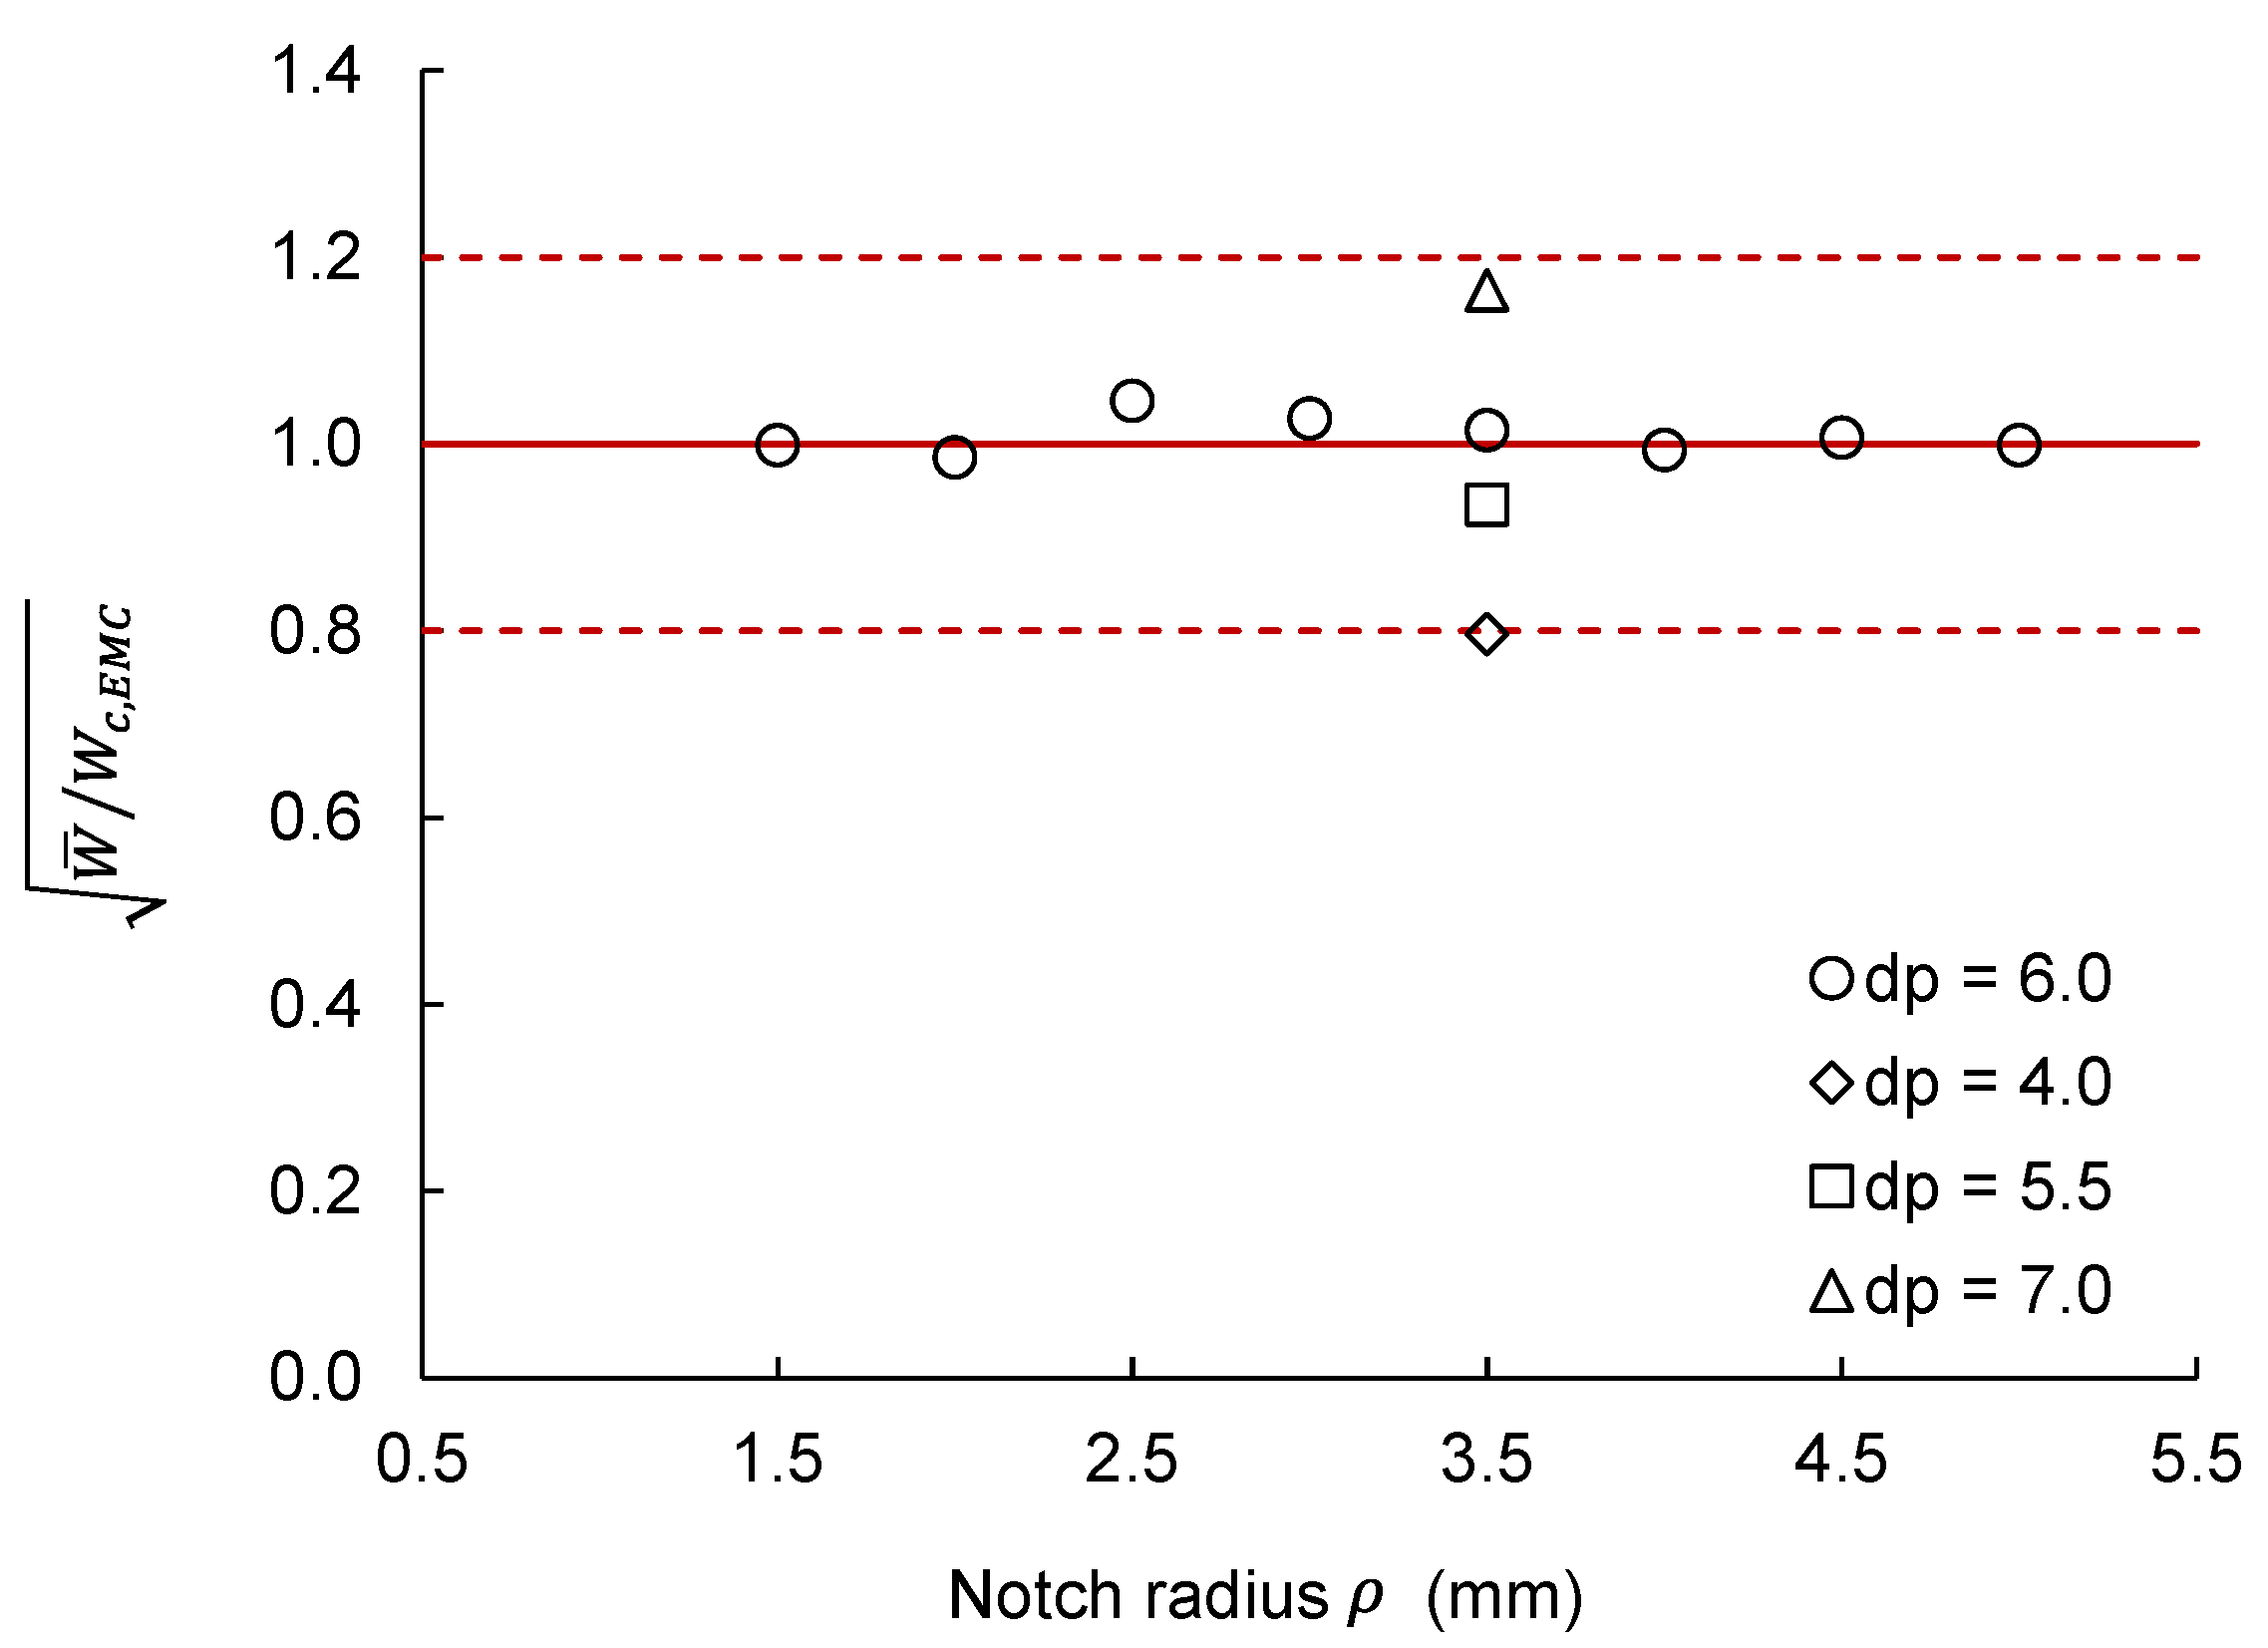
Comparison between the experimental and the estimated fracture load is shown in Table 4. It can be seen that the estimation for all U-notched specimens with depth d p = 6.0 mm are nearly within 4.4% of that obtained from the experiment. However, the accuracy of the estimation drops for the specimens with d p = 4.0 mm and d p = 7 mm reaching to 25.5% and 14.1% that of the experimental values, respectively. A synthesis of the fracture data for all U-notched specimen in terms of the square root of the strain energy density evaluated within the control volume, W ¯ , over the critical strain energy density, W c , E M C with respect to the notch radius is reported in Figure 13.

4. Discussion

In this investigation, polycarbonate is assumed to fail at the onset of necking that is associated with an average true strain of 5.5%. This percentage only constitutes a small portion of the total deformation that polycarbonate can sustain knowing that the average true fracture strain obtained from this study is about 100%. An average true facture strain of about 60% is reported for polycarbonate at different strain rates [6]. However, it is considered here that necking strain is a reasonable failure criterion for structural components. It is important to note that consideration of higher strain levels such as the true fracture strain may not possible within the current formulation of the strain energy density (SED) criterion. If the failure criterion is chosen to be the true fracture strain, then the strain energy density resulting from the total true stress–strain curve is going to be about 12.93 MJ/m3. This is more than five times the energy obtained by considering the area under true stress–strain curve until the onset of necking that is W c , E M C = 2.357 MJ/m3. This strain energy density was obtained from the ratio of a total strain energy of 115.39 MJ and a control volume of 48.95 m3. It is important to note that while performing finite element analysis on a notched specimen, the strain energy generated due to the application of the load is essentially the same regardless of the selected failure criterion. Thus, the control volume must be deceased in order to increase the strain energy density. The reduction of the control volume means that the critical radius, R c , must also be decreased. However, there is a geometrical and numerical limitations that bound the size of the critical radius. In fact, as illustrated in Figure 3 and Figure 5, as the size of the critical radius gets smaller it becomes numerically challenging to model and mesh the control volume.
It is clearly seen from the reported results in both Table 4 and Figure 13 that the EMC-SED method can estimate the fracture load of the notched specimens having a depth of 6.0 mm and different radii within absolute difference between 0.13% and 4.4% compared to the experimental observation. However, the accuracy of the estimation is reduced for the samples having equal radius of 3.5 mm and different depths. The sample with ρ = 3.5 mm and d p = 5.5 mm is only 0.5 mm shorter in depth compared the one with ρ = 3.5 mm and d p = 6.0 mm; however, the absolute difference between them is 1.5% for the former and 6.9% for the latter. On the contrary and while keeping the same radius of ρ = 3.5 mm, an increase of 1.0 mm to notch depth, i.e., d p = 7.0 mm, increases the absolute difference to 14.1%. The highest absolute difference of 25.5% is obtained for the sample with ρ = 3.5 mm and d p = 4.0 mm. In an attempt to explain these observations, the true strain fields analyzed using digital image correlation system for different notch radii and depths are shown in Figure 14. This figure shows the distribution of the true strain along the loading direction ε y . The nominal stress extension curves, shown in Figure 8, are superimposed with the images of the notched specimens to help explaining their fracture behaviors. In addition, contours corresponding to approximately the same true strain value of about 4.5% are drawn on each image. It can be seen from Figure 14a,b that the sizes of the strain counters are comparable which is also associated with similar stress-extension curves. Both of these specimens have the same notch depth of 6.0 mm, but their radii are ρ = 1.5 mm and ρ = 3.0 mm. Figure 14c shows the true strain field for another sample having a notch depth of 6.0 mm but with a radius of 5.0 mm. It can be seen from this figure that the strain contour is larger than that of the specimens shown in Figure 14a,b. The stress-extension curve for the specimen in Figure 14c indicates that the sample was undergoing plastic flow as observed in Figure 10. However, a common characteristic between the three samples in Figure 14a–c is the zone ahead of the notch that is relatively similar in size and is having an average strain magnitude of 8.65%.
Similar analysis can be performed on the samples having the same notch radius ρ = 3.5 mm but notch depths of 7.0 mm and 4.0 mm as shown in Figure 14d,e, respectively. Clearly, the size of the strain contour is smaller for the sample with depth of 7.0 mm and it is significantly smaller for the sample with depth of 4.0 mm. In addition, the sample with depth of 7.0 mm exhibit smaller plastic flow compared to the one with the depth of 4.0 mm. However, a key difference between the samples in Figure 14d,e is the magnitude of the true strain that is 7.5% and 4.6%, respectively. The images shown in Figure 14 are captured and analyzed at the onset before crazing or significant plastic deformation are observed. Therefore, it is assumed that if the strain ahead of notch at this instance is not high enough to initiate crack, failure is dominated by plastic flow. This plastic flow is associated with severe localized damage and thinning of the cross-section ahead of the notch that results in a formation of small crack followed by a sudden failure. Conversely, if the strain level is high enough to initiate crack, failure is dominated by crack propagation that is also accompanied with localized severe plastic deformation.
Within the limited results reported in this paper, it can be said that a strain magnitude above 7.5% would result in a crack propagation dominant failure. As for estimations by the EMC-SED method, the strain field in Figure 14 are not enough to explain why the accuracy of the method was reduced for the samples with different depth. Knowledge about the distribution of the strain energy density ahead of the notch may help understand this issue. However, this would require an independent elastic-plastic computational analysis that could be considered in future research. However, and without generalization, it can be said that the EMC-SED method provided reasonable estimation of the fracture load for the cases that developed localized strain zone with a magnitude of 7.5% or higher. These include the specimens shown in Figure 14a–d.

5. Conclusions

In this paper, polycarbonate sheets are envisioned to be used as a material for structural components in solar energy systems. Hence, they will provide a light weight alternative compared to metallic material in addition to easier formability. Therefore, it is important to investigate a proper engineering design tool that can be used to analyze the effect of notches on the fracture behavior polycarbonate. Mechanical tests were performed on U-notched polycarbonate specimens machined with different notch radii and depths. It was shown that the equivalent material concept (EMC) and the strain energy density criterion (SED) can be used to estimate the quasi-static fracture load of U-notched polycarbonate specimens. The estimation of fracture loads using the EMC-SED method for the specimens having different notch radii and a constant depth of 6.0 mm are within 4.4% of that observed from the experiment. On the other hand, the fracture loads for the geometries that have fixed radius of 3.5 mm but different depths were estimated within 7% to 25.5% of that obtained from the experiment.
Two dominant modes of failure were observed: a crack propagation and plastic flow. Digital image correlation was used to explain these modes by analyzing the size of the localized strain zone ahead of the notch. In general, the obtained results from this investigation suggest that the EMC-SED method provides better estimation for the specimens that have the same depth but different notch radii. Further investigation is necessary to assess the capability of EMS-SED method for cases with constant notch radius and different notch depth.

Author Contributions

Conceptualization and methodology, formal analysis J.A. (Jafar Albinmousa); writing—original draft preparation, J.A. (Jafar Albinmousa), J.A.(Jihad AlSadah), and M.A.H.; project administration J.A. (Jafar Albinmousa), J.A. (Jihad AlSadah), M.A.H., and H.M.A.-Q.; funding acquisition, J.A. (Jihad AlSadah) All authors have read and agreed to the published version of the manuscript.

Funding

This research is funded by KACST through NSTIP grant number 13-ENE260-04.

Institutional Review Board Statement

Not applicable.

Informed Consent Statement

Not applicable.

Data Availability Statement

The data presented in this study are available on request from the corresponding author.

Acknowledgments

The authors would like to acknowledge KACST for supporting this work through NSTIP project #13-ENE260-04 and King Fahd University of Petroleum and Minerals Dhahran, Saudi Arabia.

Conflicts of Interest

The authors declare no conflict of interest.

References

  1. James, M.N.; Lu, Y.; Christopher, C.J.; Patterson, E.A. Crack Path Support for Deformation Mechanisms in Fatigue of Polycarbonate. Eng. Fract. Mech. 2013, 108, 89–97. [Google Scholar] [CrossRef]
  2. James, M.N.; Christopher, C.J.; Lu, Y.; Patterson, E.A. Fatigue Crack Growth and Craze-Induced Crack Tip Shielding in Polycarbonate. Polymer 2012, 53, 1558–1570. [Google Scholar] [CrossRef]
  3. Xu, Y.; Zhang, Q.; Zhang, W.; Zhang, P. Optimization of Injection Molding Process Parameters to Improve the Mechanical Performance of Polymer Product against Impact. Int. J. Adv. Manuf. Technol. 2015, 76, 2199–2208. [Google Scholar] [CrossRef]
  4. Merah, N.; Albinmousa, J. Experimental and Numerical Determination of Mixed Mode Crack Extension Angle. J. Test. Eval. 2009, 37, 101668. [Google Scholar] [CrossRef]
  5. Albinmousa, J.; Merah, N.; Khan, S.M.A. A Model for Calculating Geometry Factors for a Mixed-Mode I–II Single Edge Notched Tension Specimen. Eng. Fract. Mech. 2011, 78, 3300–3307. [Google Scholar] [CrossRef]
  6. Xu, Y.; Gao, T.; Wang, J.; Zhang, W. Experimentation and Modeling of the Tension Behavior of Polycarbonate at High Strain Rates. Polymers 2016, 8, 63. [Google Scholar] [CrossRef] [PubMed] [Green Version]
  7. ASM International. Mechanical Testing and Evaluation. In ASM Handbook, 11th ed.; Kuhn, H., Ed.; ASM International: Materials Park, OH, USA, 2000; ISBN 978-0-87170-389-7. [Google Scholar]
  8. Sarva, S.; Boyce, M. Mechanics of Polycarbonate during High-Rate Tension. JOMMS 2007, 2, 1853–1880. [Google Scholar] [CrossRef] [Green Version]
  9. Sundaram, B.M.; Tippur, H.V. Dynamic Mixed-Mode Fracture Behaviors of PMMA and Polycarbonate. Eng. Fract. Mech. 2017, 176, 186–212. [Google Scholar] [CrossRef]
  10. Fu, S.; Wang, Y.; Wang, Y. Tension Testing of Polycarbonate at High Strain Rates. Polym. Test. 2009, 28, 724–729. [Google Scholar] [CrossRef]
  11. Cao, K.; Ma, X.; Zhang, B.; Wang, Y.; Wang, Y. Tensile Behavior of Polycarbonate over a Wide Range of Strain Rates. Mater. Sci. Eng. A 2010, 527, 4056–4061. [Google Scholar] [CrossRef]
  12. Dwivedi, A.; Bradley, J.; Casem, D. Mechanical Response of Polycarbonate with Strength Model Fits; Dynamic Science Inc.: Aberdeen, MD, USA, 2012. [Google Scholar]
  13. Safari, K.H.; Zamani, J.; Ferreira, F.J.; Guedes, R.M. Constitutive Modeling of Polycarbonate during High Strain Rate Deformation. Polym. Eng. Sci. 2013, 53, 752–761. [Google Scholar] [CrossRef]
  14. Foster, M.; Love, B.; Kaste, R.; Moy, P. The Rate Dependent Tensile Response of Polycarbonate and Poly-Methylmethacrylate. J. Dyn. Behav. Mater. 2015, 1, 162–175. [Google Scholar] [CrossRef] [Green Version]
  15. Al-Juaid, A.A.; Othman, R. Modeling of the Strain Rate Dependency of Polycarbonate’s Yield Stress: Evaluation of Four Constitutive Equations. J. Eng. 2016, 2016, 6315421. [Google Scholar] [CrossRef] [Green Version]
  16. Wang, H.; Zhou, H.; Huang, Z.; Zhang, Y.; Zhao, X. Constitutive Modeling of Polycarbonate over a Wide Range of Strain Rates and Temperatures. Mech. Time-Depend. Mater. 2017, 21, 97–117. [Google Scholar] [CrossRef]
  17. Rey Calderón, A.A.; Díaz Díaz, A. New Aspects in the Mechanical Behavior of a Polycarbonate Found by an Experimental Study. Adv. Mater. Sci. Eng. 2018, 2018, 1540919. [Google Scholar] [CrossRef] [Green Version]
  18. Zhang, W.; Xu, Y. Mechanical Properties of Polycarbonate: Experiment and Modeling for Aeronautical and Aerospace Applications; Elsevier: Amsterdam, The Netherlands, 2019; ISBN 0-12-820454-0. [Google Scholar]
  19. Gearing, B.P.; Anand, L. Notch-Sensitive Fracture of Polycarbonate. Int. J. Solids Struct. 2004, 41, 827–845. [Google Scholar] [CrossRef]
  20. Takaffoli, M.; Hangalur, G.; Bakker, R.; Chandrashekar, N. Thermo-Visco-Hyperelastic Behavior of Polycarbonate in Forming of a Complex Geometry. J. Manuf. Process. 2020, 57, 105–113. [Google Scholar] [CrossRef]
  21. Malwad, D.; Tungikar, V. Development and Performance Testing of Reflector Materials for Concentrated Solar Power: A Review. Mater. Today Proc. 2020. [Google Scholar] [CrossRef]
  22. Alder, F.A.; Charrault, E.; Zuber, K.; Fabretto, M.; Patil, A.; Murphy, P.; Llusca, M. Fabrication of Robust Solar Mirrors on Polymeric Substrates by Physical Vapor Deposition Technique. Sol. Energy Mater. Sol. Cells 2020, 209, 110476. [Google Scholar] [CrossRef]
  23. Lazzarin, P.; Zambardi, R. A Finite-Volume-Energy Based Approach to Predict the Static and Fatigue Behavior of Components with Sharp V-Shaped Notches. Int. J. Fract. 2001, 112, 275–298. [Google Scholar] [CrossRef]
  24. Susmel, L.; Taylor, D. On the Use of the Theory of Critical Distances to Predict Static Failures in Ductile Metallic Materials Containing Different Geometrical Features. Eng. Fract. Mech. 2008, 75, 4410–4421. [Google Scholar] [CrossRef]
  25. Chebat, F.; Peron, M.; Viespoli, L.M.; Welo, T.; Berto, F. Fatigue Strength Assessment of Steel Rollers: On the Reliability of the Strain Energy Density Approach on Real Components. Appl. Sci. 2018, 8, 1015. [Google Scholar] [CrossRef] [Green Version]
  26. Zhu, S.-P.; Liu, Y.; Liu, Q.; Yu, Z.-Y. Strain Energy Gradient-Based LCF Life Prediction of Turbine Discs Using Critical Distance Concept. Int. J. Fatigue 2018, 113, 33–42. [Google Scholar] [CrossRef]
  27. Cicero, S.; Fuentes, J.D.; Torabi, A.R. Using the Equivalent Material Concept and the Average Strain Energy Density to Analyse the Fracture Behaviour of Structural Materials. Appl. Sci. 2020, 10, 1601. [Google Scholar] [CrossRef] [Green Version]
  28. Albinmousa, J.; Peron, M.; Jose, J.; Abdelaal, A.F.; Berto, F. Fatigue of V-Notched ZK60 Magnesium Samples: X-Ray Damage Evolution Characterization and Failure Prediction. Int. J. Fatigue 2020, 139, 105734. [Google Scholar] [CrossRef]
  29. Albinmousa, J. Fatigue Failure Prediction of U-Notched ZK60 Magnesium Samples Using the Strain Energy Density Approach. Metals 2021, 11, 113. [Google Scholar] [CrossRef]
  30. Torabi, A.R. Estimation of Tensile Load-Bearing Capacity of Ductile Metallic Materials Weakened by a V-Notch: The Equivalent Material Concept. Mater. Sci. Eng. A 2012, 536, 249–255. [Google Scholar] [CrossRef]
  31. Torabi, A.R. Ultimate Bending Strength Evaluation of U-Notched Ductile Steel Samples under Large-Scale Yielding Conditions. Int. J. Fract. 2013, 180, 261–268. [Google Scholar] [CrossRef]
  32. Torabi, A.R.; Habibi, R.; Mohammad Hosseini, B. On the Ability of the Equivalent Material Concept in Predicting Ductile Failure of U-Notches under Moderate- and Large-Scale Yielding Conditions. Phys. Mesomech. 2015, 18, 337–347. [Google Scholar] [CrossRef]
  33. Gómez, F.J.; Elices, M.; Valiente, A. Cracking in PMMA Containing U-Shaped Notches. Fatigue Fract. Eng. Mater. Struct. 2000, 23, 795–803. [Google Scholar] [CrossRef]
  34. Torabi, A.R.; Rahimi, A.S.; Ayatollahi, M.R. Tensile Fracture Analysis of a Ductile Polymeric Material Weakened by U-Notches. Polym. Test. 2017, 64, 117–126. [Google Scholar] [CrossRef]
  35. Bahadur, S. Strain Hardening Equation and the Prediction of Tensile Strength of Rolled Polymers. Polym. Eng. Sci. 1973, 13, 266–272. [Google Scholar] [CrossRef]
  36. Erdogan, F.; Sih, G.C. On the Crack Extension in Plates Under Plane Loading and Transverse Shear. J. Basic Eng. 1963, 85, 519–525. [Google Scholar] [CrossRef]
  37. Rahimi, A.S.; Ayatollahi, M.R.; Torabi, A.R. Fracture Study in Notched Ductile Polymeric Plates Subjected to Mixed Mode I/II Loading: Application of Equivalent Material Concept. Eur. J. Mech. A/Solids 2018, 70, 37–43. [Google Scholar] [CrossRef]
  38. Khosravani, M.R.; Zolfagharian, A. Fracture and Load-Carrying Capacity of 3D-Printed Cracked Components. Extrem. Mech. Lett. 2020, 37, 100692. [Google Scholar] [CrossRef]
  39. D20 Committee. Test Method for Tensile Properties of Plastics; ASTM International: West Conshohocken, PE, USA, 2014. [Google Scholar]
  40. Yosibash, Z.; Bussiba, A.; Gilad, I. Failure Criteria for Brittle Elastic Materials. Int. J. Fract. 2004, 125, 307–333. [Google Scholar] [CrossRef]
  41. Berto, F.; Lazzarin, P. Recent Developments in Brittle and Quasi-Brittle Failure Assessment of Engineering Materials by Means of Local Approaches. Mater. Sci. Eng. R Rep. 2014, 75, 1–48. [Google Scholar] [CrossRef]
  42. Torabi, A.R.; Berto, F.; Campagnolo, A.; Akbardoost, J. Averaged Strain Energy Density Criterion to Predict Ductile Failure of U-Notched Al 6061-T6 Plates under Mixed Mode Loading. Theor. Appl. Fract. Mech. 2017, 91, 86–93. [Google Scholar] [CrossRef]
  43. Lazzarin, P.; Berto, F.; Zappalorto, M. Rapid Calculations of Notch Stress Intensity Factors Based on Averaged Strain Energy Density from Coarse Meshes: Theoretical Bases and Applications. Int. J. Fatigue 2010, 32, 1559–1567. [Google Scholar] [CrossRef]
Figure 1. Tensile specimen with a thickness of 6 mm. All dimensions are in mm.
Applsci 11 03370 g001
Figure 2. U-notched specimens with a thickness of 6 mm. All dimensions are in mm.
Applsci 11 03370 g002
Figure 3. Illustration of the control volume for U-notch under mode I loading.
Applsci 11 03370 g003
Figure 4. Illustration of a typical true stress-strain curve for polycarbonate.
Applsci 11 03370 g004
Figure 5. Finite element model: (a) Boundary conditions and loading; (b) General mesh; (c) Mesh of the control volume.
Applsci 11 03370 g005
Figure 6. True stress–strain curves for polycarbonate obtained using both extensometer and digital image correlation.
Applsci 11 03370 g006
Figure 7. (ac) True strain fields along the loading direction obtained using digital image correlation for tensile specimens at different loading levels.
Applsci 11 03370 g007
Figure 8. Nominal stress extension curves for U-notched specimens: (a) different notch radii with d p = 6.0 mm; (b) different notch depth with ρ = 3.5 mm.
Applsci 11 03370 g008
Figure 9. Fracture behavior of specimen with ρ = 1.5 mm and d p = 6.0 mm at different times. (a) t= 52 s, (b) t = 63 s, (c) t = 64 s, (d) t = 65 s.
Applsci 11 03370 g009
Figure 10. Fracture behavior of specimen with ρ = 5.0 mm and d p = 6.0 mm at different times. (a) t = 1 s, (b) t = 46 s, (c) t = 67 s, (d) t = 90 s, (e) t = 108 s, (f) t =111 s.
Applsci 11 03370 g010
Figure 11. Fracture behavior of specimen with ρ = 3.5 mm and d p = 4.0 mm at different times. (a) t = 1 s, (b) t = 50 s, (c) t = 75 s, (d) t = 89 s.
Applsci 11 03370 g011
Figure 12. The control volume for specimen with ρ = 1.5 mm and d p = 6.0 mm: (a) elastic strain energy density; (b) determination of the critical radius R c .
Applsci 11 03370 g012
Figure 13. Synthesis of fracture data in terms of average strain energy density.
Applsci 11 03370 g013
Figure 14. True strain fields along the loading direction obtained using digital image correlation for notched specimens: (ac) specimens with different radii and depth d p = 6.0 mm; (d,e) specimens with different depths and ρ = 3.5   mm.
Applsci 11 03370 g014
Table 1. U-notch test matrix. 3 duplicates were tested for each geometry.
d p  (mm)6.06.06.06.06.06.06.06.04.05.57.0
ρ   (mm)1.52.02.53.03.54.04.55.03.53.53.5
Table 2. Average true monotonic tensile properties of polycarbonate.
E  
( MPa )
σ 0.2 %  
( MPa )
ε 0.2 %  
(mm/mm)
σ n e  
( MPa )
ε n e  
( mm / mm )
Average2267.636.10.017766.00.055
St. Dev47.011.960.00130.590.0029
Table 3. Experimental results of U-notched specimens.
ρ   ( mm ) d p   ( mm ) F 1 ( N ) F 2   ( N ) F 3   ( N ) F a v g   ( N ) St. Dev (N)
1.56.06870.66954.46832.46885.850.94
2.06.06914.06741.06456.56703.8188.63
2.56.06966.07063.07026.07018.339.97
3.06.06996.36988.16410.86798.4274.12
3.56.06614.96415.06882.06637.3191.33
4.06.06510.06495.06341.56448.876.14
4.56.06583.06600.06316.06499.7130.06
5.06.06566.06444.06271.06427.0121.03
3.54.07045.07115.07003.07054.346.20
3.55.56554.06616.06577.06582.325.59
3.57.06582.06669.06522.06591.060.35
Table 4. Estimation of fracture load using equivalent material concept-strain energy density (EMC-SED) method.
ρ   ( mm ) d p   ( mm ) Estimated   Fracture   Load ,   F E s t   ( N ) Avg .   Experimental   Fracture   Load ,   F a v g   ( N ) F E s t F a v g F a v g   ×   100   ( % )
2.06.06804.16703.81.50
2.56.06708.37018.3−4.42
3.06.06616.16798.4−2.68
3.56.06540.66637.3−1.46
4.06.06488.36448.80.61
4.56.06455.76499.7−0.68
5.06.06435.66427.00.13
3.54.08856.97054.325.55
3.55.57039.06582.36.94
3.57.05661.06591.0−14.11
Publisher’s Note: MDPI stays neutral with regard to jurisdictional claims in published maps and institutional affiliations.