Abstract
The structural failure of a tunnel is a process that evolves from local damage to overall destruction. The system reliability analysis method can be useful for analyzing the evolutionary law of local structural failure. In many complex stress environments, the structural performance function may be very complicated or even impossible to solve. This paper establishes a response surface function to represent the implicit tunnel performance function. The reliability of the shear capacity of a tunnel is considered. The critical parts and critical failure paths of the tunnel system are determined using the β-unzipping method. Failure evolution is analyzed to obtain the failure process of the tunnel system. Different failure modes are shown under different cases. Based on the partial failure probability and impact on the tunnel system, the risk levels of the critical parts at each stage of the failure history are evaluated. Therefore, the tunnel failure tree model obtained by combining the response surface method and β-unzipping method plays an important role in tunnel reliability evolution, and can evaluate tunnel safety comprehensively.
1. Introduction
Because of the variability in the physical parameters and the incomplete knowledge of underground structures, researchers have realized that there are uncertainties in parameters such as rock mass, support, and ground stress [1,2,3,4,5]. Deterministic methods cannot accurately represent the uncertainties in these parameters and might even produce erroneous results [6,7,8,9]. Therefore, the reliability method, which can address uncertain parameters, has attracted considerable interest from scholars [10,11,12]. Failure criteria and the evolution process are key areas of underground structural research. Structure failure is a process that evolves from local damage to overall destruction [13,14]. Different initial damage causes different failure processes [15,16,17,18,19,20]. The system reliability theory can analyze the reliability evolution of different failure modes [8,21,22,23]. Because of the different stress distributions at different locations of the structure system, different structural parts have different levels of reliability. While the safety status of certain parts might be reliable, others can be dangerous. The -unzipping method regulates parts whose reliability index is below a certain threshold and are considered critical parts [24]. The failure of critical parts will result in stress redistribution and create new critical parts. A failure tree consisting of multiple failure paths is thus formed [25,26].
We must determine a performance function that can reflect the state of the structure in order to obtain the reliability index. In many complex stress environments, the performance function of a structure may be quite complicated or even impossible to obtain. To acquire a reliability index with a complex performance function or implicit state, some authors proposed the response surface method [27], which was initially mainly applied to the reliability analysis of slopes [28,29,30,31]. As research progressed, the response surface method has gradually been applied to reliability analysis in tunnel engineering [32]. In order to study the failure evolution of the tunnel in this paper, the surrounding rock of the tunnel is divided into nine parts. The response surface function of the different parts is obtained using the response surface method. The tunnel shear capacity is considered. The system reliability of the tunnel under different lateral pressure coefficients is analyzed using the β-unzipping method, and the critical part of the failure history is identified; the evolution of the failure mode is ultimately acquired. The structural risk level is analyzed according to the failure probability and the impact on the tunnel system in different failure modes during the failure process. Therefore, this paper considers the different failure evolutions of the structure and evaluates the risk level of the major failure parts for each failure history.
2. Reliability Model of the Tunnel System
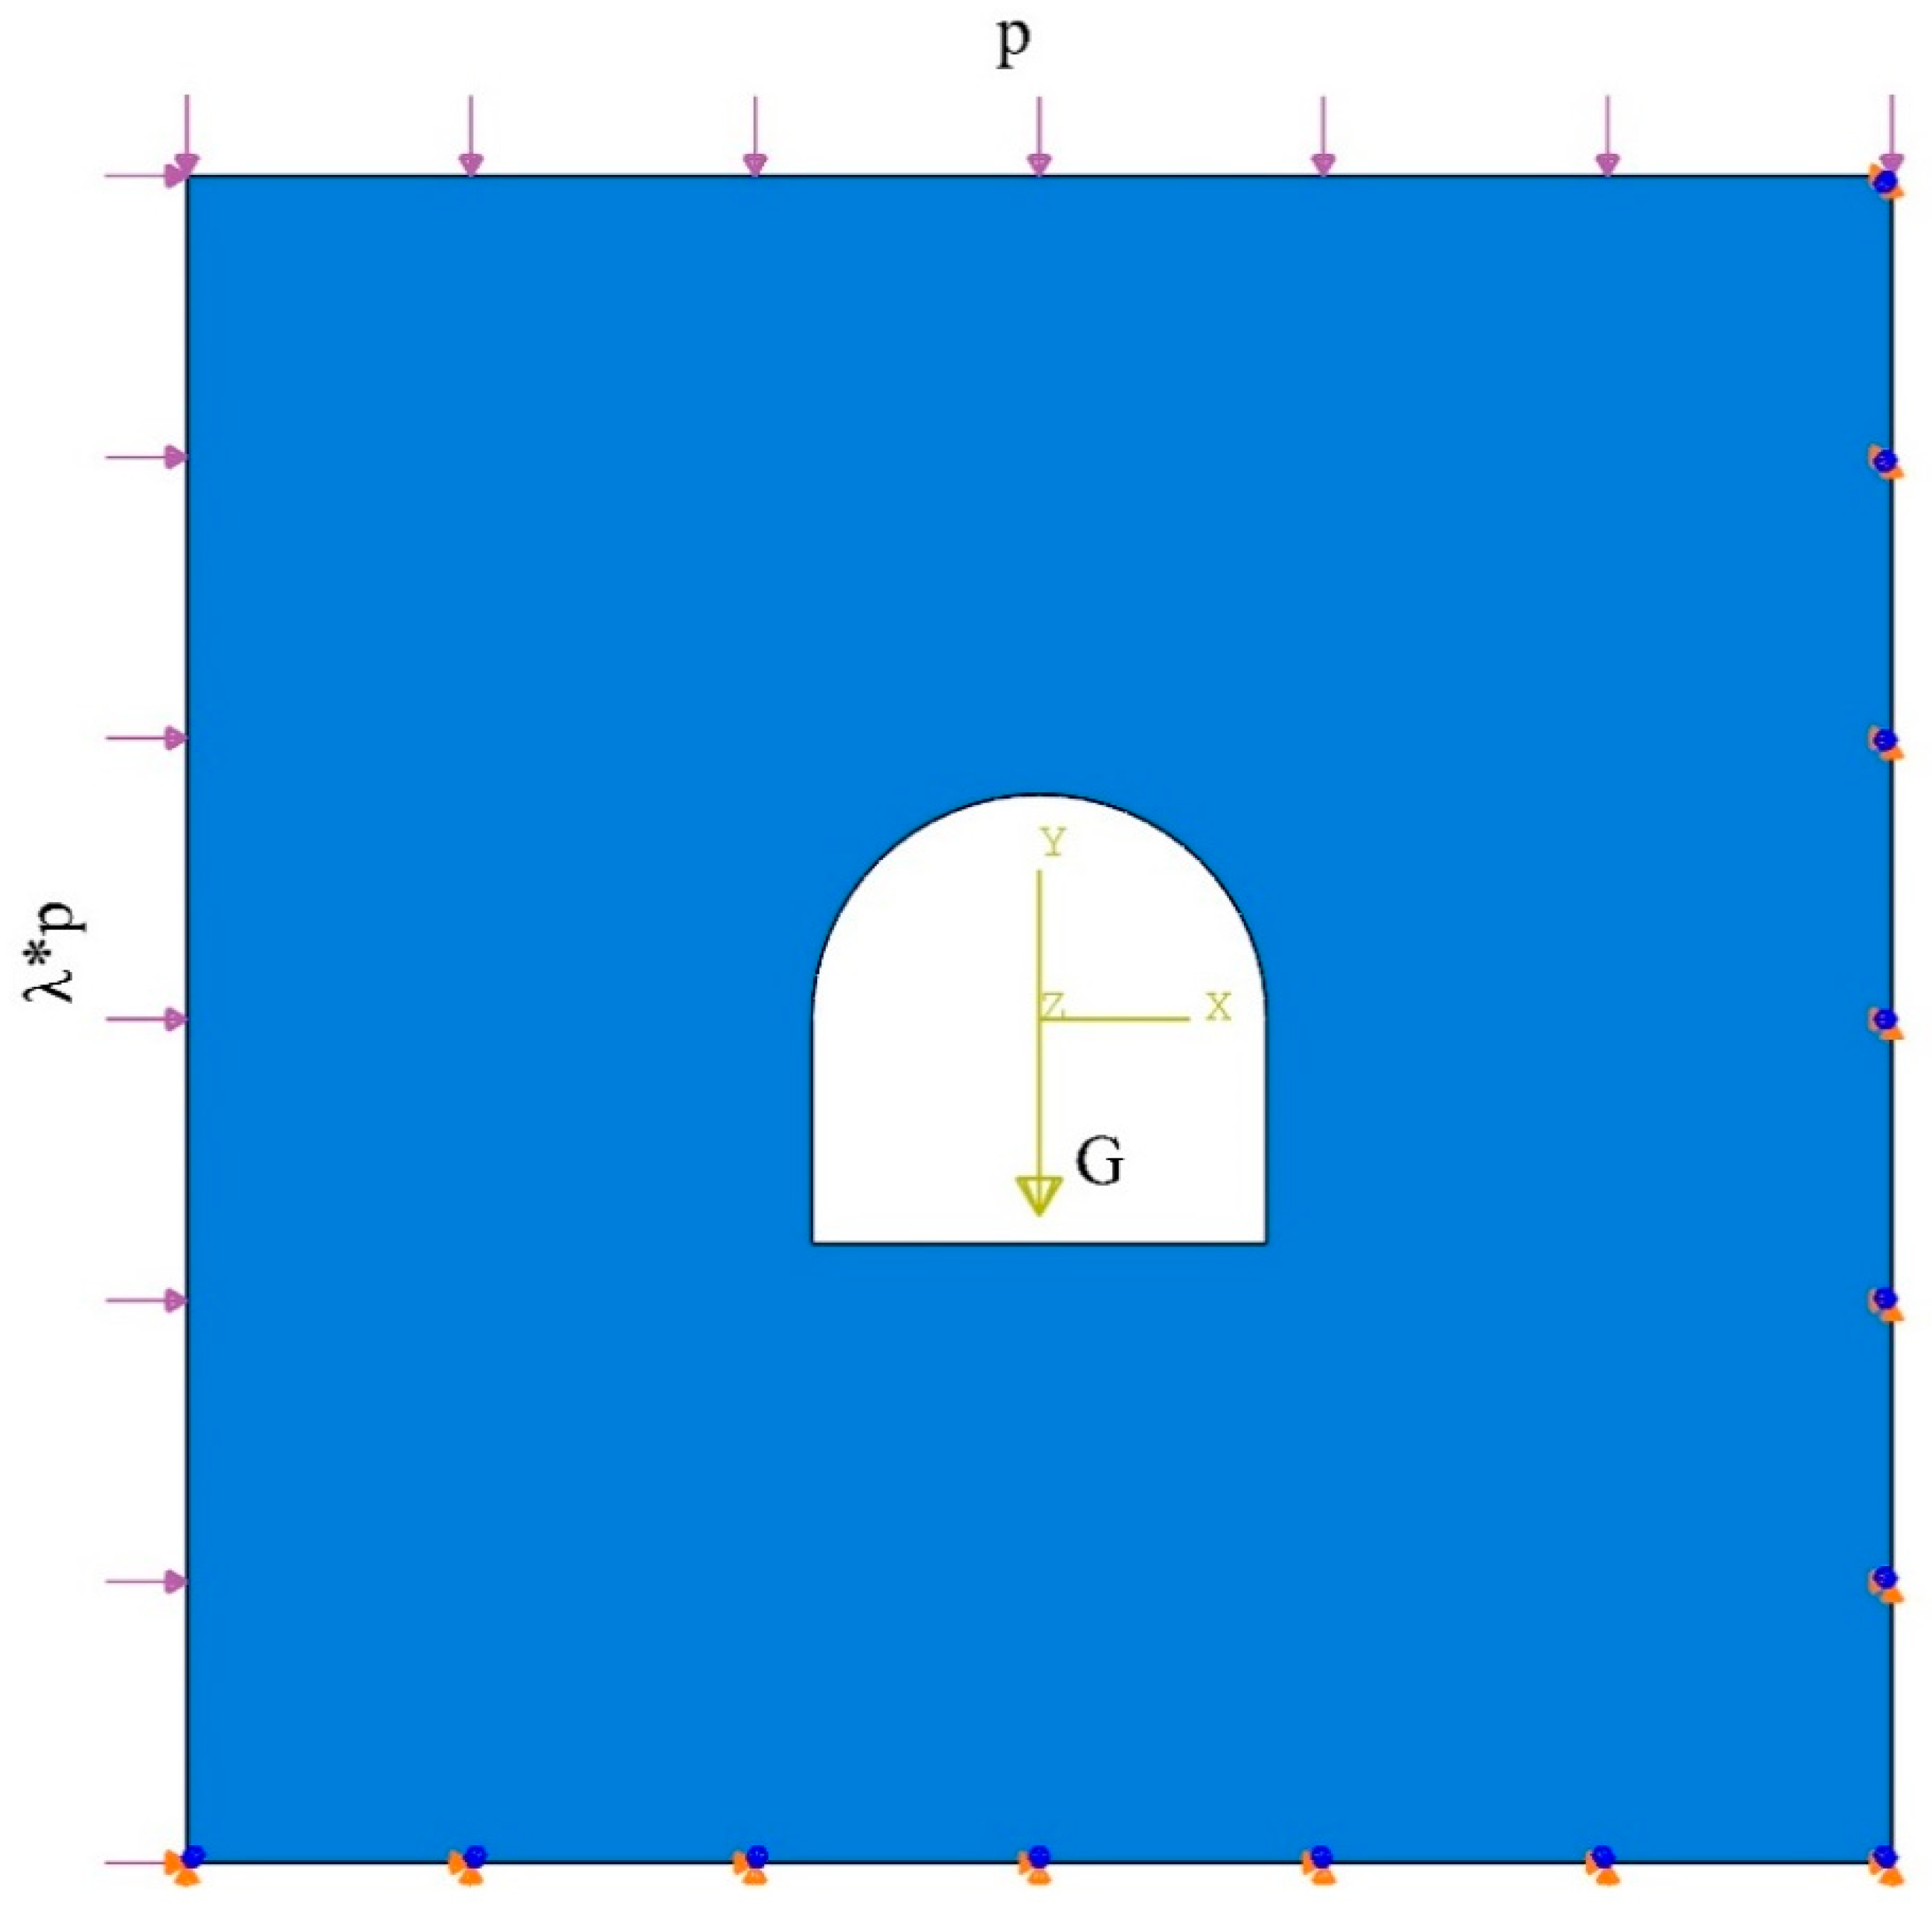
The lower part of the tunnel is a 2 × 4 m rectangle, and the upper part is a semicircle with a radius of 2 m. These two parts are the overall composition of the tunnel, which is modelled using ABAQUS. The volume modulus of the surrounding rock of the tunnel is 10.52 GPa, the shear modulus is 4.69 GPa, and the density is 2846 kg/m3 [12]. Because of the inhomogeneity of the surrounding rock distribution, the mean cohesive force is 1.81 MPa, and its standard deviation is 0.55 MPa. The mean friction angle is 26.6°, and its standard deviation is 4.5 °. All random variables are assumed to follow a normal distribution. The surrounding rock of the tunnel is considered to have nine parts, as shown in Figure 1. Parts 8 and 9 are 0.5 × 2.5 m rectangles. Parts 1, 2, 6, and 7 are 1 × 0.5 m rectangles. Parts 3, 4, and 5 are arcs with an inner diameter of 2 m and outer diameter of 2.5 m.
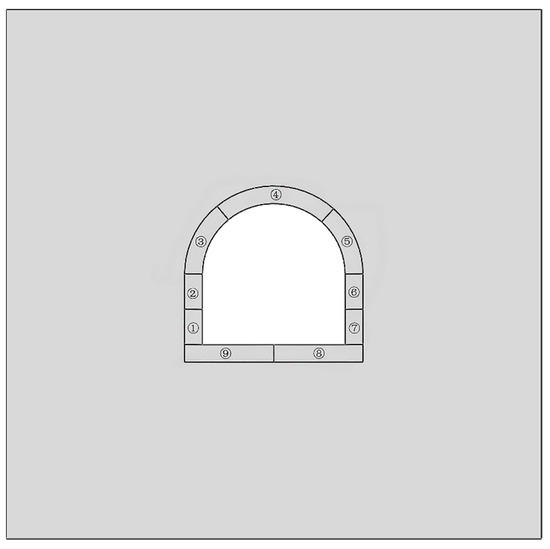
Figure 1.
Different parts of the tunnel system.
The upper boundary of the model is subject to a mean pressure of 20 MPa with a standard deviation of 4.13 MPa. The constitutive rock model is the ideal elastic brittleness model [12]. At the left boundary, the lateral pressure coefficients are 0.5, 1, and 2. Lateral pressure coefficients of 0.5, 1, and 2 are obtained based on previous research and engineering experience [21,23]. In tunnel engineering, the lateral pressure coefficients of 0.5, 1, and 2 are representative. The right and lower boundaries are fixed, as shown in Figure 2 [15].

Figure 2.
Tunnel boundary conditions.
This paper considers the reliability of the tunnel’s shear capacity. The Mohr–Coulomb criterion is used as the shear strength criterion. The performance function of the structure is as follows:
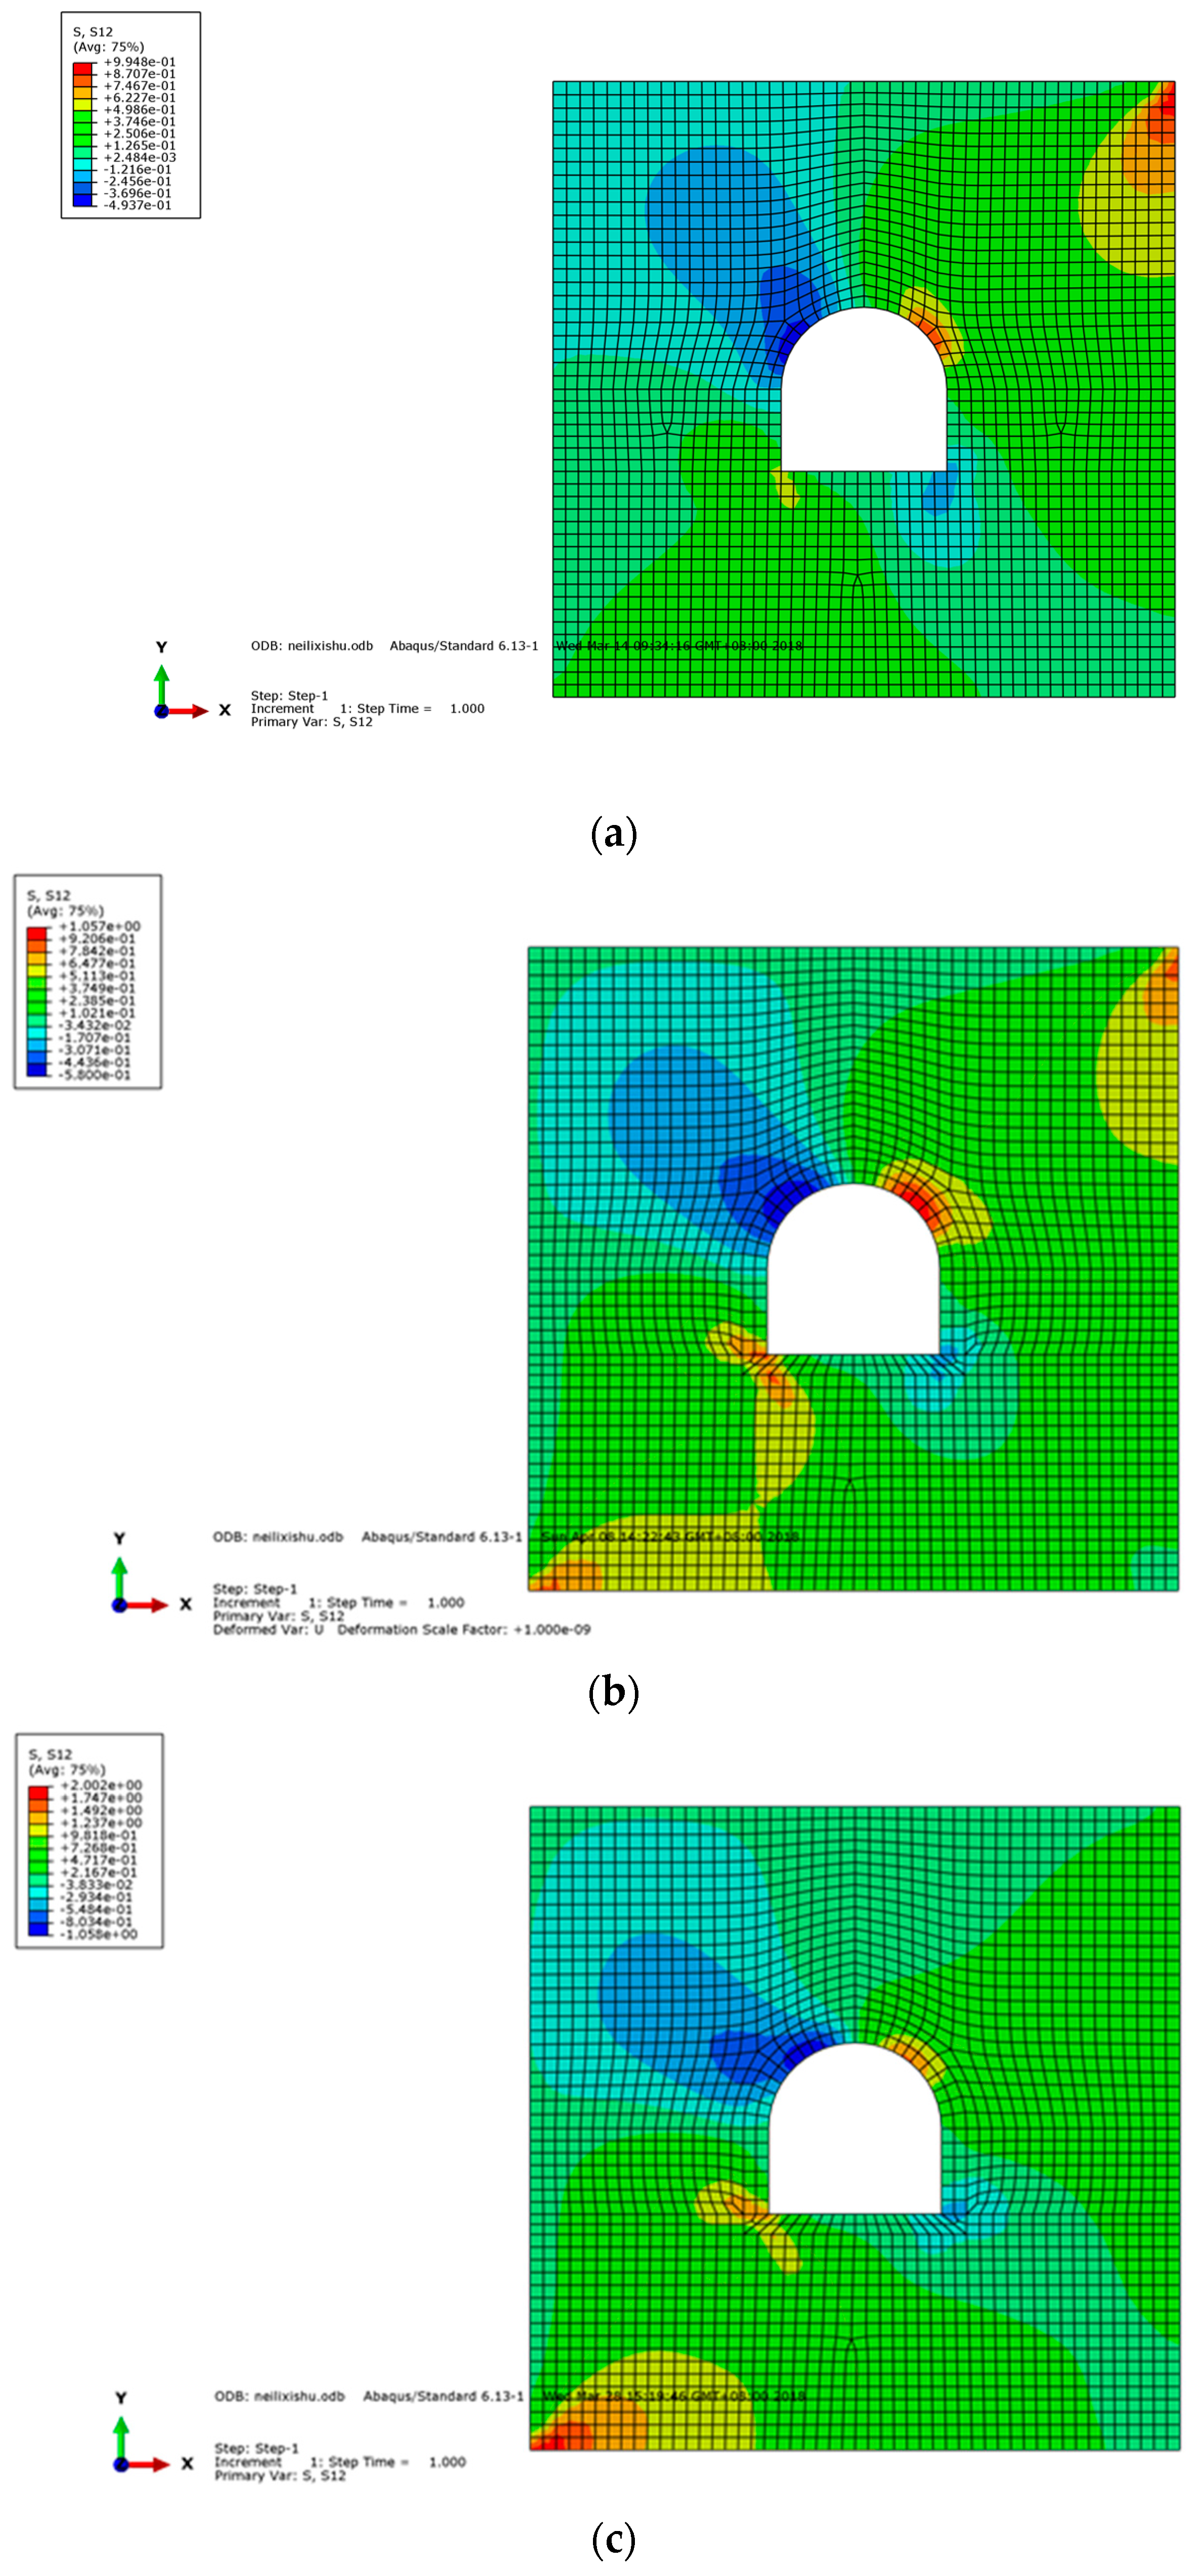
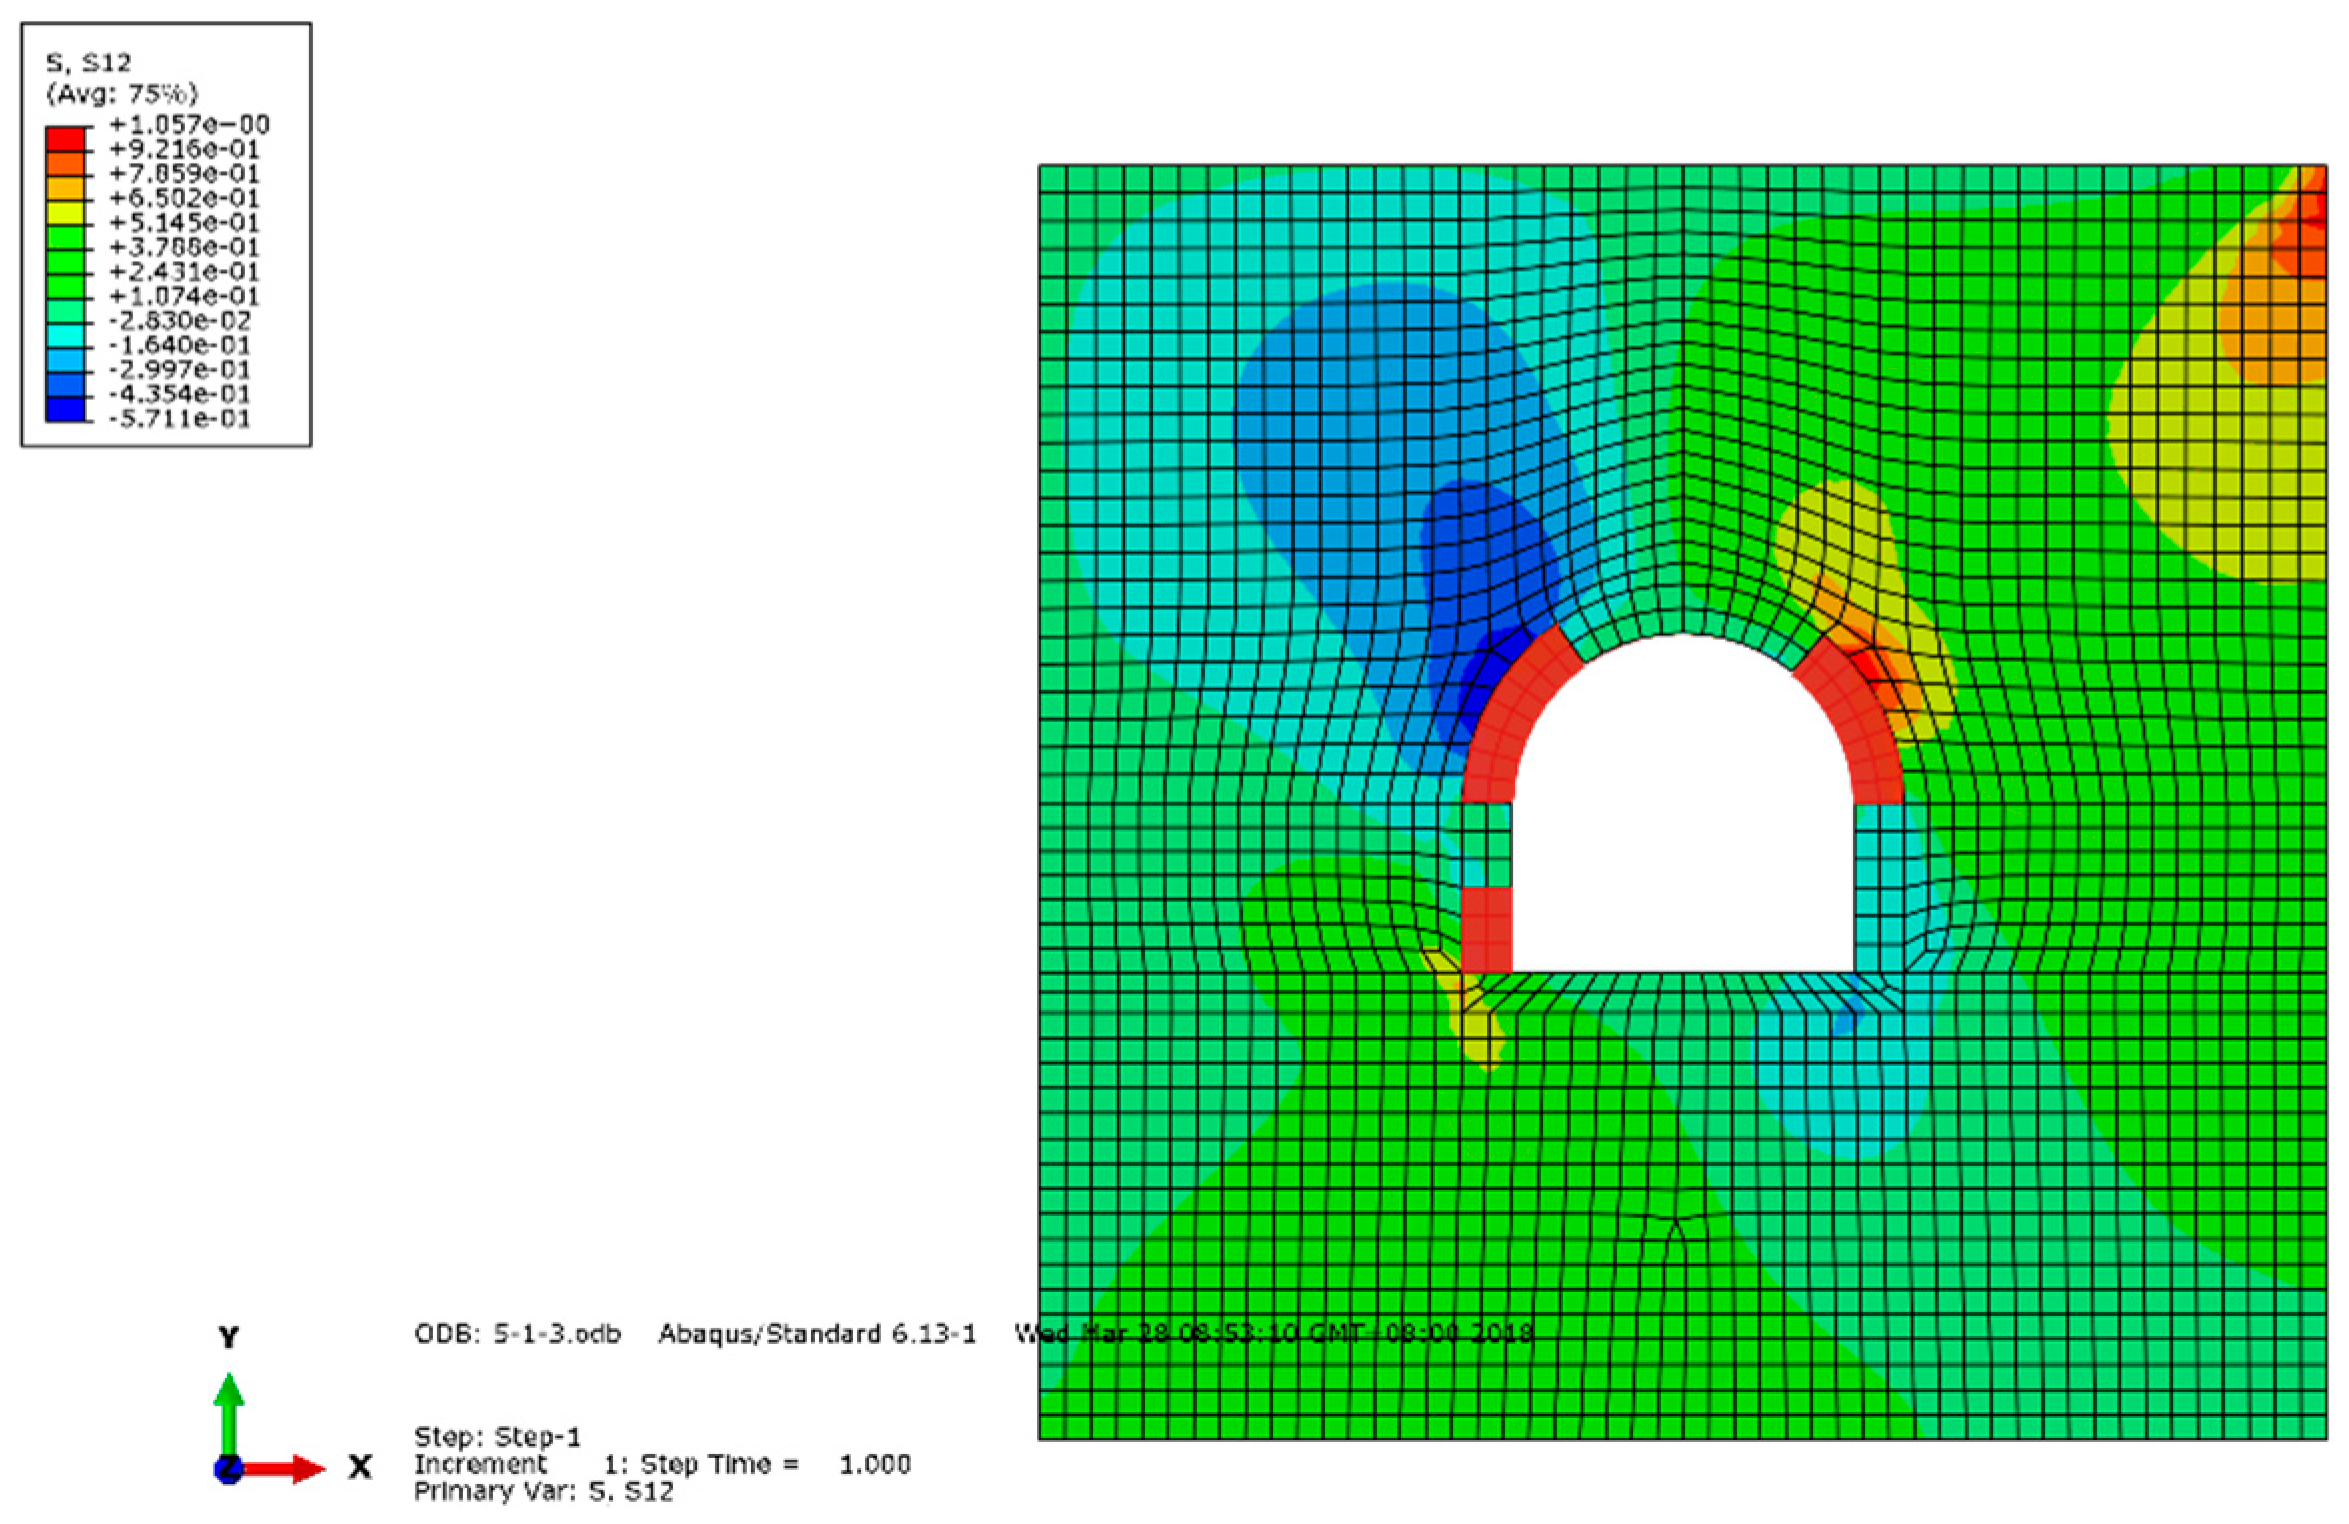
where is the performance function, is the positive pressure on the top of the rock, is the friction angle, is the cohesive force of the rock, is the shear coefficient of the different parts, and G is the gravity of the rock. The stress distribution state is shown in Figure 3a,b. The shear coefficient is listed in Table 1, which is obtained by the ratio of the initial vertical stress of the structure to the initial shear force, obtained using ABAQUS [26,33].

Figure 3.
Shear coefficient of the tunnel under different lateral pressure coefficients. (a) when λ = 0.5, (b) when λ = 1, (c) when λ = 2.

Table 1.
Initial shear coefficients of the tunnel under different lateral pressure coefficients.
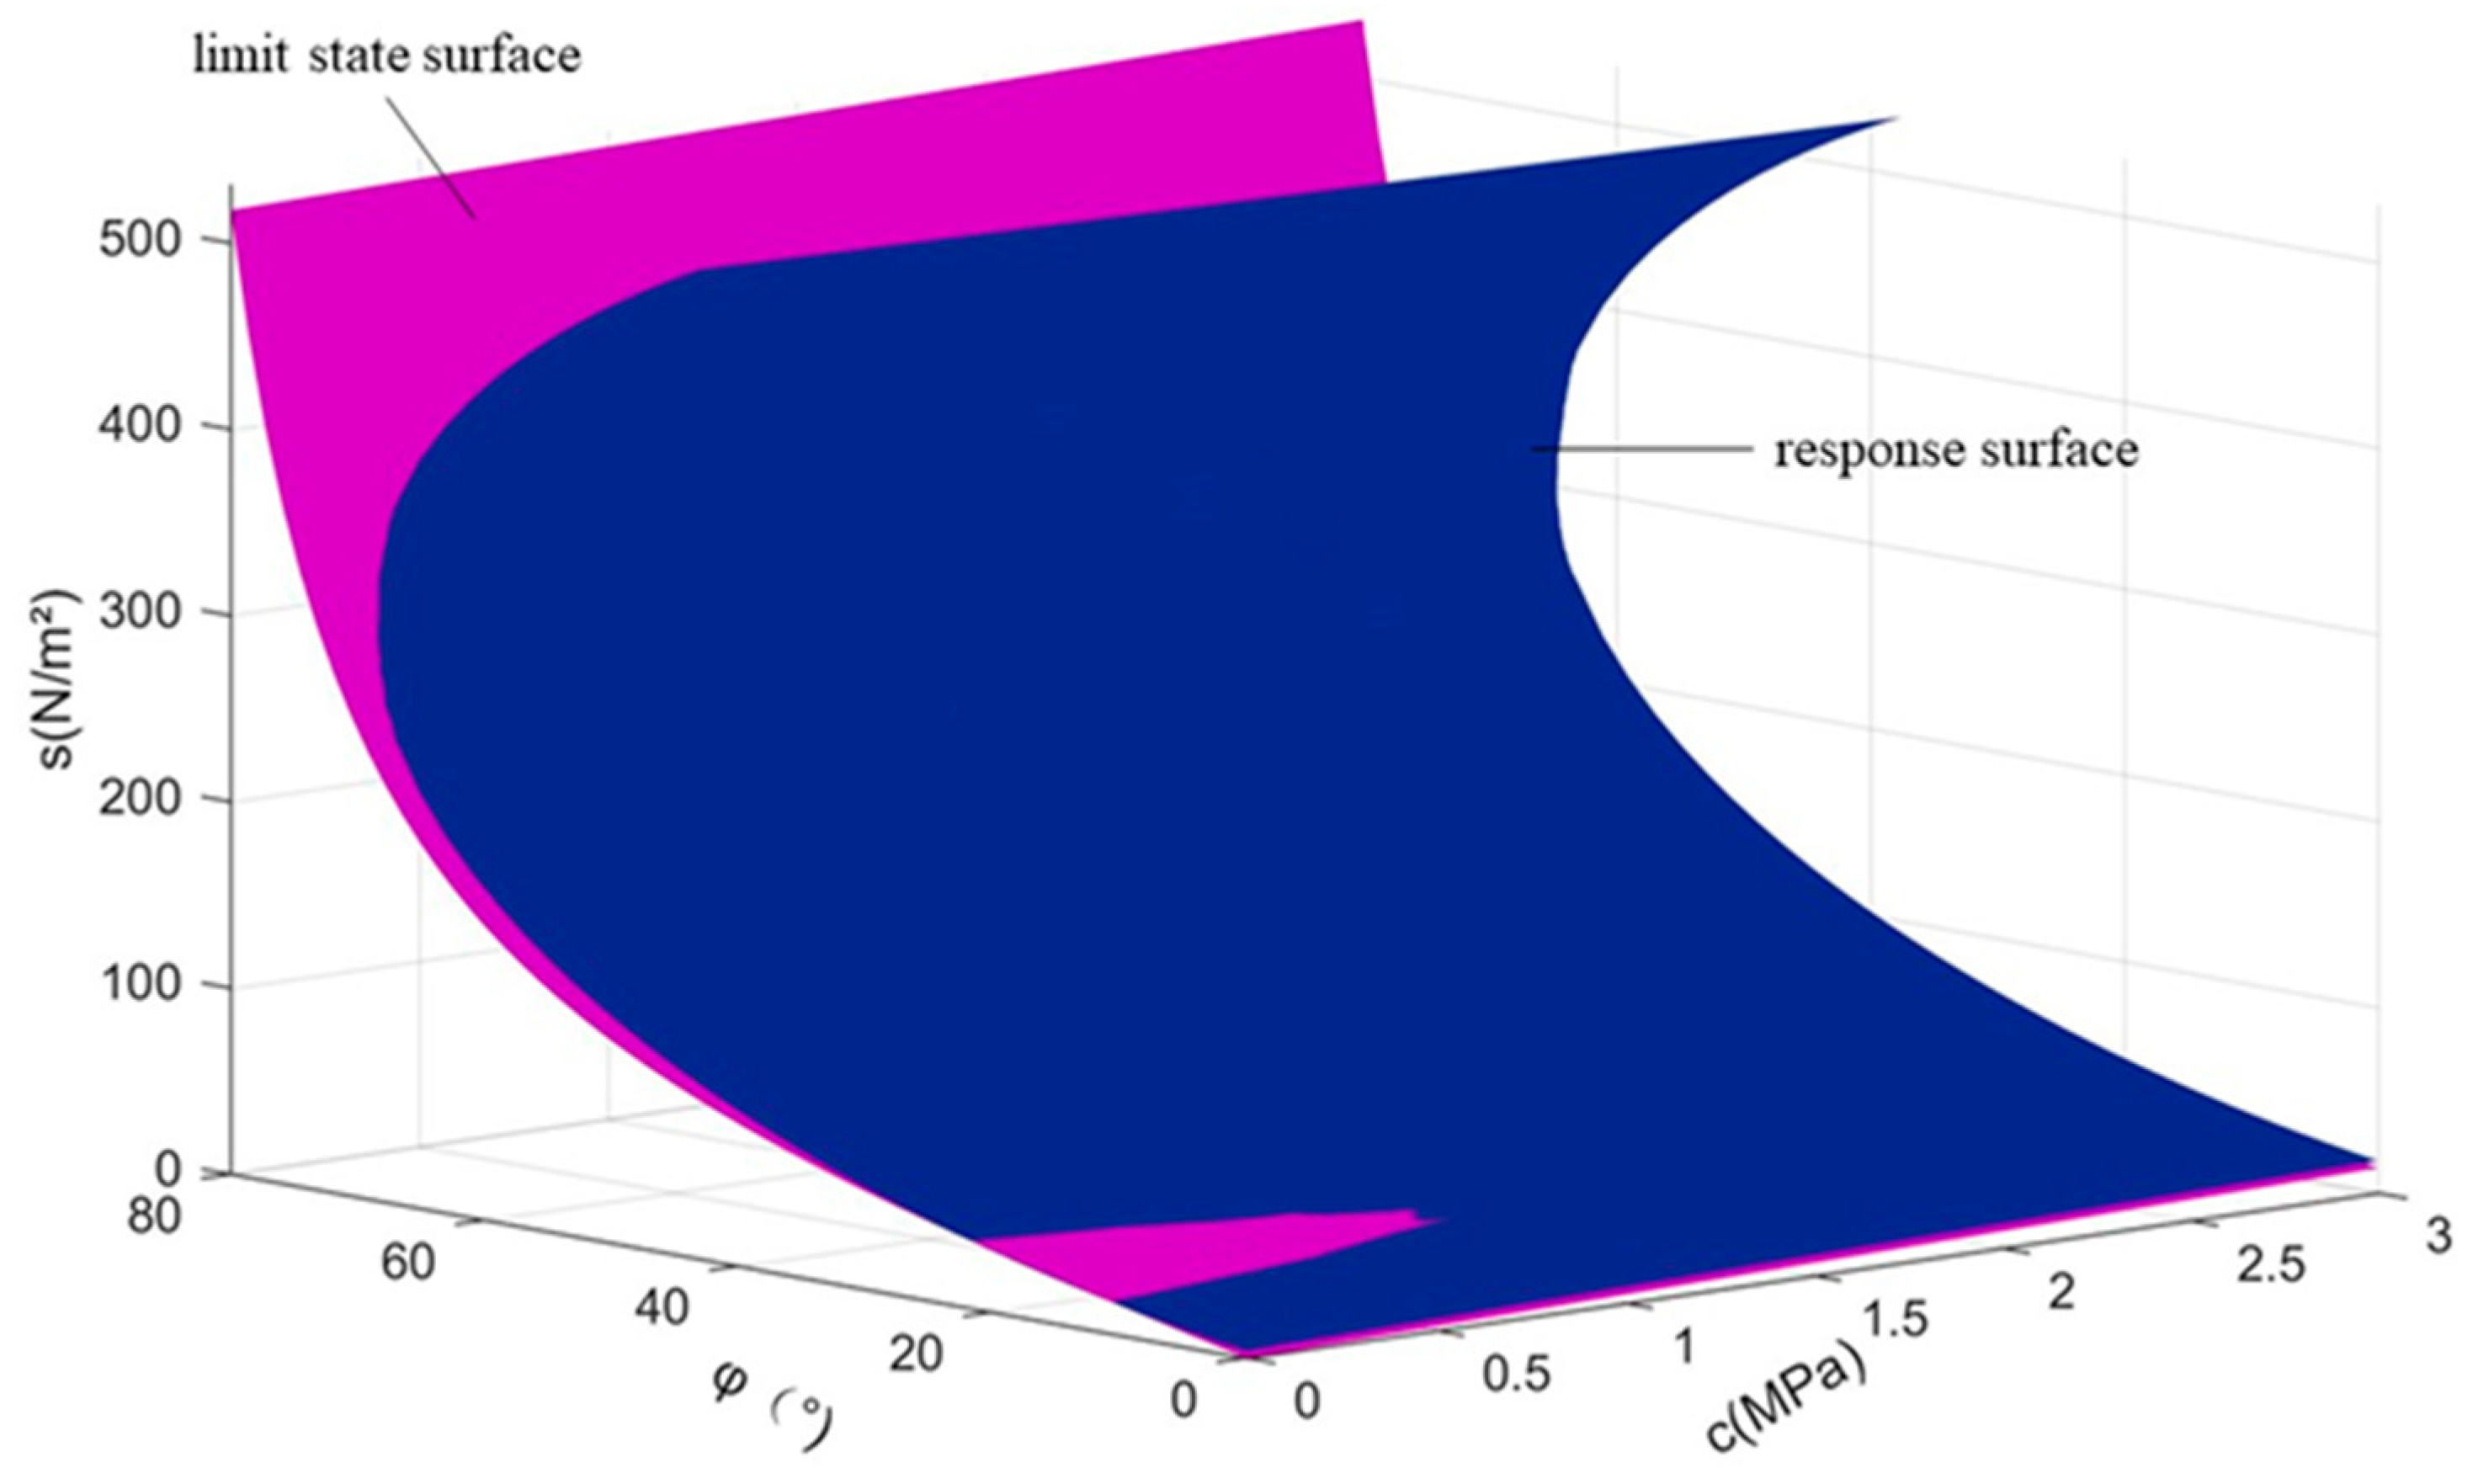
The original limit state surface is replaced by the approximate quadratic response surface. The response surface function is expressed as follows [34]:
where and are the undetermined coefficients. The mean value of each random variable is adopted as the initial design point. Seven sample points are selected according to , where is 3 for the first iteration and 1 for the subsequent iterations. When the error of two iterations is less than 10−4, the iteration is considered to be terminated. It is then possible to obtain the response surface function and to approximate the value of the verification point. The new center point is as follows [28]:
where is the value of the undetermined coefficient after iteration, is the mean value of the random variable, and is the value of the undetermined coefficient before iteration. The sample point within the new center point will include additional information about the original limit state surface. Then, the iterative response surface function is in the new range of the sample point until the response surface function reaches the accuracy requirement. Part 1, when , is taken as an example below. The undetermined coefficients of each term of the response surface function in the case of are summarized in Table 2. The response surface and original limit of the state surface for part 1 at are shown in Figure 4. It is then possible to analyze the structural reliability based on the response surface.
Table 2.
The undetermined coefficients of the response surface function when .

Figure 4.
Limit state surface of part 1 when .
3. Analysis of the Tunnel Failure Process
Because of the various stress distributions in the tunnel system, the different parts have unique failure probabilities. The parts with a high failure probability can be regarded as major failure parts, and those with a low failure probability are secondary failure parts. The failure process consisting of the major failure parts is the main failure mode. To reduce unnecessary calculations and omit the secondary failure mode in advance, the β-unzipping method can be used to specify the major failure parts of the main failure mode. The reliability of the major failure parts is defined as follows:
where is the minimum value of reliability. The number of unnecessary calculations will increase if the threshold is too high. Conversely, certain main failure modes will be neglected. Scholars have posited that = 3 in the initial failure process, and has a value of 1 in the subsequent processes [35]. However, this method does not fully consider the change in failure probability during the failure process. This paper adopts the adaptive boundary method for regulating the threshold and terminates the failure process when . The benchmark failure probability is as follows [36]:
where is the maximum value of the failure probability of all parts and is the minimum value of the failure probability of all parts.
Among the variables:
where is the mean failure probability of all of the parts. The threshold can be obtained based on the failure probability.
where is the benchmark failure probability.
The adaptive boundary condition is as follows:
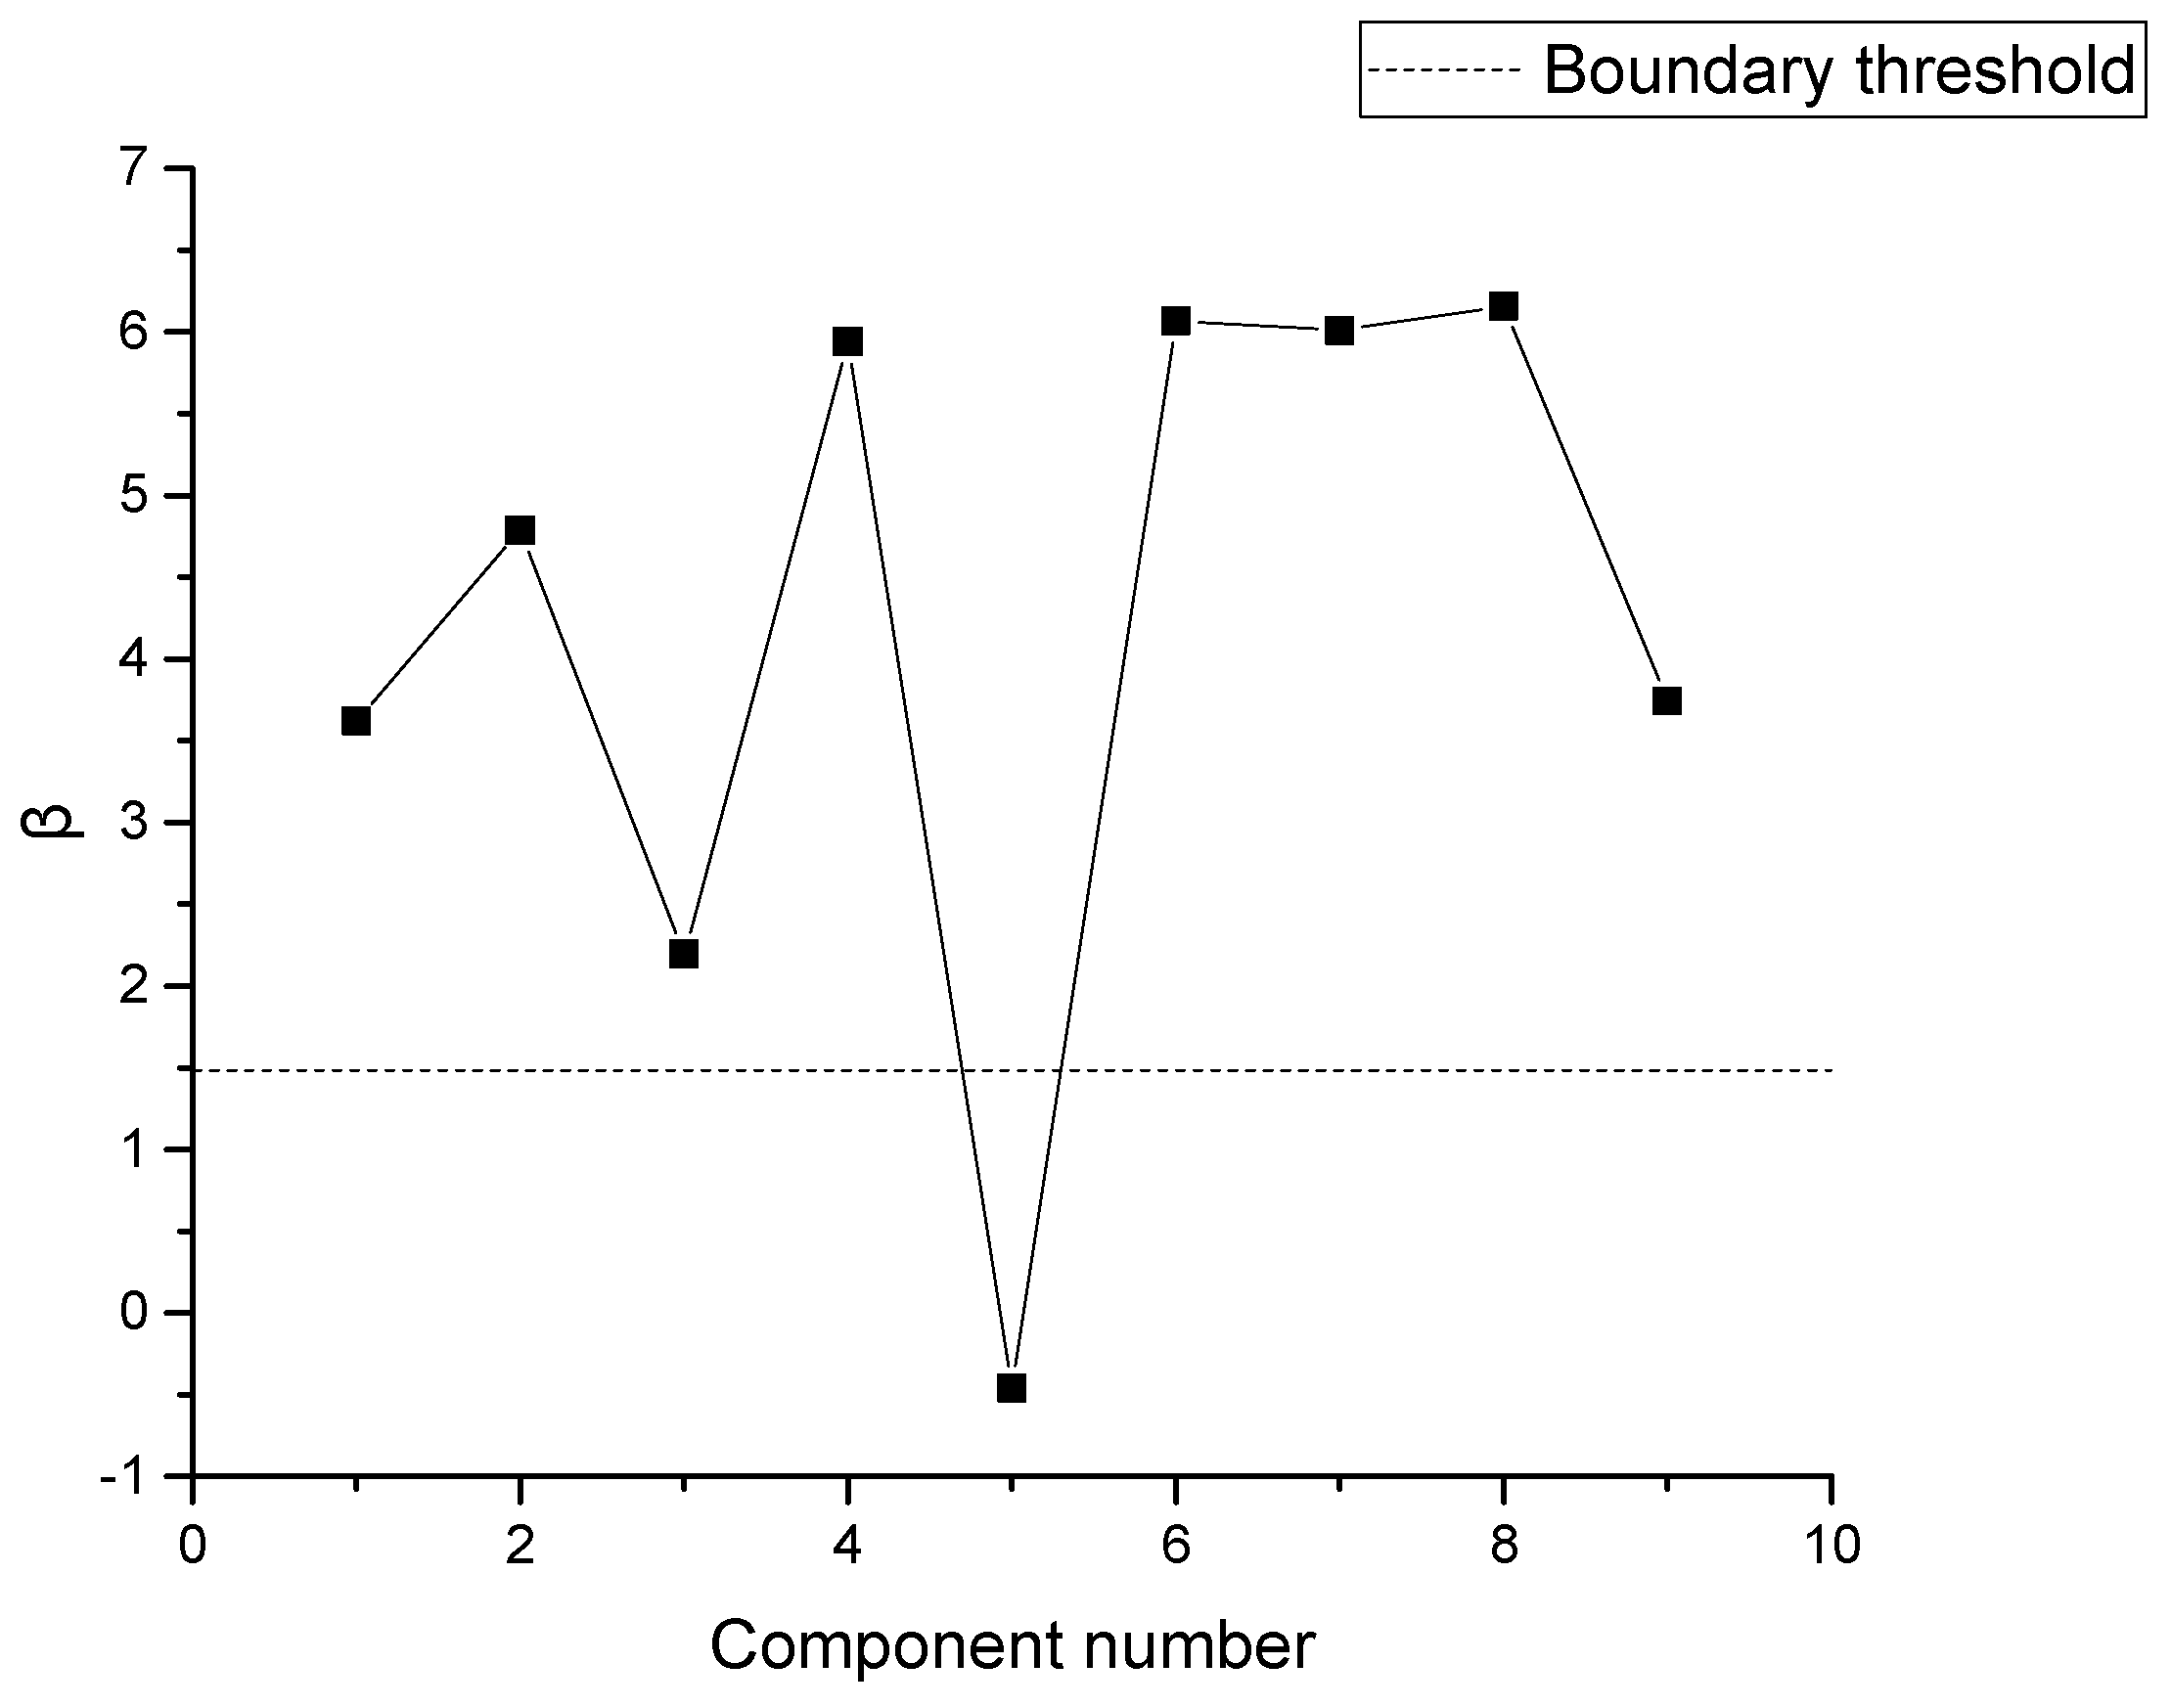
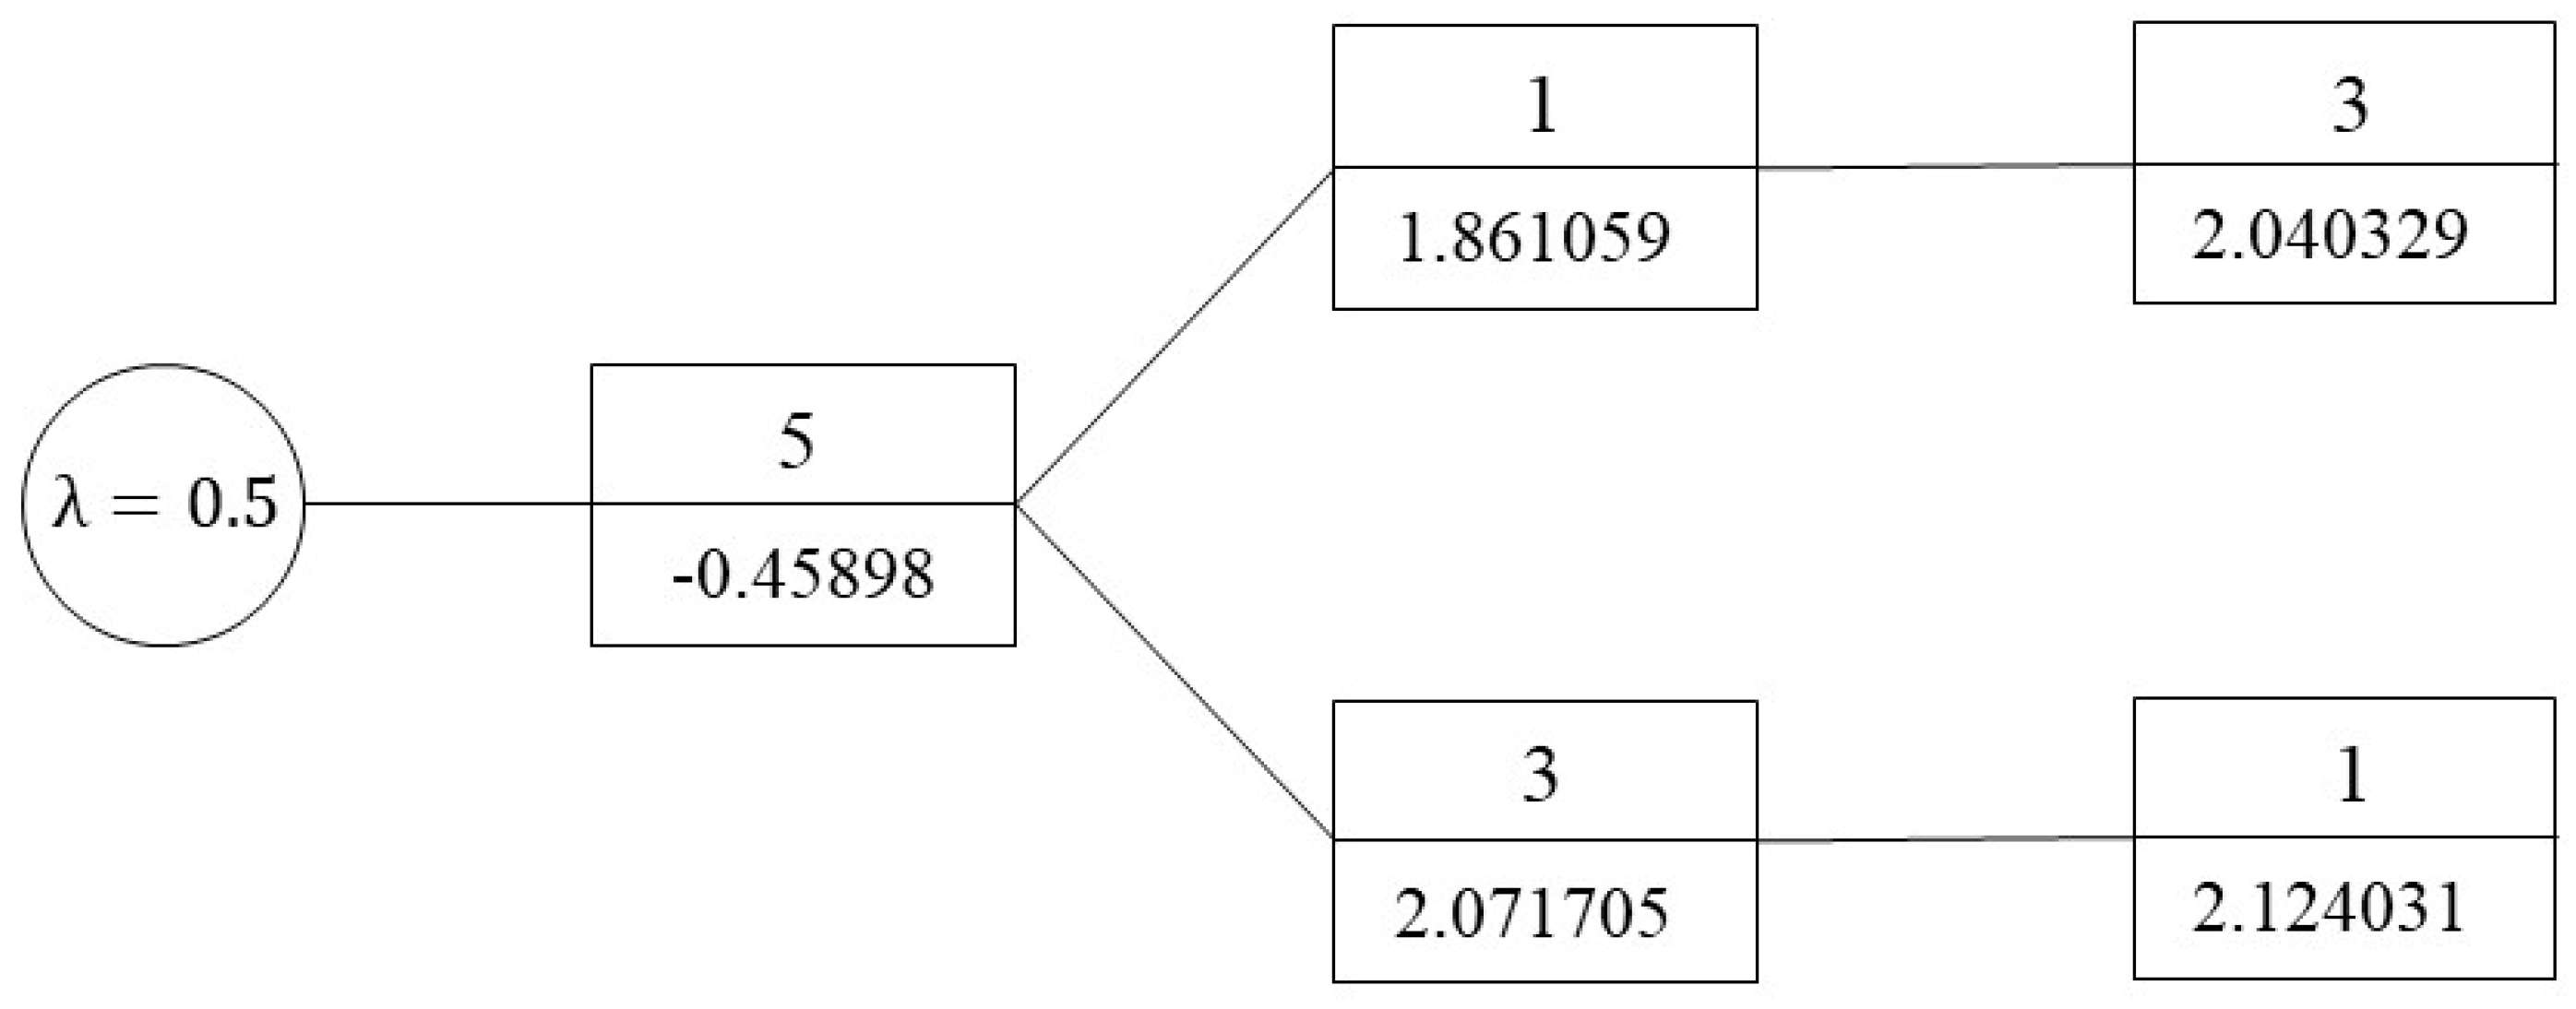
Consider the intact state of the structure as the first stage of the failure process. When λ = 0.5, the reliability index at the first stage of the failure process is shown in Figure 5 (each reliability index is calculated using the JC method [34]). JC method, also known as design point method, is a method to convert non-normal distribution random variables into corresponding normal distribution solutions. The JC method takes the linearization point of the function as the design checking point, thereby increasing the accuracy of calculating β and ensuring the uniqueness of β.
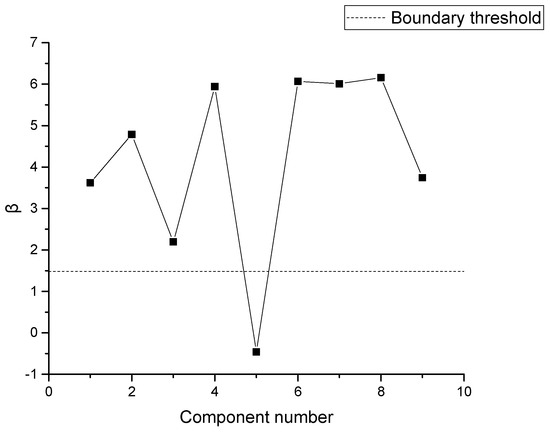
Figure 5.
Reliability index in at the first stage of the failure process.
Figure 5 shows that part 5 is the main failure part at the first stage of the failure process. After part 5 fails, the failure process enters the second stage. The tunnel will produce a new shear coefficient and response surface function as a result of the stress redistribution. The shear coefficient and undetermined coefficients of the response surface function at the second stage are listed in Table 3.
Table 3.
Shear coefficient and undetermined coefficients of the response surface function at the second stage.
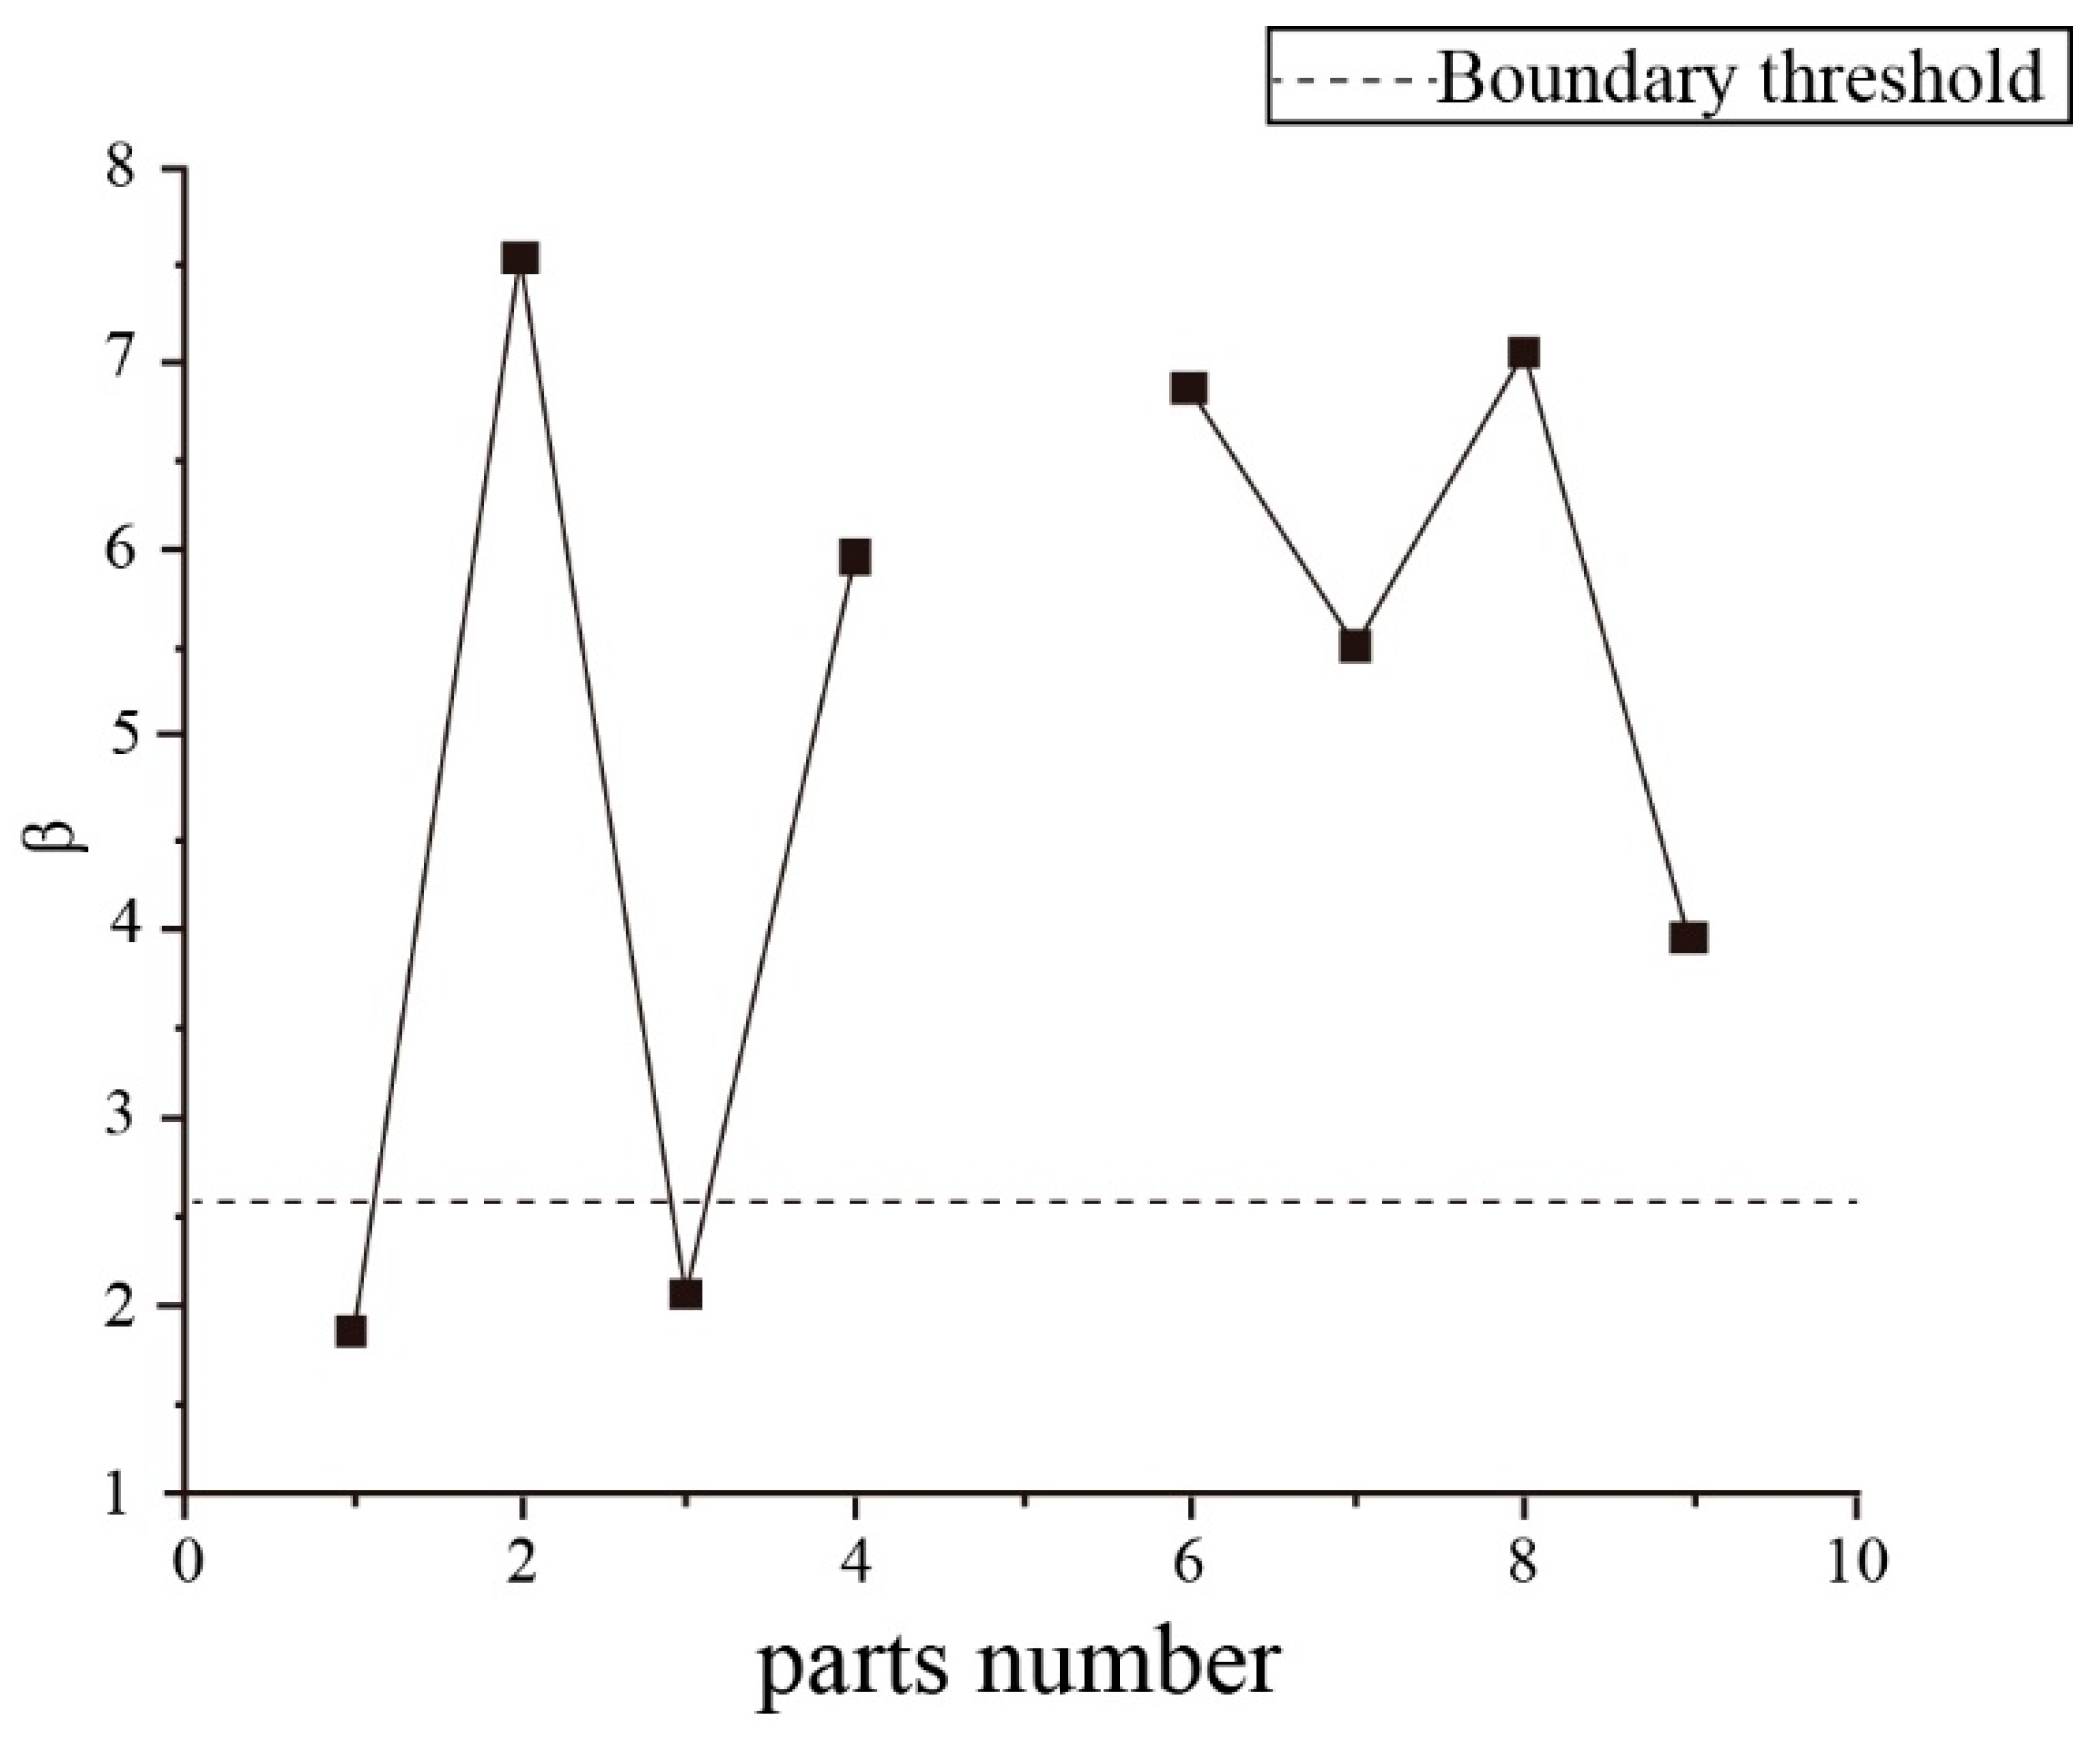
For the second stage of the failure history, the reliability index of each tunnel part is shown in Figure 6.
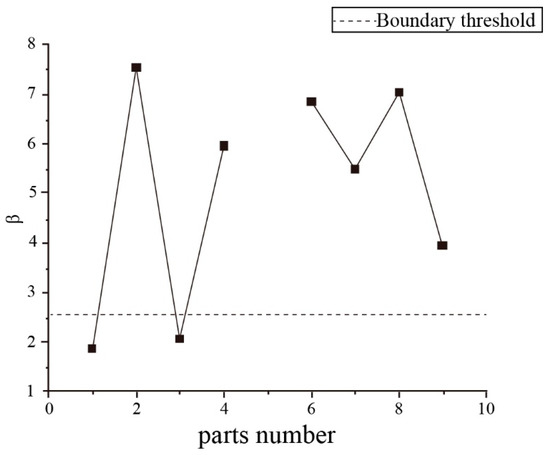
Figure 6.
Reliability index at the second stage of the failure process.
Figure 6 reveals that because of the failure of part 5, parts 1 and 3 become the new major failure parts. After the partial failure of the structure, the reliability of some parts may increase. This is because the stress redistribution will occur after the local failure of the structure, which may result in the stress of some parts being less than the previous state. At the third stage of the failure process, the failure path exhibits two branches. The reliability index of the different failure paths at the third stage is shown in Figure 7a,b.
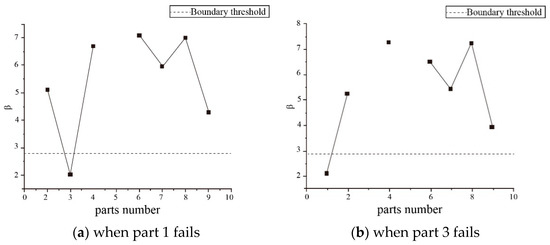
Figure 7.
Reliability index at the third stage of the failure process.
At the fourth stage of the failure process, the reliability indices of all of the tunnel parts are larger than three, and the failure process is terminated. The failure tree consisting of the main failure paths and the corresponding reliability indices are shown in Figure 8.
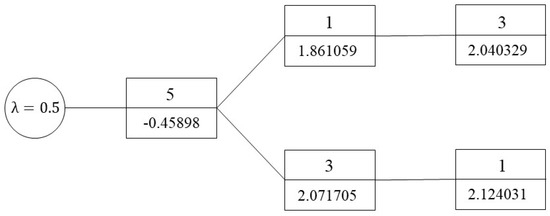
Figure 8.
The failure tree and corresponding reliability indices when .
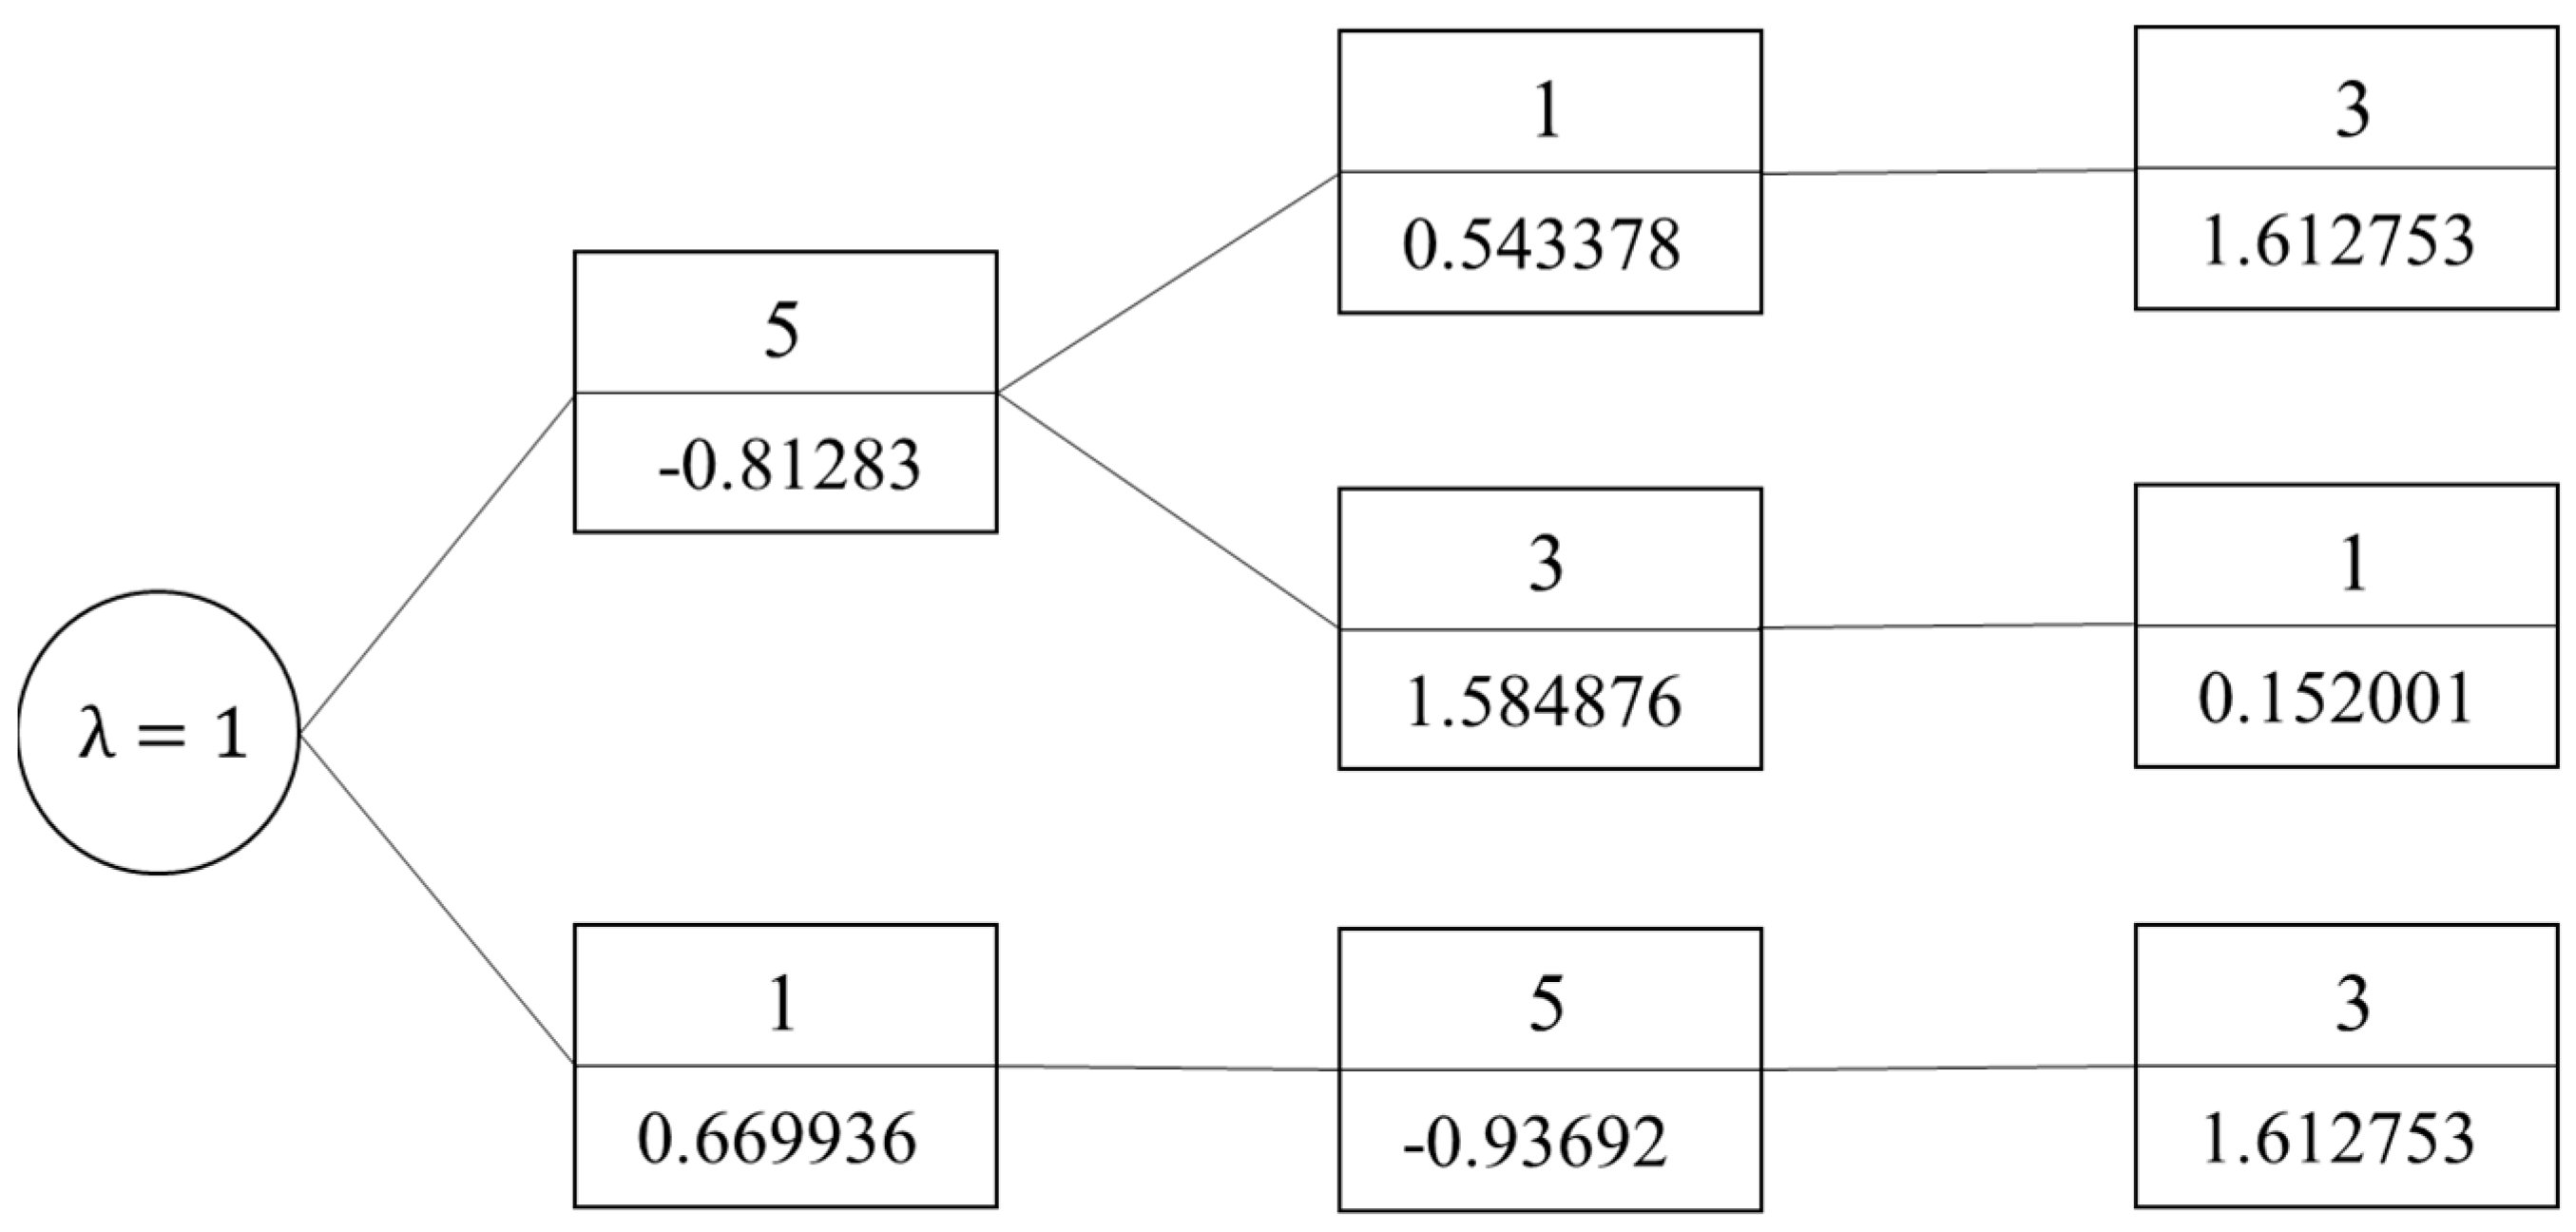
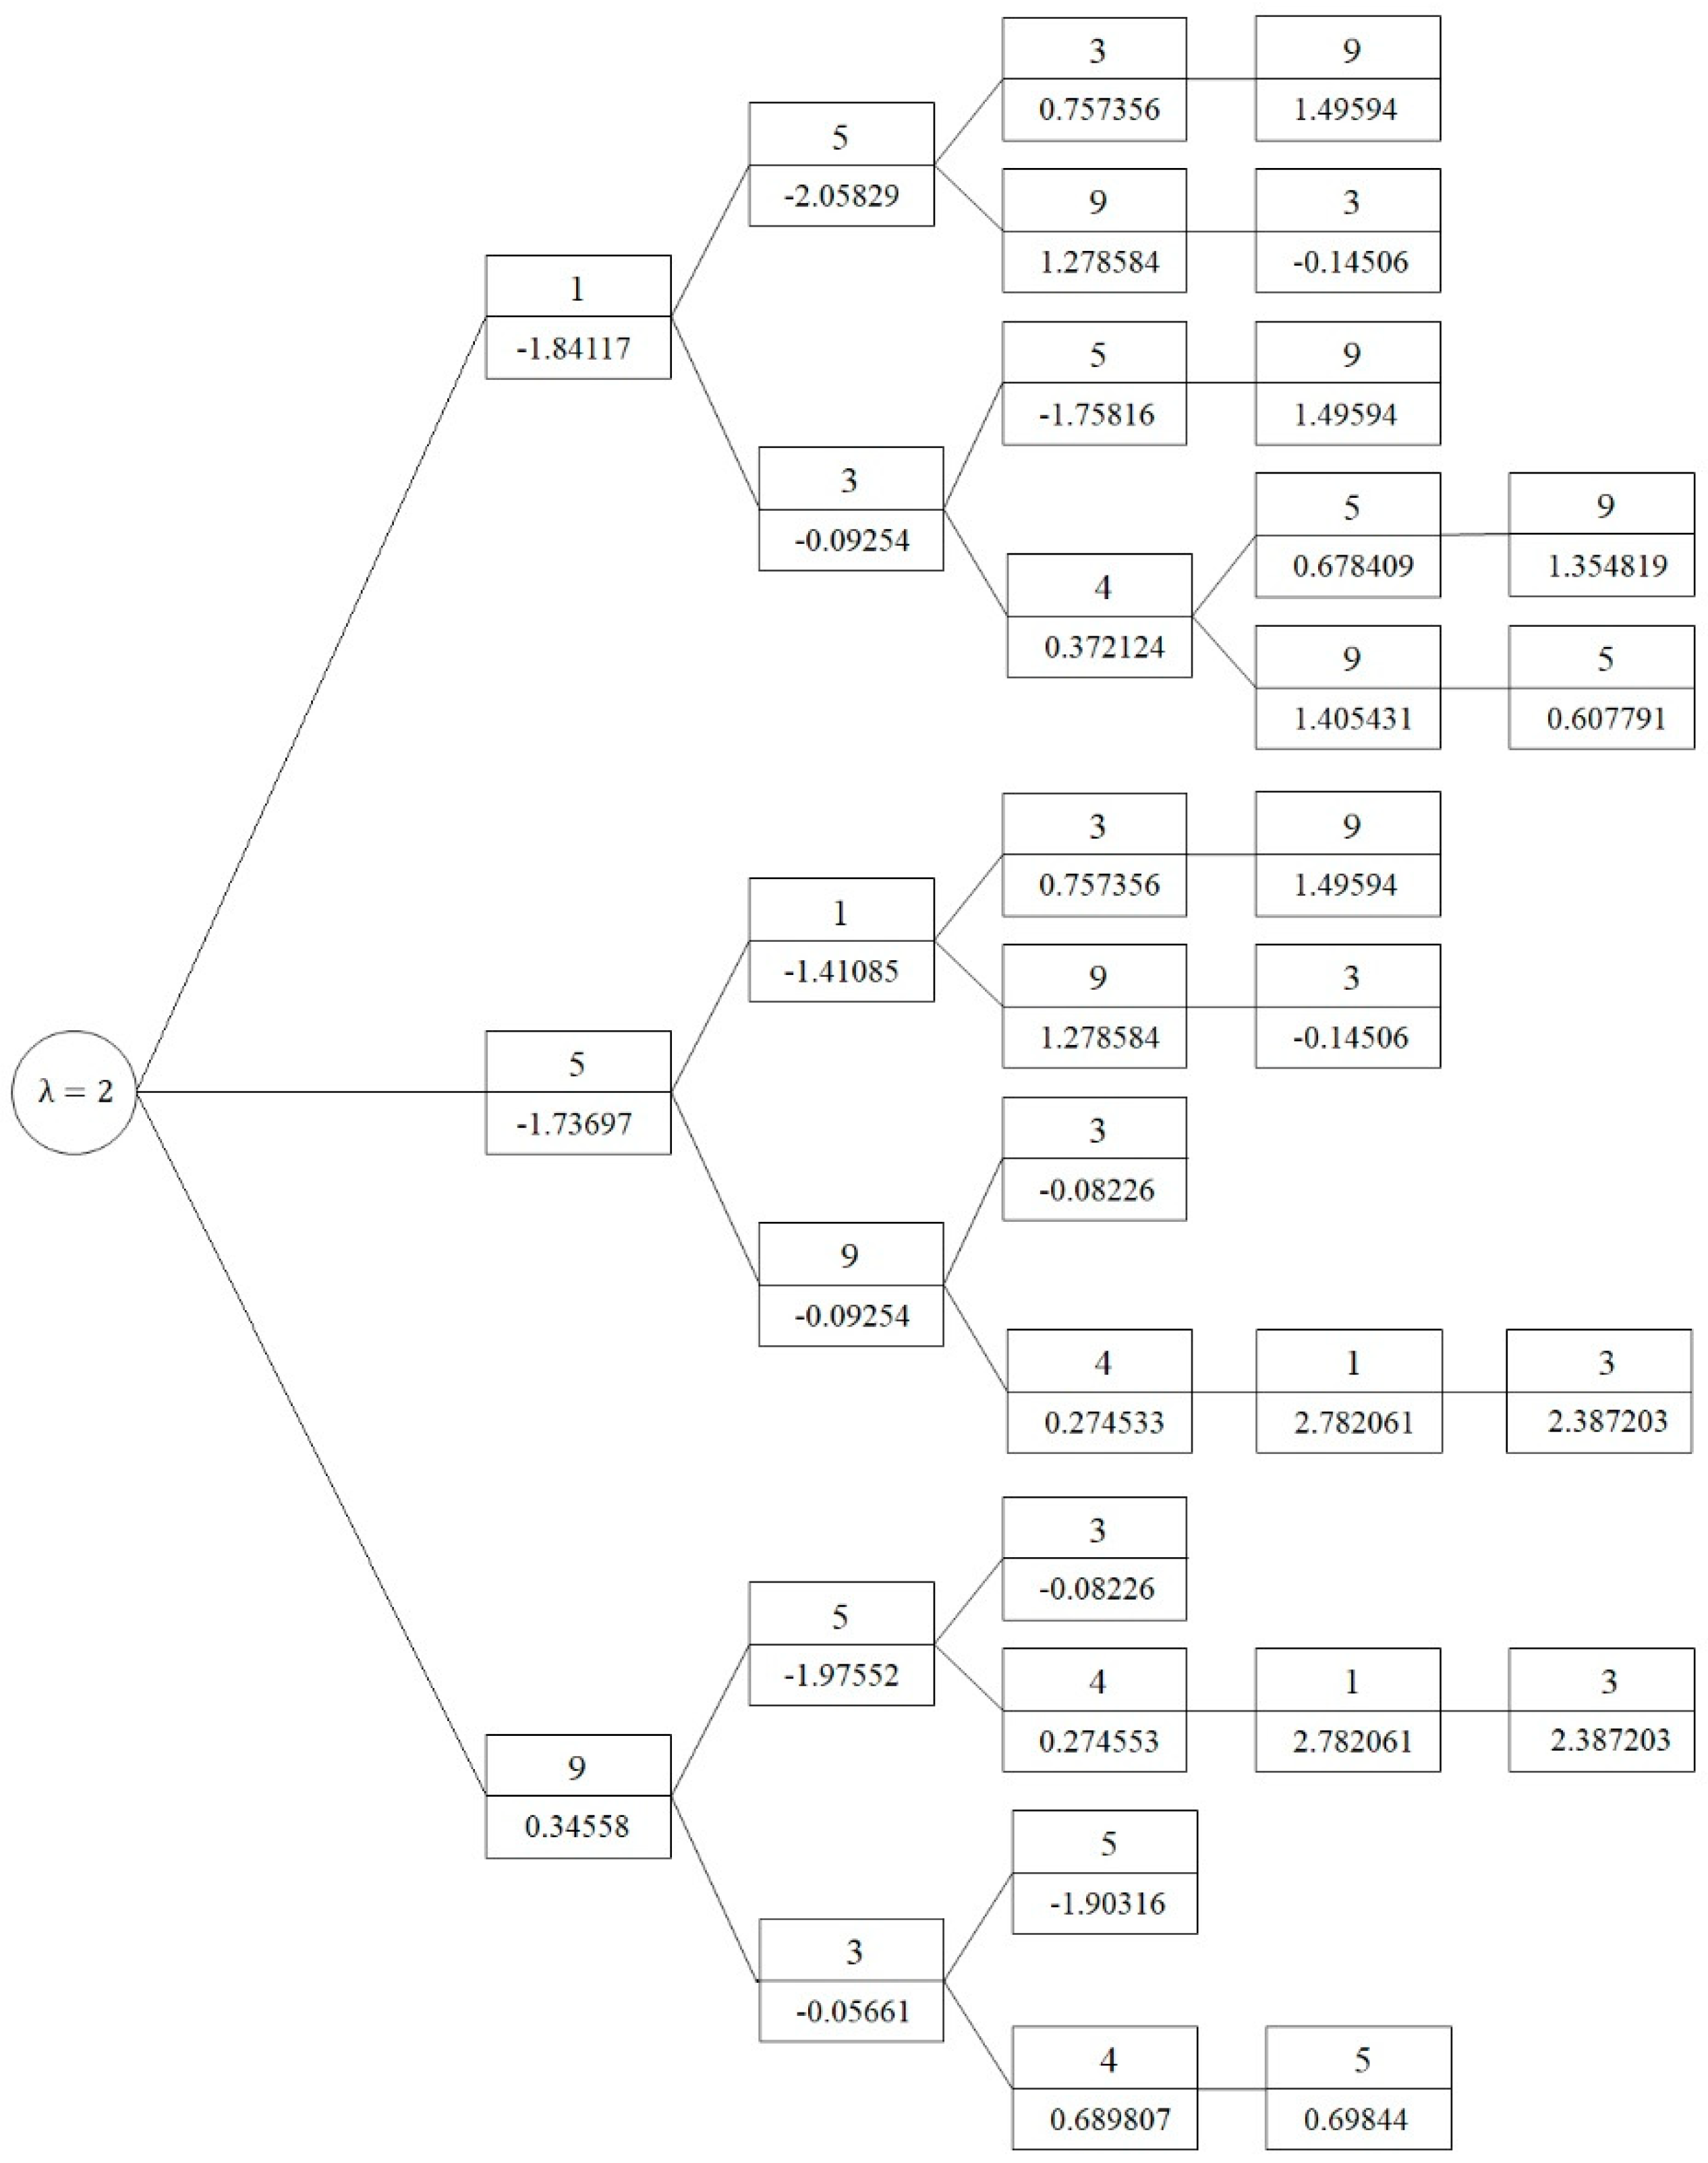
The upper part of the box is the failure part of the structure, and the lower part is the reliability index of the failure part. Similarly, the failure tree and corresponding reliability indices when and are shown in Figure 9 and Figure 10, respectively.

Figure 9.
The failure tree and corresponding reliability indices when .
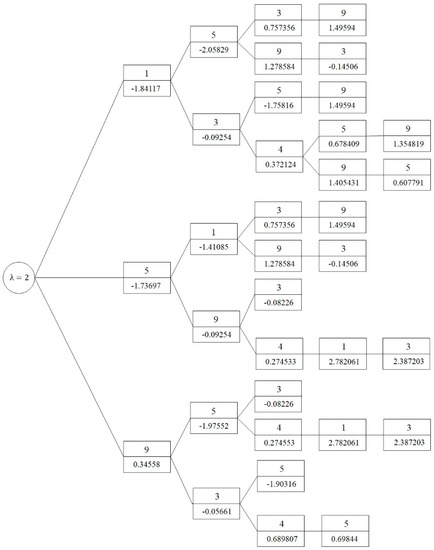
Figure 10.
The failure tree and corresponding reliability indices when .
4. Tunnel System Reliability Analysis
After each stage of the failure process, the structure exhibits a final state, thus forming a complete failure path. The probability of each failure path is as follows:
where represents the different failure stages along a failure path. Any path will cause tunnel system failure. Therefore, the failure probability of the tunnel system is as follows:
If the failure paths are completely related, the system failure probability will be the following:
If the failure paths are completely independent, the system failure probability is as follows:
If the failure paths are completely related, then their correlation coefficient is 1. If the failure paths are completely independent, then their correlation coefficient is 0. In most cases, the failure paths are neither completely related nor completely independent. Hence, the system failure probability is as follows:
Estimating the failure probability with two extreme states may result in an error. Therefore, this paper uses the probabilistic network evaluation technique (PNET) to replace the different failure paths with several representative paths [34]. These representative paths are selected using the following criteria. First, we consider the failure paths above a certain correlation as highly related paths, and assign these highly related paths to a group, and the random variables are regarded as independent of each other. Second, we use the path with the highest failure probability in the group as the representative path. We adopt this path to represent the failure probability of all paths in the group. The representative paths in the different groups are independent, and the highly related threshold is usually set as 0.8 [37,38]. Paths with a correlation coefficient greater than 0.8 are highly related paths.
The correlation coefficient equation of the structure is as follows:
where is the performance function of the structure, and is the standard deviation of .
The covariance can be calculated using the following:
where is the expectation of . As the performance function in this paper is a nonlinear function, this paper expands the performance function at design point and retains the linear factor of the function. We obtain the following:
Among the variables:
where is a random variable, and the correlation coefficient between the different failure paths can be calculated.
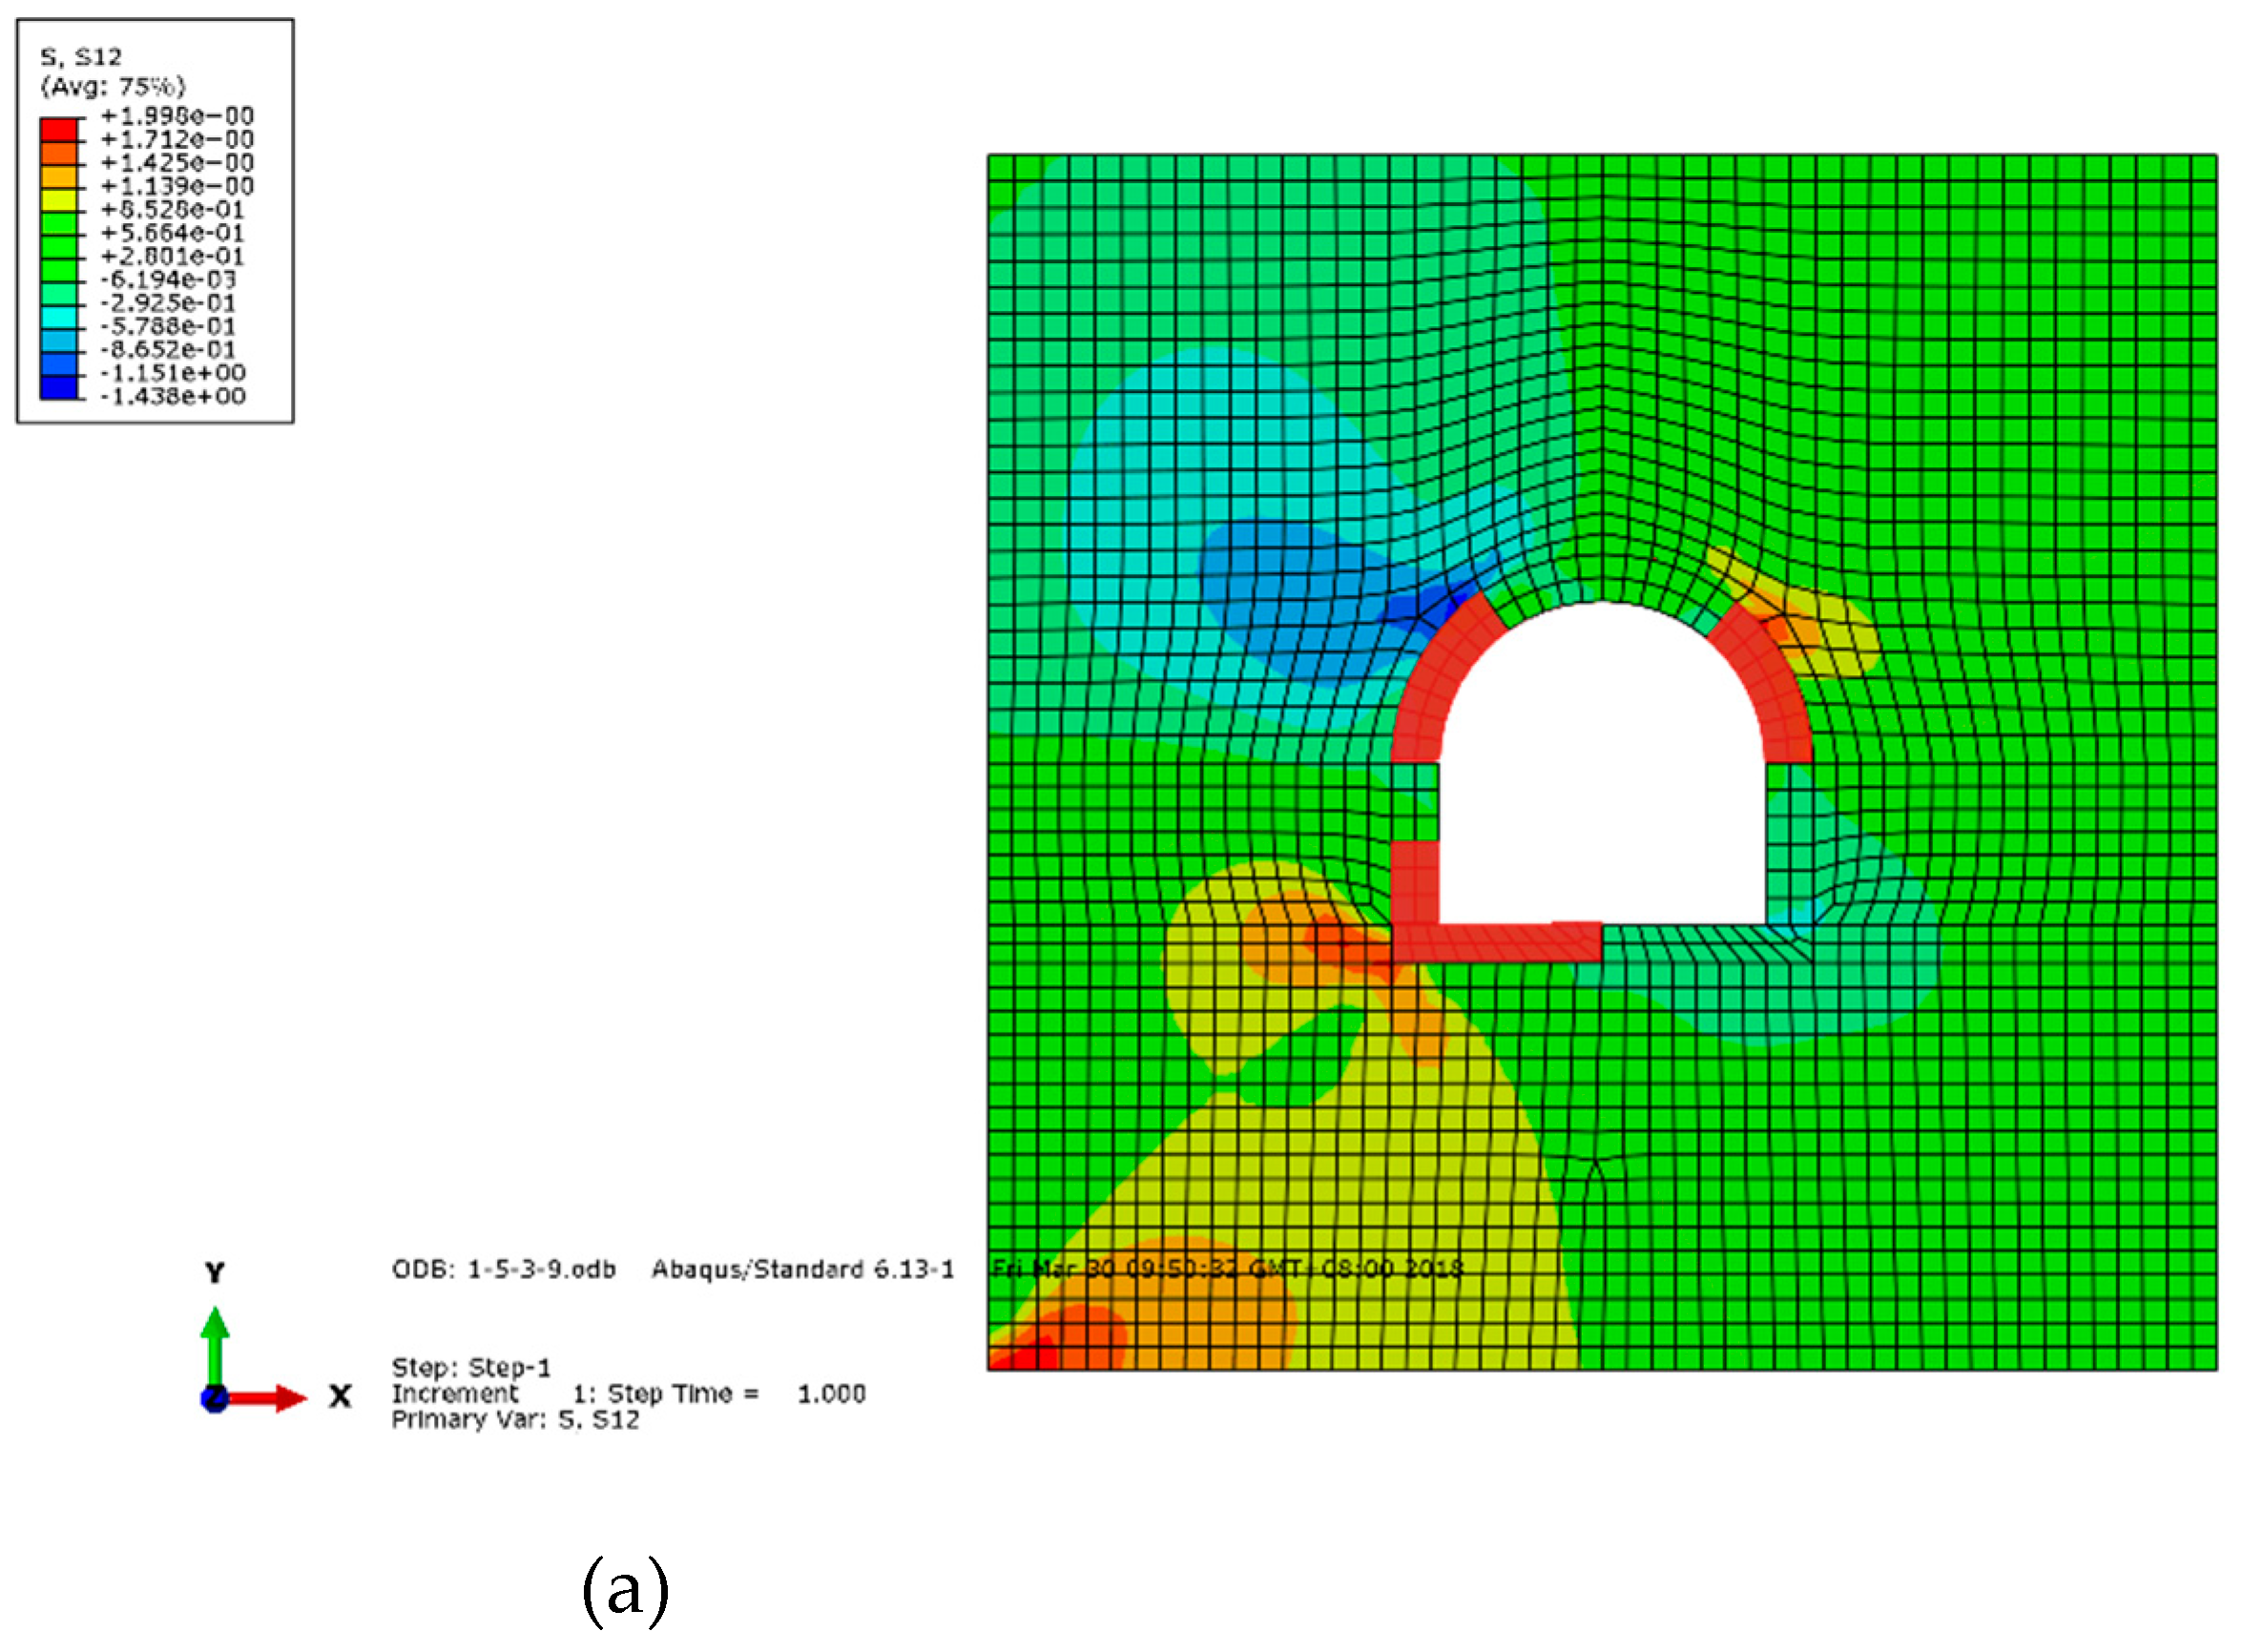
The failure paths under the different lateral pressure coefficients are numbered from top to bottom. The top path is path 1. There are two failure paths when , three failure paths when , and thirteen failure paths when . We can then calculate the correlation coefficient when , which is 0.9788. The final failure parts of the tunnel for each representative path are shown in Figure 11. The correlation coefficient matrices when and 2 are provided in Equations (18) and (19), respectively.

Figure 11.
Final failure parts when λ = 0.5.
There is one highly related path when , including paths 1, 2, and 3. The final failure parts of the tunnel along its representative path are shown in Figure 12.
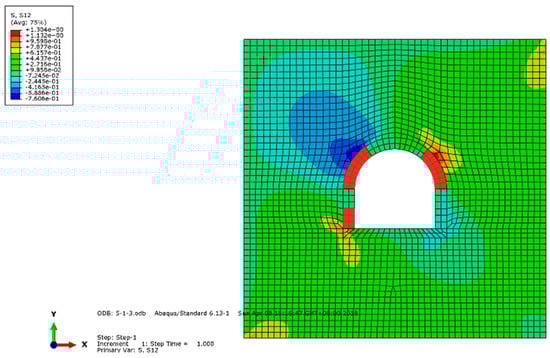
Figure 12.
Final failure parts when .
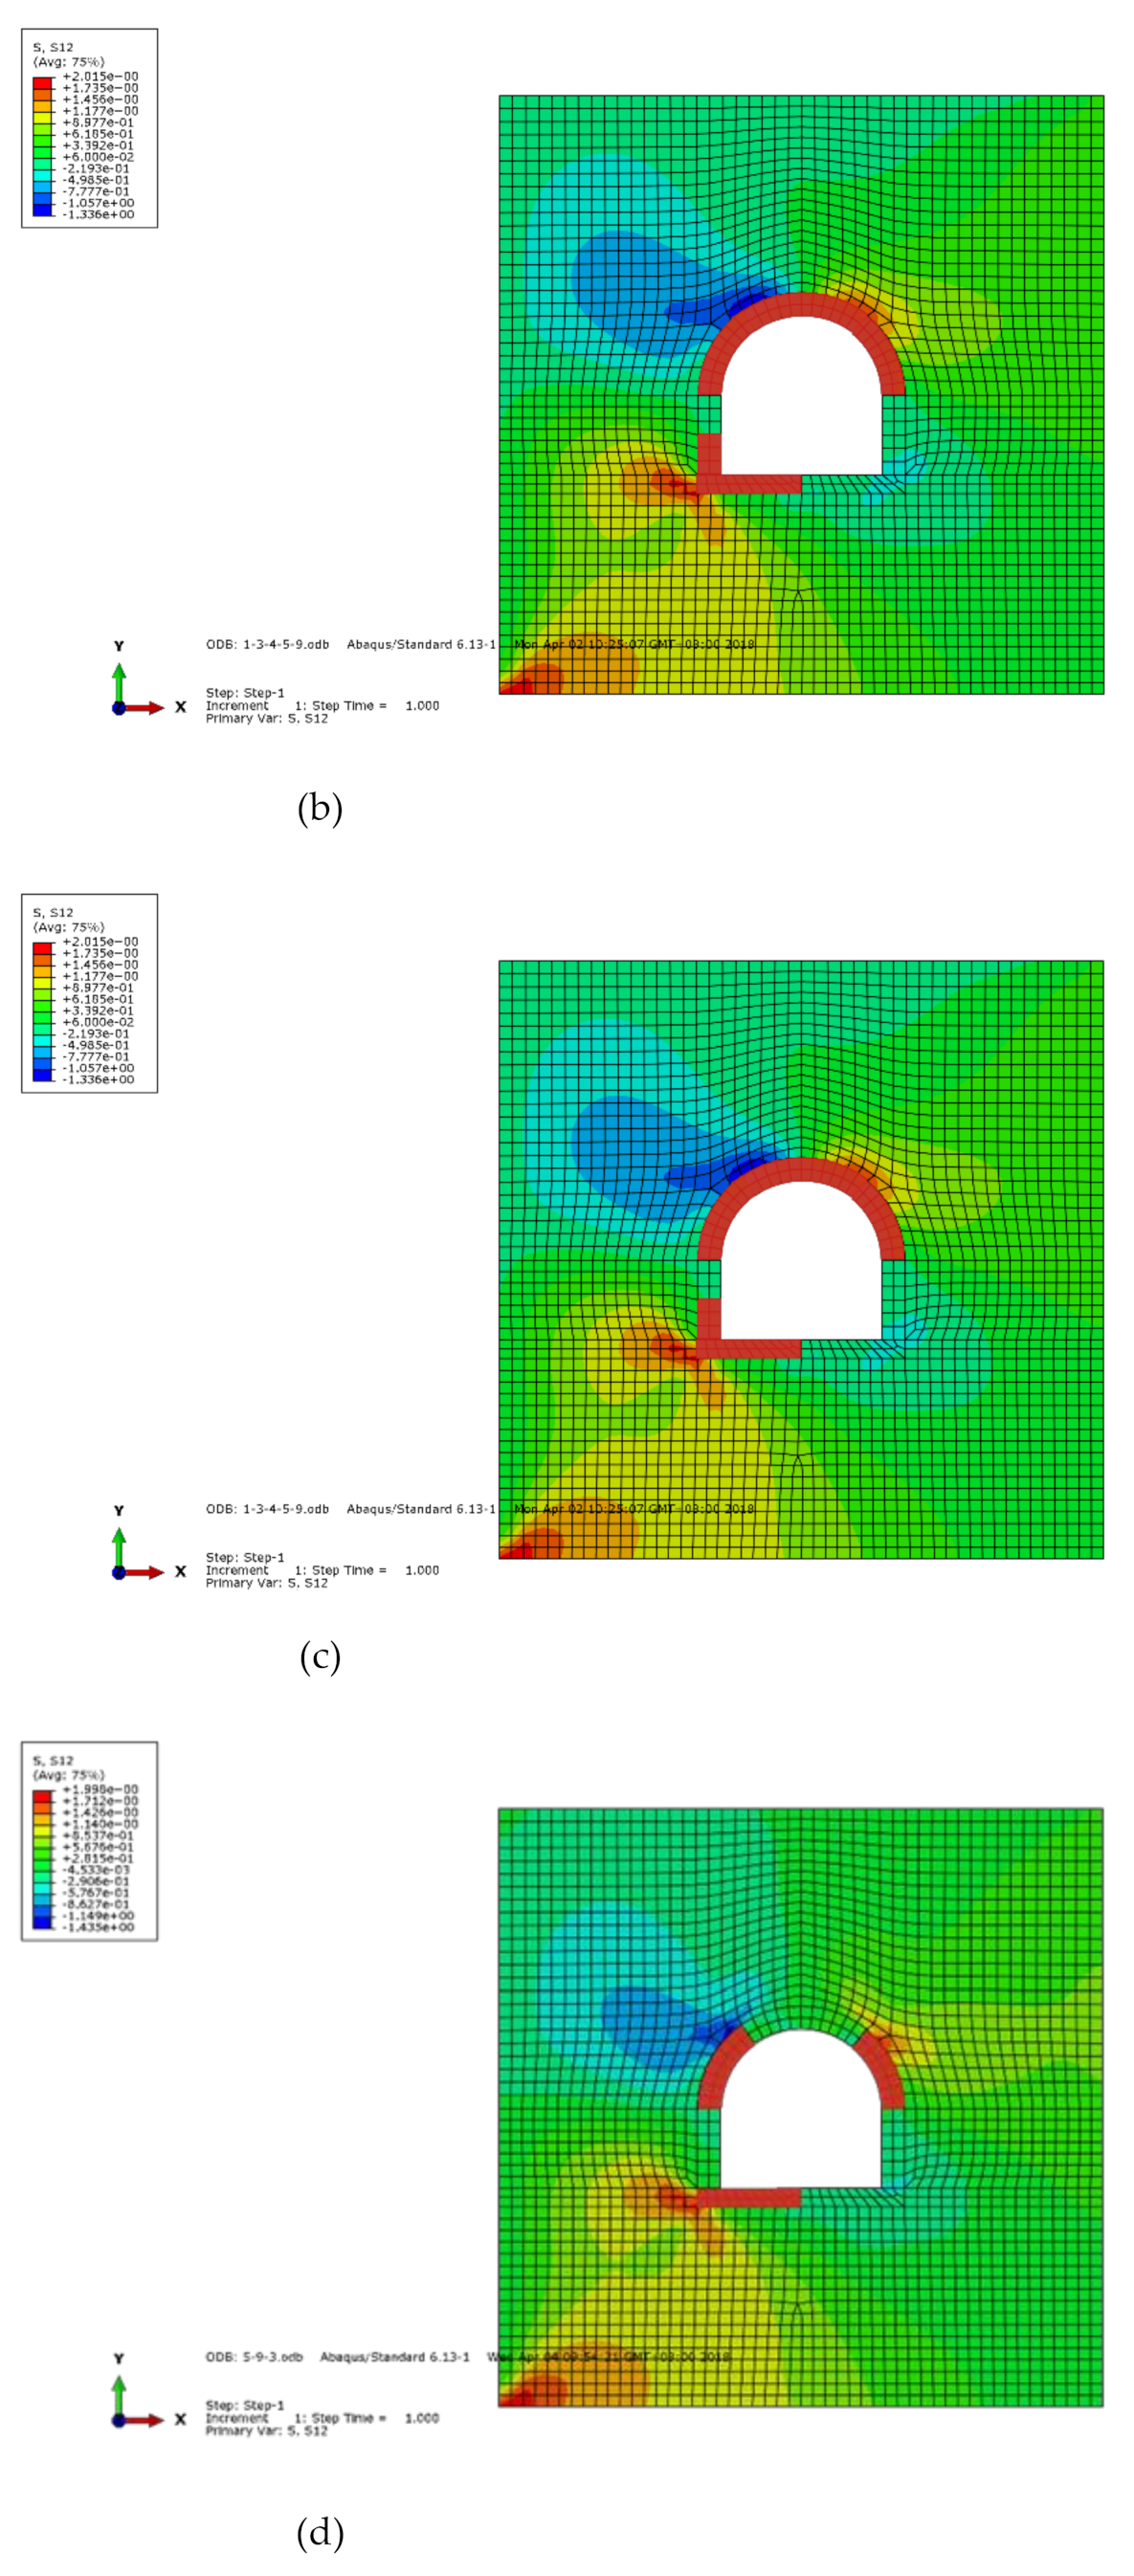
There are four highly related paths when , and the included paths are listed in Table 4. The final failure parts of the tunnel along its representative path are shown in Figure 13.
Table 4.
Highly related paths when .

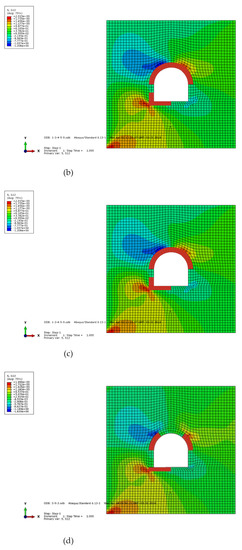
Figure 13.
Final failure parts when . (a) Final failure parts of group 1, (b) Final failure parts of group 2, (c) Final failure parts of group 3, (d) Final failure parts of group 4.
Therefore, the structure has one representative path when . The failure parts include parts 5–1–3 in sequence during the entire failure process. The structure has one representative path when . The failure parts are parts 5–1–3 in sequence during the whole failure process. The structure has four representative paths when . The failure parts along the first representative path are parts 1–5–3–9 in sequence. The failure parts along the second representative path are parts 1–3–4–5–9 in sequence. The failure parts along the third representative path are parts 5–9–4–1–3 in sequence. Finally, the failure parts along the fourth representative path are parts 5–9–3 in sequence. The reliability indices of the different representative paths for are shown in Figure 14.
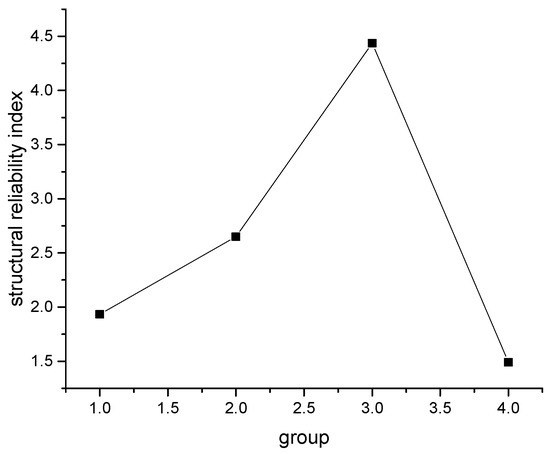
Figure 14.
Reliability indices of the different representative paths when .
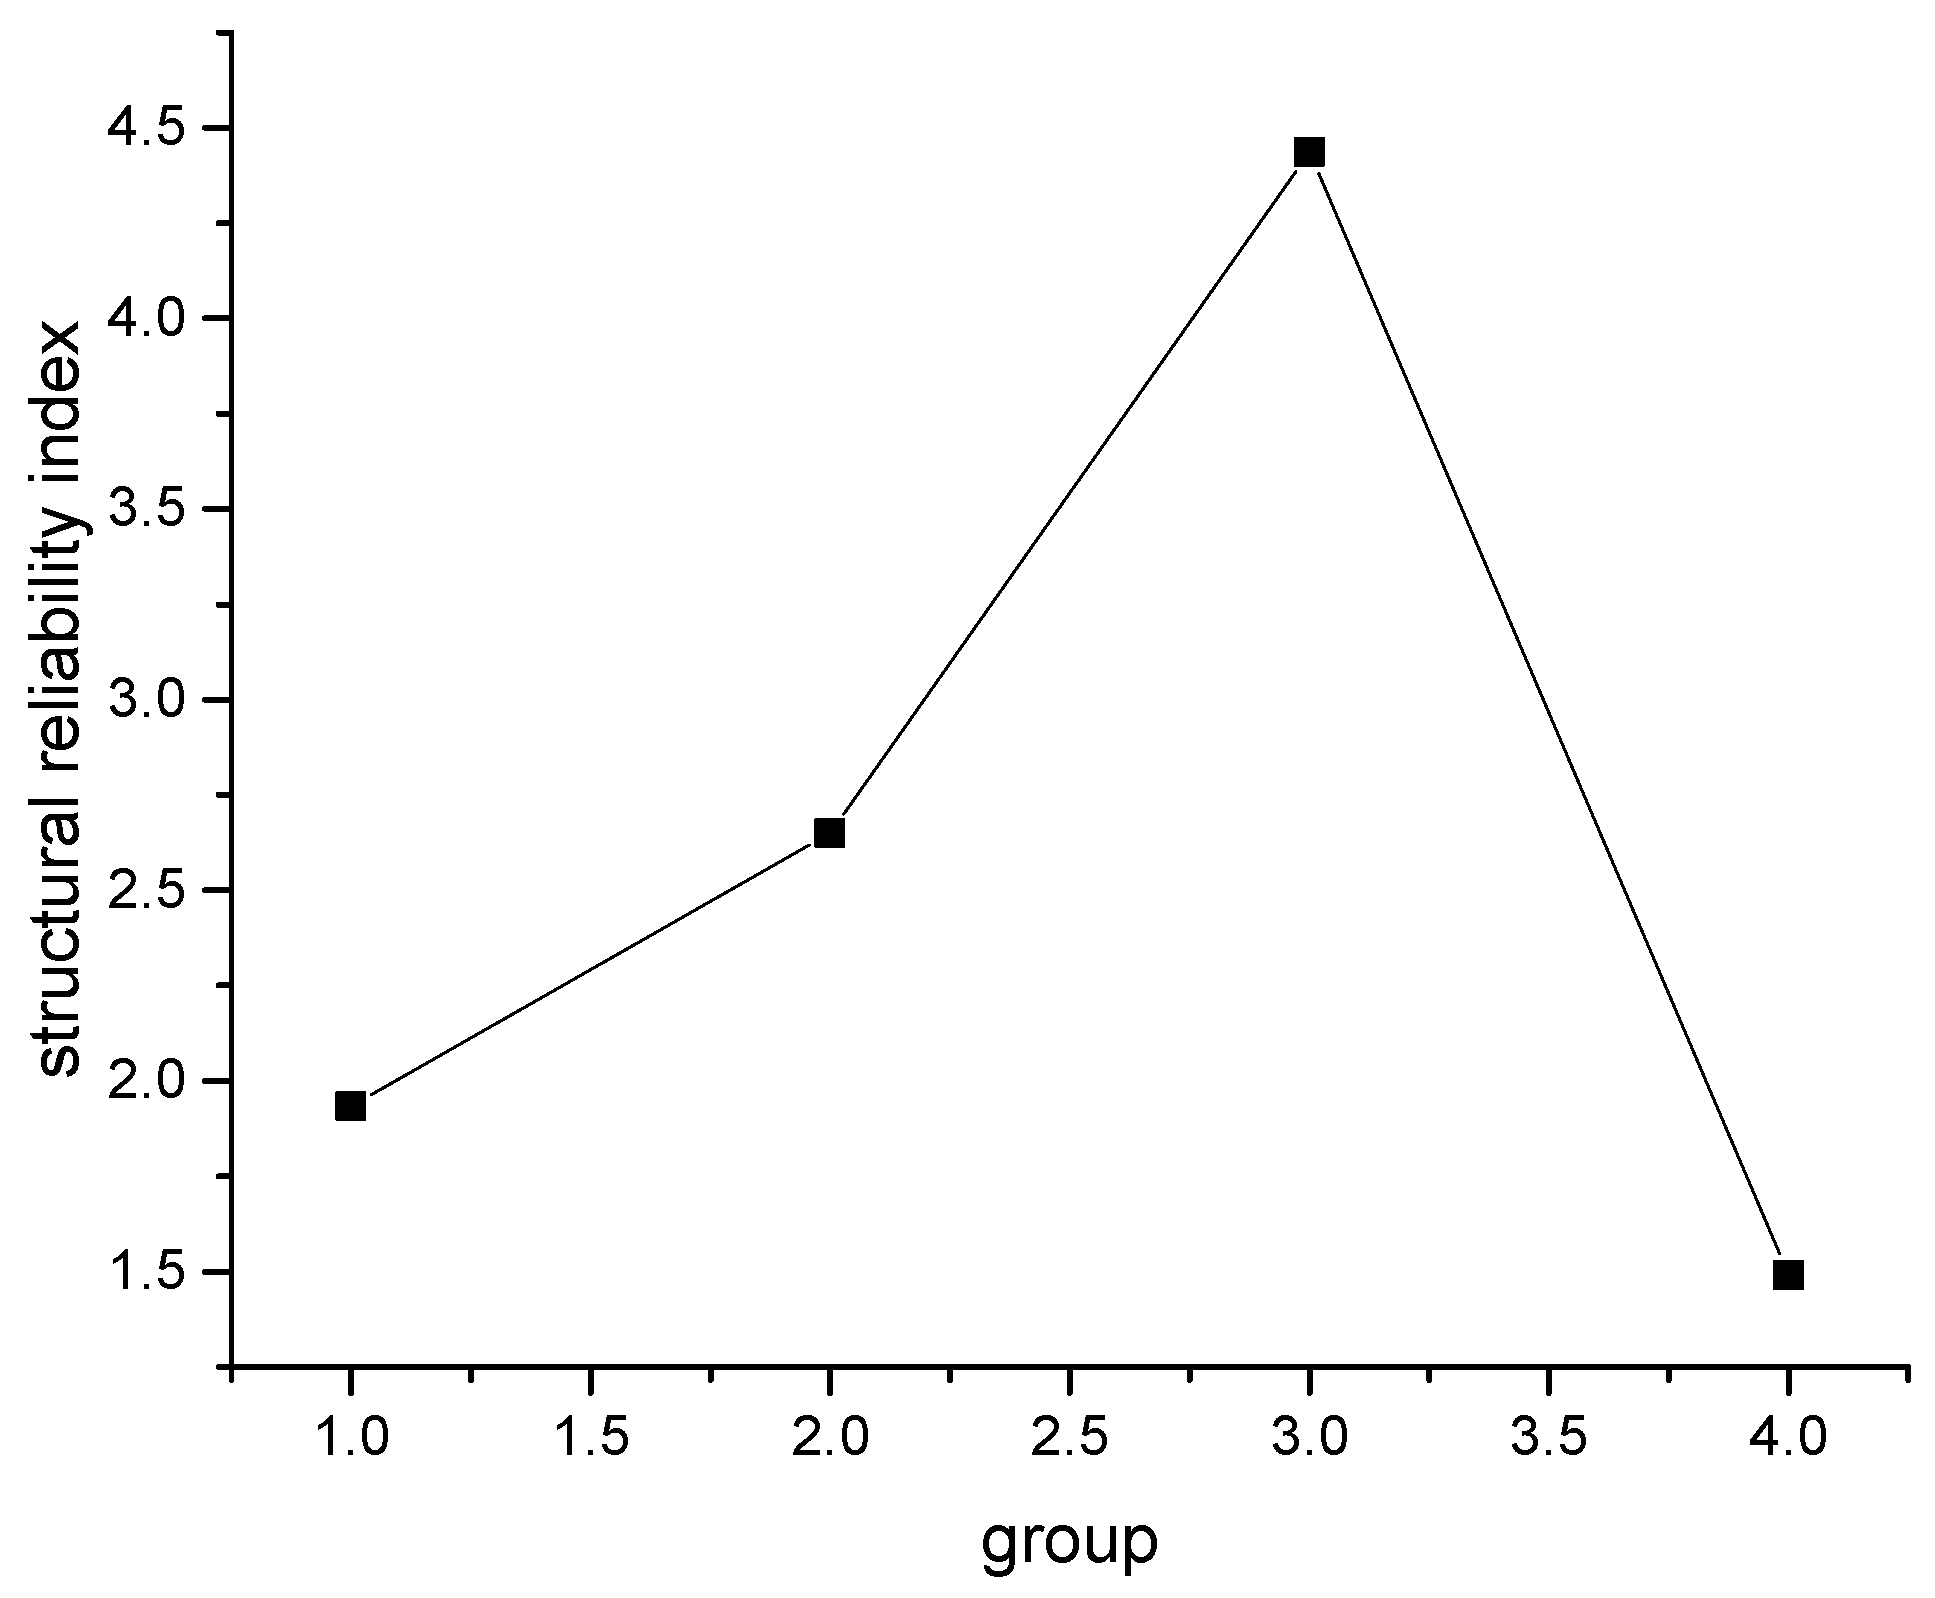
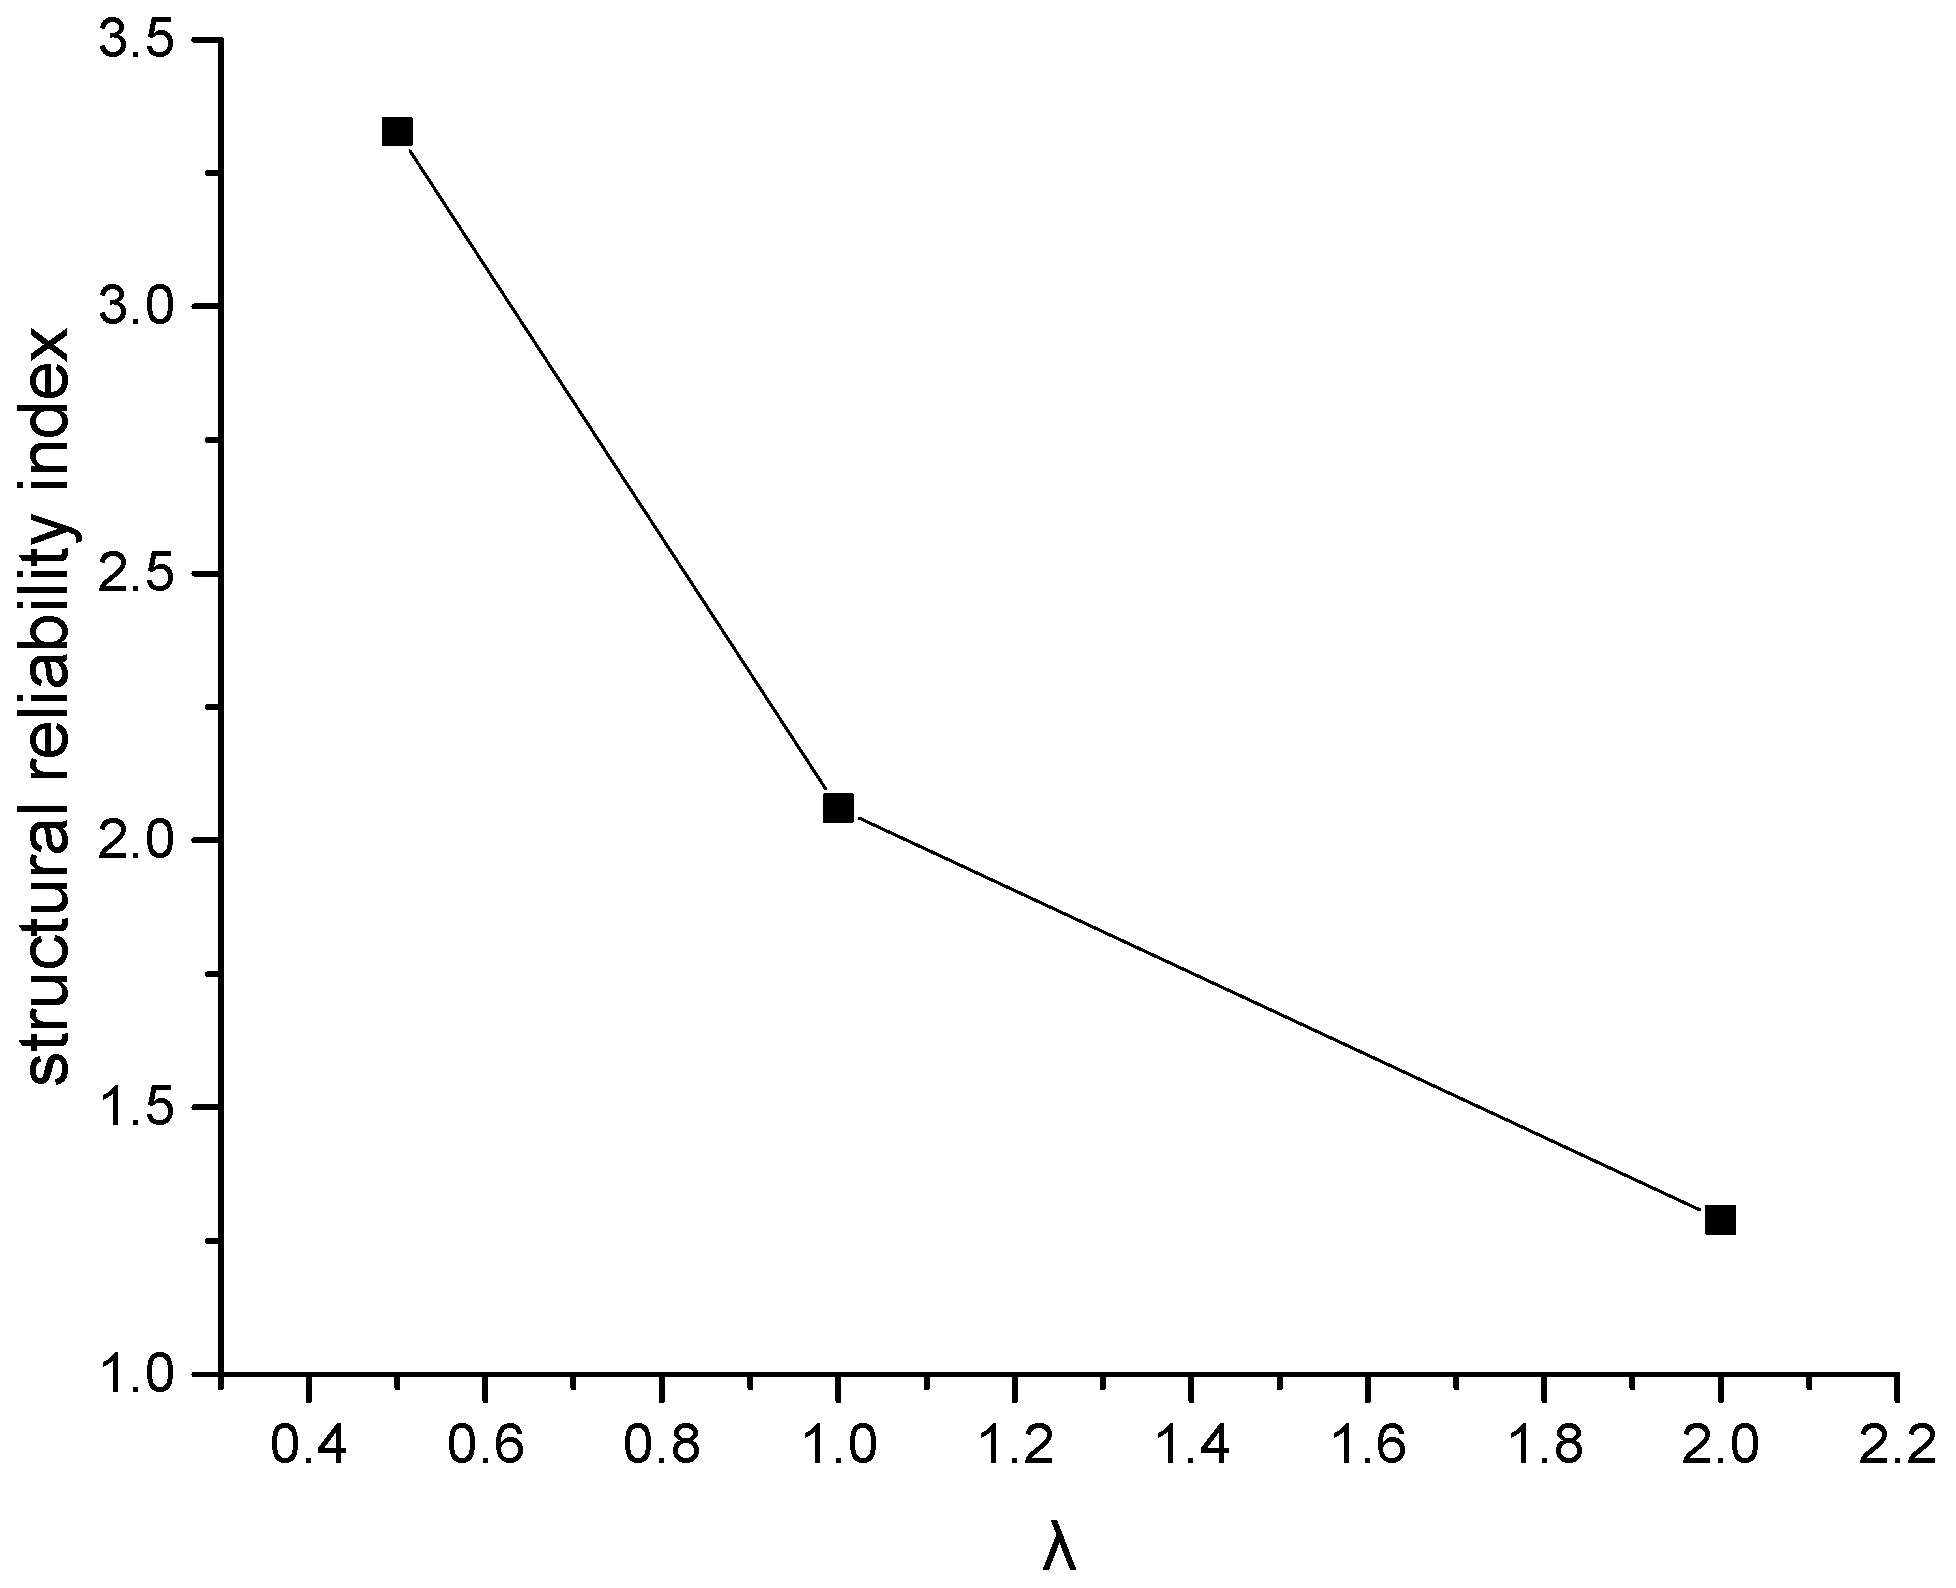
The top of the tunnel is more readily damaged when the lateral pressure coefficient is small. Part 5 of the structure is the most likely to fail. With the increase in the lateral pressure coefficient, the failure probability of the side begins to increase. Part 1 becomes the part most likely to fail. With the increasing lateral pressure coefficient, the main failure paths increase rapidly. The system reliability indices under the different lateral pressure coefficients are shown in Figure 15.
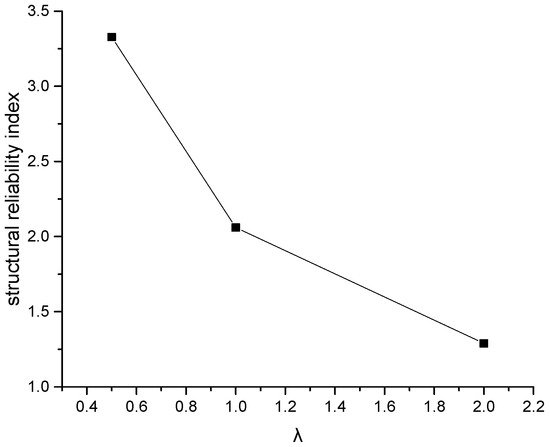
Figure 15.
System reliability indices under different lateral pressure coefficients.
5. Safety Assessment of the Tunnel System
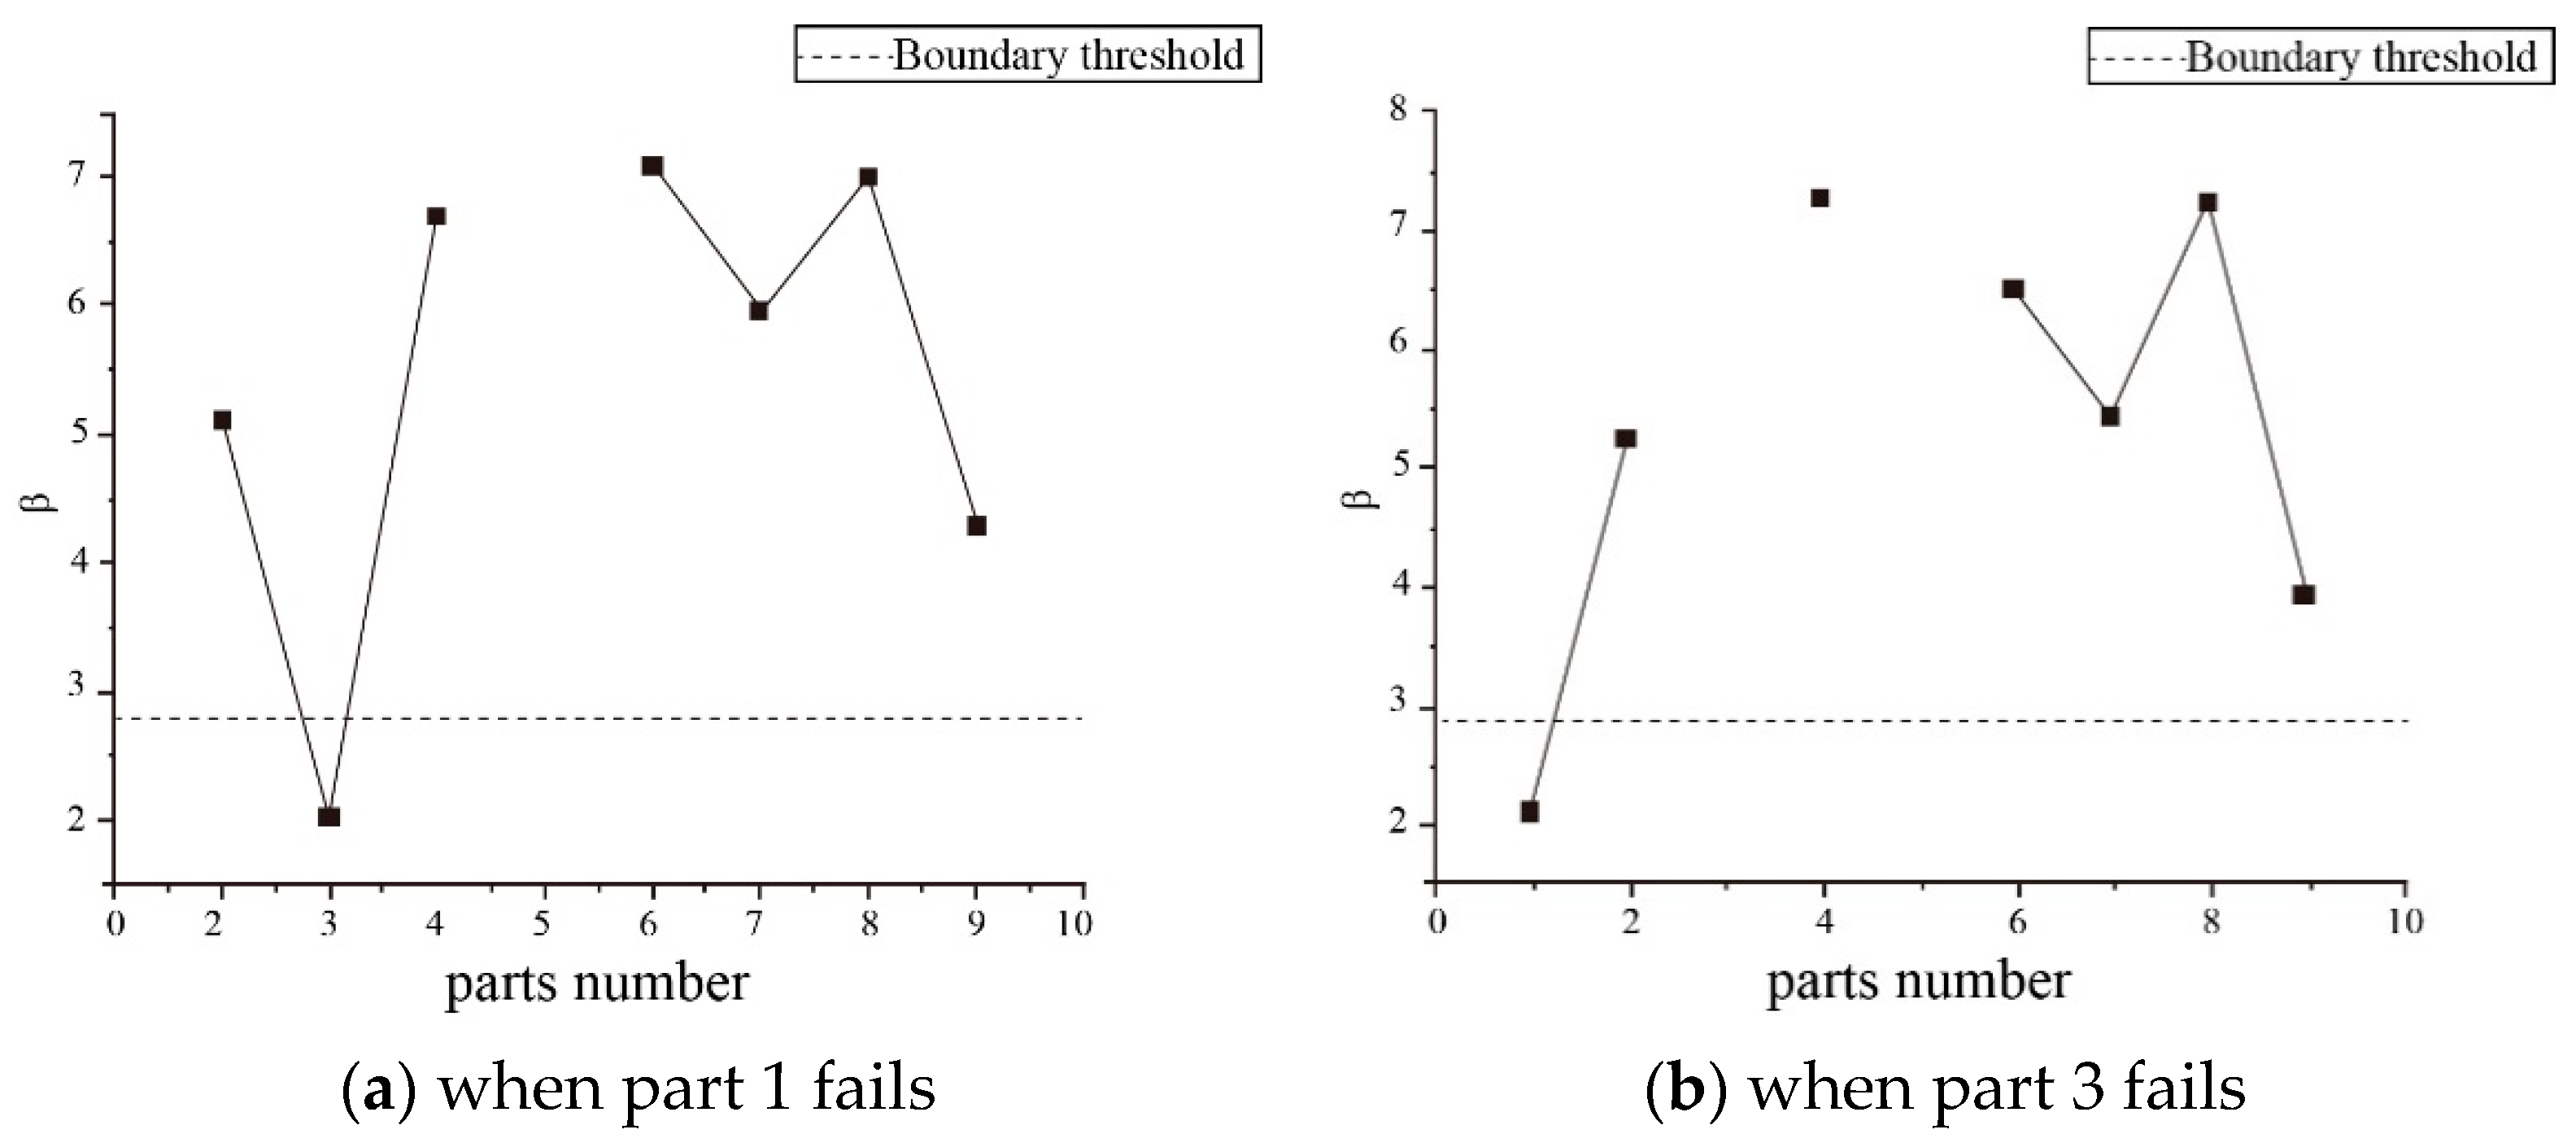
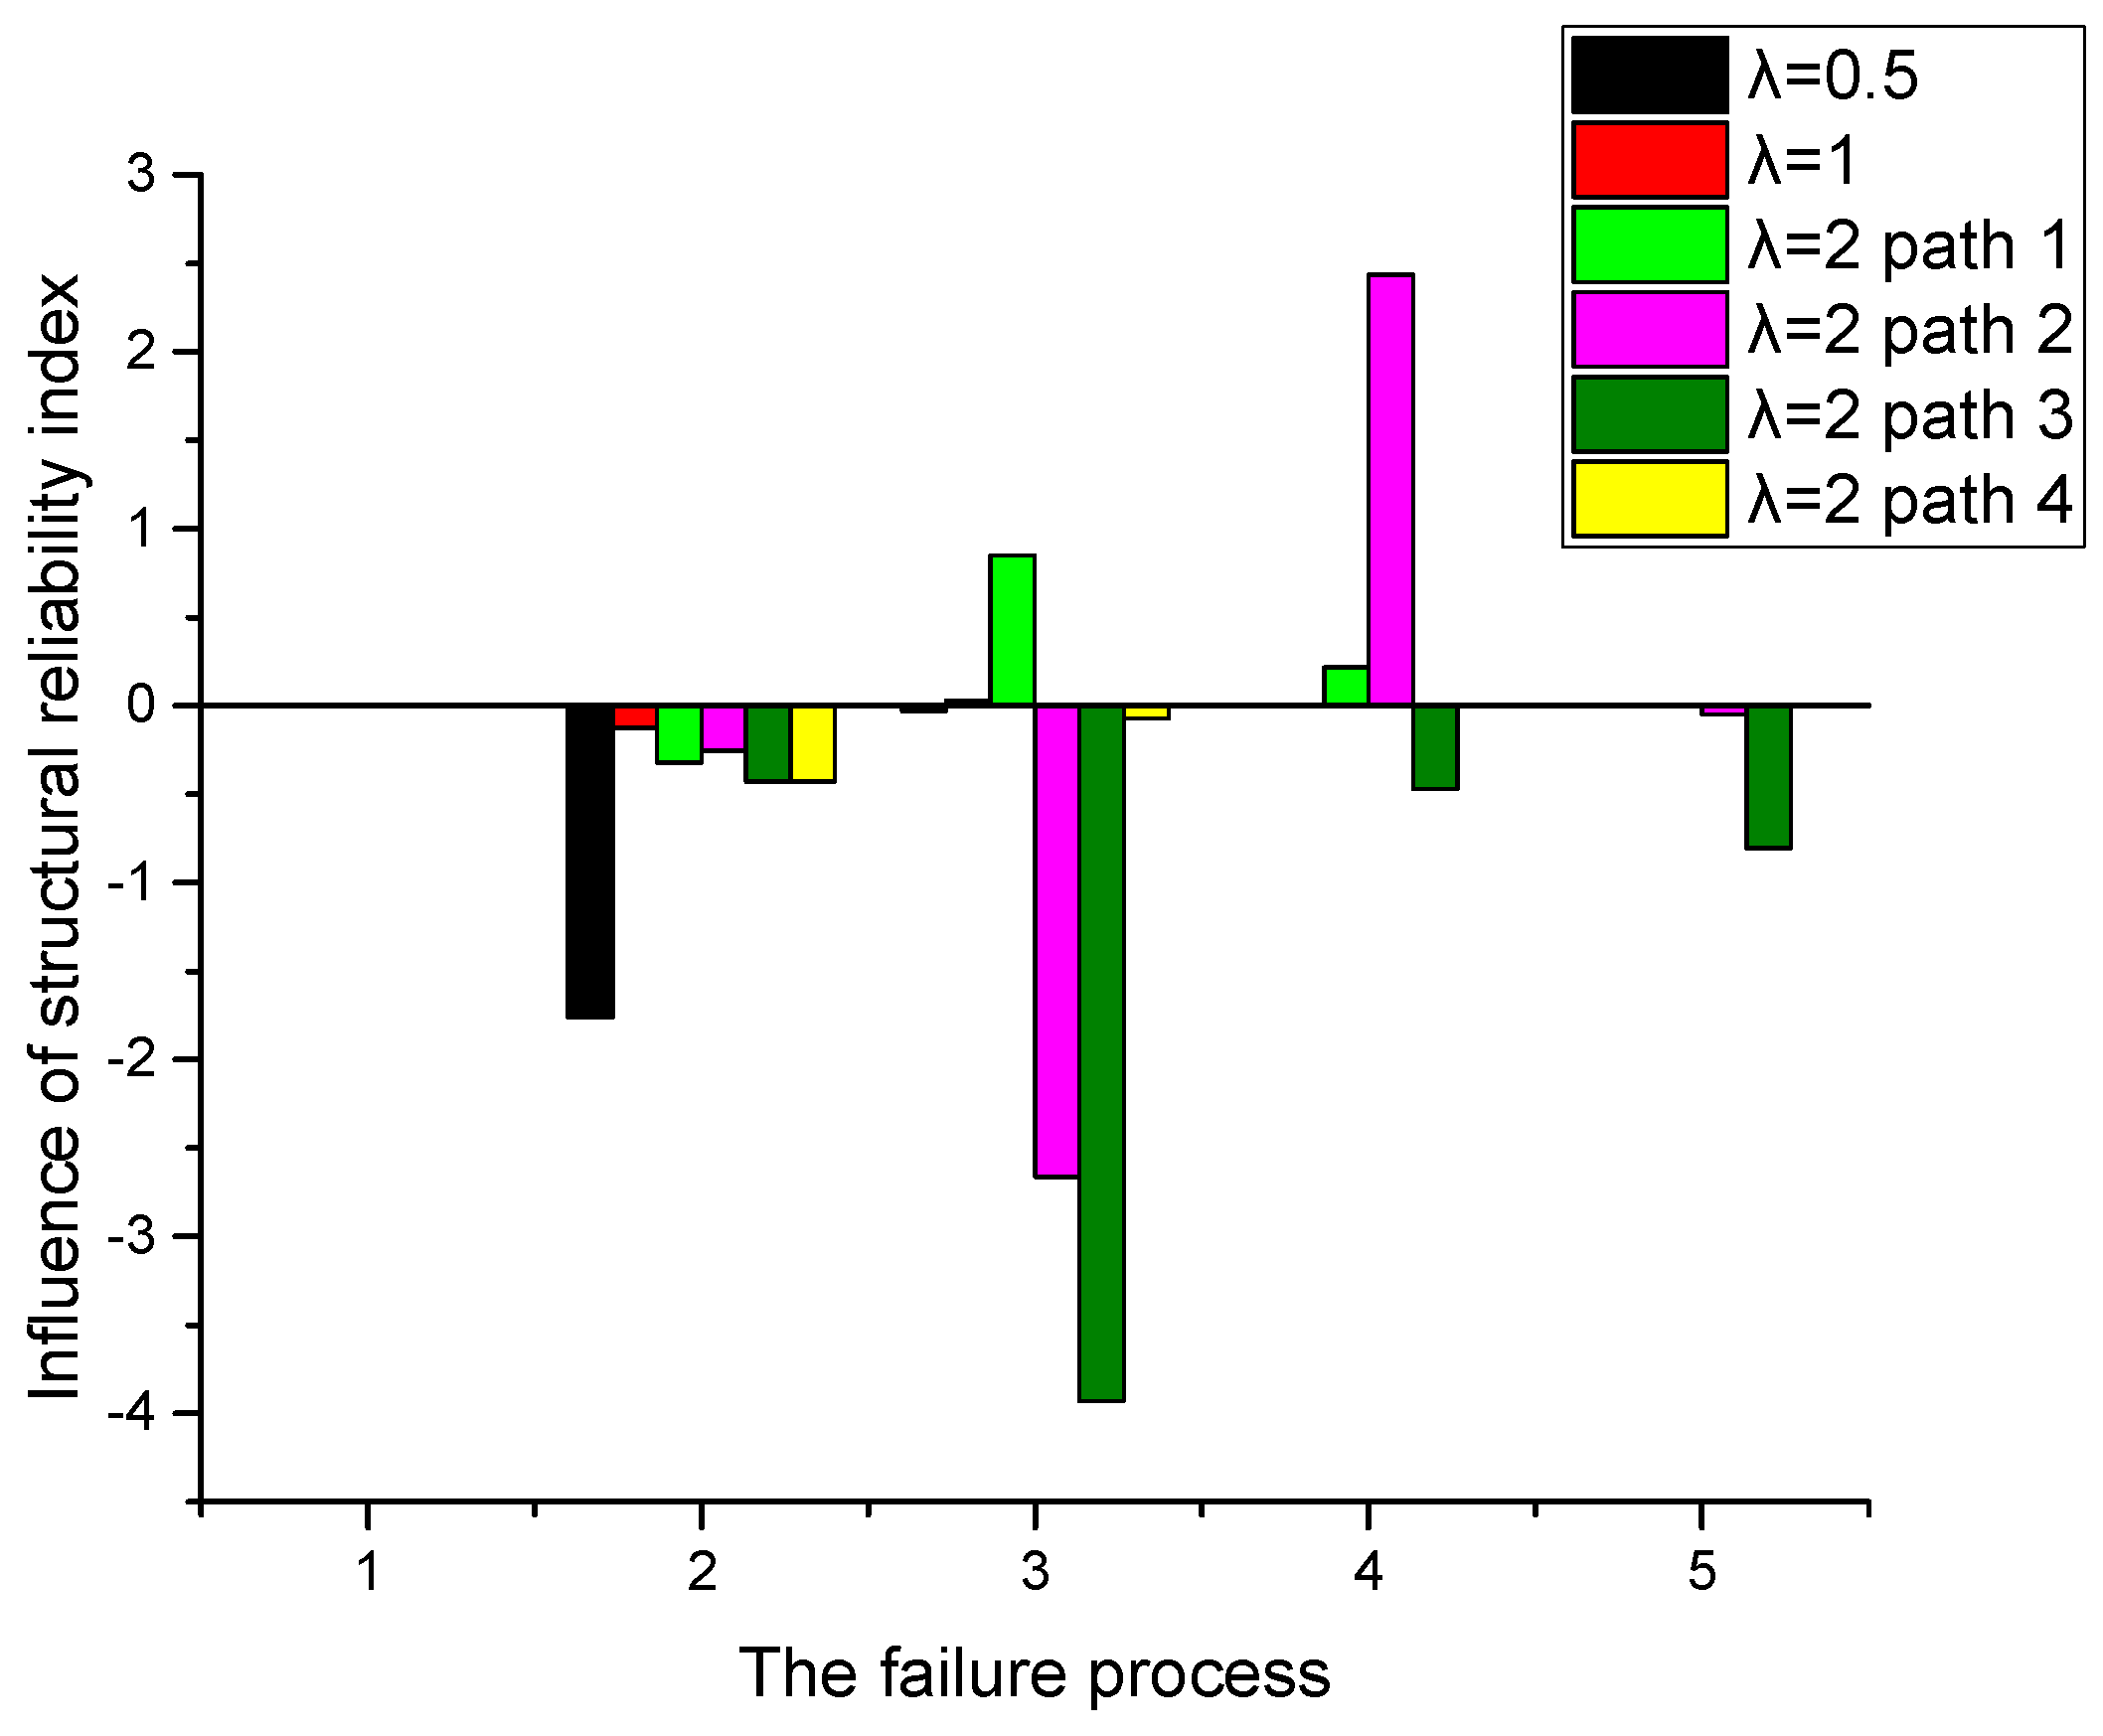
The failure of each part of a tunnel system will have different effects on the structure. Failure of certain parts will release stress and make the stress distribution more uniform. Failure of other parts will result in local stress concentration, which makes the structure more dangerous. Therefore, different parts have different risks in the failure process. The impact of the structural reliability index on the subsequent failure stage of the different parts is shown in Figure 16.

Figure 16.
Impact of the structural reliability index on the subsequent failure stage of the different parts.
Figure 16 shows that when λ = 0.5, at the second stage of the failure process, because of the failure of part 5, the reliability index of part 1 is reduced by 1.76, and the failure probability increases by 3.12%. At the third stage of the failure process, because of the failure of part 1, the reliability index of part 3 decreases by 0.031 with almost no effect. Therefore, part 5 has a high risk along this failure path. Similarly, for the second representative path, at the third stage of the failure process when λ = 2, because of the failure of part 3, the reliability index of part 4 decreases by 2.662, and the failure probability increases by 35.37%. Then, the failure of part 4 increases the reliability index of part 5 by 2.437, and the failure probability decreases by 71.19%. For the second representative path, part 3 has a high risk at the third stage of the failure process, and part 4 has a low risk at the fourth stage of the failure process. For the third representative path, at the third stage of the failure process, because of the failure of part 9, the reliability index of part 4 decreases by 3.929, and the failure probability increases by 39.18%. For the third representative path, part 9 has a high risk at the second stage of the failure process.
The different parts of the tunnel system have different reliability indices. The reliability index will change after each stage of the failure process. The range of the reliability index at each stage of the failure process is shown in Figure 17.
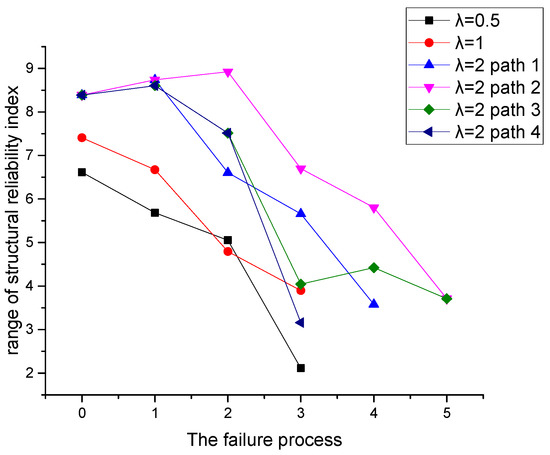
Figure 17.
The range of the reliability index in the failure process.
As shown in Figure 17, the failure of most parts will reduce the reliability range, thereby making the stress distribution more uniform. The failure of a few parts will increase the reliability range, thus promoting the polarization of the structural reliability. The parts promoting the polarization of the structural reliability include (a) part 1 from the first representative path when λ = 2, (b) parts 1 and 3 of the second representative path when λ = 2, (c) parts 1 and 5 of the third representative path when λ = 2, and (d) part 5 of the fourth representative path.
This paper considers the failure probability of the major failure parts and the impact on the structure in order to assess the safety state of the tunnel. The reliability indices of the major failure parts in the failure process are summarized in Table 5.
Table 5.
Reliability indices of the major failure parts.
The impact of the failure parts on the structure is defined in Equation (20):
where is the impact of the structure reliability; is the change in the reliability index at the subsequent failure stage of the different parts, as shown in Figure 16; and is the range of the reliability index, as shown in Figure 17. The results of are listed in Table 6.
Table 6.
Impact of failure of the different parts on the structure reliability.
The reliability indexes in Table 5 and Table 6 are classified into five safety states [39], which are listed in Table 7.
Table 7.
Structure safety state.
The safety state of the failed parts and the level of impact on the structure are summarized in Table 8 and Table 9.
Table 8.
The safety state of the failed parts.
Table 9.
The level of impact on the structure.
The safety state in the failure process is defined in Equation (21) [39]:
where p is the safety state of the failed parts, and is the level of impact on the structure. The safety state of the tunnel in the failure process is summarized in Table 10.
Table 10.
The safety state of the tunnel in the failure process.
6. Conclusions
In this paper, the main failure modes under the different pressure coefficients were investigated by establishing the response surface function of the tunnel system. According to different failure paths, a failure tree of the structure was obtained, and the findings offer three important conclusions.
Analysis of the major failure parts was conducted using the β-unzipping method. After failure of the major failure parts, the tunnel system developed new major failure parts as a result of stress redistribution. Thus, the failure tree under the different lateral pressure coefficients was obtained. Therefore, the possible risk status of the structure could be intuitively obtained. In this paper, the failure laws under different failure paths of tunnels were obtained, and the possible failure modes of tunnels were summarized, which could be used as guidance for the maintenance and early warning of structures.
According to the research of this paper, when the lateral pressure coefficient is small, the major failure parts are more likely to occur at the top of the tunnel. There are fewer kinds of failure modes. With an increase in the lateral pressure coefficient, the failure probability of the lateral tunnel gradually increases. The number of failure paths increase rapidly. According to the correlation between the different failure modes, the structure appears to develop multiple representative failure paths.
The failure of each part of the structure has a different effect on the tunnel system. Failure of certain parts may result in a local stress concentration, thereby making the structure more dangerous. Failure of certain parts may also reduce the stress concentration of the structure, which is more beneficial to the overall stability of the structure.
Author Contributions
Conceptualization, T.Y.; methodology, T.Y.; software, T.Y.; validation, T.Y., H.L., and S.W.; formal analysis, T.Y.; investigation, T.Y.; resources, T.Y.; data curation, T.Y.; writing—original draft preparation, T.Y.; writing—review and editing, T.Y., H.L., and S.W.; visualization, T.Y.; supervision, S.W.; project administration, S.W.; funding acquisition, S.W. All authors have read and agreed to the published version of the manuscript.
Funding
This work was conducted with supports from the National Natural Science Foundation of China (grant no. U1602232 and no. 51474050); the Key Science and Technology Projects of Liaoning Province, China (2019JH2-10100035); and the Fundamental Research Funds for the Central Universities (N180701005).
Institutional Review Board Statement
Not applicable.
Informed Consent Statement
Not applicable.
Data Availability Statement
Data sharing is not applicable to this article.
Conflicts of Interest
The authors declare no conflict of interest.
References
- Hoek, E. Practical-Rock-Engineering; Yellow River Conservancy Press: Beijing, China, 2007. [Google Scholar]
- Hadjigeorgiou, J.; Harrison, J.P. Uncertainty and sources of error in rock engineering. In Proceedings of the 12th ISRM Congress. International Society for Rock Mechanics and Rock Engineering, Beijing, China, 18–21 October 2011; pp. 2063–2067. [Google Scholar]
- Ebenuwa, A.U.; Tee, K.F. Fuzzy reliability and risk-based maintenance of buried pipelines using multiobjective optimization. J. Infrastruct. Syst. 2020, 26, 04020008. [Google Scholar] [CrossRef]
- Kumar, H.; Yadav, U.S.; Kumar, S.; Kumar, K.; Yadav, R.; Shanker, A.; Tripathi, A.; Khandelwal, G. Comparative study of coal rocks compressive behaviors and failure criteria. Arab. J. Geosci. 2019, 12, 1–12. [Google Scholar] [CrossRef]
- Saeidi, A.; Heidarzadeh, S.; Lalancette, S.; Rouleau, A. The effects of in situ stress uncertainties on the assessment of open stope stability: Case study at the Niobec mine, Quebec (Canada). Geomech. Energy Environ. 2021, 25, 100194. [Google Scholar] [CrossRef]
- Khan, S.; Chakraborty, T.; Matsagar, V. Parametric sensitivity analysis and uncertainty quantification for cast iron-lined tunnels embedded in soil and rock under internal blast loading. J. Perform. Constr. Facil. 2016, 30, 04016062. [Google Scholar] [CrossRef]
- Mishra, M.; Keshavarzzadeh, V.; Noshadravan, A. Reliability-based lifecycle management for corroding pipelines. Struct. Saf. 2019, 76, 1–14. [Google Scholar] [CrossRef]
- Kroetz, H.M.; Do, N.A.; Dias, D.; Beck, A.T. Reliability of tunnel lining design using the hyperstatic reaction method. Tunn. Undergr. Space Technol. 2018, 77, 59–67. [Google Scholar] [CrossRef]
- Pina, A.; Donado, L.D.; Blessent, D. Analysis of the scale-dependence of the hydraulic conductivity in complex fractured media. J. Hydrol. 2019, 569, 556–572. [Google Scholar] [CrossRef]
- Low, B.K.; Einstein, H.H. Reliability analysis of roof wedges and rockbolt forces in tunnels. Tunn. Undergr. Space Technol. 2013, 38, 1–10. [Google Scholar] [CrossRef]
- Langford, J.C.; Diederichs, M.S. Reliable support design for excavations in brittle rock using a global response surface method. Rock Mech. Rock Eng. 2015, 48, 669–689. [Google Scholar] [CrossRef]
- Wu, P.F.; Yang, T.J.; Jia, W.C. Reliability analysis and prediction on tunnel roof under blasting disturbance. Ksce J. Civ. Eng. 2019, 23, 4036–4046. [Google Scholar] [CrossRef]
- Fraldi, M.; Guarracino, F. Limit analysis of progressive tunnel failure of tunnels in hoek-brown rock masses. Int. J. Rock Mech. Min. Sci. 2012, 50, 170–173. [Google Scholar] [CrossRef]
- Kamel, T.; Limam, A.; Silvani, C. Residual strength of underground structures in service. Can. Geotech. J. 2016, 53, 988–999. [Google Scholar] [CrossRef]
- Huang, F.; Zhu, H.; Xu, Q.; Cai, Y.; Zhuang, X. The effect of weak interlayer on the failure pattern of rock mass around tunnel—Scaled model tests and numerical analysis. Tunn. Undergr. Space Technol. 2013, 35, 207–218. [Google Scholar] [CrossRef]
- Giardina, G.; Losacco, N.; DeJong, M.J.; Viggiani, G.M.B.; Mair, R.J. Effect of soil models on the prediction of tunnelling-induced deformations of structures. Proc. Inst. Civ. Eng. Geotech. Eng. 2020, 173, 379–397. [Google Scholar] [CrossRef]
- Lee, J.W.; Kim, H.; Oh, T.M. Acoustic emission characteristics during uniaxial compressive loading for concrete specimens according to sand content ratio. Ksce J. Civ. Eng. 2020, 24, 2808–2823. [Google Scholar] [CrossRef]
- Amiri, M.; Hasanipanah, M.; Amnieh, H.B. Predicting ground vibration induced by rock blasting using a novel hybrid of neural network and itemset mining. Neural Comput. Appl. 2020, 32, 14681–14699. [Google Scholar] [CrossRef]
- Nguyen, V.Q.; Nizamani, Z.A.; Park, D.; Kwon, O.S. Numerical simulation of damage evolution of daikai station during the 1995 kobe earthquake. Eng. Struct. 2020, 206, 110180. [Google Scholar] [CrossRef]
- Collins, B.D.; Stock, G.M.; Eppes, M.C. Relaxation response of critically stressed macroscale surficial rock sheets. Rock Mech. Rock Eng. 2019, 52, 5013–5023. [Google Scholar] [CrossRef]
- Lü, Q.; Chan, C.L.; Low, B.K. System reliability assessment for a rock tunnel with multiple failure modes. Rock Mech. Rock Eng. 2012, 46, 821–833. [Google Scholar] [CrossRef]
- Kalogeris, I.; Papadopoulos, V. Limit analysis of stochastic structures in the framework of the probability density evolution method. Eng. Struct. 2018, 160, 304–313. [Google Scholar] [CrossRef]
- Sahraoui, Y.; Chateauneuf, A. The effects of spatial variability of the aggressiveness of soil on system reliability of corroding underground pipelines. Int. J. Press. Vessel. Pip. 2016, 146, 188–197. [Google Scholar] [CrossRef]
- Haj Najafi, L.; Tehranizadeh, M. Equation for achieving efficient length of link-beams in eccentrically braced frames and its reliability validation. J. Constr. Steel Res. 2017, 130, 53–64. [Google Scholar] [CrossRef]
- Chen, K.; Zhang, S.; Huang, W. Artificial intelligence β-unzipping method in structural system reliability analysis. Comput. Struct. 1995, 60, 619–626. [Google Scholar] [CrossRef]
- Kim, D.-S.; Ok, S.-Y.; Song, J.; Koh, H.-M. System reliability analysis using dominant failure modes identified by selective searching technique. Reliab. Eng. Syst. Saf. 2013, 119, 316–331. [Google Scholar] [CrossRef]
- Chakraborty, S.; Goswami, S. Adaptive response surface method based efficient monte carlo simulation. Int. Conf. Vulnerability Risk Analysis Manag. 2014, 2043–2052. [Google Scholar]
- Wong, F.S. Slope reliability and response surface method. J. Geotech. Eng. 1985, 111, 32–53. [Google Scholar] [CrossRef]
- Ji, J.; Low, B.K. Stratified response surfaces for system probabilistic evaluation of slopes. J. Geotech. Geoenviron. Eng. 2012, 138, 1398–1406. [Google Scholar] [CrossRef]
- Vessia, G.; Kozubal, J.; Pula, W. High dimensional model representation for reliability analyses of complex rock-soil slope stability. Arch. Civ. Mech. Eng. 2017, 17, 954–963. [Google Scholar] [CrossRef]
- GuhaRay, A.; Baidya, D.K. Partial safety factors for retaining walls and slopes: A reliability based approach. Geomech. Eng. 2014, 6, 99–115. [Google Scholar] [CrossRef]
- Hamrouni, A.; Dias, D.; Sbartai, B. Probability analysis of shallow circular tunnels in homogeneous soil using the surface response methodology optimized by a genetic algorithm. Tunn. Undergr. Space Technol. 2019, 86, 22–33. [Google Scholar] [CrossRef]
- Chen, K.S.; Zhang, S.K.; Huang, W. Artificial intelligence beta-unzipping method in structural system reliability analysis. Computers & Structures 1996, 60, 619–626. [Google Scholar]
- Zhang, M.; Jin, F. Structural Reliability Calculation; Science Press: Beijing, China, 2015. (In Chinese) [Google Scholar]
- Thoft-Christensen, P. Consequence modified β-unzipping of plastic structures. Structural Safety 1990, 7, 191–198. [Google Scholar] [CrossRef]
- Liu, J. Study on Adaptive β-Unzipping Method for Structural System Reliability Analysis; Guangxi University: Nanning, China, 2017. [Google Scholar]
- Ma, H.; Ang, A.H. Reliability Analysis of Redundant Ductile Structural Systems; University of Illinois Engineering Experiment Station, College of Engineering, University of Illinois at Urbana-Champaign: Chicago, Illinois, 1982. [Google Scholar]
- Leheta, H.W.; Mansour, A.E. Reliability-based method for optimal structural design of stiffened panels. Marine Structures 1997, 10, 323–352. [Google Scholar] [CrossRef]
- Yan, X.M. Risk analysis on open-pit mine slope based on the reliability theory. In Risk analysis on open-pit mine slope based on the reliability theory; Central South University: Hunan, China, 2013. [Google Scholar]


Publisher’s Note: MDPI stays neutral with regard to jurisdictional claims in published maps and institutional affiliations. |
© 2021 by the authors. Licensee MDPI, Basel, Switzerland. This article is an open access article distributed under the terms and conditions of the Creative Commons Attribution (CC BY) license (https://creativecommons.org/licenses/by/4.0/).