Article

Developing a Specific MRI Technology to Identify Complications Caused by Breast Implants

1
Department of Medical Imaging and Radiological Technology, Yuanpei University of Medical Technology, Hsinchu 30015, Taiwan
2
Department of Radiology, Wan Fang Hospital, Taipei Medical University, Taipei 11696, Taiwan
3
Department of Radiology, School of Medicine, College of Medicine, Taipei Medical University, Taipei 11031, Taiwan
*
Author to whom correspondence should be addressed.
Appl. Sci. 2021, 11(8), 3434; https://doi.org/10.3390/app11083434
Submission received: 31 January 2021 / Revised: 8 April 2021 / Accepted: 10 April 2021 / Published: 12 April 2021
(This article belongs to the Section Applied Biosciences and Bioengineering)

Abstract

:
With advancements in aesthetic medicine, breast augmentation has become a popular plastic surgery worldwide, typically performed using either fine-needle injection or silicone implants. Both carry complication risks from rupture over time. In this study, we aimed to reduce misjudgments and increase diagnostic value by developing an MRI technique that can produce water- and silicone-specific images from MRI scans of phantoms (Natrelle® saline-filled breast implants) and human bodies. Pig oil, soybean oil, and normal saline were used to simulate human breast tissue, and two common types of breast implants, saline bags, and silicone bags, were selected as well, resulting in five materials scanned. Six pulse sequences were applied: T1W fast spin echo (FSE), T1W SPGR/60, T2W, T2W fat-saturation, STIR, and STIR water-saturation. Human body scans were additionally investigated using 3D SPGR fat-saturation dynamic contrast enhancement. Results show that the best way to enhance tissue contrast in images of silicone implants is to apply STIR combined with water suppression, and the best way to enhance saline bag implants is to apply T2W fat-saturation combined with fat suppression. Both offered very high sensitivity and specificity, rendering this method especially useful for distinguishing normal mammary glands from siliconoma.

1. Introduction

Advancements in aesthetic medicine have allowed breast augmentation to become a popular plastic surgery worldwide. Two common techniques are fine-needle injection and silicone implants. In the former, injections of various biological materials or gel fillings are placed into the pectoralis major muscle beneath the breasts using a fine needle. Complications such as nodule or blood clot formation, evidenced by lumps, inflammation or infection, pain, or secretions, can result [1,2]. On the other hand, silicone implants can leak or deform. Both types present a risk of rupture, resulting in complications over time. In 2003, Hölmich studied the rate of rupture among silicone implants, finding that the risk increases with implant age and that it is at least 15% 3 to 10 years after augmentation [3]. In 2017, Hillard analyzed the rupture rates of three types of commercial silicone implants and found that the risks started to increase 6 to 8 years after augmentation [4]. In 2018, Bretaudeau reported a case of pericarditis originating from breast implant rupture. An implant rupture can be symptomless, but it can result in isolated silicone granulomas or serious systemic diseases [5,6]. Although new-generation silicone implants can last longer than legacy implants, the risk of rupture in the long term remains high [7], and once rupture results in complications, the conventional practice is to perform reconstructive surgery, removing the implant or resecting the lesion.
For many years, breast implant leaks have been diagnosed using medical imaging such as mammography, computed tomography, ultrasound, or magnetic resonance imaging (MRI), each providing its own sensitivity and specificity [8,9,10,11]. Of these, MRI is recommended for evaluating implants, given its ability to show the distribution of whatever substance was injected for breast augmentation and to detect certain complications. It can locate the leak, and it provides high diagnostic accuracy [12,13,14,15,16]. However, when the inner layer of the breast implant ruptures, leaving the outer shell intact, MRI can lead to erroneous diagnoses [17]. Many studies of diagnoses based on only MRI and ultrasound recruited symptomatic participants, and because the sensitivity of MRI might not be as great with asymptomatic cases or with screenings, the accuracy of MRI-based diagnoses might be overestimated [18]. Breast cancers and complications originating from implants can be identified using gadolinium-enhanced MRI [19]; however, fibromas from silicone injections are likely to be confused with breast cancers.
Long-term complications from silicone injections can result in siliconoma or calcifications, either of which can mimic breast cancer or even normal mammary gland tissue in a mammogram [20]. Therefore, a silicone-specific MRI technique is needed for patients with breast augmentations. With this study, we aimed to develop an MRI technique that can produce water-specific and silicone-specific images, allowing differentiation between breast augmentation and lesions.

2. Materials and Methods

2.1. Homemade Phantom for MRI Scan

In this study, MRI scans were performed on a phantom breast implant filled with saline (Natrelle®; Allergan, Santa Barbara, CA, USA) and on human bodies. Human breast tissue was simulated using one of three materials, namely pig oil, soybean oil, or normal saline. Two common types of breast implants, the saline bag, and the silicone bag, were also selected, resulting in a total of 5 types of implants scanned using MRI.

2.2. MRI Scanning Parameters and Image Acquisition

All MRI scans were acquired using a GE Medical Systems Signa EXCITE HD, a 1.5-T scanner with a dedicated phased-array breast surface coil. To investigate the performances and characteristics of the MR signals from the 5 materials, the phantom was scanned using 6 sets of scan parameters: T1-weighted fast spin-echo (T1W FSE), T1W SPGR/60 degrees, T2-weighted (T2W), T2W fat-saturation, STIR, and STIR water-saturation. The specific parameters used are summarized in Table 1. When scanning either oil, silicone, or water, inversion recovery (IR) was adopted, applying a repetition time (TR) of 1600 ms, an echo time (TE) of 45 ms, and an inversion time (TI) that started at 50 ms and increased in 50 ms increments to 3000 ms. Signal changes and image contrast were then analyzed for these 3 materials.
Human bodies were scanned, applying the 3D SPGR fat-saturation dynamic contrast enhancement technique. After administering gadolinium, the synchronized scan was performed every minute for 5 min using a delayed-phase T1W fat-saturation.
The software GE Advantage Workstation 4.2 was used to further enhance dynamic curve processing, analyze development rates, and observe the wash-in and wash-out phenomena of the contrast agent in the blood. This allowed evaluation of the vascularity of the tumor or the perfusion and fade-away phenomena of the contrast agent through the arteries and tissues, distinguishing malignant breast tumors from benign siliconoma or normal mammary glands.
A saline bag and a silicone bag were placed under the left and right breasts, respectively, of each participant, and both were scanned simultaneously, as shown in Figure 1. The signals from normal mammary tissues, the saline bag, the silicone bag, and the phantom were compared to find saline and silicone leaks. Dynamic contrast-enhanced imaging was also performed to distinguish siliconoma from malignant breast tumors.

2.3. Scanning Participants who Received Fine-Needle Silicone Injections

Of the 15 women (30 breast implants) selected from those referred by a breast clinic at one institution, 10 received silicone injections, 2 received single-lumen silicone prostheses (1 also underwent a saline-bag mammoplasty), and 3 received single-lumen saline implants. Age range was 36 to 73 years. All participants were referred by clinical routine, and all images were retrospectively reviewed; therefore, informed consent was waived. This study was conducted according to the guidelines of the Declaration of Helsinki, and it was approved by the Ethics Committee of Yuanpei University of Medical Technology (Protocol Code 106-008, approved 08/2018).

2.4. Data Analysis

The images were de-identified and randomly interspersed for training an MRI radiologist with more than 25 years’ experience and a radiological technologist with 20 years’ experience how to use a signal grading scale. The scale used ratings that ranged from “+++” to indicate the strongest signal to “---” to indicate the weakest. Images of phantoms containing known materials were used as reference standards. After 1 month, the images were blinded and presented in a new random order to both readers. Finally, both readers repeated the entire process following the first assessment. All imaging signals were enhanced and quantified, then presented to the readers, who independently scored the signal intensities of the breast glandular tissues, tumors, and benign lesions (granulomas/siliconomas), resolving disagreements by consensus. Results are shown in Table 2.

3. Results

One participant had breast carcinoma proven by her history, 3 silicone implants leaked, and all participants had siliconomas. Figure 2 shows scans of implants made with silicone, oil, or saline.
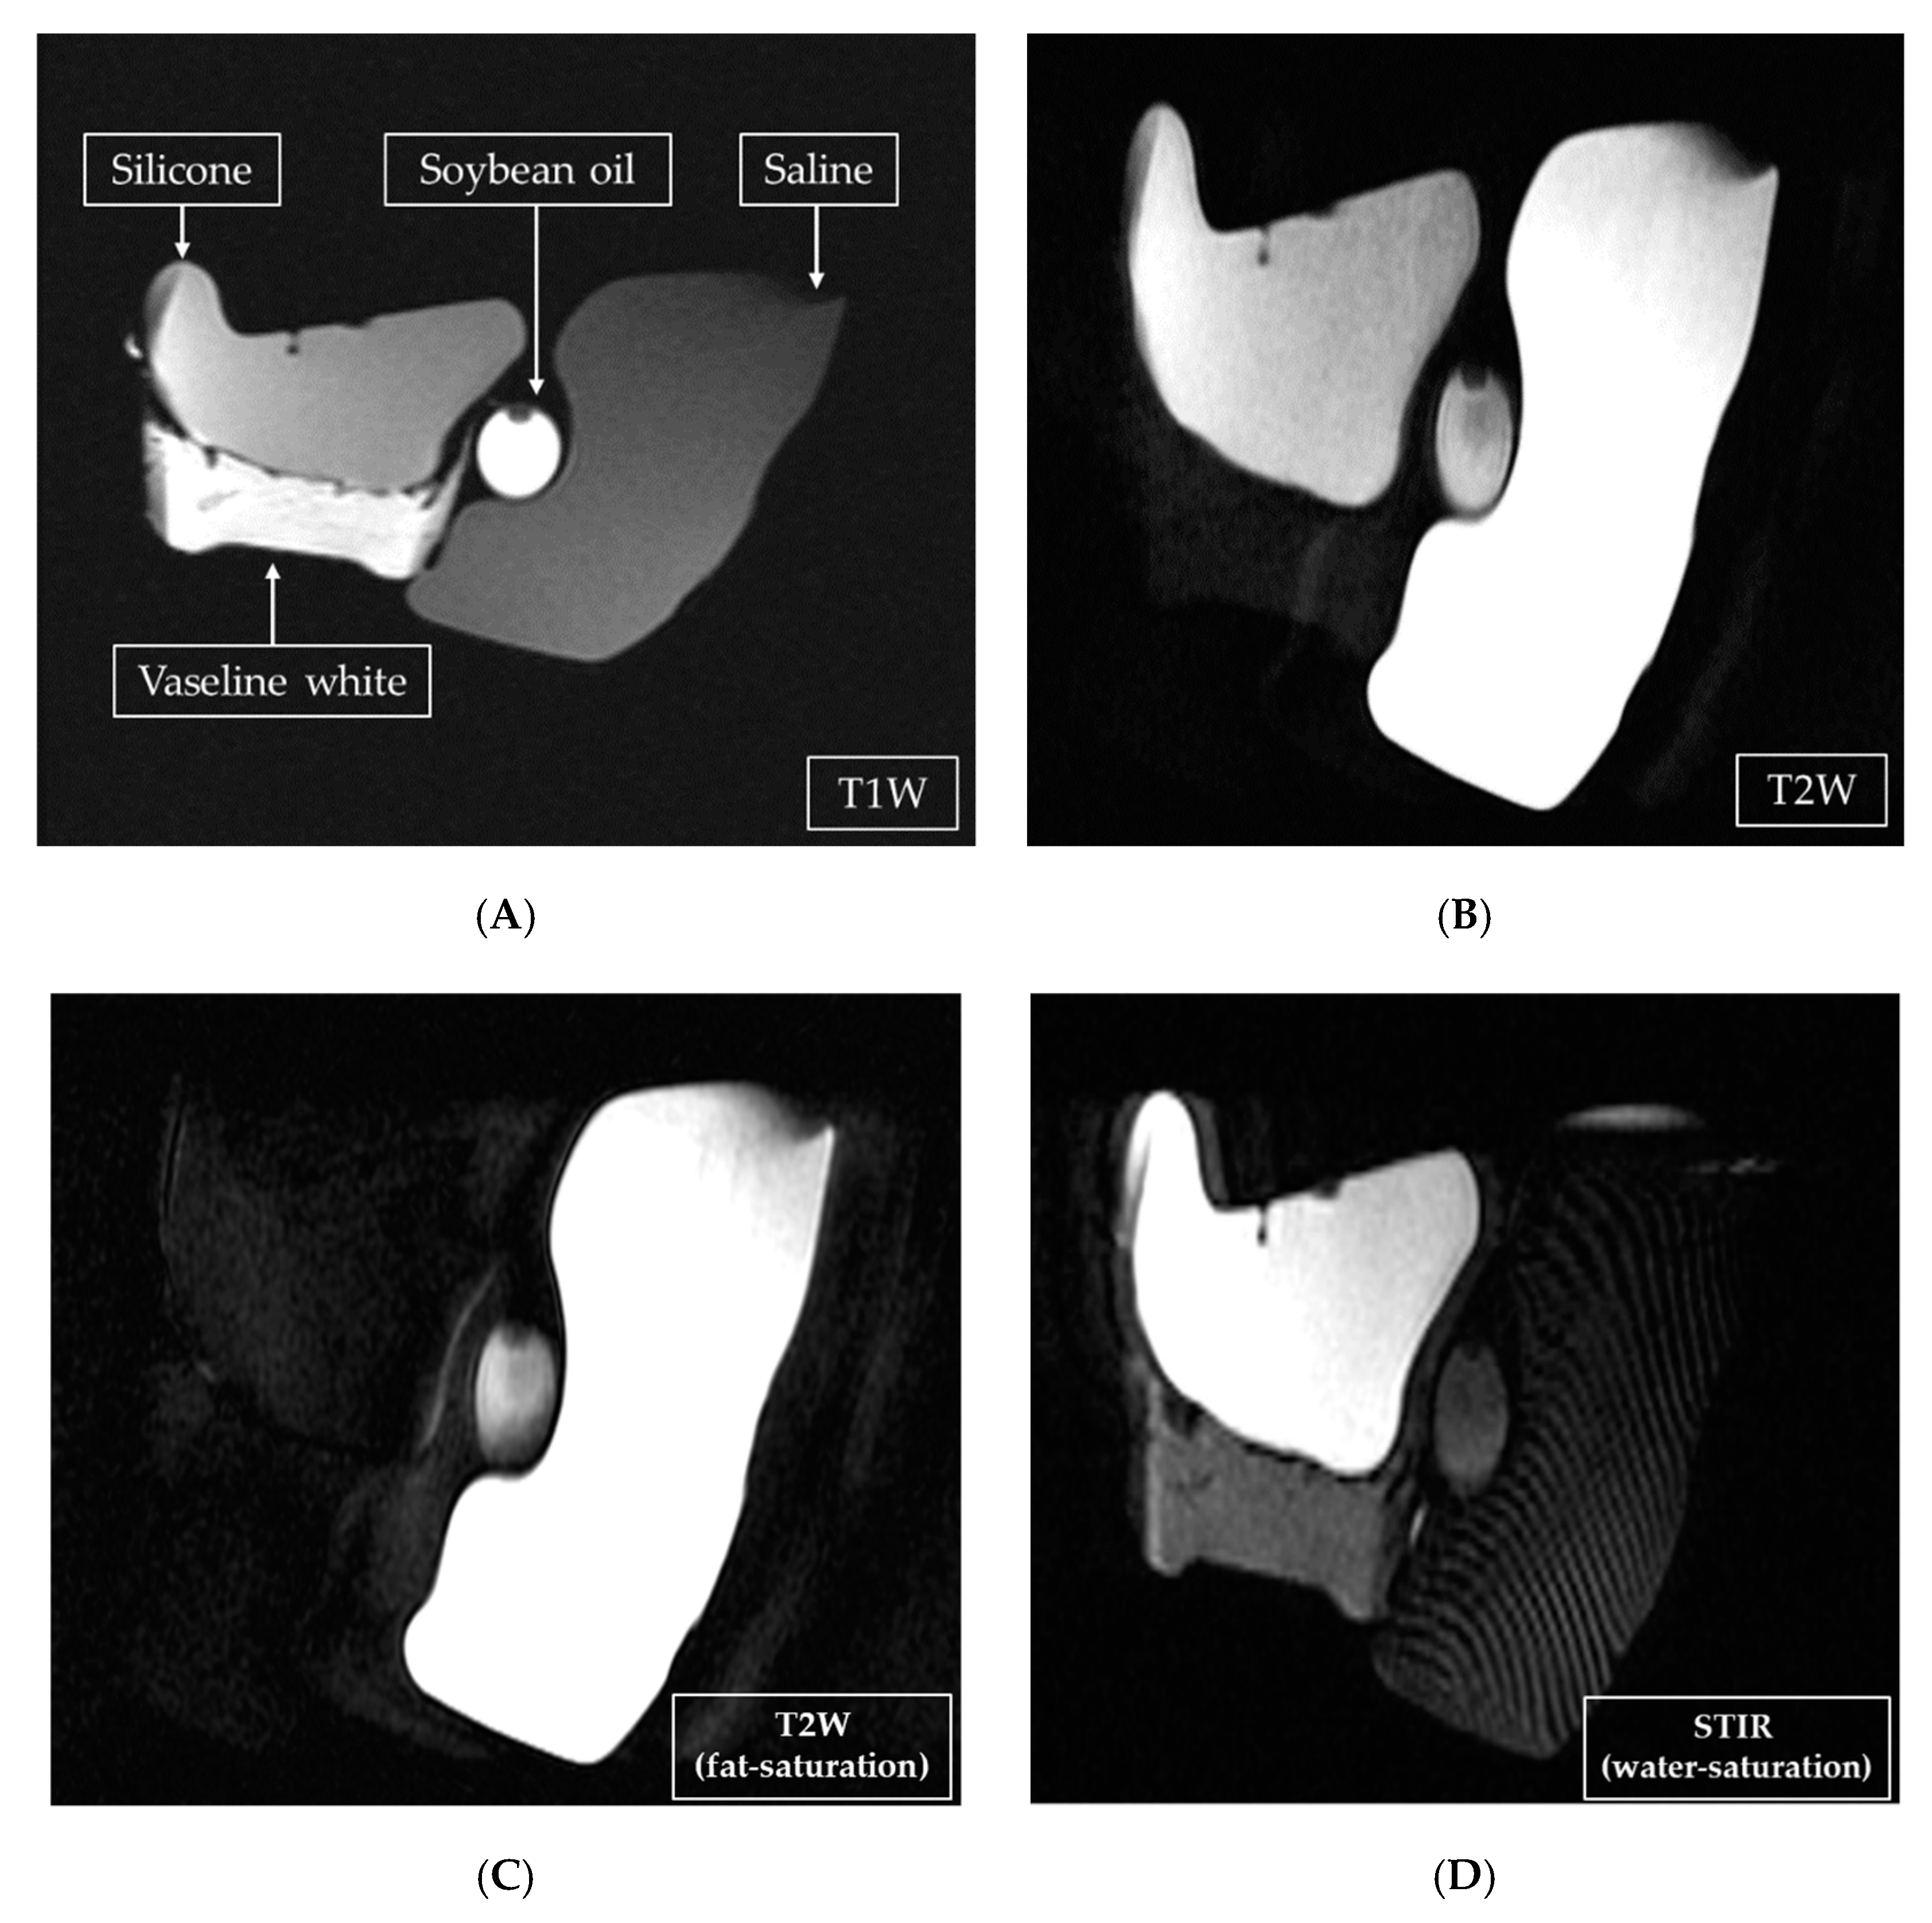
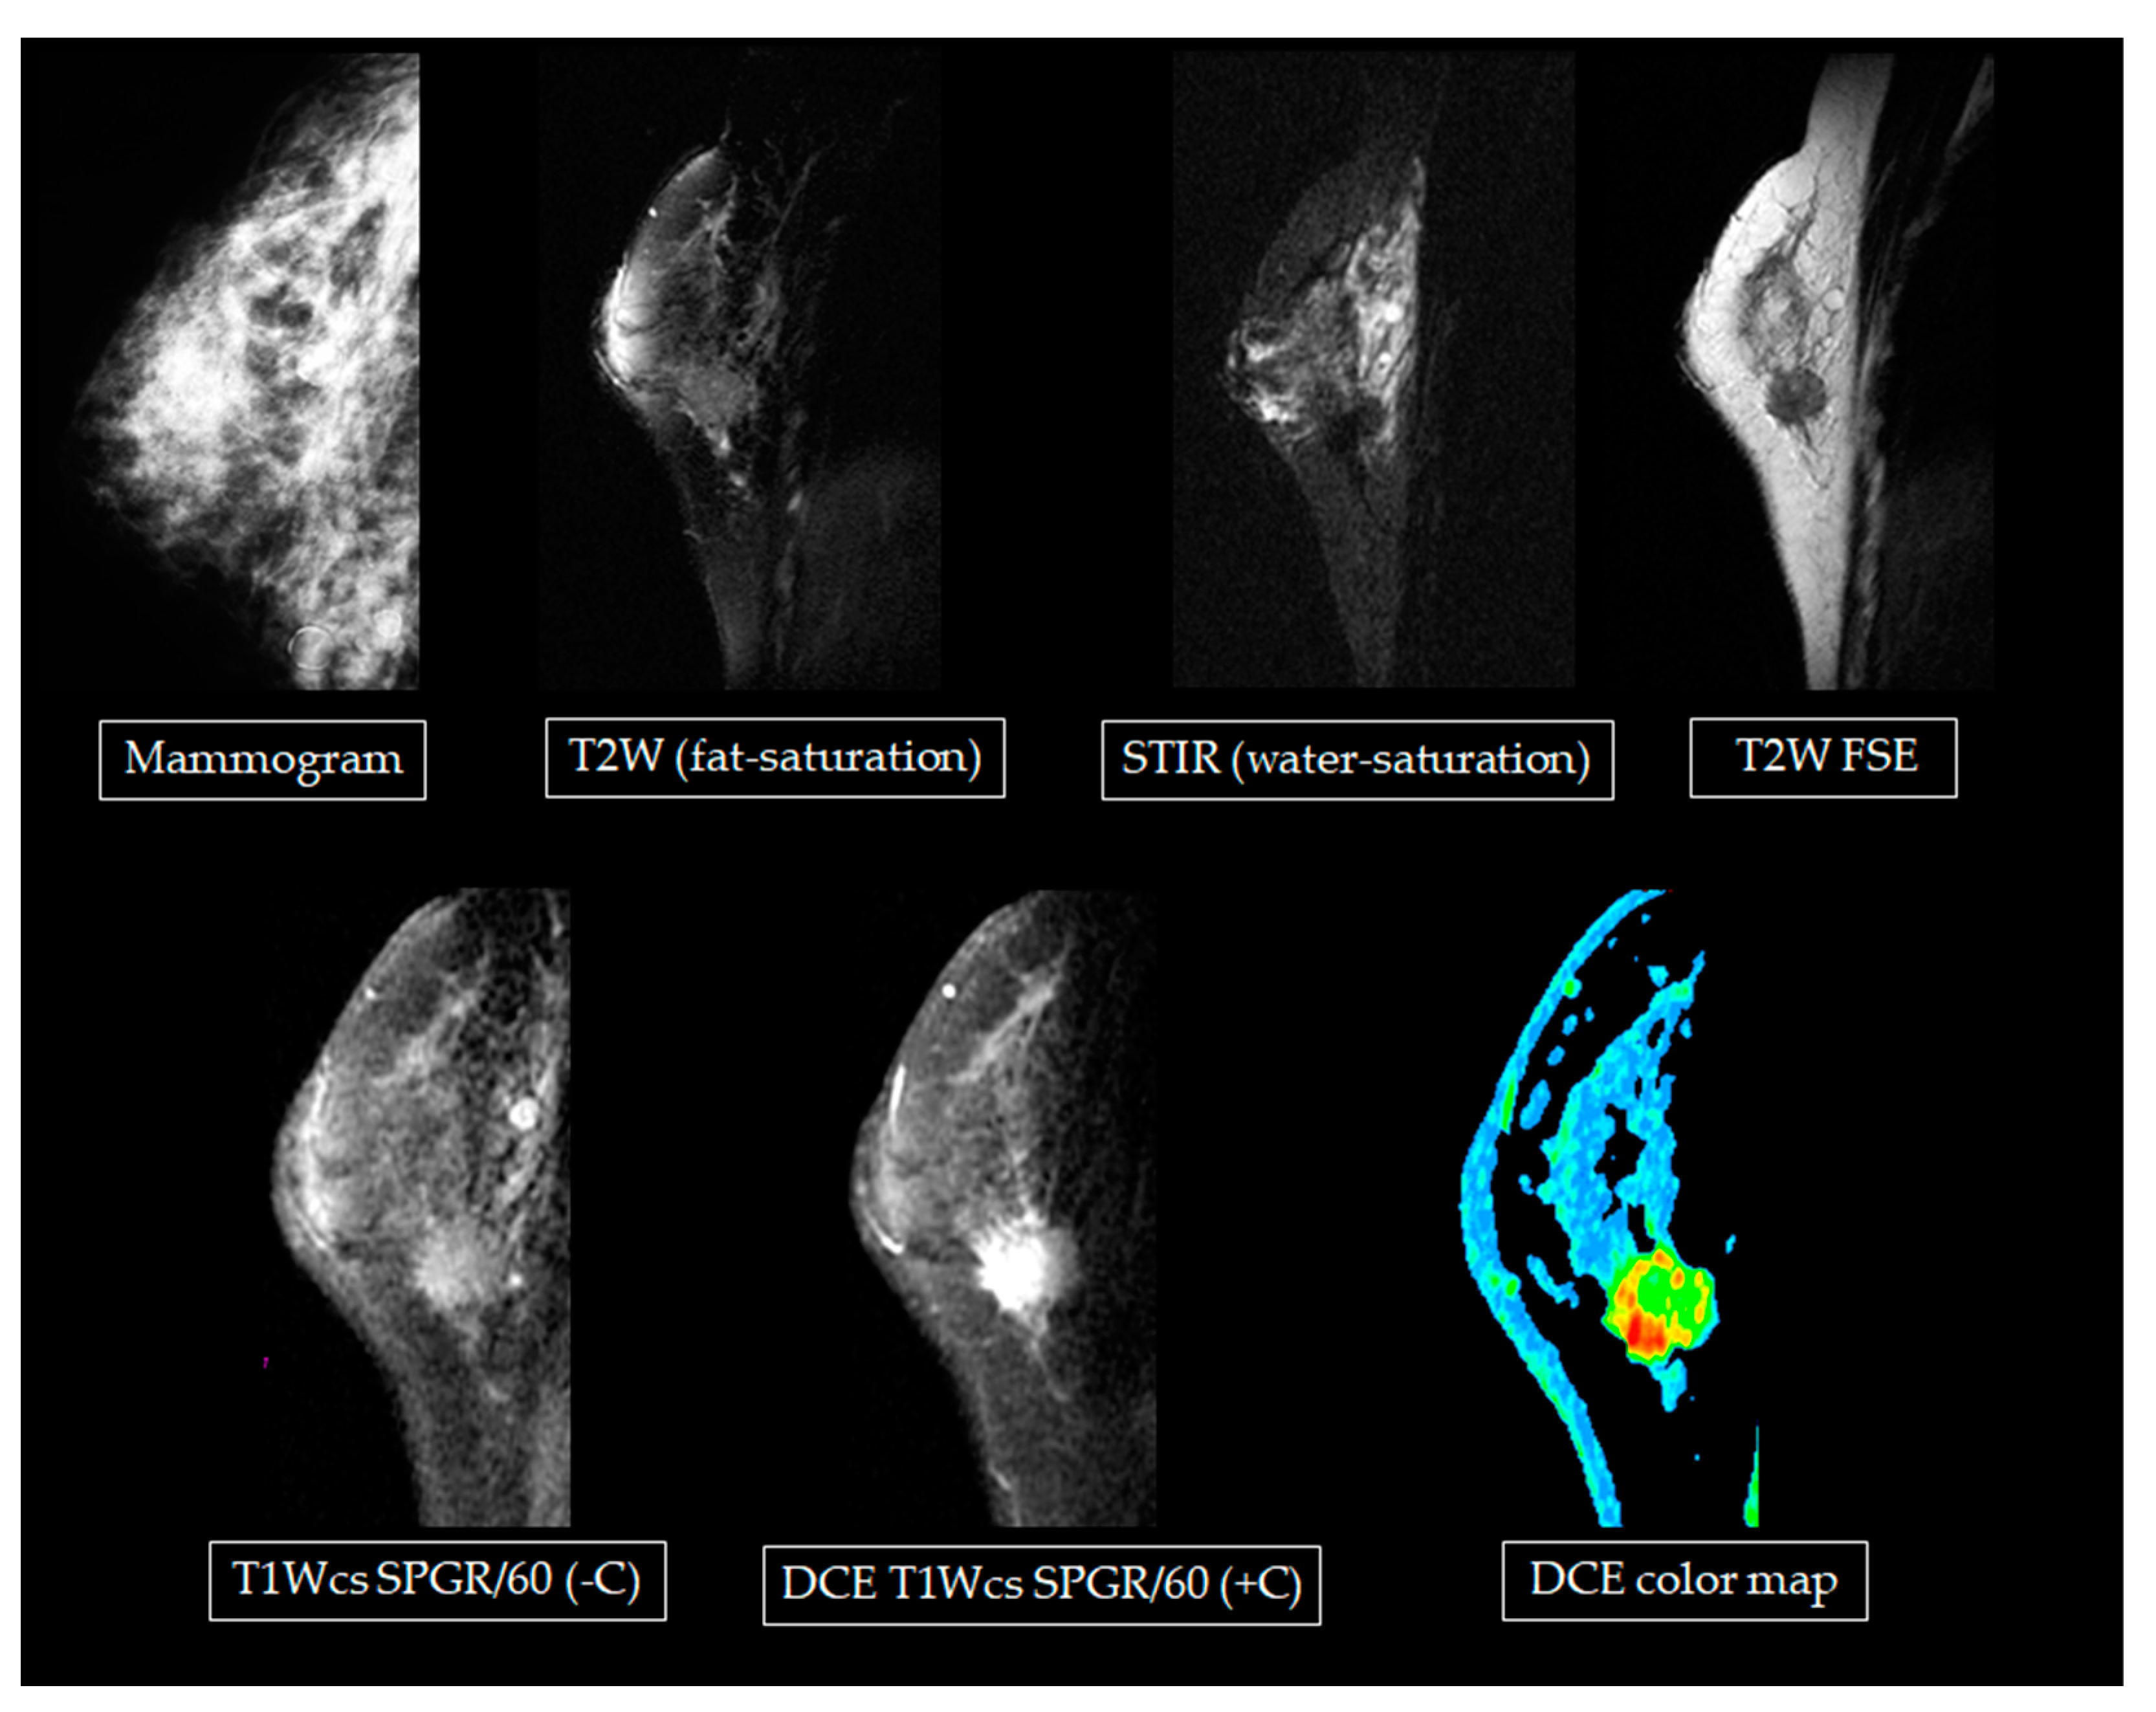
The T2W FSE technique provided the strongest signal intensity from the saline-bag implant but the weakest from the silicone-bag implant, resulting in the greatest difference between the two. The STIR water-saturation technique also resulted in the greatest difference between the two, but in the opposing direction—it provided the strongest signal intensity from the silicone-bag implant and the weakest from the saline-bag implant. Breast cancer was distinguishable only when dynamic contrast enhancement was added. Signal intensity from cancerous tissue was rated “+++”, whereas those from mammary glands and saline-bag implants were rated “+”. The rating of “-” given to silicone was also relatively high in contrast, as shown in Figure 3.
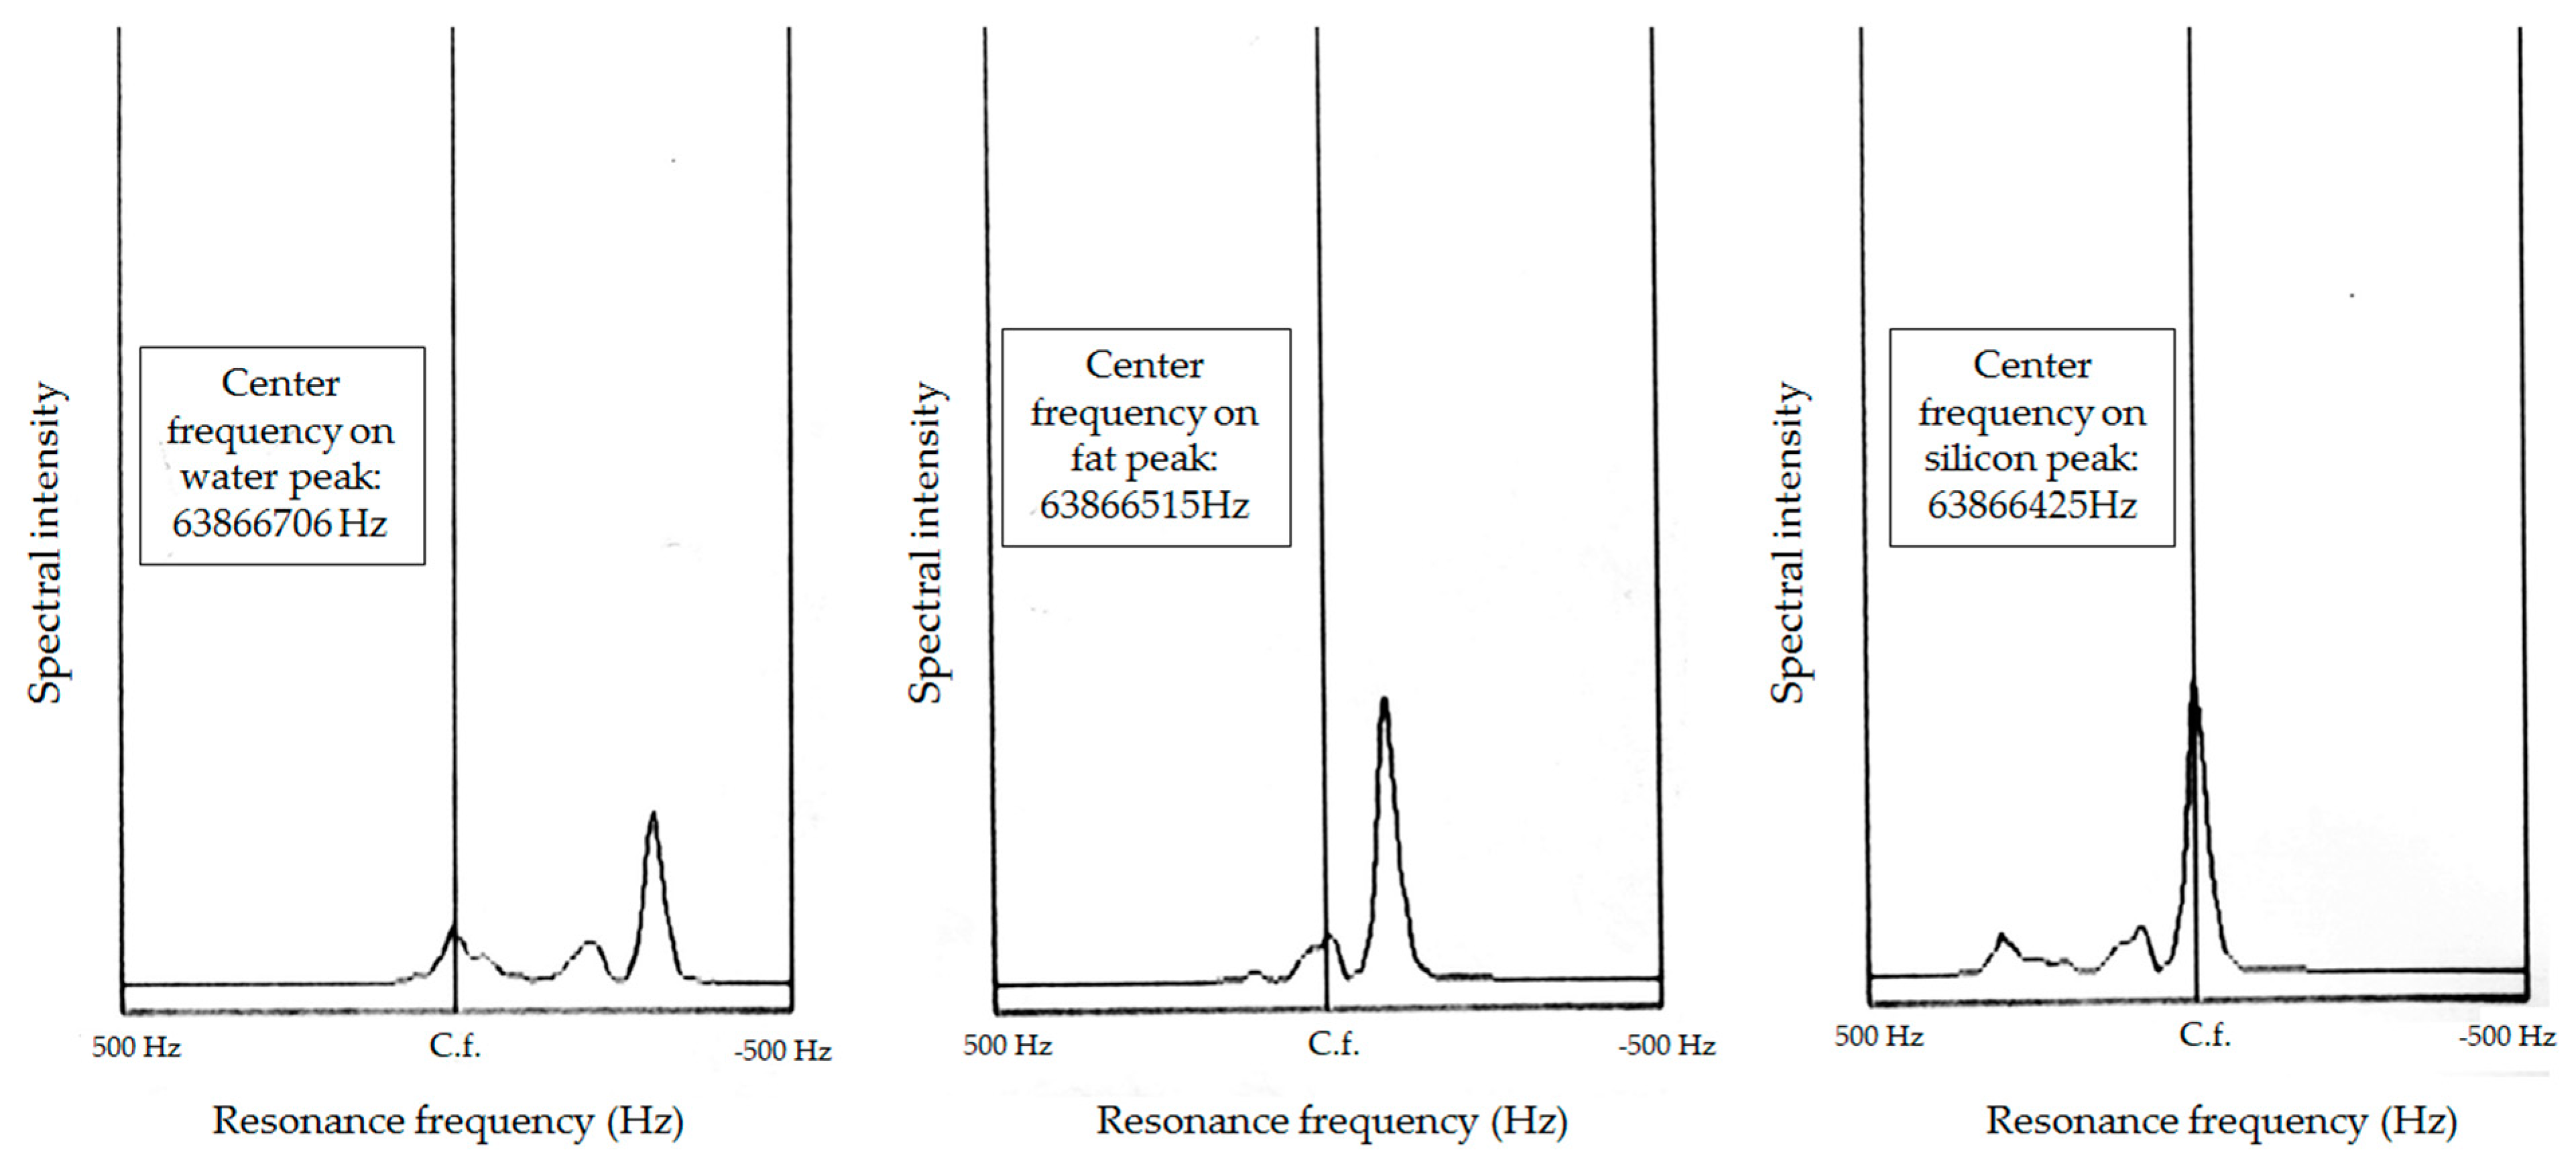
Figure 4 shows MR images of a participant who received fine-needle injections for augmentation. Magnetic resonance spectroscopy was also applied to the silicone bag, saline bag, and human breast fat for analysis and comparisons. Results are shown in Figure 5. The center frequencies of water, fat, and silicone were 63,876,706 Hz, 63,876,515 Hz, and 63,876,425 Hz, respectively. These differences allowed the chemical shift saturation technique to be applied with STIR (cf-fat, water-saturation) to further remove the signals from water and from fat in a more precise way.
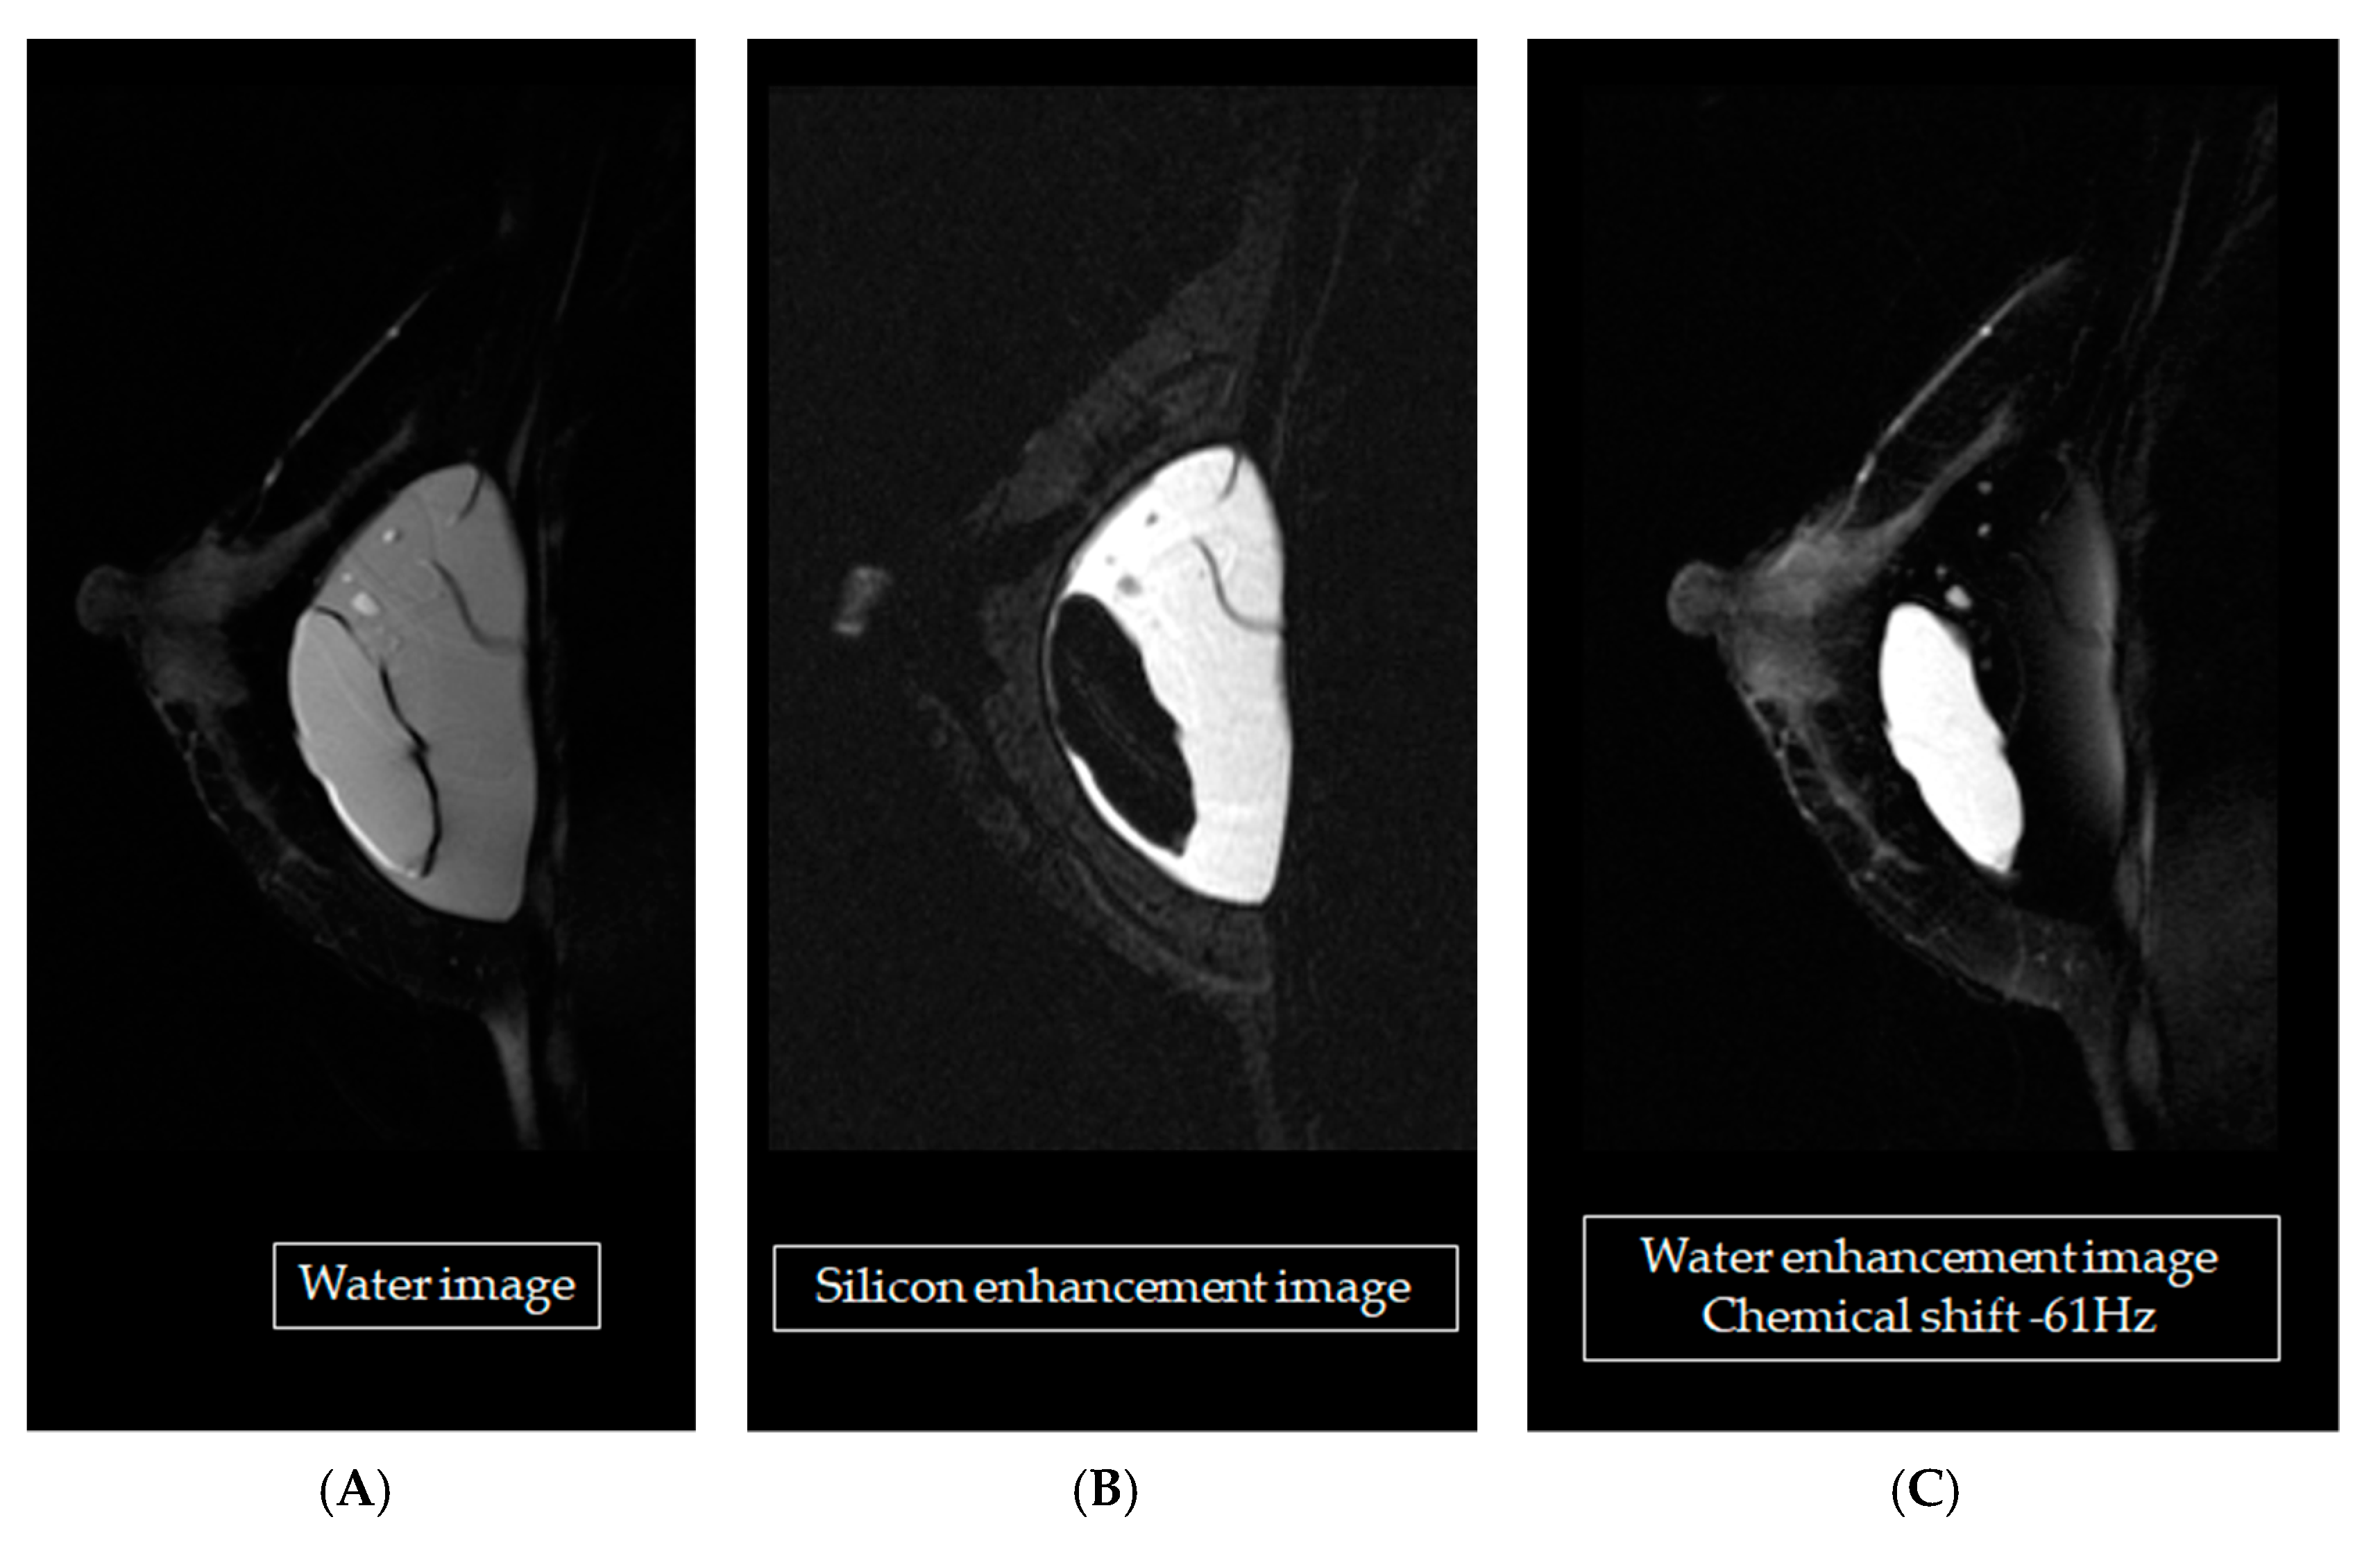
One of our 25 participants had both silicone and saline bags implanted, as shown in Figure 6. Using two MRI techniques, STIR water-saturation, and T2W fat-saturation, the silicone in the images could be enhanced, as shown in Figure 6B. Using chemical saturation at the silicone frequency (+220 Hz) or the water frequency (6,386,706 Hz—61 Hz = 63,876,645 Hz) removed the silicone signals to obtain a water-enhanced image, as shown in Figure 6C. Both techniques were applied to identify the location of a leak, if any. Using any one technique (STIR water-saturation, T2W fat-saturation, or fluid-attenuated inversion recovery) could not allow breast cancer to be diagnosed, but adding dynamic contrast enhancement did allow that diagnosis. This conclusion was consistent with the literature [20].
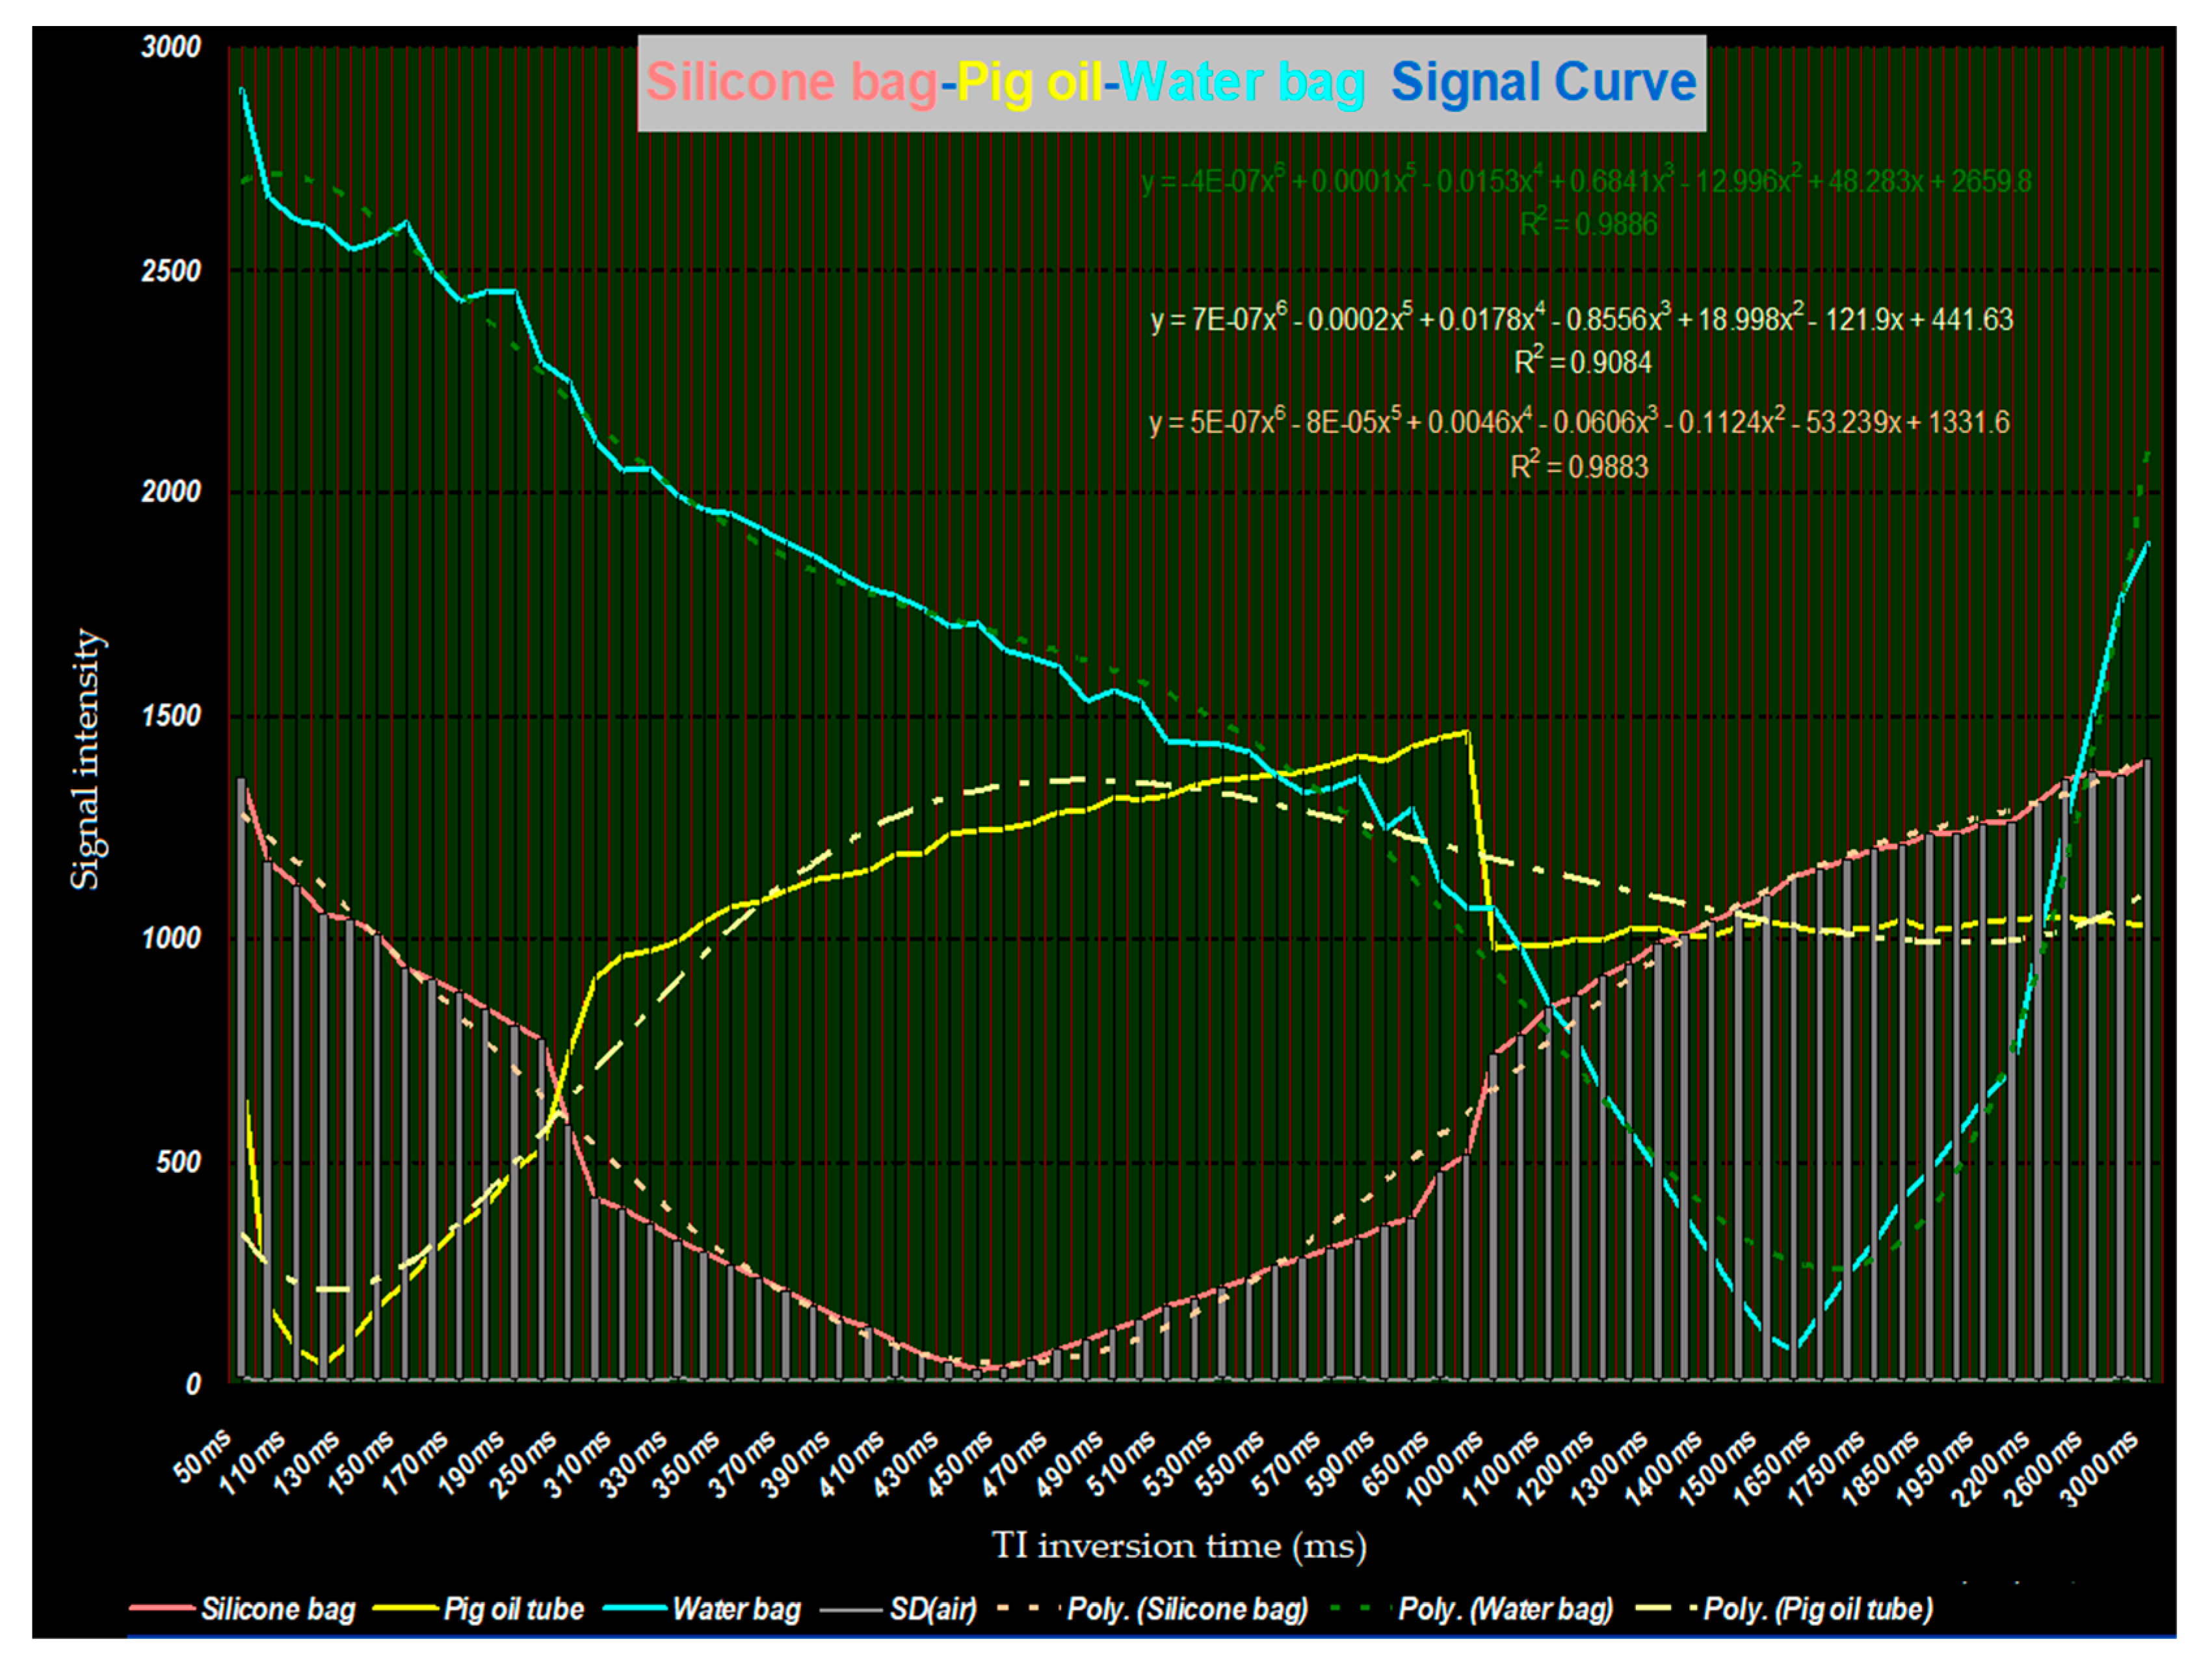
Besides using STIR water-saturation to obtain the silicone-enhanced image and T2W fat-saturation to obtain the water-enhanced image, IR was also adopted to change TI while scanning silicone, oil, and saline, measuring the corresponding signal intensity. The inversion equation is:
S = So * (1 − 2e –t/T1),
where S represents Signal intensity; t: Inversion Time (TI); T1: Longitudinal relaxation time.
After obtaining the null point of each material, this equation was applied to obtain T1 [21]. Polynomial smooth curves were added as shown in Figure 7. Using STIR and TI = 130 ms, the signal intensity of fat was at its lowest, and silicone, then water was greater. When TI was between 440 ms and 450 ms, the signal intensity of silicone was at its lowest, and oil, then water was greater. At TI = 1600 ms, the signal for water was at its lowest. Its intensity rapidly increased as TI either increased or decreased from this point.

4. Discussion

In this study, MRI scans of implants were initially conducted to identify the qualitative characteristics of each material’s signals. The signals of various tissues were then compared.
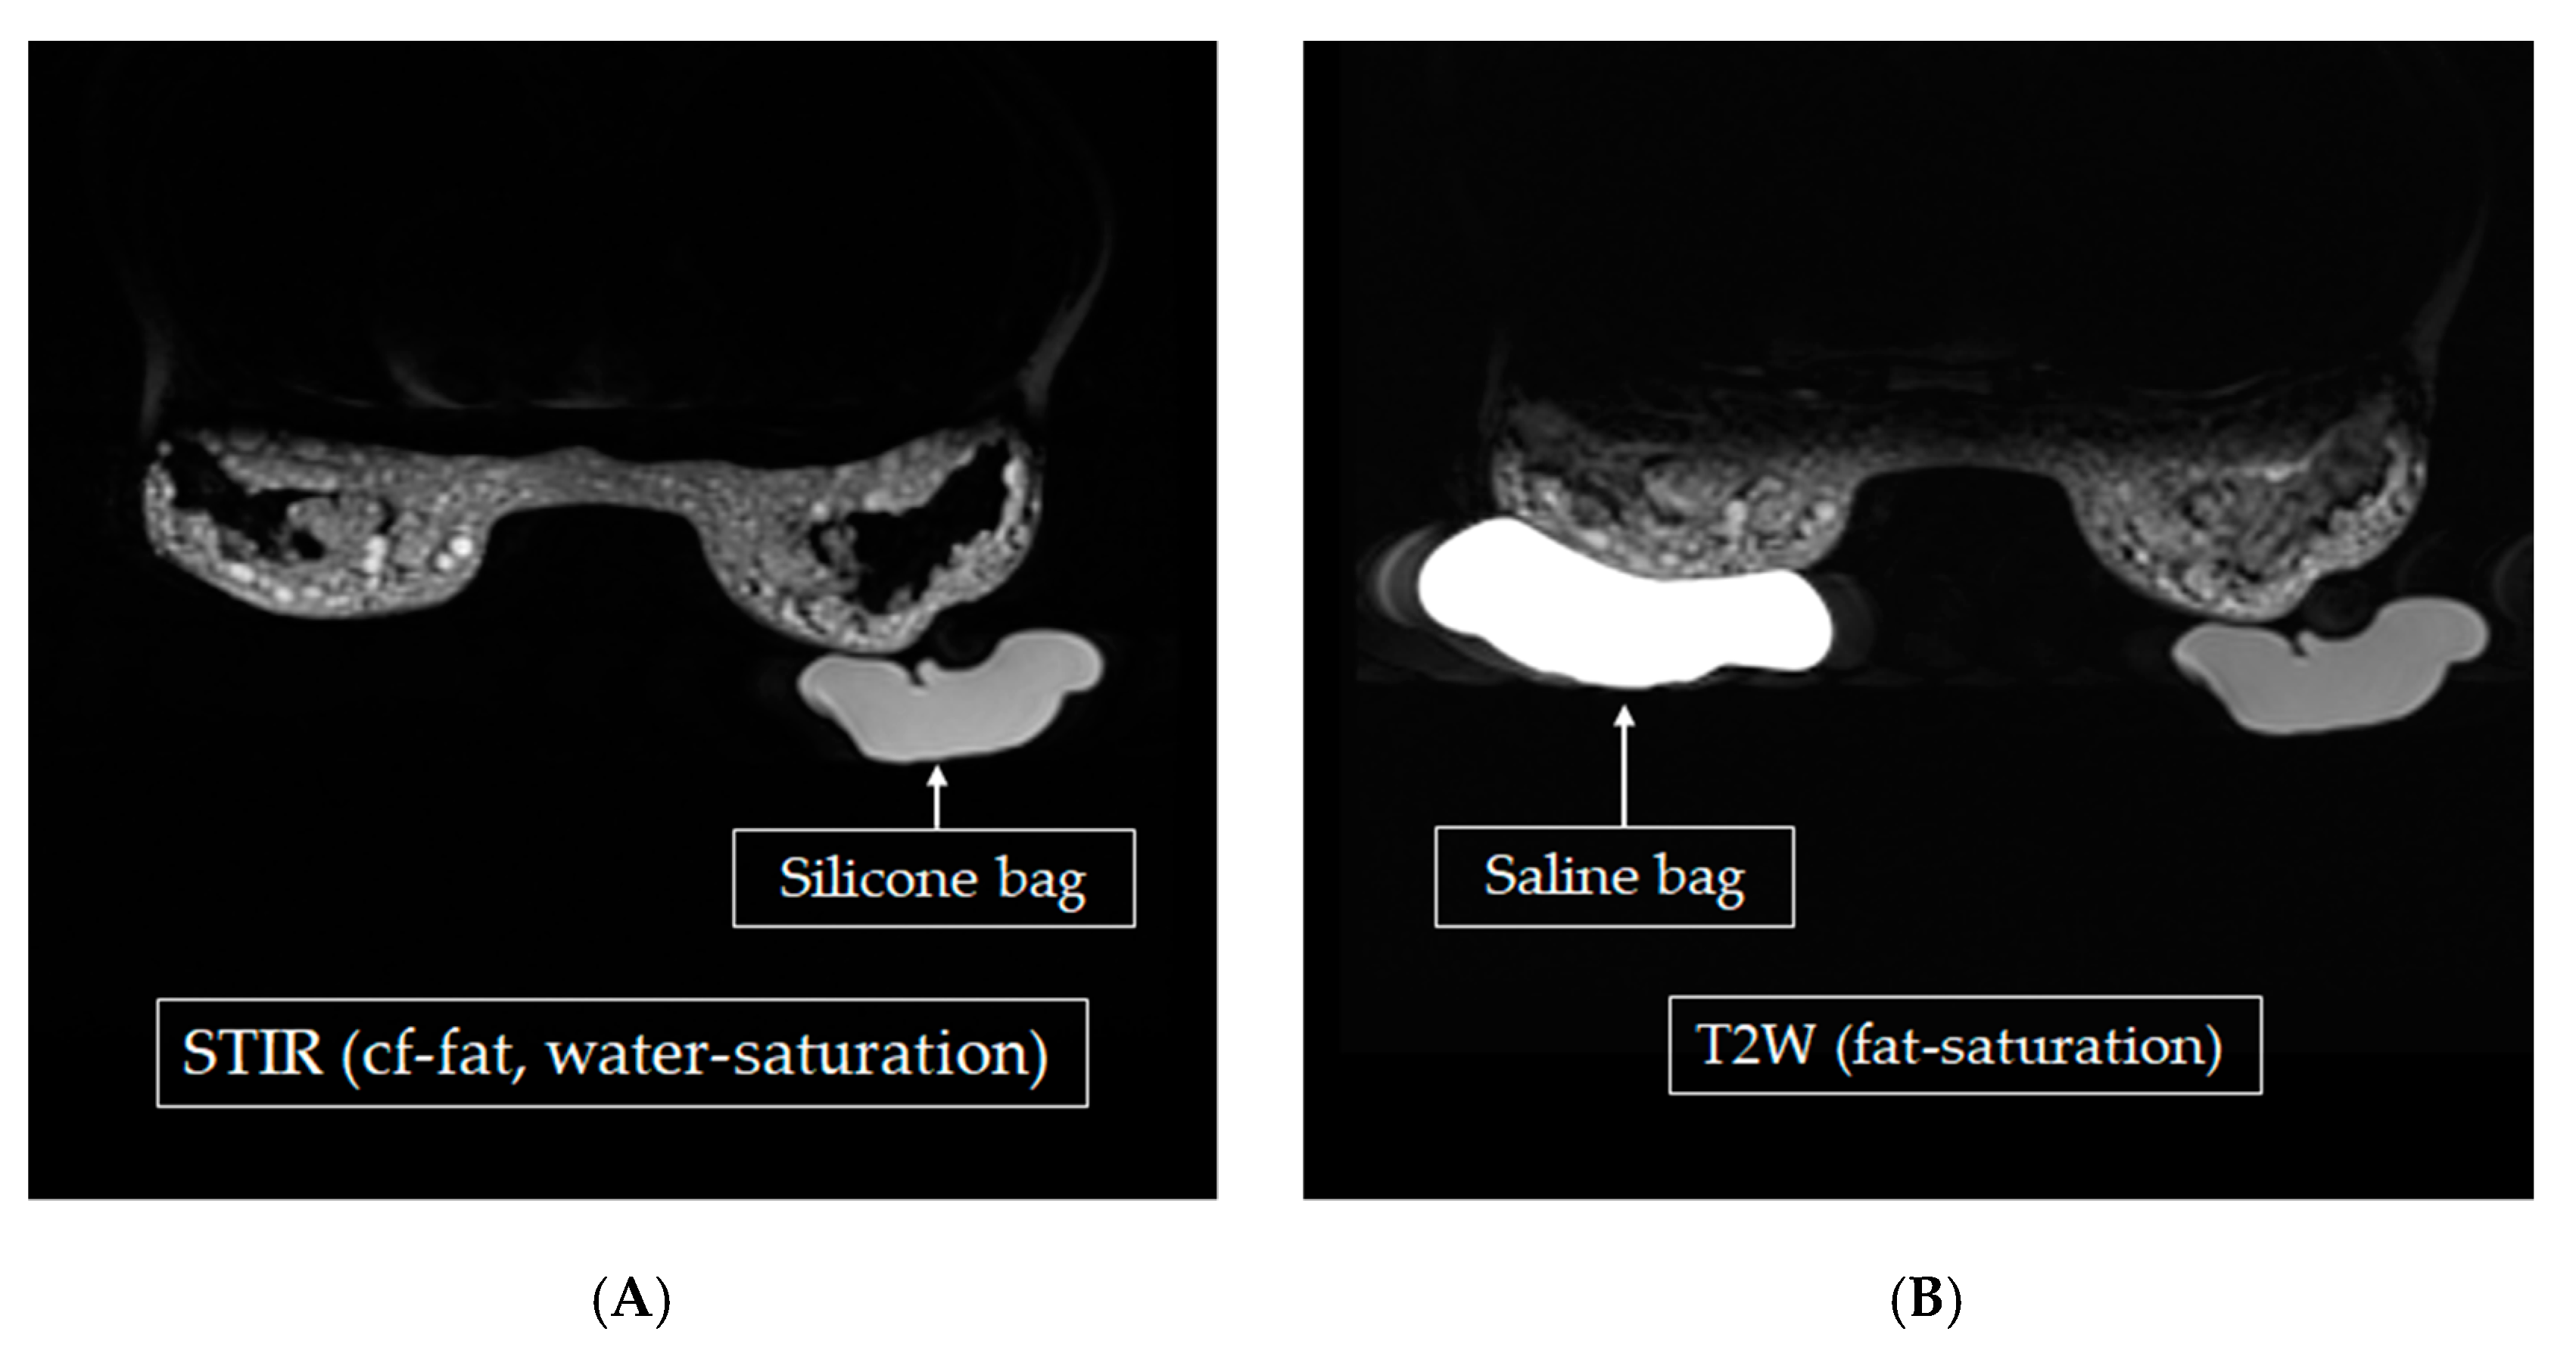
Special MRI techniques were developed and applied to breast implants made from a variety of materials. The use of STIR water-saturation to obtain silicone-enhanced images can help diagnose leakage from silicone-bag implants, as shown in Figure 4A, but the use of T2W fat-saturation to obtain water-enhanced images can help diagnose leakage from saline-bag implants, as shown in Figure 4B. Both these imaging techniques are based on the chemical saturation technique, which suppresses signals from water and fat or fat and silicone while enhancing signals from other tissues, further enhancing the specific tissue contrast. As shown in Figure 4A, a silicone-enhanced image using STIR water-saturation with TI values allows the fat signals to fall on the null point. Resonance frequency tuning was also performed for fat (about 63,866,515 Hz). The frequency difference between 1.5 T oil and water is 220 Hz. Therefore, the signals from oil and water were shifted by +220 Hz from the center frequency of fat. The silicone signals were not influenced (it has a resonance frequency of about 636,686,425 Hz). As shown in Figure 4B, a water-enhanced image is achieved using T2W fat-saturation with FSE aimed at the resonance frequency of water (about 63,866,706 Hz) with radiofrequency excitation. Moreover, the chemical shift saturation technique was applied at the water center frequency–191 Hz (the fat center frequency was about 63,866,515 Hz) to remove the signals from fat completely. As the frequency difference between silicone (63,866,425 Hz) and water (63,866,706 Hz) is -281 Hz, as shown in Figure 5, the intensity of the silicone signals was relatively low, allowing a rather high image contrast for the signals from water. As the chemical shift saturation technique is constrained by magnetic homogeneity, and the frequency difference between oil and water is only 191 Hz using auto-tuning, a silicone peak could easily be mistaken for a fat peak, leading to incomplete chemical shift saturation when applying STIR water-saturation and T2W fat-saturation.
Moreover, MRI scanners can vary in magnetic field strength, leading to different T1 values. As a result, the frequency difference between oil and water might not always be 220 Hz, influencing the effect of the chemical shift saturation technique. Taken together, the recommended T1 value for STIR water saturation is between 150 ms and 170 ms. However, in reality, when the fat signals reach the null point, the corresponding T1 values were between 120 ms and 140 ms. This theory can also indirectly influence the frequency difference between oil and water (approximately 200 Hz to 210 Hz).
With these three points in mind, we suggest that when applying either STIR water-saturation or T2W fat-saturation, fine-tuning should be performed to confirm the center frequencies of water, fat, and silicone. In addition, because the influence of magnetic homogeneity on IR is rather small, simply making use of each tissue’s null point characteristics by setting up the TI value to achieve specific suppression would allow confirmation of a material’s identity between water, fat, and silicone. In this study, when STIR water-saturation was applied, optimized fat suppression was achieved when TI = 130 ms, and optimized silicone suppression was achieved when TI = 440 ms to 450 ms. We also found that when using fluid-attenuated inversion recovery and TI = 1600 ms, the signals of pure water were completely suppressed. Signal intensity rapidly increased as TI varied from this point. In other words, the slope of the curve was steep to either side of this point. This study is very valuable for distinguishing bound water from free water for clinical diagnoses.
This study is limited by its small number of participants. However, it was focused on technical development, and the participants were used to prove observations made using images of phantoms. A major limitation is its lack of quantitative analysis. However, in addition to validating the phantom study, our human study focused on real-life practices using visual interpretations. Further studies recruiting more participants and including a statistical analysis are necessary.

5. Conclusions

Siliconoma caused by silicone-bag implants or silicone gel injections can be a source of patient anxiety, and it can influence the results of breast cancer diagnoses. This study highlights a means of differentiating siliconoma or breast implant leaks. To obtain silicone-enhanced images, STIR water-saturation with water suppression is an excellent technique in that it achieves tissue contrast when silicone implants are present. Water-enhanced images obtained using T2W fat-saturation with fat suppression should be used when saline implants are present. Both techniques are especially useful for distinguishing normal mammary glands from siliconoma.

Author Contributions

Conceptualization, M.-F.L.; methodology, M.-F.L.; validation, L.-H.L.; formal analysis, W.-T.H.; writing—original draft preparation, M.-F.L.; writing—review and editing, L.-H.L.; supervision and project administration, W.P.C. and M.M.-S.Y. All authors have read and agreed to the published version of the manuscript.

Funding

This research received no external funding.

Institutional Review Board Statement

The study was conducted according to the guidelines of the Declaration of Helsinki, and approved by the Ethics Committee of Yuanpei University of Medical Technology (protocol code YPU-IRB-1091203 and 12/2020 of approval).

Informed Consent Statement

Informed consent was obtained from all subjects involved in the study.

Data Availability Statement

No new data were created or analyzed in this study. Data sharing is not applicable to this article.

Acknowledgments

We would like to thank the colleagues in the Department of Radiology, Wan Fang Hospital for their assistance.

Conflicts of Interest

The authors declare no conflict of interest.

References

  1. Lalani, T. Breast implant infections: An update. Infect. Dis. Clin. 2018, 32, 877–884. [Google Scholar] [CrossRef] [PubMed]
  2. Washer, L.L.; Gutowski, K. Breast implant infections. Infect. Dis. Clin. 2012, 26, 111–125. [Google Scholar] [CrossRef] [PubMed]
  3. Hölmich, L.R.; Friis, S.; Fryzek, J.P.; Vejborg, I.M.; Conrad, C.; Sletting, S.; Olsen, J.H. Incidence of silicone breast implant rupture. Arch. Surg. 2003, 138, 801–806. [Google Scholar] [CrossRef] [PubMed] [Green Version]
  4. Hillard, C.; Fowler, J.D.; Barta, R.; Cunningham, B. Silicone breast implant rupture: A review. Gland Surg. 2017, 6, 163. [Google Scholar] [CrossRef] [PubMed] [Green Version]
  5. Bretaudeau, C.; Vaysse, C.; Guerby, P.; Lairez, O.; Soule-Tholy, M.; Vidal, F.; Chantalat, E. Pericarditis after breast implant rupture: A case report. Cardiol. Res. 2018, 9, 381. [Google Scholar] [CrossRef] [PubMed]
  6. Doren, E.L.; Miranda, R.N.; Selber, J.C.; Garvey, P.B.; Liu, J.; Medeiros, L.J.; Butler, C.E. U.S. epidemiology of breast implant-associated anaplastic large cell lymphoma. Plast. Reconstr. Surg. 2017, 139, 1042–1050. [Google Scholar] [CrossRef] [PubMed]
  7. Seiler, S.J.; Sharma, P.B.; Hayes, J.C.; Ganti, R.; Mootz, A.R.; Eads, E.D.; Evans, W.P. Multimodality imaging-based evaluation of single-lumen silicone breast implants for rupture. Radiographics 2017, 37, 366–382. [Google Scholar] [CrossRef] [PubMed]
  8. Spear, S.L.; Murphy, D.K.; Allergan Silicone Breast Implant U.S. Core Clinical Study Group. Natrelle round silicone breast implants: Core Study results at 10 years. Plast. Reconstr. Surg. 2014, 133, 1354–1361. [Google Scholar] [CrossRef] [PubMed] [Green Version]
  9. Di Benedetto, G.; Cecchini, S.; Grassetti, L.; Baldassarre, S.; Valeri, G.; Leva, L.; Bertani, A. Comparative study of breast implant ruptures using mammography, sonography, and magnetic resonance imaging: Correlation with surgical findings. Breast J. 2008, 14, 532–537. [Google Scholar] [CrossRef] [PubMed]
  10. O’Toole, M.; Caskey, C.I. Imaging spectrum of breast implant complications: Mammography, ultrasound, and magnetic resonance imaging. Semin. Ultrasound CT MR. 2000, 21, 351–361. [Google Scholar] [CrossRef]
  11. Saunders, W.B.; Everson, L.I.; Parantainen, H.; Detlie, T.; Stillman, A.E.; Olson, P.N.; Landis, G.; Griffiths, H.J. Diagnosis of breast implant rupture: Imaging findings and relative efficacies of imaging techniques. AJR Am. J. Roentgenol. 1994, 163, 57–60. [Google Scholar]
  12. Gomi, N.; Kikuchi, M.; Matsumoto, A.; Tanakura, K.; Sawaizumi, M.; Yano, T.; Ohno, S. Comparison of usefulness of ultrasound and MRI for diagnosis of silicone breast implant rupture in screening asymptomatic women. In Proceedings of the European Congress of Radiology, Vienna, Austria, 15–19 July 2020. [Google Scholar]
  13. Stivala, A.; Rem, K.; Leuzzi, S.; Moris, V.; François, C.; Revol, M.; Cristofari, S. Efficacy of ultrasound, mammography and magnetic resonance imaging in detecting breast implant rupture: A retrospective study of 175 reconstructive and aesthetic sub-pectoral breast augmentation cases. J. Plast. Reconstr. Aesthet. Surg. 2017, 70, 1520–1526. [Google Scholar] [CrossRef]
  14. Fleury, E.D.F.C.; Gianini, A.C.; Ayres, V.; Ramalho, L.C.; Seleti, R.O.; Roveda, D. Breast magnetic resonance imaging: Tips for the diagnosis of silicone-induced granuloma of a breast implant capsule (SIGBIC). Insights Imaging 2017, 8, 439–446. [Google Scholar] [CrossRef] [PubMed]
  15. Maijers, M.C.; Niessen, F.B.; Veldhuizen, J.F.H.; Ritt, M.J.P.F.; Manoliu, R.A. MRI screening for silicone breast implant rupture: Accuracy, inter- and intraobserver variability using explanation results as reference standard. Eur. Radiol. 2014, 24, 1167–1175. [Google Scholar] [CrossRef] [PubMed]
  16. Rietjens, M.; Villa, G.; Toesca, A.; Rizzo, S.; Raimondi, S.; Rossetto, F.; Petit, J.Y. Appropriate use of magnetic resonance imaging and ultrasound to detect early silicone gel breast implant rupture in postmastectomy reconstruction. Plast. Reconstr. Surg. 2014, 134, 13–20. [Google Scholar] [CrossRef]
  17. Lindenblatt, N.; El-Rabadi, K.; Helbich, T.H.; Czembirek, H.; Deutinger, M.; Benditte-Klepetko, H. Correlation between MRI results and intraoperative findings in patients with silicone breast implants. Int. J. Womens Health 2014, 6, 703. [Google Scholar] [CrossRef] [Green Version]
  18. Song, J.W.; Kim, H.M.; Bellfi, L.T.; Chung, K.C. The effect of study design biases on the diagnostic accuracy of magnetic resonance imaging to detect silicone breast implant ruptures: A meta-analysis. Plast. Reconstr. Surg. 2011, 127, 1029. [Google Scholar] [CrossRef] [PubMed] [Green Version]
  19. Shah, A.T.; Jankharia, B.B. Imaging of common breast implants and implant-related complications: A pictorial essay. Indian J. Radiol. Imaging 2016, 26, 216. [Google Scholar] [CrossRef]
  20. Chuangsuwanich, A.; Warnnissorn, M.; Lohsiriwat, V. Siliconoma of the breasts. Gland Surg. 2013, 2, 46. [Google Scholar] [PubMed]
  21. Hashemi, R.H.; Bradley, W.G.; Lisanti, C.J. MRI: The Basics; Lippincott Williams & Wilkins: Philadelphia, PA, USA, 2012. [Google Scholar]
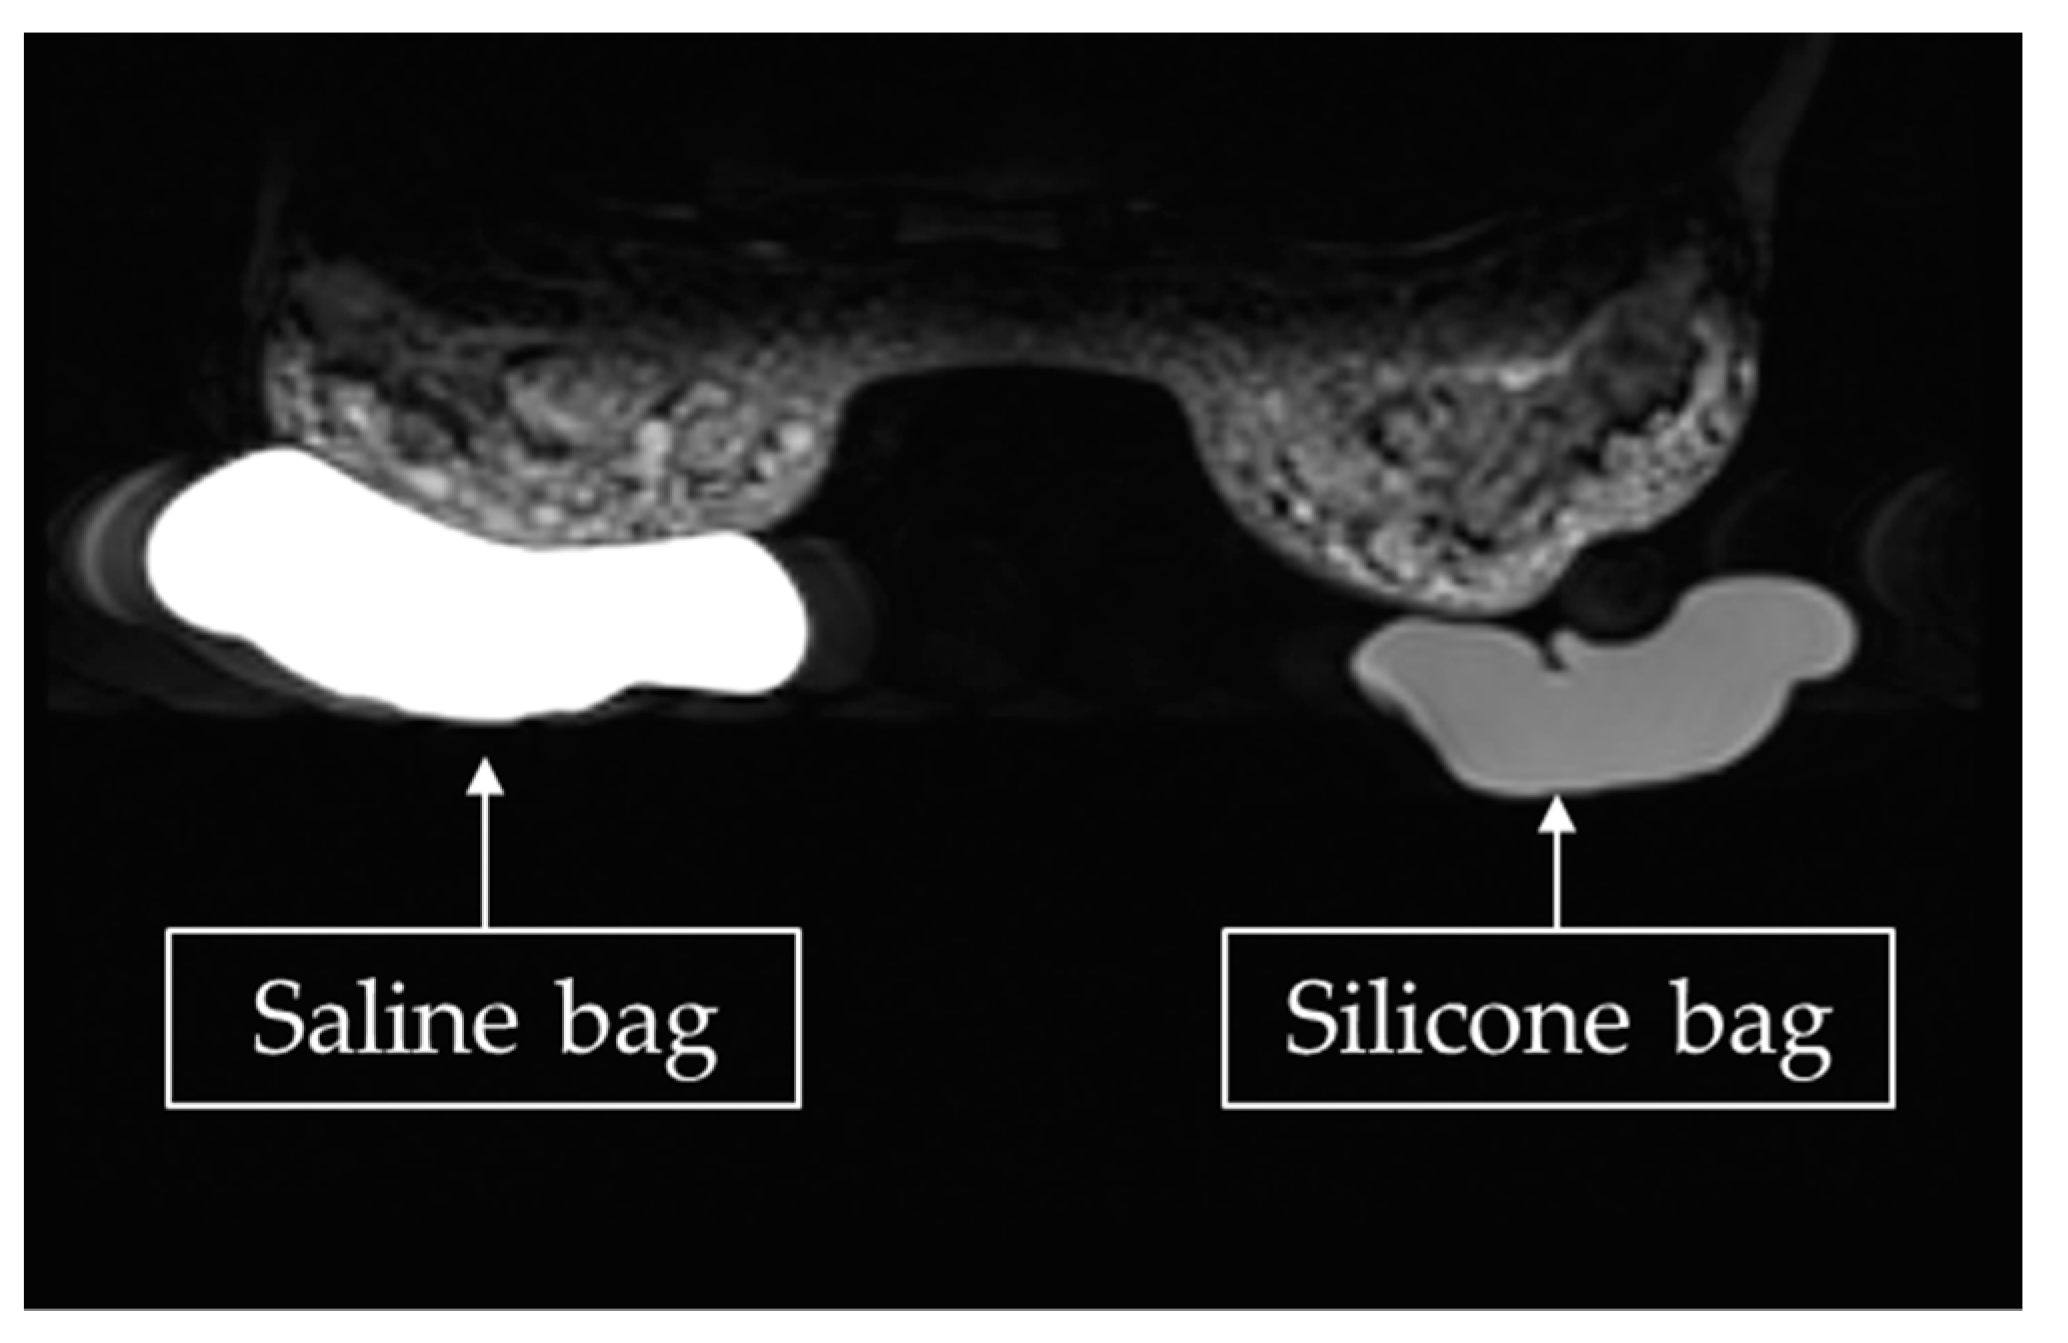
Figure 1. A magnetic resonance image comparing silicone-injected augmented breasts with a saline bag and a silicone bag, each placed under a breast.
Applsci 11 03434 g001
Figure 2. The MR images of three implants, one each of silicone, oil, and saline, using four MRI pulse sequences: (A) T1-weighted (T1W); (B) T2-weighted (T2W); (C) T2W fat-saturation; and (D) short-tau inversion recovery (STIR) water-saturation.
Applsci 11 03434 g002
Figure 3. Siliconoma with in-situ carcinoma using various imaging techniques.
Applsci 11 03434 g003
Figure 4. Two magnetic resonance imaging techniques were applied to identify implants of different materials. (A) silicone-enhanced image with STIR water-saturation and (B) water-enhanced image with T2W fat-saturation.
Applsci 11 03434 g004
Figure 5. Magnetic resonance spectroscopy results for water, fat, and silicone.
Applsci 11 03434 g005
Figure 6. Both saline and silicone bags were implanted in the breasts, the former on the outside of the latter. (A) The T2-weighted (T2W) fat-saturation image; (B) the same with a chemical shift of −61 Hz from the water peak.; (C) the short-tau inversion recovery water-saturation image with the center frequency at the fat peak.
Applsci 11 03434 g006
Figure 7. Signal intensity curves of the magnetic resonance images of the three materials (fat, silicone, and saline) with IR. The polynomial smooth curves are shown as dotted lines.
Applsci 11 03434 g007
Table 1. Pulse sequences and parameters used in magnetic resonance imaging.
Pulse SequenceTR (ms)TE (ms)TI (ms)
T1W FSE40014
T1W SPGR/602001.7
T2W3000103
T2W fat-saturation3000103
STIR400045170
STIR (water-saturation)400045170
FSE, fast spin echo; SPGR, spoiled gradient recalled; STIR: Short-tau inversion recovery.
Table 2. Comparisons between the magnetic resonance images from three types of implants, normal mammary glands, and breast carcinomas.
Implant SequencesPhantomBreast Tissue
SiliconeNormal SalineOilGlandCarcinoma
T2W FSE-+++--
T2W (fat-saturation) ---+++--++
STIR++++--++
STIR (water-saturation)+++--------
T1W FSE+--+++---
T1Wcs SPGR/60 (-C)--+--++
DCE T1Wcs SPGR/60 (+C)-+-++++
T1Wcs SPGR/60 (+C)--+--++++
“+++” represents the greatest signal intensity; “---” represents the lowest intensity. cs: Chemical-saturation; DCE: Dynamic contrast enhancement.
Publisher’s Note: MDPI stays neutral with regard to jurisdictional claims in published maps and institutional affiliations.