Article

Polyisocyanurate Foam Pyrolysis and Flame Spread Modeling

by
Dushyant M. Chaudhari
1,
Stanislav I. Stoliarov
1,*,
Mark W. Beach
2 and
Kali A. Suryadevara
3
1
Department of Fire Protection Engineering, University of Maryland, College Park, MD 20740, USA
2
Beach Scientific Services LLC., Midland, MI 48642, USA
3
DuPont de Nemours Inc., Midland, MI 48642, USA
*
Author to whom correspondence should be addressed.
Appl. Sci. 2021, 11(8), 3463; https://doi.org/10.3390/app11083463
Submission received: 17 March 2021 / Revised: 8 April 2021 / Accepted: 9 April 2021 / Published: 13 April 2021
(This article belongs to the Special Issue Combustion and Fluid Mechanics, Advance in Fire Safety Science)

Abstract

:

Featured Application

This manuscript presents development of a pyrolysis model for a polyisocyanurate foam and demonstrates how this model can be coupled with an empirical model of flame heat feedback to predict the dynamics of flame spread on this widely used building product.

Abstract

Polyisocyanurate (PIR) foam is a robust thermal insulation material utilized widely in the modern construction. In this work, the flammability of one representative example of this material was studied systematically using experiments and modeling. The thermal decomposition of this material was analyzed through thermogravimetric analysis, differential scanning calorimetry, and microscale combustion calorimetry. The thermal transport properties of the pyrolyzing foam were evaluated using Controlled Atmosphere Pyrolysis Apparatus II experiments. Cone calorimetry tests were also carried out on the foam samples to quantify the contribution of the blowing agent (contained within the foam) to its flammability, which was found to be significant. A complete pyrolysis property set was developed and was shown to accurately predict the results of all aforementioned measurements. The foam was also subjected to full-scale flame spread tests, similar to the Single Burning Item test. A previously developed modeling approach based on a coupling between detailed pyrolysis simulations and a spatially-resolved relationship between the total heat release rate and heat feedback from the flame, derived from the experiments on a different material in the same experimental setup, was found to successfully predict the evolution of the heat release rate measured in the full-scale tests on the PIR foam.

1. Introduction

Rigid polymeric insulation materials, such as polyisocyanurate (PIR) foam, are increasingly favored in the construction industry because of their low weight, weather resistance, and their ability to improve energy efficiency and reduce the global warming potential [1]. However, the base polymeric materials in such foam are generally combustible and may represent a significant fire hazard without flame retardant additives. An accurate assessment of this hazard can help engineers optimize material selection for safe building design [2]. Performance of such assessments using full-scale testing can be prohibitively expensive and, therefore, an assessment through modeling represents a viable alternative [3]. For accurate modeling, the knowledge of pyrolysis properties controlling the processes responsible for gaseous fuel generation inside the solid material, and the knowledge of the flame structure and flame-solid interactions are essential [4].
The thermal decomposition of rigid polymeric foams has been studied using thermogravimetric analysis (TGA) and differential scanning calorimetry (DSC) by several groups [5,6,7,8]. It was found that the TGA data are significantly influenced by the exact chemical composition of the foam, even within the PIR family, and, thus, it would be difficult to create a single model of decomposition process that could be valid for all foam formulations. Hidalgo et al. [7] performed TGA on a range of rigid foam samples and proposed a flammability assessment based on the temperature of the main mass loss rate peak observed in an anaerobic TGA test. Branca et al. [8] parameterized the chemical kinetics of the anaerobic thermal decomposition of rigid polyurethane foam samples in TGA. A mechanism consisting of three reactions was found to be sufficient to predict decomposition at four different heating rates. Marquis et al. [9] developed several versions of the reaction mechanism for the thermal decomposition of a polyisocyanurate (PIR) foam in nitrogen and air and concluded that, while a mechanism with seven reactions was necessary to accurately model the TGA data, a mechanism with three reactions was sufficient to capture the key trends.
The flammability of rigid polyurethane and PIR foams at various isocyanate index levels and filled with different flame retardants and blowing agents has been studied using a range of bench-scale methods [10,11,12,13,14]. Günther et al. [10] studied flammability of polyurethane and PIR rigid foams of various densities using the limiting oxygen index and cone calorimetry. They found that the PIR foams had a superior fire response with respect to polyurethane foams and that an increase in density of either foam type increased the duration of burning but did not affect the peak heat release rate (HRR) measured in a cone calorimeter. They also analyzed scanning electron microscope (SEM) micrographs at different intervals of burning and found that the morphological structure of PIR foam was retained after complete flaming combustion, while a complete loss of closed-cell structure was observed for polyurethane foams. Branca et al. [8] suggested that such morphological changes may impacts the contribution of convection and radiation to effective thermal conductivity, which should be taken into account for accurate modeling of heat and mass transport through the foam. Modesti and Lorenzetti [11] investigated the flame retardancy effect of halogen-free, char-enhancing flame retardant compounds filled in varying quantities in pentane-blown PIR foams and found a significant reduction in peak HRR measured in cone calorimeter for compounds that induce a compact char layer development.
In none of the aforementioned studies, a complete property set, commonly referred to as a pyrolysis model, was obtained for any rigid foam material. Thus, the purpose of the current work was to advance the state-of-the-art by developing such a property set. The methodology for pyrolysis model parameterization utilized in this work was developed in a series of studies and was successfully applied to non-charring and charring solid polymers with and without flame retardants [15,16,17,18,19,20,21,22] and layered and fiber-reinforced structural composites [23,24,25,26]. It has never been applied to polymeric foams. This methodology is based on a series of milligram-scale experiments, including TGA, DSC and Microscale Combustion Calorimetry (MCC), and gram-scale, radiation-driven gasification tests performed using the Controlled Atmosphere Pyrolysis Apparatus II (CAPA II) [27]. The mg-scale tests are analyzed to determine the decomposition reaction mechanism, kinetic parameters, and thermodynamics of the thermal decomposition of the condensed phase and the combustion of the gaseous pyrolyzate. The analysis of gram-scale test results is based on the thermal decomposition mechanism derived from the mg-scale experiments and is used to determine heat and mass transport parameters for the pyrolyzing material. The data obtained in the gram-scale tests are also used for the overall model validation. Both milligram- and gram-scale experiments are analyzed through inverse modeling with a numerical pyrolysis model, ThermaKin [20,28,29], which was recently supplemented with a set of automatic optimization tools [30], which make the analysis process significantly less time-consuming.
In this work, this methodology was extended to include performance and modeling of the cone calorimetry experiments, which helped determine the contribution of the blowing agent present in the foam to foam’s flammability. In addition, the foam was tested in a full-scale experiment, similar to the Single Burning Item (SBI) test [31], which is used to classify wall-lining materials, including insulation. Finally, modeling of flame spread in this experiment was carried out using the pyrolysis model developed in this work coupled with a recently developed empirical heat feedback model [32], which was formulated for this specific scenario using measurements performed on poly(methyl methacrylate) (PMMA). The purpose of the flame spread modeling was to further validate the developed pyrolysis parameter set and to demonstrate that the empirical heat feedback model can be extended to other materials.

2. Materials and Methods

A PIR insulation foam product manufactured by DuPont de Nemours Inc. and sold under the trademark Tuff-R [33] was selected for this study. Tuff-R insulation panels were 5.08 × 10⁻² m thick and consisted of a closed-cell PIR foam core reinforced with non-woven glass fiber mat and manufactured using iso-pentane blowing agent. The foam core was sandwiched between two facers, each comprised of aluminum foil and Kraft paper. In the majority of the experiments performed in this study, these facers were removed to focus on the PIR foam. One experiment was performed in the SBI-like setup, described in detail in a subsequent section, with the facers in place to understand the impact of their presence on the dynamics of fire growth on these panels.

2.1. Milligram-Scale Experiments

2.1.1. TGA and DSC

The TGA and DSC tests were performed simultaneously using a Netzsch F3 Jupiter Simultaneous Thermal Analyzer. The tests were carried out on 4–6 mg samples obtained by cryogenic grinding of the foam core. The samples were dried for at least 24 h in a desiccator in the presence of Drierite prior to testing. Ten tests were performed at 10 K min−1 in nitrogen; the results of these tests were averaged and used for the thermal decomposition model development. The solid residue generated at the end of these tests was collected and used to perform five additional tests under the same conditions to determine the heat capacity of the residue. Six additional tests were performed in nitrogen on the ground foam core samples at 5 and 20 K min−1 (three at each heating rate) to obtain the data that were used to examine whether the thermal decomposition model was able to extrapolate to alternate heating conditions. All these tests were carried out in Pt-Rd crucibles with lids to maximize thermal contact and heat flow sensitivity. Each lid had a small opening for venting of gaseous decomposition products. Finally, two tests were performed in air at 10 K min−1 using ceramic crucibles without lids. The sole purpose of these tests was to determine the mass fraction of non-oxidizable constituents of the foam core, which were assumed to be the glass fibers.

2.1.2. MCC

The MCC tests were carried out at a nominal heating rate of 10 K min−1 using the same foam core samples that were used in the TGA and DSC tests. The samples were pyrolyzed in nitrogen following method A [34]. The resulting gaseous pyrolyzate was mixed with oxygen and combusted in a tubular flow reactor maintained at 1223 K. The HRR was determined using the oxygen consumption calorimetry and recorded as a function of time and material sample temperature. These tests were repeated five times to estimate the uncertainty of the measurement.

2.2. Gram-Scale Experiments

2.2.1. CAPA II Tests

CAPA II is an experimental apparatus developed to study pyrolysis and gasification of gram-scale, axisymmetric solid samples in a controlled atmosphere. In this apparatus, the sample is exposed to a radiant heat flux and its mass loss rate (MLR), back surface temperature, and cross-sectional profile are tracked simultaneously in time. The sample is placed on a copper foil inside a sample holder that rests on a high-resolution mass balance. The sample’s front surface is heated with a nearly uniform radiant heat flux, while its sides are insulated to ensure nearly one-dimensional heating in the axial direction. The sample is supported by a copper foil whose back surface is coated with a black paint of known emissivity. A calibrated infrared camera is focused on this surface to provide an accurate temperature measurement, which does not interfere with the operation of the mass balance. Further details on the CAPA II design, characterization, and diagnostics can be found in an earlier publication [27].
The PIR foam samples used for the CAPA II experiments were 1.27 × 10⁻² m thick, 7.00 × 10⁻² m diameter disks, which were cut from the core of the Tuff-R insulation panels. The samples were dried for at least 24 h in a desiccator in the presence of Drierite prior to testing. The initial mass and room temperature density of the samples were 1.6 × 10⁻³ kg and 32 kg m−3, respectively. The samples were pyrolyzed in nitrogen atmosphere with oxygen content below 0.6 vol.% O2 in the vicinity of the front sample surface. Two tests were performed at a set radiant heat flux of 40 kW m−2 and three at 70 kW m−2 to collect the necessary data statistics. One additional test was performed at 70 kW m−2 on a sample whose top surface was coated with a high emissivity paint to help determine the emissivity of the surface of the unpainted sample.

2.2.2. Cone Calorimetry

Cone calorimetry was also performed on the PIR foam core to further elucidate the impact of the blowing agent present in the foam on its flammability. This test was carried out in accordance with the ASTM E1354 standard [35] at 50 kW m−2 of radiant heat flux and was repeated three times. The foam samples used in these tests were 0.1 m × 0.1 m × 2.54 × 10−2 m cuboids, whose thickness was selected to be twice as large as that of the CAPA II samples to help retain the blowing agent contained in the Tuff-R panels. These samples were mounted in a cone calorimeter by wrapping their backs and sides with aluminum foil and placing them onto a Kaowool PM ceramic fiber insulation board covering the mass balance platform. Sample MLR and HRR were recorded as a function of time.

2.3. Full-Scale Experiments

Two 1.46 m tall, 0.60 m wide and 5.08 × 10⁻² m thick Tuff-R insulation panels were tested in a vertical corner flame spread setup shown in Figure 1. This setup was developed in a previous study [32] and is very similar to the SBI standard [31] with a notable distinguishing feature of being symmetric with respect to the plane bisecting the corner. This symmetry was imposed in the current setup to help simplify diagnostics and analysis.
A triangular sandbox burner, built in accordance with the standard specification [31] and fueled with a constant flow of propane corresponding to the HRR of 30 kW, was used as an ignition source for the panels. This burner was ignited at the beginning of each test and was turned off at the end. The corner wall and burner assembly were placed into a well-ventilated enclosure equipped with a fast (13 s) response oxygen consumption calorimetry, which incorporated corrections for scrubber-induced changes in the oxygen concentration in the sensor flow [32].
In addition to the measurement of HRR, flame heat flux to the panels, q ˙ , was measured with seven 9.5 mm diameter water-cooled Schmidt-Boelter heat flux gauges. These gauges were installed flush with the panel surface facing the burner in specific positions defined by coordinates (x, y) expressed in meters. The x coordinate was the horizontal distance from the corner; the y coordinate was the vertical distance from the top of the burner. The locations of the heat flux gauges, (0.10, 0.10), (0.10, 0.30), (0.10, 0.50), (0.05, 0.70), (0.22, 0.70), (0.10, 0.90), and (0.10, 1.10), are shown in Figure 1. These locations were selected to capture flame growth on the panels based on earlier, more spatially resolved measurements performed on PMMA [32]. Only one panel was equipped with the heat flux gauges because the readings in the same positions on both panels were previously shown to be effectively identical [32].
Two tests were performed in this setup on the foam panels without facers and one test was conducted on the panels with the facers to quantify the impact of their presence on the dynamics of fire growth. The duration of each test was 600 s.

2.4. Modeling

The modeling was performed using the most recent version of the comprehensive pyrolysis solver ThermaKin, ThermaKin2Ds. ThermaKin2Ds numerically solves mass and energy conservation equations for a condensed-phase object of arbitrary composition undergoing physical and/or chemical transformations. The solver provides a capability to track up to fifty Arrhenius chemical reactions of the first and/or second-order and account for the transient heat and gas transport inside the object. The object can be spatially uniform (zero-dimensional), one-dimensional or two-dimensional (Cartesian or axisymmetric). A complete description of the ThermaKin2Ds can be found in earlier publications [20,28,29].

2.4.1. Modeling of Milligram-Scale Experiments

During the modeling of TGA, DSC and MCC tests, all samples were treated as zero-dimensional and represented by a single spatial element. The element temperature was forced to follow the experimental temperature profile by defining a sufficiently high convection coefficient, 1 × 10⁵ W m2 K−1, at the boundary. The experimental temperature profile was prescribed by expressing the heating rate via an exponentially-decaying sinusoidal function. This function was employed to account for the variation in the instantaneous experimental heating rate with time, as explained in detail elsewhere [24]. The mass flow boundary conditions were defined such that the gaseous pyrolyzate instantaneously escaped the element.
The PIR foam thermal decomposition mechanism was assumed to consist of consecutive reactions; the number of reactions was determined from the inspection of the MLR data obtained in the 10 K min−1 TGA experiments performed in nitrogen. The kinetic parameters of these reactions were determined through fitting of the TGA data using a multi-parameter optimization with a hill-climbing algorithm. Details of this algorithm implementation can be found in an earlier publication [30]. The heat capacities of the condensed-phase components of the foam and heats of decomposition reactions were determined through a manual fitting of the corresponding (10 K min−1) DSC data, including the data collected in a separate set of tests on the decomposition residue. Details of this well-established fitting routine can also be found in earlier publications [16,17,24,25]. The heats of combustion of the gaseous pyrolysis products defined in the reaction mechanism (derived from the TGA data) were determined via a simulation of the MCC test. The heats of combustion were first assumed to be the same, equal to the mean heat of combustion of the gasified material obtained through the integration of the MCC HRR curve and were subsequently adjusted (if needed) to capture the shape of the MCC curve.

2.4.2. Modeling of Gram-Scale Experiments

Modeling of the CAPA II tests was performed using a one-dimensional version of ThermaKin2Ds because the experimental results indicated that both sample thickness and temperature remained radially uniform throughout the experiments. The model was set up to accurately capture convective and radiative boundary conditions of the CAPA II tests, which were carefully characterized in an earlier study [27,36]. The front sample surface was modeled to have no resistance to gas flow. The back surface, covered with copper foil, was set to be impenetrable to gas flow.
The densities of the condensed-phase decomposition products of the PIR foam were prescribed to capture the changes in the sample thickness observed in the 70 kW m−2 tests. The thermal conductivities of the foam and products of its decomposition were assumed to be independent of temperature, to minimize the number of adjustable parameters, and were optimized to capture the experimental back sample surface temperature profile obtained at 70 kW m−2. As in the case of the TGA data, the optimization was carried out using a hill climbing algorithm. Details of this algorithm implementation can be found in an earlier publication [30]. The results of the 70 kW m−2 CAPA II tests, rather than the results of the 40 kW m−2 tests, were used as an optimization target because only in the 70 kW m−2 tests the PIR foam samples underwent a complete thermal decomposition.
The cone calorimetry experiments were also simulated using a one-dimensional version of ThermaKin2Ds. The front sample surface boundary conditions included the incident radiative heat flux from the cone heater (50 kW m−2) and convective losses before ignition and a combination of the heater radiative heat flux and convective and radiative heat fluxes from the flame established over the sample surface after ignition. The ignition was assumed to take place once the gaseous fuel mass flux reached the magnitude corresponding to a critical value of HRR of 21 kW m−2 [37]. The radiative losses from the sample surface were also accounted for throughout the simulation. A complete set of parameters describing this cone-calorimetry-specific flame heat feedback model can be found in an earlier publication [38], where this model was developed and validated. The back surface of the sample, covered with aluminum foil, was set to be impenetrable to gas flow. The heat transfer through Kaowool PM insulation located underneath the foil was modeled explicitly using the material properties provided by the manufacturer [39].
All simulations were performed with 5 × 10⁻⁵ m spatial resolution and 0.01 s time step. Increasing or reducing these integration parameters by a factor of two did not produce any significant changes in the simulation results, indicating convergence.

2.4.3. Modeling of Full-Scale Experiments

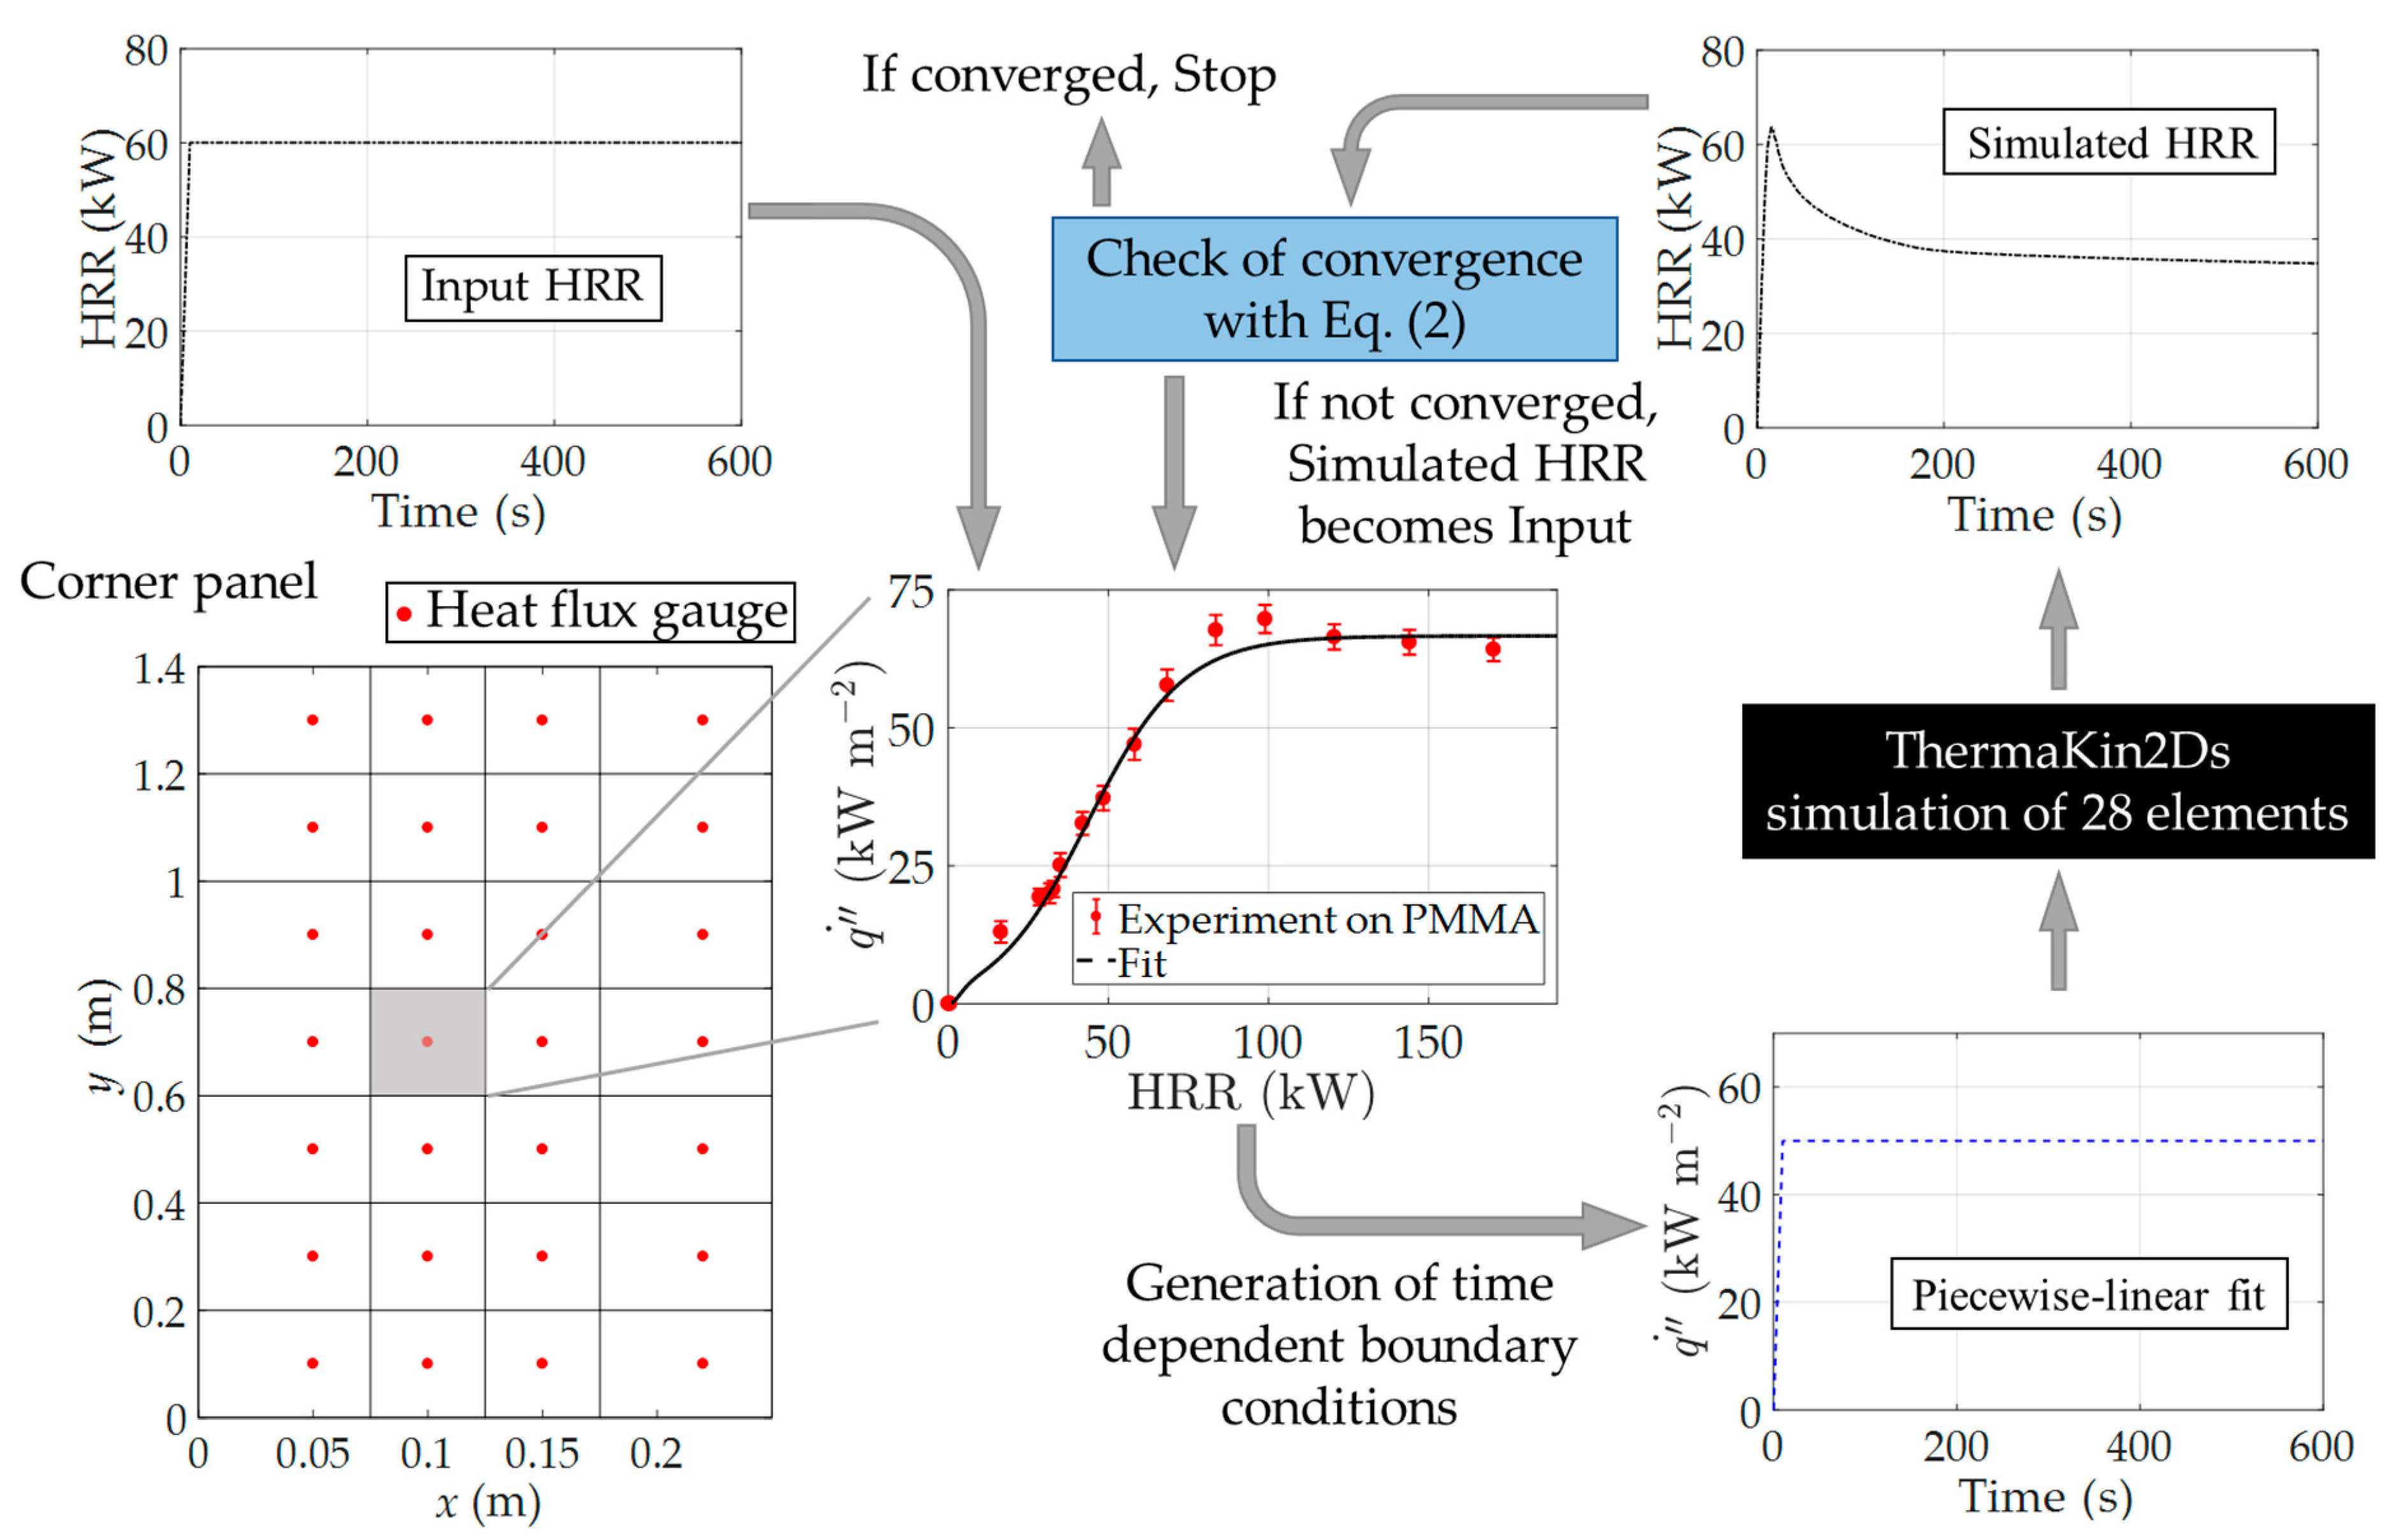
Modeling of the full-scale experiments performed on the PIR foam panels without facers was carried out using a recently developed, semi-empirical approach [32]. In this approach, each panel forming the corner wall was divided into 28 rectangular elements, as shown in Figure 2. For each of these elements, an empirical relation between the incident heat flux measured by a water-cooled heat flux gauge ( q ˙ ) and the total HRR was established using the results of experiments performed in the same setup, at the same burner setting, on PMMA. An example of such relation obtained for one particular element is shown in Figure 2. It was assumed that these relations are not significantly affected by material composition and used here to simulate flame spread on the PIR foam.
The simulation was initiated by guessing the HRR evolution with time. The initial guess was taken as twice the HRR of the burner, HRR b , measured in the absence of any flammable wall material. Using this guessed HRR profile (labeled as Input HRR in Figure 2), q ˙ dependencies on time were generated for each of the 28 elements of the corner wall from the empirical relations between q ˙ and HRR. These dependencies were subsequently converted to front surface boundary conditions for 28 instances of one-dimensional ThermaKin2Ds pyrolysis simulations, each of which represented an element of the PIR foam panel. In the current simulations, an assumption was made that q ˙ was purely radiative in nature and, thus, the front surface thermal boundary conditions of each element consisted of the time-dependent incident radiant heat flux from the flame ( q ˙ ) and radiative losses from the heated PIR foam. Heat transfer through the Marinite I calcium silicate board that was located behind the foam panels (see Figure 1) was modeled explicitly using the material properties provided by the manufacturer [40].
The results of the pyrolysis simulations were used to compute Simulated HRR by adding up contributions from individual elements and the burner:
Simulated   HRR ( t ) = HRR b ( t ) + 2 j = 1 28 A j [ i = 1 N g m ˙ i j ( t ) Δ H c i ] .
In this equation, i index is used to add contributions from all N g gaseous decomposition products, while j is used to sum the contributions from all panel elements, each of which had front surface area A j . t is time from the start of the burner; m ˙ i j is time-dependent mass flux of a gaseous decomposition product i from element j (computed by ThermaKin2Ds); and Δ H c i is the heat combustion of product i. The Simulated HRR was subsequently compared with the Input HRR using a criterion CR,
CR = 1 t e 0 t e | Input   HRR ( t ) Simulated   HRR ( t ) | d t .
If, for any t e between 1 s after the burner ignition and the end of the simulation time, the CR was found to be less than 5 kW, the Simulated HRR was declared to be converged and the simulation was stopped. On the other hand, if CR was found to be equal or larger than 5 kW for any t e , the Simulated HRR was taken as an Input HRR for the next iteration. The overall workflow of this iterative process is further illustrated in Figure 2. Typically, two to three iterations were required to achieve convergence. ThermaKin2Ds calculations performed as a part of each iteration were carried out using the same integration parameters as were used for the modeling of the gram-scale experiments. The performance of these iterations was facilitated by development of a MATLAB script that was used to generate boundary condition parameters and post-process the results of individual ThermaKin2Ds simulations.

3. Results and Discussion

3.1. TGA and DSC Experimental Results and Modeling

The mean TGA and DSC experimental data collected for the PIR foam samples at 10 K min−1 in nitrogen are shown in Figure 3. The TGA data are plotted as sample mass, m, and MLR normalized by the initial sample mass, m0, with respect to the sample temperature, T. The DSC data are presented as heat flow and integral of heat flow, both normalized by m0. The error bars were calculated from the scatter of the data as two standard deviations of the mean. According to the TGA data, the thermal decomposition of the foam begins at about 400 K and continues over a wide range of temperature. The MLR becomes insignificant around 900 K, at which point about 32 wt.% of material remains in the crucible.
During modeling of these data, the foam material was represented by a mixture 95.9 wt.% of reactive PIR component and 4.1 wt.% of inert glass fiber component. The amount of the glass fiber component was determined from the results of the TGA tests performed in air using open crucibles. The PIR component was assumed to decompose through seven consecutive first-order reactions with one condensed-phase, PIR_Int_#, and one gaseous, Gas_#, product to accurately capture the multipeak structure of the experimental MLR. The kinetic parameters of these reactions, including the pre-exponential factors, Ar, activation energies, Er, and mass-based stoichiometric coefficients, were obtained through fitting of these experimental data. The results of this fitting exercise are shown in Figure 3; the optimized parameters are summarized in Table 1.
The heat capacities, Cp, of the condensed-phase components of Tuff-R foam core are summarized in Table 2. The heat capacity of the glass fiber component was obtained from the literature [41]. The PIR component heat capacity was determined by fitting the portion of the 10 K min−1 DSC data preceding decomposition. The final residue (PIR_Int_7) heat capacity was obtained by fitting the results of separate DSC experiments performed on fully decomposed samples. The heat capacities of the intermediate condensed-phase products could not be determined directly and were assumed to be equal to the heat capacity of the PIR component taken at 420 K, which produced a reasonable sensible heat flow base-line shown in Figure 3. Finally, the heats of reactions, ∆Hr, were selected to fully reproduce the experimental heat flow and its integral. The values of the heats of reaction are summarized in Table 1. All reactions, with the exception of Reaction 4, were found to be endothermic or thermally neutral. The heat capacities of the gas-phase decomposition products could not be obtained from the current measurements and were assumed to be equal to 2100 J kg−1 K−1, which was the mean heat capacity of a collection of C1 to C8 hydrocarbons at a temperature of 600 K [20].
To ensure that the developed reaction model was capable of extrapolating to alternate heating rates, its predictions were compared with the experimental TGA and DSC data collected at nominal heating rates of 5 and 20 K min−1. These comparisons are shown in Figure A1 of Appendix A. They indicate that the model captures both the TGA and DSC data at the lower and higher heating rate well.

3.2. MCC Experimental Results and Modeling

The mean experimental data and modeling results obtained for the MCC tests on the PIR foam core samples are shown in Figure 4. These results are presented as HRR and integral HRR normalized by the initial sample mass and are plotted with respect to the sample temperature. The error bars were calculated from the scatter of the data as two standard deviations of the mean. The heats of combustion, H c   , of the gaseous decomposition products obtained through fitting of the experimental data using the reaction model derived from the TGA tests are given in Table 3. To capture the experimental HRR profile with sufficient accuracy, the H c   values had to be varied for individual gaseous products between 0 and 3.3 × 10⁷ J kg−1. The model captures both instantaneous and integral HRR data well.

3.3. CAPA II Experimental Results and Modeling

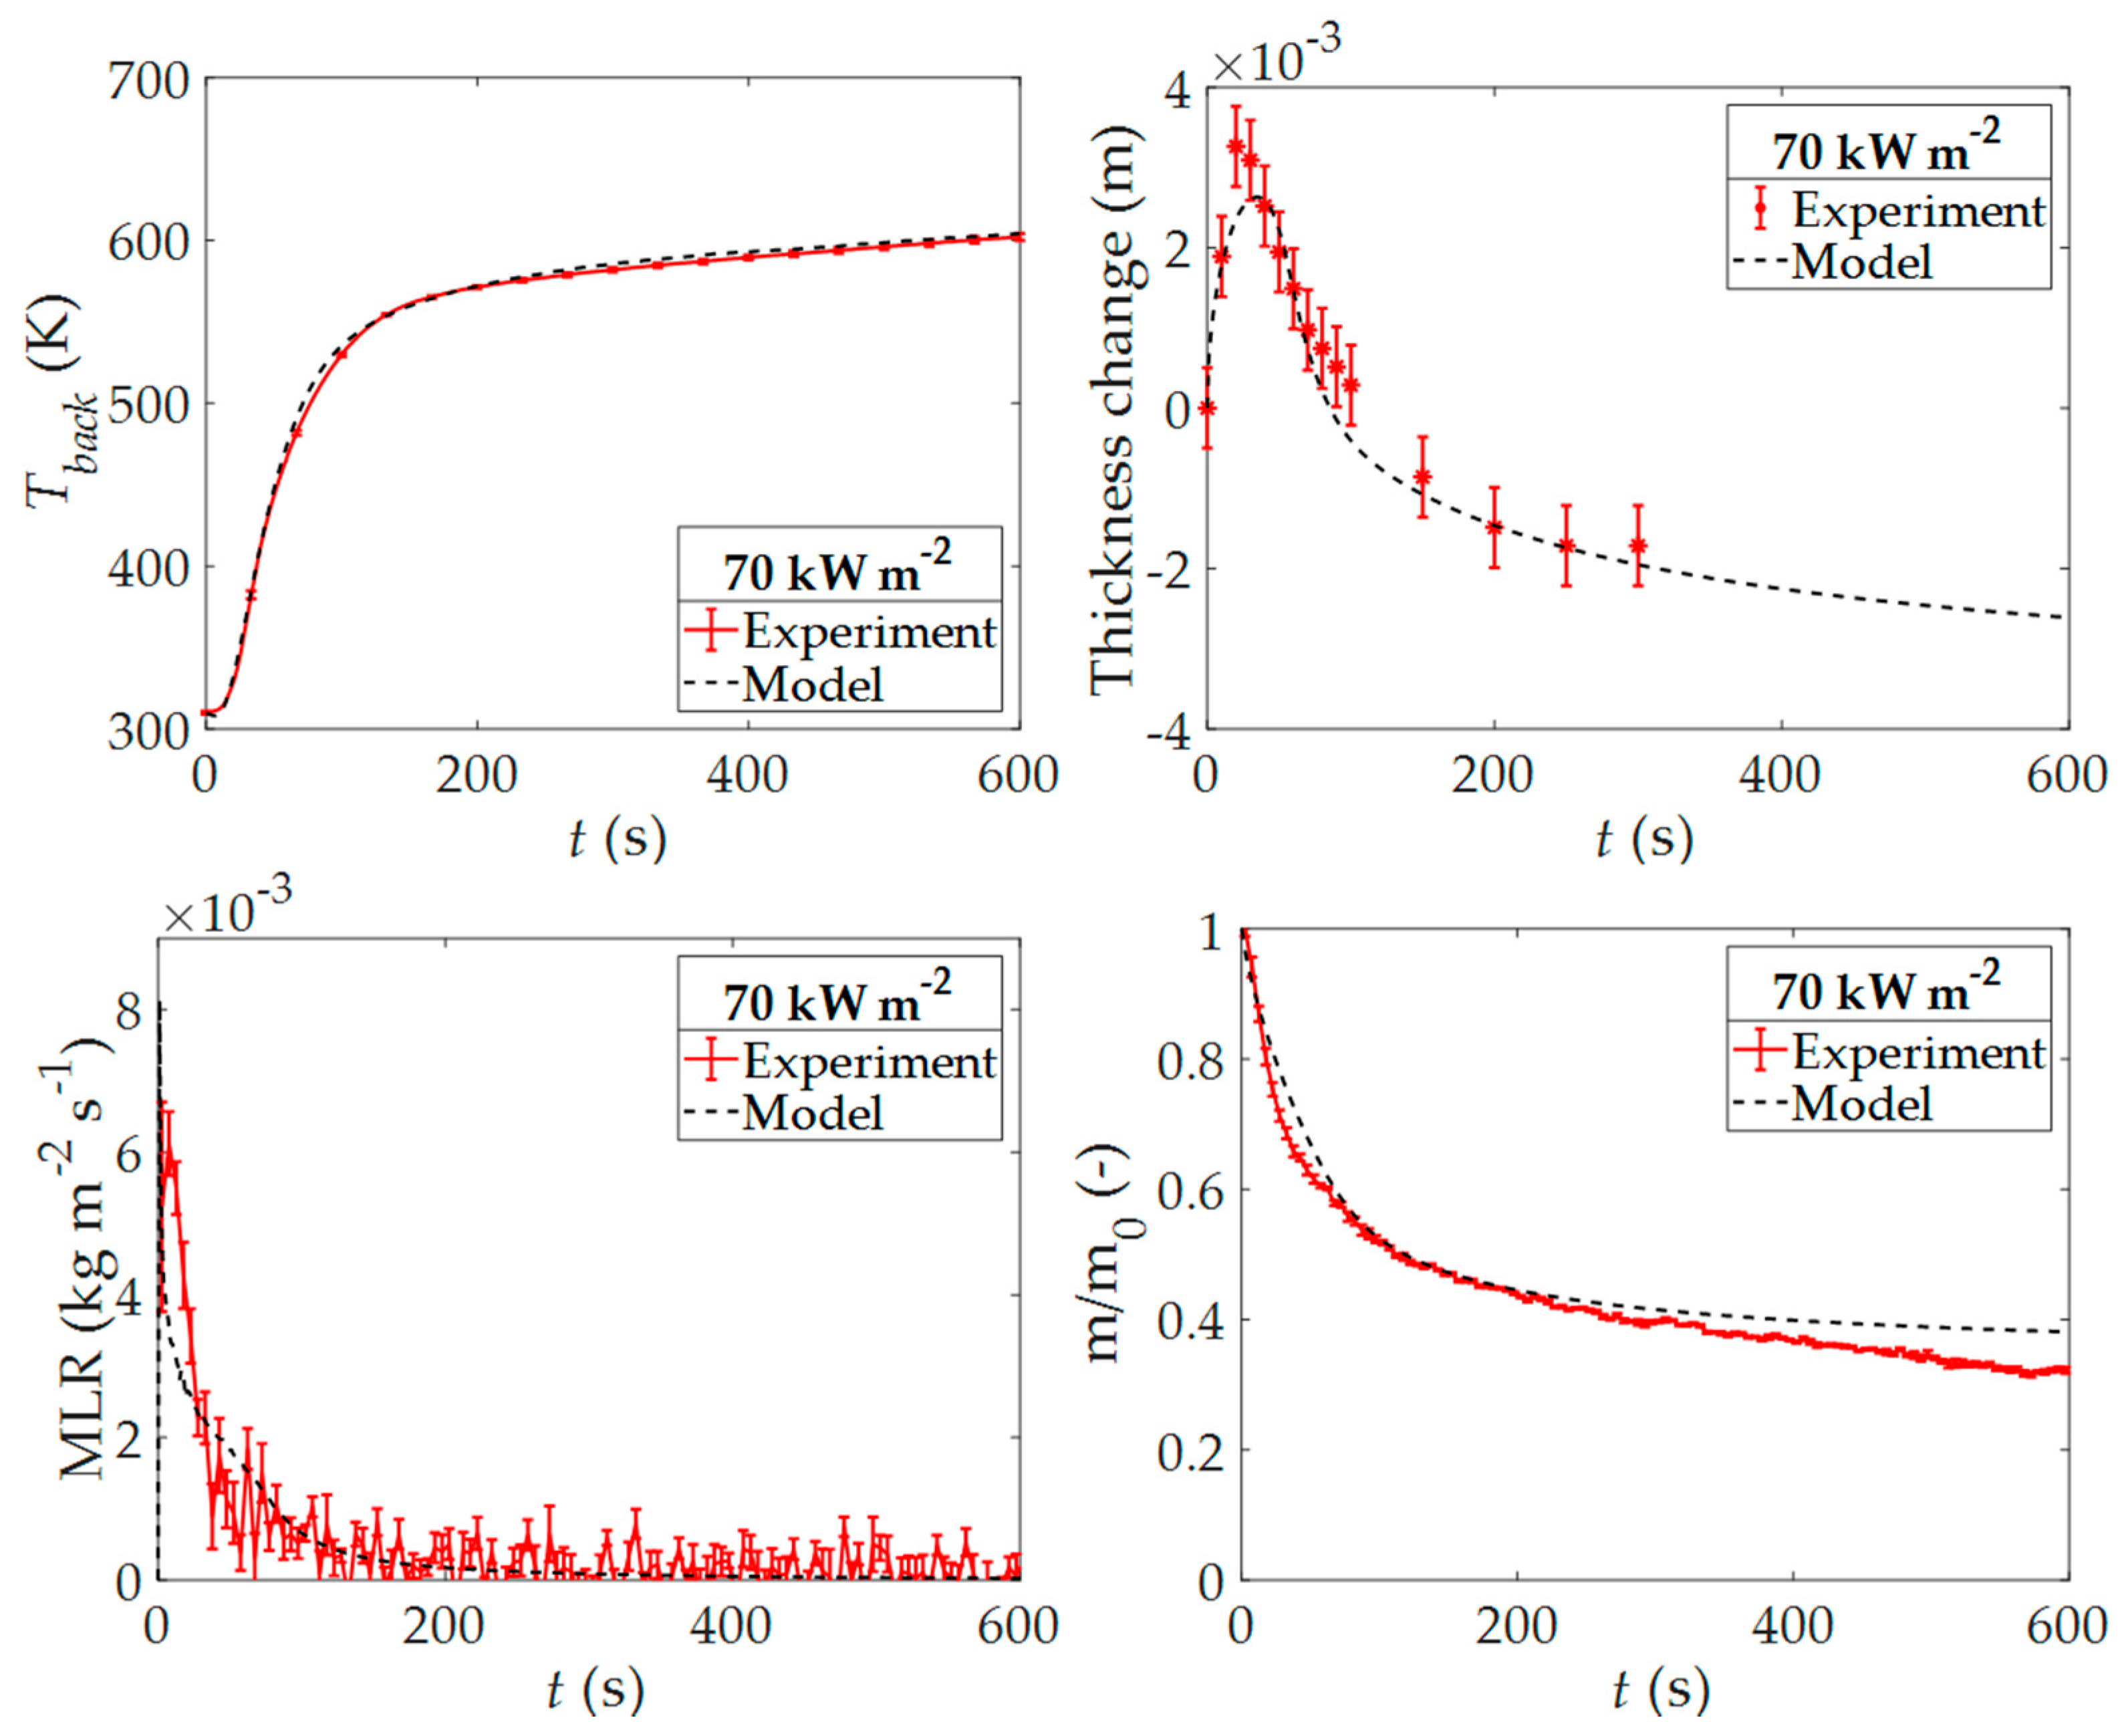
The average back surface temperature, Tback, MLR normalized by the initial front surface area, relative mass (m/m0) and thickness change measured for the Tuff-R foam core samples in the CAPA II experiments performed at 70 kW m−2 of set radiant heat flux are shown in Figure 5. The error bars were calculated from the scatter of the data as two standard deviations of the mean. The data indicate that the majority of the mass loss occurred during the first 200 s after the start of the experiment. The sample first grew in thickness by about 25% and subsequently contracted by about 15% with respect to the original thickness. The sample left about 33% of solid residue at the end of the experiment.
To model this experiment, the emissivities, ε , of all condensed-phase components, with the exception of glass fiber, were set to 0.95. This value of emissivity was derived from an additional CAPA II test performed at 70 kW m−2 on the sample whose top surface was coated with a 0.95 emissivity paint. This test produced results that were nearly identical to the unpainted sample results shown in Figure 5. The condensed-phase component radiation absorption coefficients, α , were set to 3200 m−1, which was approximately equal to the reciprocal of the depth of open pores located on the sample surface. The emissivity and absorption coefficient of the glass fiber were obtained from an online property database [41] and were set to 0.81 and 4160 m−1, respectively.
The gas transfer coefficient used in the ThermaKin2Ds to define the rate of transport of gaseous species through the condense phase in response to a concentration and/or pressure gradient was set to its default value of 2.0 × 10⁻⁵ m2 s−1, which was used to simulate uninhibited transport. The densities, ρ , and thermal conductivities, k, of all components, with the exception of the glass fiber, were assumed to be independent of temperature and were optimized to fit the experimental Tback and thickness change dependencies on time. The ρ and k of the glass fiber were obtained from an online property database [41]. The resulting set of thermal transport property values is summarized in Table 4.
As the results shown in Figure 5 indicate, the model fits both the temperature and sample thickness data well and also provides a good prediction of the MLR. Similarly, good predictions were obtained with this model for the 40 kW m−2 CAPA II experiments. A comparison of these predictions with the experimental data is provided in Figure A2 of Appendix A. At 70 kW m−2, the total mass loss was somewhat underpredicted by the model. This underprediction was attributed to an inability to account for release of the blowing agent located in the foam pores. This inability was a consequence of the fact that the blowing agent was lost during the preparation of the mg-scale test samples, which were used to parameterize the thermal decomposition mechanism. Further, analysis of the impact of the blowing agent was carried out through modeling of the cone calorimetry experiments, which were performed on the foam core samples that were twice as thick as the CAPA II samples and thus were more likely to retain the blowing agent during the sample preparation and conditioning process.

3.4. Cone Calorimetry Experimental Results and Modeling

The results of the cone calorimetry experiments performed on the Tuff-R foam core samples at 50 kW m−2 of set radiant heat flux are given in Figure 6. The mean integral HRR and integral MLR, both normalized by the initial front surface area, are presented as a function of time. The data are presented in an integral form to help reveal the impact of the blowing agent. The error bars were calculated from the scatter of the data as two standard deviations of the mean. The cone calorimetry modeling results are also shown on the figure (as dashed lines). The model systematically underpredicts the integral HRR and, to a lesser degree, the integral MLR.
To determine whether the blowing agent is responsible for the observed discrepancies, a blowing agent component was added to the PIR foam pyrolysis model. This component was designated as a gas and was added in the amount of 7 wt.%, which was the blowing agent content reported in a safety data sheet provided by the manufacturer [33]. According to this data sheet, the blowing agent was iso-pentane. Therefore, the heat capacity and heat of combustion of the blowing agent component were set to the corresponding properties of iso-pentane [42], 1667 J kg−1 K−1 and 4.95 × 10⁷ J kg−1, respectively. In addition, the PIR component was reset within the model to be impenetrable to gas flow (the gas transfer coefficient of 1.0 × 10⁻³⁰ m2 s−1), which made sure that the blowing agent component was retained within the foam matrix until the PIR component decomposed to PIR_Int_1 through Reaction 1 (see Table 1). The results of the simulations obtained with the version of the pyrolysis model including the blowing agent component are shown in Figure 6 (as solid lines). These results capture both the experimental integral HRR and the integral MLR significantly better than the simulation results obtained with the model without the blowing agent.

3.5. Full-Scale Experimental Results and Modeling

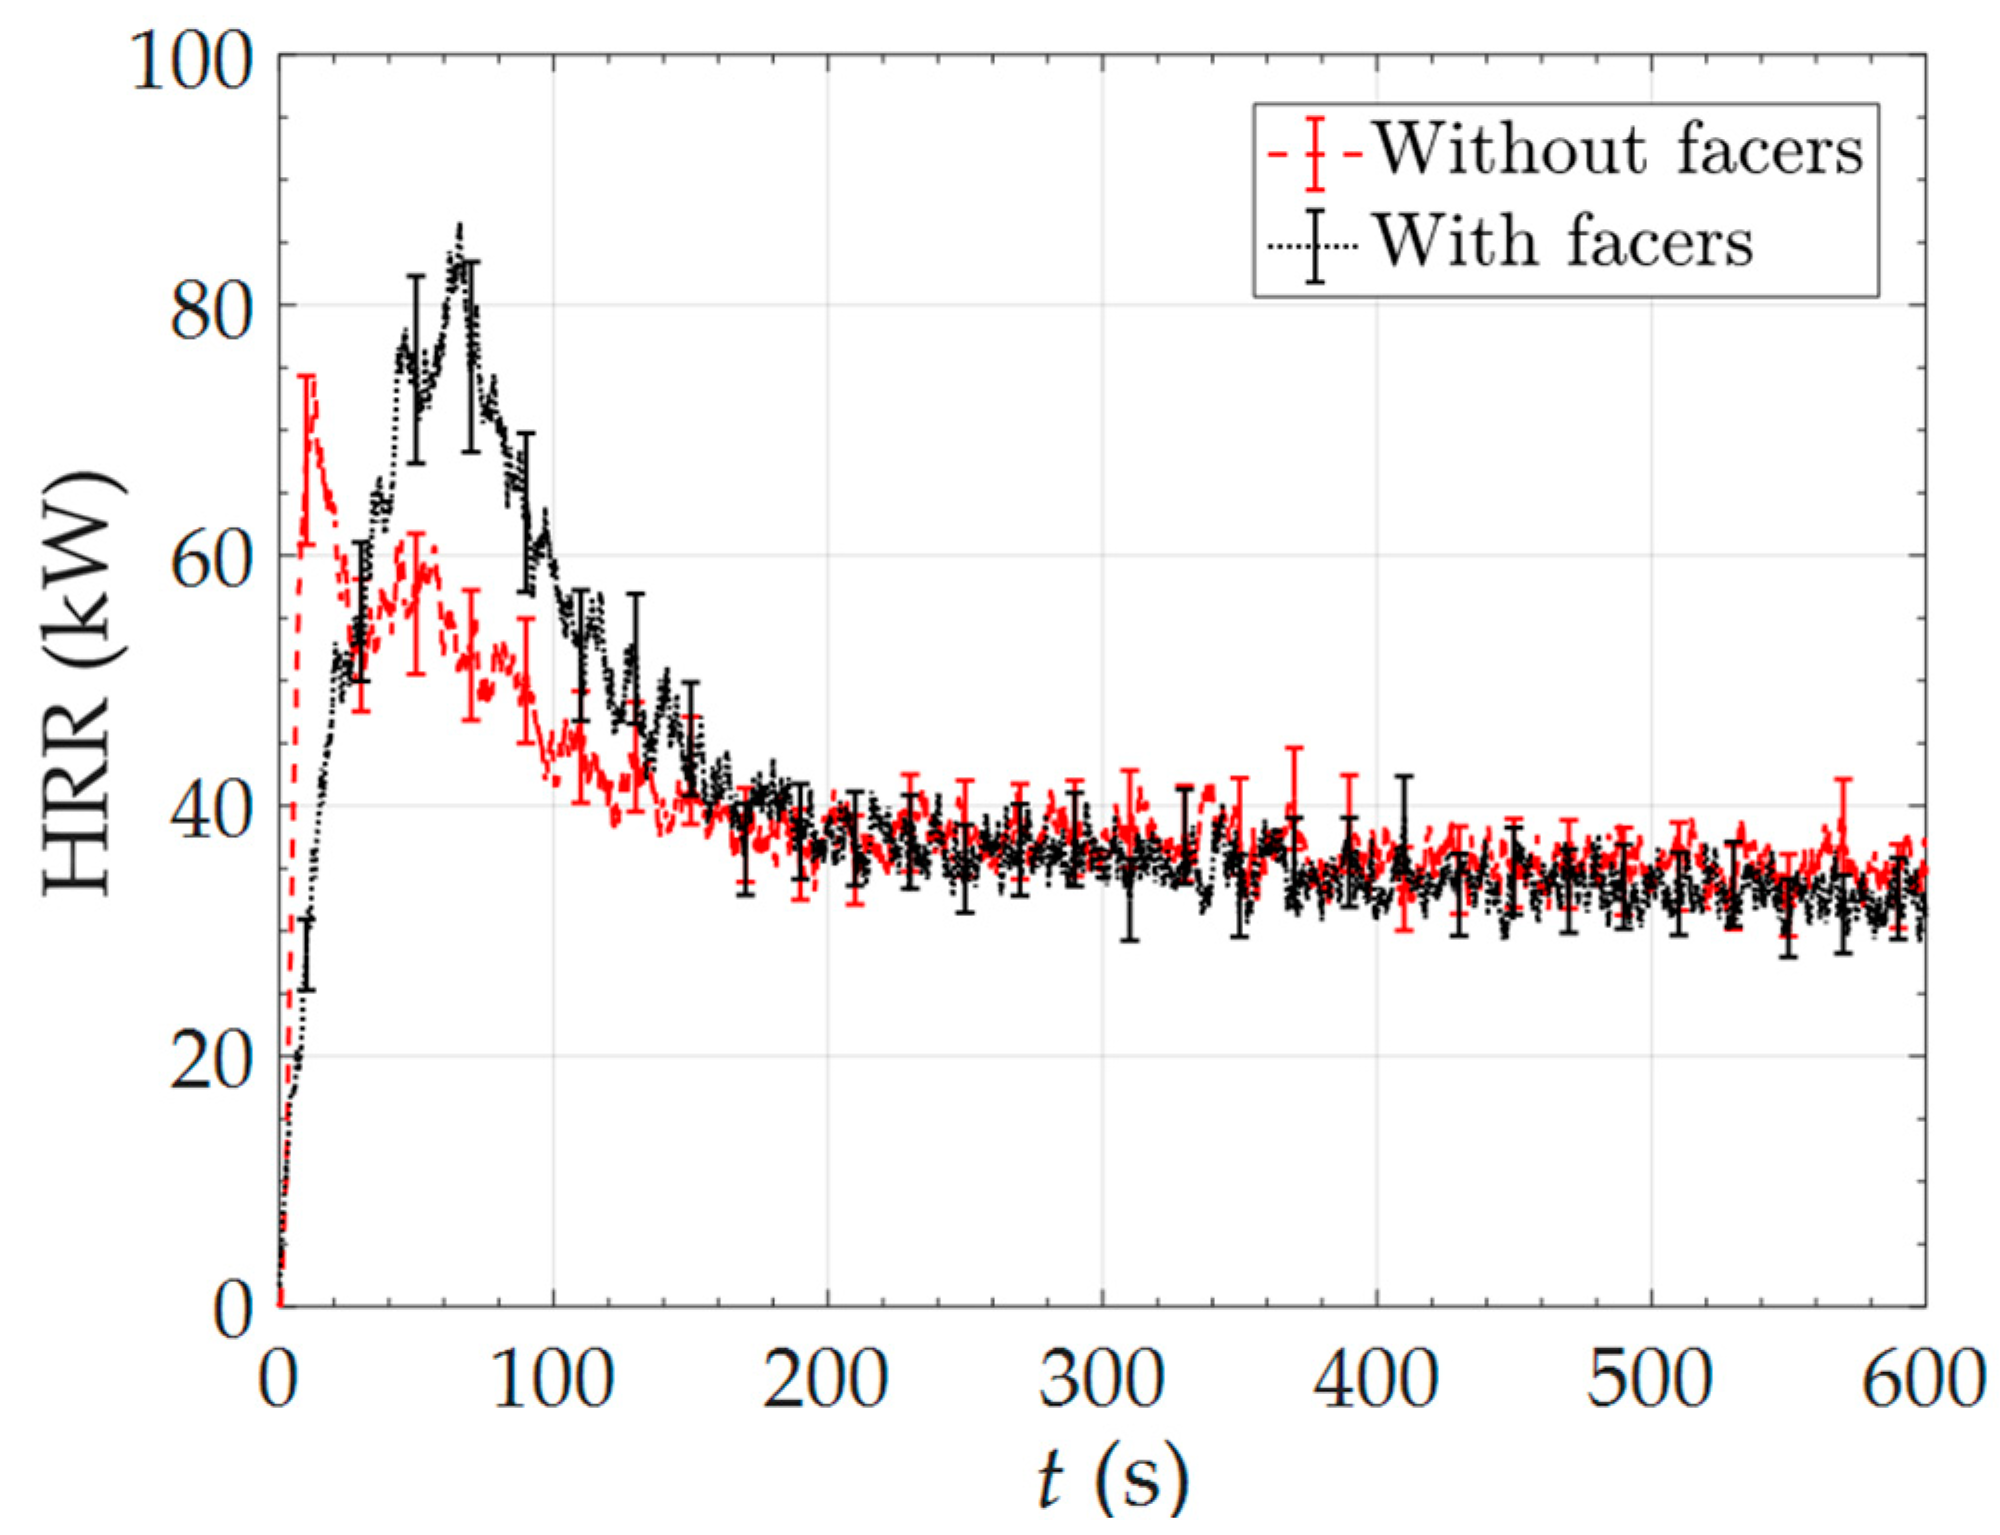
The temporal HRR profiles measured in the vertical corner flame spread setup are shown in Figure 7. Two HRR profiles are presented: the average of the two experiments on the Tuff-R insulation panels without facers and the results of a single experiment on the panels with facers. The error bars were calculated by assuming 10% uncertainties in the oxygen-consumption-based heat release measurements [32,43]. In both cases, the insulation panels ignited within 5–15 s after the burner was turned on. The ignition was followed by a formation of a single fire vortex that rolled from the bottom to the top of the corner. This vortex formation was attributed to a quick release of some of the blowing agent from the pyrolyzing foam. For both types of panels, the total HRR (including 30 kW from the burner) initially increased above 70 kW, which corresponded to the time when the flame tips extended above the top of the panels. After these peaks, the flames gradually subsided. After about 200 s, the HRR curves nearly flattened at around 35 kW, just 5 kW above the HRR of the burner.
The presence of a foil facer on the front panel surfaces delayed and slightly increased the peak HRR. The aluminum foil appeared to trap and accumulate the gaseous pyrolysis products and blowing agent in localized bubbles formed on the panel surfaces. These bubbles eventually burst, nearly simultaneously, which produced a higher HRR maximum. A visual inspection of both types of panels after the tests revealed no evidence of lateral flame spread and limited upward spread. Significant portions of the panels away from the burner remained effectively intact.
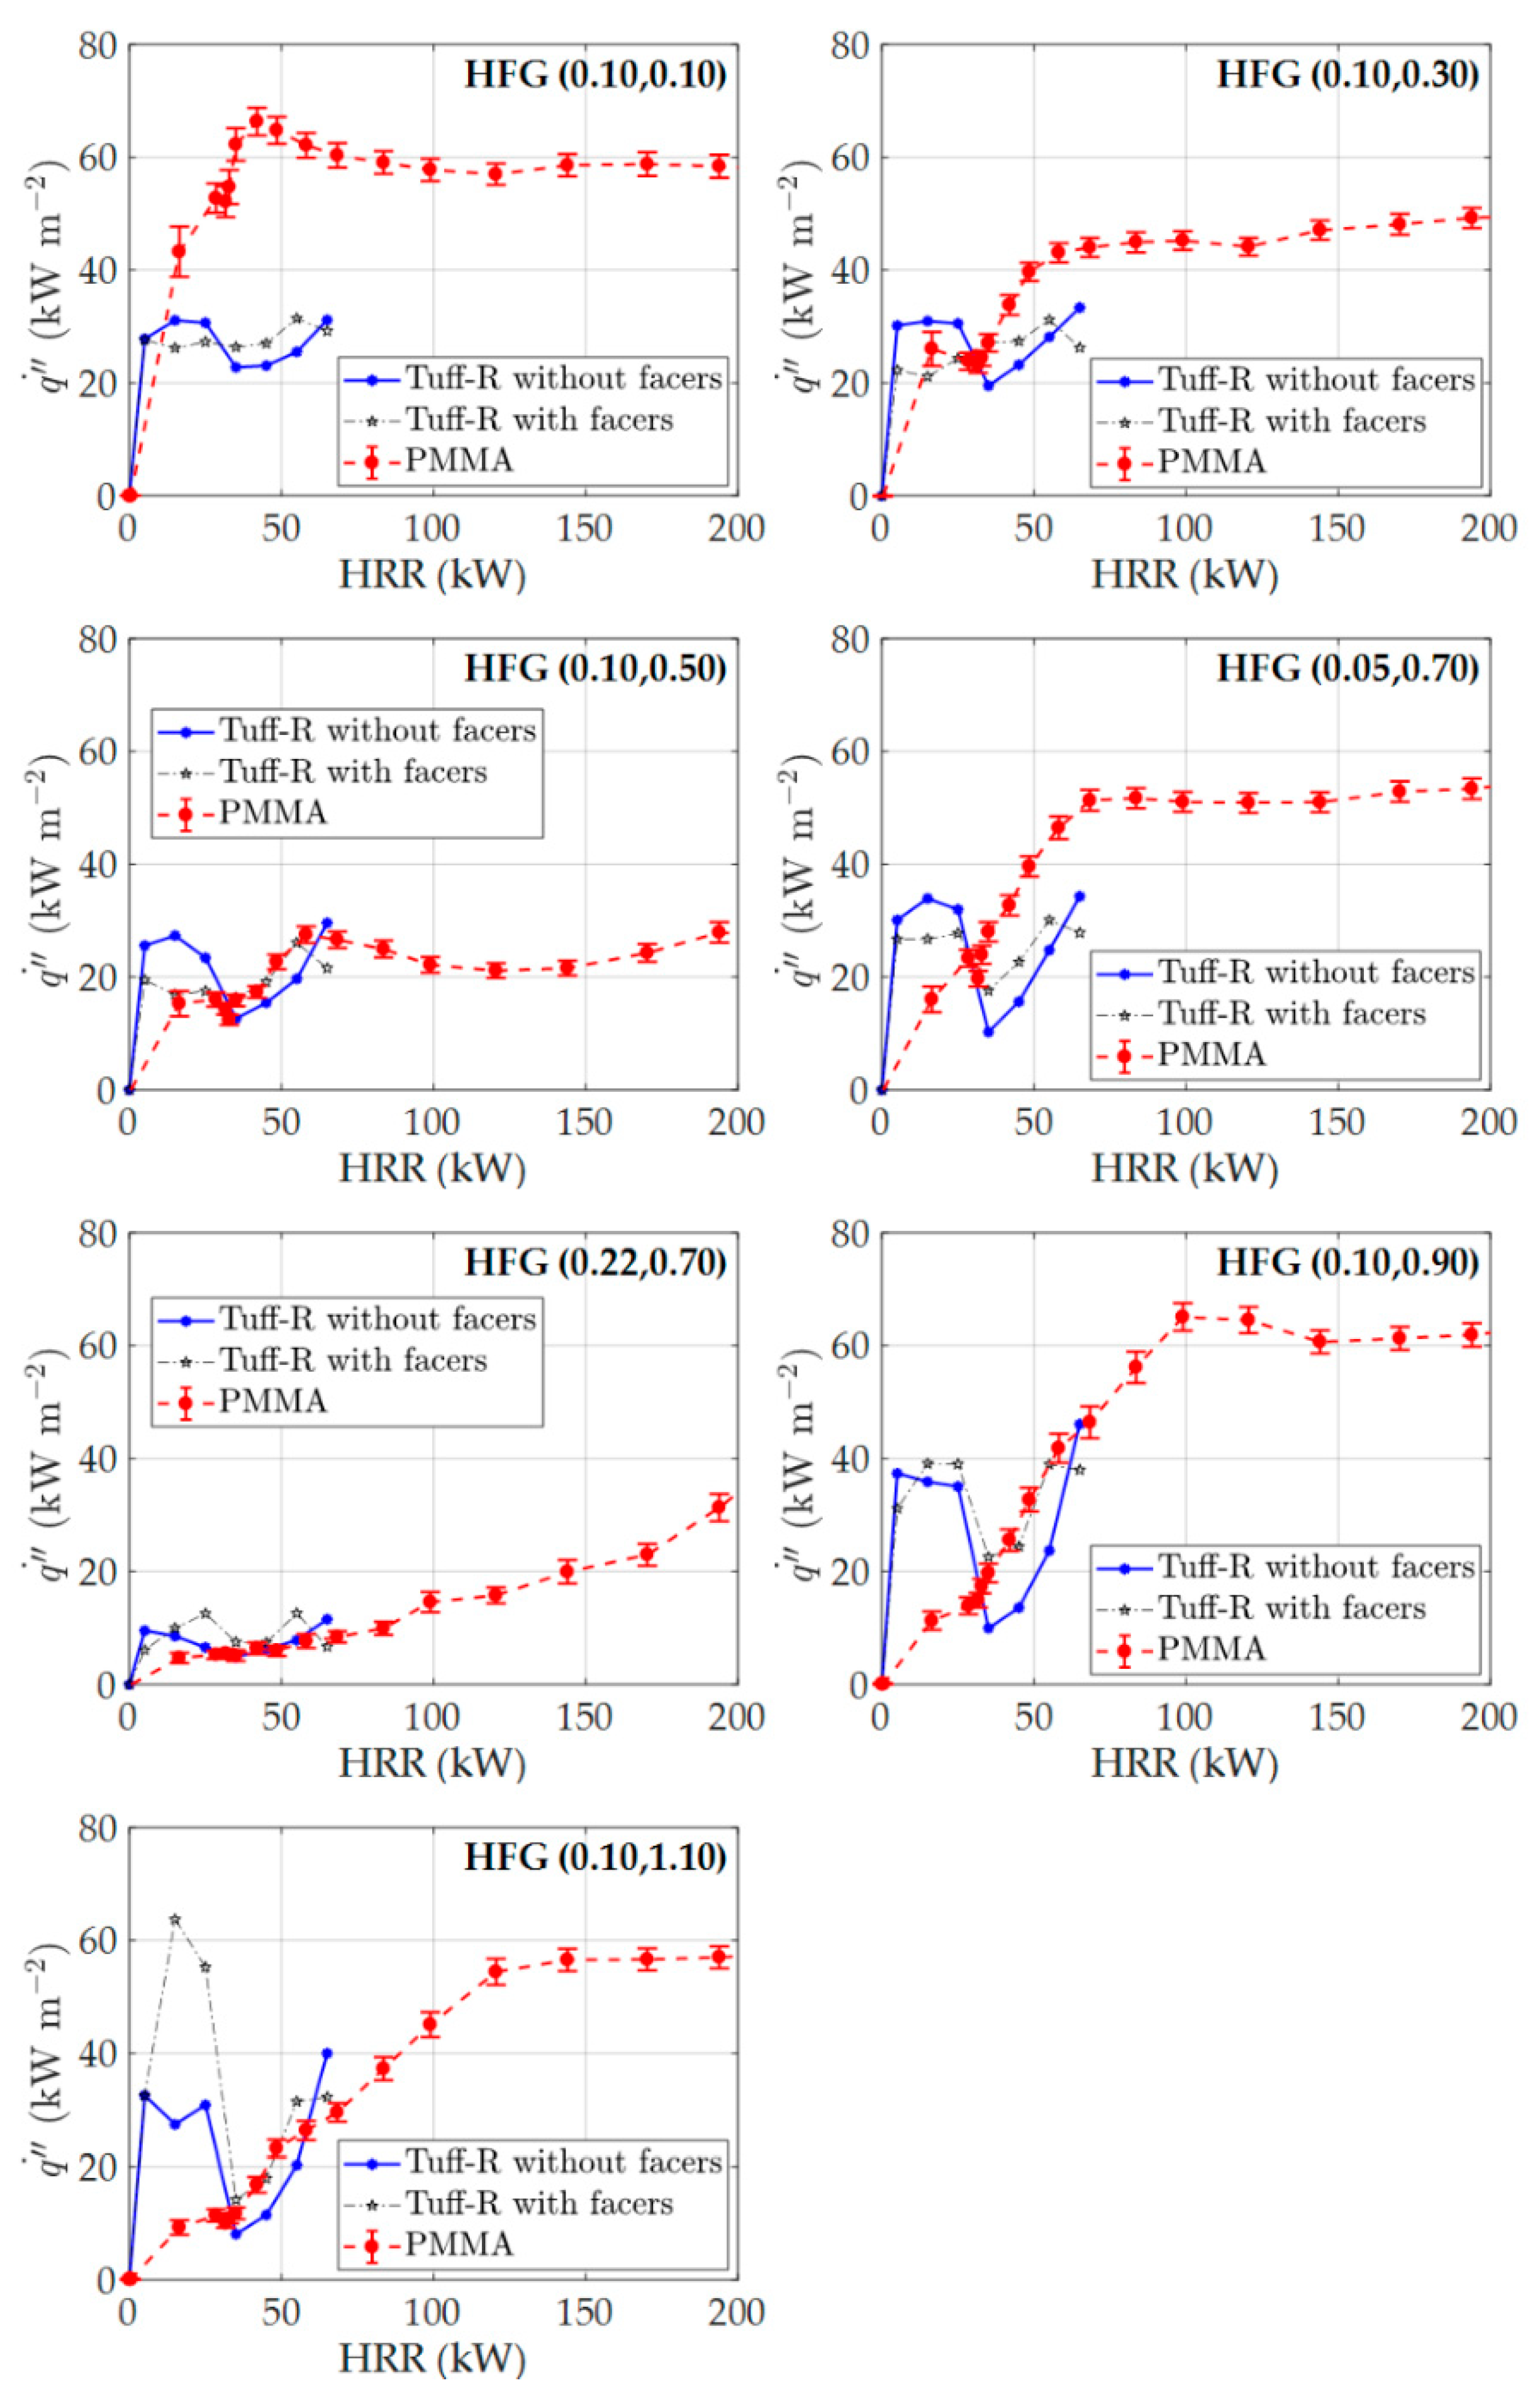
The results of the flame heat flux ( q ˙ ) measurements collected in the experiments on the insulation panels with and without facers are shown in Figure 8 together with the data obtained on PMMA in the same experimental setup, at the same burner setting, and the same panel locations [32]. All heat flux data are presented as a function of HRR. The insulation panel data exhibit a considerably larger scatter but, overall, follow the same trends as the data obtained for PMMA, which justifies their use in the semi-empirical modeling of the panel experiments. The only systematic discrepancy was observed for the (0.10, 0.10) gauge location. This discrepancy was attributed to abstraction of the gauge surface by expanding foam. This expansion was most notable for the bottom portions of the panels located near the corner.
The results of the modeling of the vertical corner flame spread experiments are compared with the experimental data in Figure 9. Only the experiments on the Tuff-R insulation panels without facers were modelled. The figure shows fully converged simulated HRR profiles using the pyrolysis models without and with the blowing agent component. The model that does not take into account the blowing agent systematically underestimates the experimental HRR. The model, including the blowing agent, provides an accurate prediction of the experiment, within 5% of the experimental data, on average.
It is important to point out that the same approach used in the current study to model the corner flame spread was also used in a previous study [32] to model flame spread on PMMA and the resulting predictions were not nearly as good as those obtained in the current work, despite the fact that PMMA is generally considered to be a much simpler material. This apparent inconsistency can be explained by two factors. First, the assumption that the flame heat flux is purely radiative is more accurate in the case of the PIR foam because its gaseous pyrolysates are likely to be better precursors for soot, which is the main radiating species. Second, the lack of significant flame spread on the Tuff-R insulation panels substantially reduced amplification of errors in the model parameters. As was detailed in the previous study [32], it is the amplification of errors associated with a strong feedback between continuously increasing HRR and flame heat feedback to the pyrolyzing solid that was found to be responsible for a relatively poor quality of the PMMA flame spread predictions.

4. Conclusions

The flammability of a PIR insulation foam product, manufactured by DuPont de Nemours Inc. and sold under the trademark Tuff-R [33], was analyzed in the current study through experiments and modeling performed on a wide array of sample sizes ranging in mass between a few milligrams and a kilogram. A complete pyrolysis property set was developed for this material; this set is summarized in Table 1 through Table 4. The pyrolysis property set was shown to accurately predict the outcomes of TGA, DSC, and MCC tests conducted on mg-sized samples at a range of heating rates, CAPA II and cone calorimetry tests performed on gram-sized samples at a range of heat flux settings, and vertical corner flame spread tests performed on entire insulation panels. The only non-standard instrument used for the pyrolysis property determination was CAPA II, but similar measurements can be performed in a standard instrument such as the Fire Propagation Apparatus (FPA) [44].
It was determined that a gaseous blowing agent stored in the foam cells contributed significantly to the foam burning rate and had to be accounted for in fire simulations. To accurately parameterize the contribution of the blowing agent to the foam flammability, cone calorimetry experiments on thick (2.54 × 10⁻² m) foam samples, which retained the blowing agent during sample preparation, were required.
A previously developed semi-empirical model [32] was used to simulate flame spread on the insulation panels in a vertical corner configuration, similar to SBI test. This model consisted of a detailed pyrolysis model (parameterized using the aforementioned milligram-scale and gram-scale experiments) coupled with a scenario-specific, spatially-resolved relationship between the total heat release rate and heat feedback from the flame to the pyrolyzing solid derived from the measurements of flame spread on PMMA. This model was found to perform well, indicating that it can be extended, without any modifications, to other materials.

Author Contributions

Conceptualization, S.I.S., M.W.B., K.A.S.; methodology, S.I.S.; software, D.M.C. and S.I.S.; validation, D.M.C. and S.I.S.; formal analysis, D.M.C. and S.I.S.; investigation, D.M.C. and S.I.S.; resources, S.I.S.; data curation, D.M.C.; writing—original draft preparation, D.M.C.; writing—review and editing, all authors; visualization, D.M.C.; supervision, S.I.S., M.W.B., K.A.S.; project administration, S.I.S.; funding acquisition, S.I.S., M.W.B., K.A.S. All authors have read and agreed to the published version of the manuscript.

Funding

This research was funded by DuPont De Nemours Inc.

Institutional Review Board Statement

Not applicable.

Informed Consent Statement

Not applicable.

Data Availability Statement

The data presented in this study are available upon request. Please send your requests to the corresponding author.

Acknowledgments

The authors would like to thank DuPont De Nemours Inc. for funding and Greg J. Fiola for assisting with the CAPA II and full-scale experiments.

Conflicts of Interest

The authors declare no conflict of interest.

Appendix A

Figure A1. Mean experimental results and model predictions for the TGA and DSC tests performed on the PIR foam at 5 K min−1 and 20 K min−1 in nitrogen.
Applsci 11 03463 g0a1
Figure A2. Mean experimental results and model predictions for the CAPA II tests performed on the PIR foam at 40 kW m−2 of set radiant heat flux.
Applsci 11 03463 g0a2

References

  1. Biswas, K.; Shrestha, S.S.; Bhandari, M.S.; Desjarlais, A.O. Insulation materials for commercial buildings in North America: An assessment of lifetime energy and environmental impacts. Energy Build. 2016, 112, 256–269. [Google Scholar] [CrossRef] [Green Version]
  2. McLaggan, M.S.; Hadden, R.M.; Gillie, M. Flammability assessment of phase change material wall lining and insulation materials with different weight fractions. Energy Build. 2017, 153, 439–447. [Google Scholar] [CrossRef]
  3. Brown, A.; Bruns, M.; Gollner, M.; Hewson, J.; Maragkos, G.; Marshall, A.; McDermott, R.; Merci, B.; Rogaume, T.; Stoliarov, S.; et al. Proceedings of the first workshop organized by the IAFSS Working Group on Measurement and Computation of Fire Phenomena (MaCFP). Fire Saf. J. 2018, 101, 1–17. [Google Scholar] [CrossRef]
  4. Rogaume, T. Thermal decomposition and pyrolysis of solid fuels: Objectives, challenges and modelling. Fire Saf. J. 2019, 106, 177–188. [Google Scholar] [CrossRef]
  5. Dick, C.; Dominguez-Rosado, E.; Eling, B.; Liggat, J.; Lindsay, C.; Martin, S.; Mohammed, M.; Seeley, G.; Snape, C. The flammability of urethane-modified polyisocyanurates and its relationship to thermal degradation chemistry. Polymer 2001, 42, 913–923. [Google Scholar] [CrossRef]
  6. Dominguez-Rosado, E.; Liggat, J.; Snape, C.; Eling, B.; Pichtel, J. Thermal degradation of urethane modified polyisocyanurate foams based on aliphatic and aromatic polyester polyol. Polym. Degrad. Stab. 2002, 78, 1–5. [Google Scholar] [CrossRef]
  7. Hidalgo, J.P.; Torero, J.L.; Welch, S. Experimental Characterisation of the Fire Behaviour of Thermal Insulation Materials for a Performance-Based Design Methodology. Fire Technol. 2017, 53, 1201–1232. [Google Scholar] [CrossRef] [Green Version]
  8. Branca, C.; Di Blasi, C.; Casu, A.; Morone, V.; Costa, C. Reaction kinetics and morphological changes of a rigid polyurethane foam during combustion. Thermochim. Acta 2003, 399, 127–137. [Google Scholar] [CrossRef]
  9. Marquis, D.M.; Batiot, B.; Guillaume, E.; Rogaume, T. Influence of reaction mechanism accuracy on the chemical reactivity prediction of complex charring material in fire condition. J. Anal. Appl. Pyrolysis 2016, 118, 231–248. [Google Scholar] [CrossRef]
  10. Günther, M.; Lorenzetti, A.; Schartel, B. Fire Phenomena of Rigid Polyurethane Foams. Polymer 2018, 10, 1166. [Google Scholar] [CrossRef] [Green Version]
  11. Modesti, M.; Lorenzetti, A. Flame retardancy of polyisocyanurate–polyurethane foams: Use of different charring agents. Polym. Degrad. Stab. 2002, 78, 341–347. [Google Scholar] [CrossRef]
  12. Vitkauskienė, I.; Makuška, R.; Stirna, U.; Cabulis, U. Thermal Properties of Polyurethane-Polyisocyanurate Foams Based on Poly(ethylene terephthalate) Waste. Mater. Sci. 2011, 17, 249–253. [Google Scholar] [CrossRef] [Green Version]
  13. Kurańska, M.; Cabulis, U.; Auguścik, M.; Prociak, A.; Ryszkowska, J.; Kirpluks, M. Bio-based polyurethane-polyisocyanurate composites with an intumescent flame retardant. Polym. Degrad. Stab. 2016, 127, 11–19. [Google Scholar] [CrossRef]
  14. Cao, Z.-J.; Dong, X.; Fu, T.; Deng, S.-B.; Liao, W.; Wang, Y.-Z. Coated vs. naked red phosphorus: A comparative study on their fire retardancy and smoke suppression for rigid polyurethane foams. Polym. Degrad. Stab. 2017, 136, 103–111. [Google Scholar] [CrossRef]
  15. Stoliarov, S.I.; Li, J. Parameterization and Validation of Pyrolysis Models for Polymeric Materials. Fire Technol. 2015, 52, 79–91. [Google Scholar] [CrossRef]
  16. Ding, Y.; Stoliarov, S.I.; Kraemer, R.H. Development of a Semiglobal Reaction Mechanism for the Thermal Decomposition of a Polymer Containing Reactive Flame Retardants: Application to Glass-Fiber-Reinforced Polybutylene Terephthalate Blended with Aluminum Diethyl Phosphinate and Melamine Polyphosphate. Polymer 2018, 10, 1137. [Google Scholar] [CrossRef] [Green Version]
  17. Ding, Y.; Kwon, K.; Stoliarov, S.I.; Kraemer, R.H. Development of a semi-global reaction mechanism for thermal decomposition of a polymer containing reactive flame retardant. Proc. Combust. Inst. 2019, 37, 4247–4255. [Google Scholar] [CrossRef]
  18. Ding, Y.; Stoliarov, S.I.; Kraemer, R.H. Pyrolysis model development for a polymeric material containing multiple flame retardants: Relationship between heat release rate and material composition. Combust. Flame 2019, 202, 43–57. [Google Scholar] [CrossRef]
  19. Ding, Y.; Swann, J.D.; Sun, Q.; Stoliarov, S.I.; Kraemer, R.H. Development of a pyrolysis model for glass fiber reinforced polyamide 66 blended with red phosphorus: Relationship between flammability behavior and material composition. Compos. Part B Eng. 2019, 176, 107263. [Google Scholar] [CrossRef]
  20. Swann, J.D.; Ding, Y.; Stoliarov, S.I. Characterization of pyrolysis and combustion of rigid poly(vinyl chloride) using two-dimensional modeling. Int. J. Heat Mass Transf. 2019, 132, 347–361. [Google Scholar] [CrossRef]
  21. Swann, J.D.; Ding, Y.; Stoliarov, S.I. Comparative analysis of pyrolysis and combustion of bisphenol A polycarbonate and poly(ether ether ketone) using two-dimensional modeling: A relation between thermal transport and the physical structure of the intumescent char. Combust. Flame 2020, 212, 469–485. [Google Scholar] [CrossRef]
  22. Swann, J.D.; Stoliarov, S.I. Determination of pyrolysis and combustion properties of poly(vinylidene fluoride) using comprehensive modeling: Relating heat transfer to the intumescent char’s porous structure. Fire Saf. J. 2020, 120, 103086. [Google Scholar] [CrossRef]
  23. McKinnon, M.B.; Stoliarov, S.I.; Witkowski, A. Development of a pyrolysis model for corrugated cardboard. Combust. Flame 2013, 160, 2595–2607. [Google Scholar] [CrossRef]
  24. McKinnon, M.B.; Stoliarov, S.I. Pyrolysis Model Development for a Multilayer Floor Covering. Materials 2015, 8, 6117–6153. [Google Scholar] [CrossRef] [PubMed] [Green Version]
  25. McKinnon, M.B.; Ding, Y.; Stoliarov, S.I.; Crowley, S.; Lyon, R.E. Pyrolysis model for a carbon fiber/epoxy structural aerospace composite. J. Fire Sci. 2017, 35, 36–61. [Google Scholar] [CrossRef]
  26. McKinnon, M.B.; Martin, G.E.; Stoliarov, S.I. Pyrolysis model for multiple compositions of a glass reinforced unsaturated polyester composite. J. Appl. Polym. Sci. 2020, 137, 47697. [Google Scholar] [CrossRef]
  27. Swann, J.D.; Ding, Y.; McKinnon, M.B.; Stoliarov, S.I. Controlled atmosphere pyrolysis apparatus II (CAPA II): A new tool for analysis of pyrolysis of charring and intumescent polymers. Fire Saf. J. 2017, 91, 130–139. [Google Scholar] [CrossRef]
  28. Stoliarov, S.; Lyon, R. Thermo-Kinetic Model of Burning for Pyrolyzing Materials. Fire Saf. Sci. 2008, 9, 1141–1152. [Google Scholar] [CrossRef] [Green Version]
  29. Stoliarov, S.I.; Leventon, I.T.; Lyon, R.E. Two-dimensional model of burning for pyrolyzable solids. Fire Mater. 2013, 38, 391–408. [Google Scholar] [CrossRef]
  30. Fiola, G.J.; Chaudhari, D.M.; Stoliarov, S.I. Comparison of Pyrolysis Properties of Extruded and Cast Poly(methyl methacrylate). Fire Saf. J. 2020, 120, 103083. [Google Scholar] [CrossRef]
  31. European Standard EN 13823. Reaction to Fire Tests for Building Products-Building Products Excluding Floorings Exposed to the Thermal Attack by A Single Burning Item; National Standards Authority of Ireland: Dublin, Ireland, 2014. [Google Scholar]
  32. Chaudhari, D.M.; Fiola, G.J.; Stoliarov, S.I. Experimental analysis and modeling of Buoyancy-driven flame spread on cast poly(methyl methacrylate) in corner configuration. Polym. Degrad. Stab. 2020, 183, 109433. [Google Scholar] [CrossRef]
  33. Safety Data Sheet. TUFF-RTM C 2.00 Inch Commerial Insulation Sheathing; Dow Chemical Company: Midland, MI, USA, 2015. [Google Scholar]
  34. Lyon, R.E.; Walters, R.N.; Stoliarov, S.I.; Safronava, N. Principles and Practice of Microscale Combustion Calorimetry; Federal Aviation Administration: Atlantic City, NJ, USA, 2013.
  35. ASTM Standard E1354. Standard Test Method for Heat and Visible Smoke Release Rates for Materials and Products Using an Oxygen Consumption Calorimeter; ASTM International: West Conshohocken, PA, USA, 2017. [Google Scholar]
  36. Swann, J.D. A Comprehensive Characterization of Pyrolysis and Combustion of Intumescent and Charring Polymers using Two-dimensional modeling: A Relationship between Thermal Transport and the Physical Structure of Intumescent Char. Ph.D. Dissertation, University of Maryland, College Park, MD, USA, 2019. [Google Scholar]
  37. Lyon, R.; Quintiere, J. Criteria for piloted ignition of combustible solids. Combust. Flame 2007, 151, 551–559. [Google Scholar] [CrossRef]
  38. Mccoy, C.G.; Tilles, J.L.; Stoliarov, S.I. Empirical Model of flame heat feedback for simulation of cone calorimetry. Fire Saf. J. 2019, 103, 38–48. [Google Scholar] [CrossRef]
  39. MatWeb- Material Property Data, Thermal Ceramics Kaowool PM Low Temperature Board. Available online: http://www.matweb.com/search/DataSheet.aspx?MatGUID=59a8251a2e6849f0b98ea96e228df036 (accessed on 7 July 2019).
  40. BNZ materials Inc. Marinite I Refractory Product Data Sheet. Available online: https://www.bnzmaterials.com/wp-con-tent/uploads/2013/03/Mar-I.pdf (accessed on 15 June 2019).
  41. MatWeb-Material Property Data, E-glass Fiber, Generic. Available online: http://www.matweb.com/search/datasheet.aspx?MatGUID=d9c18047c49147a2a7c0b0bb1743e812 (accessed on 8 May 2019).
  42. Nist Chemistry Webbook: Nist Standard Reference Database Number 69. Available online: https://webbook.nist.gov/chemistry/ (accessed on 15 November 2019).
  43. Axelsson, J.; Andersson, P.; Lönnermark, A.; Van Hees, P.; Wetterlund, I. Uncertainties in Measuring Heat and Smoke Re-Lease Rates in the Room/Corner Test and the SBI; SP Rapport 2001:04; Statens Provningsanstalt: Borås, Sweden, 2001. [Google Scholar]
  44. ASTM Standard E2058-19. Standard Test Method for Measurement of Synthetic Polymer Material Flammability Using a Fire Propagation Apparatus; ASTM International: West Conshohocken, PA, USA, 2019. [Google Scholar]
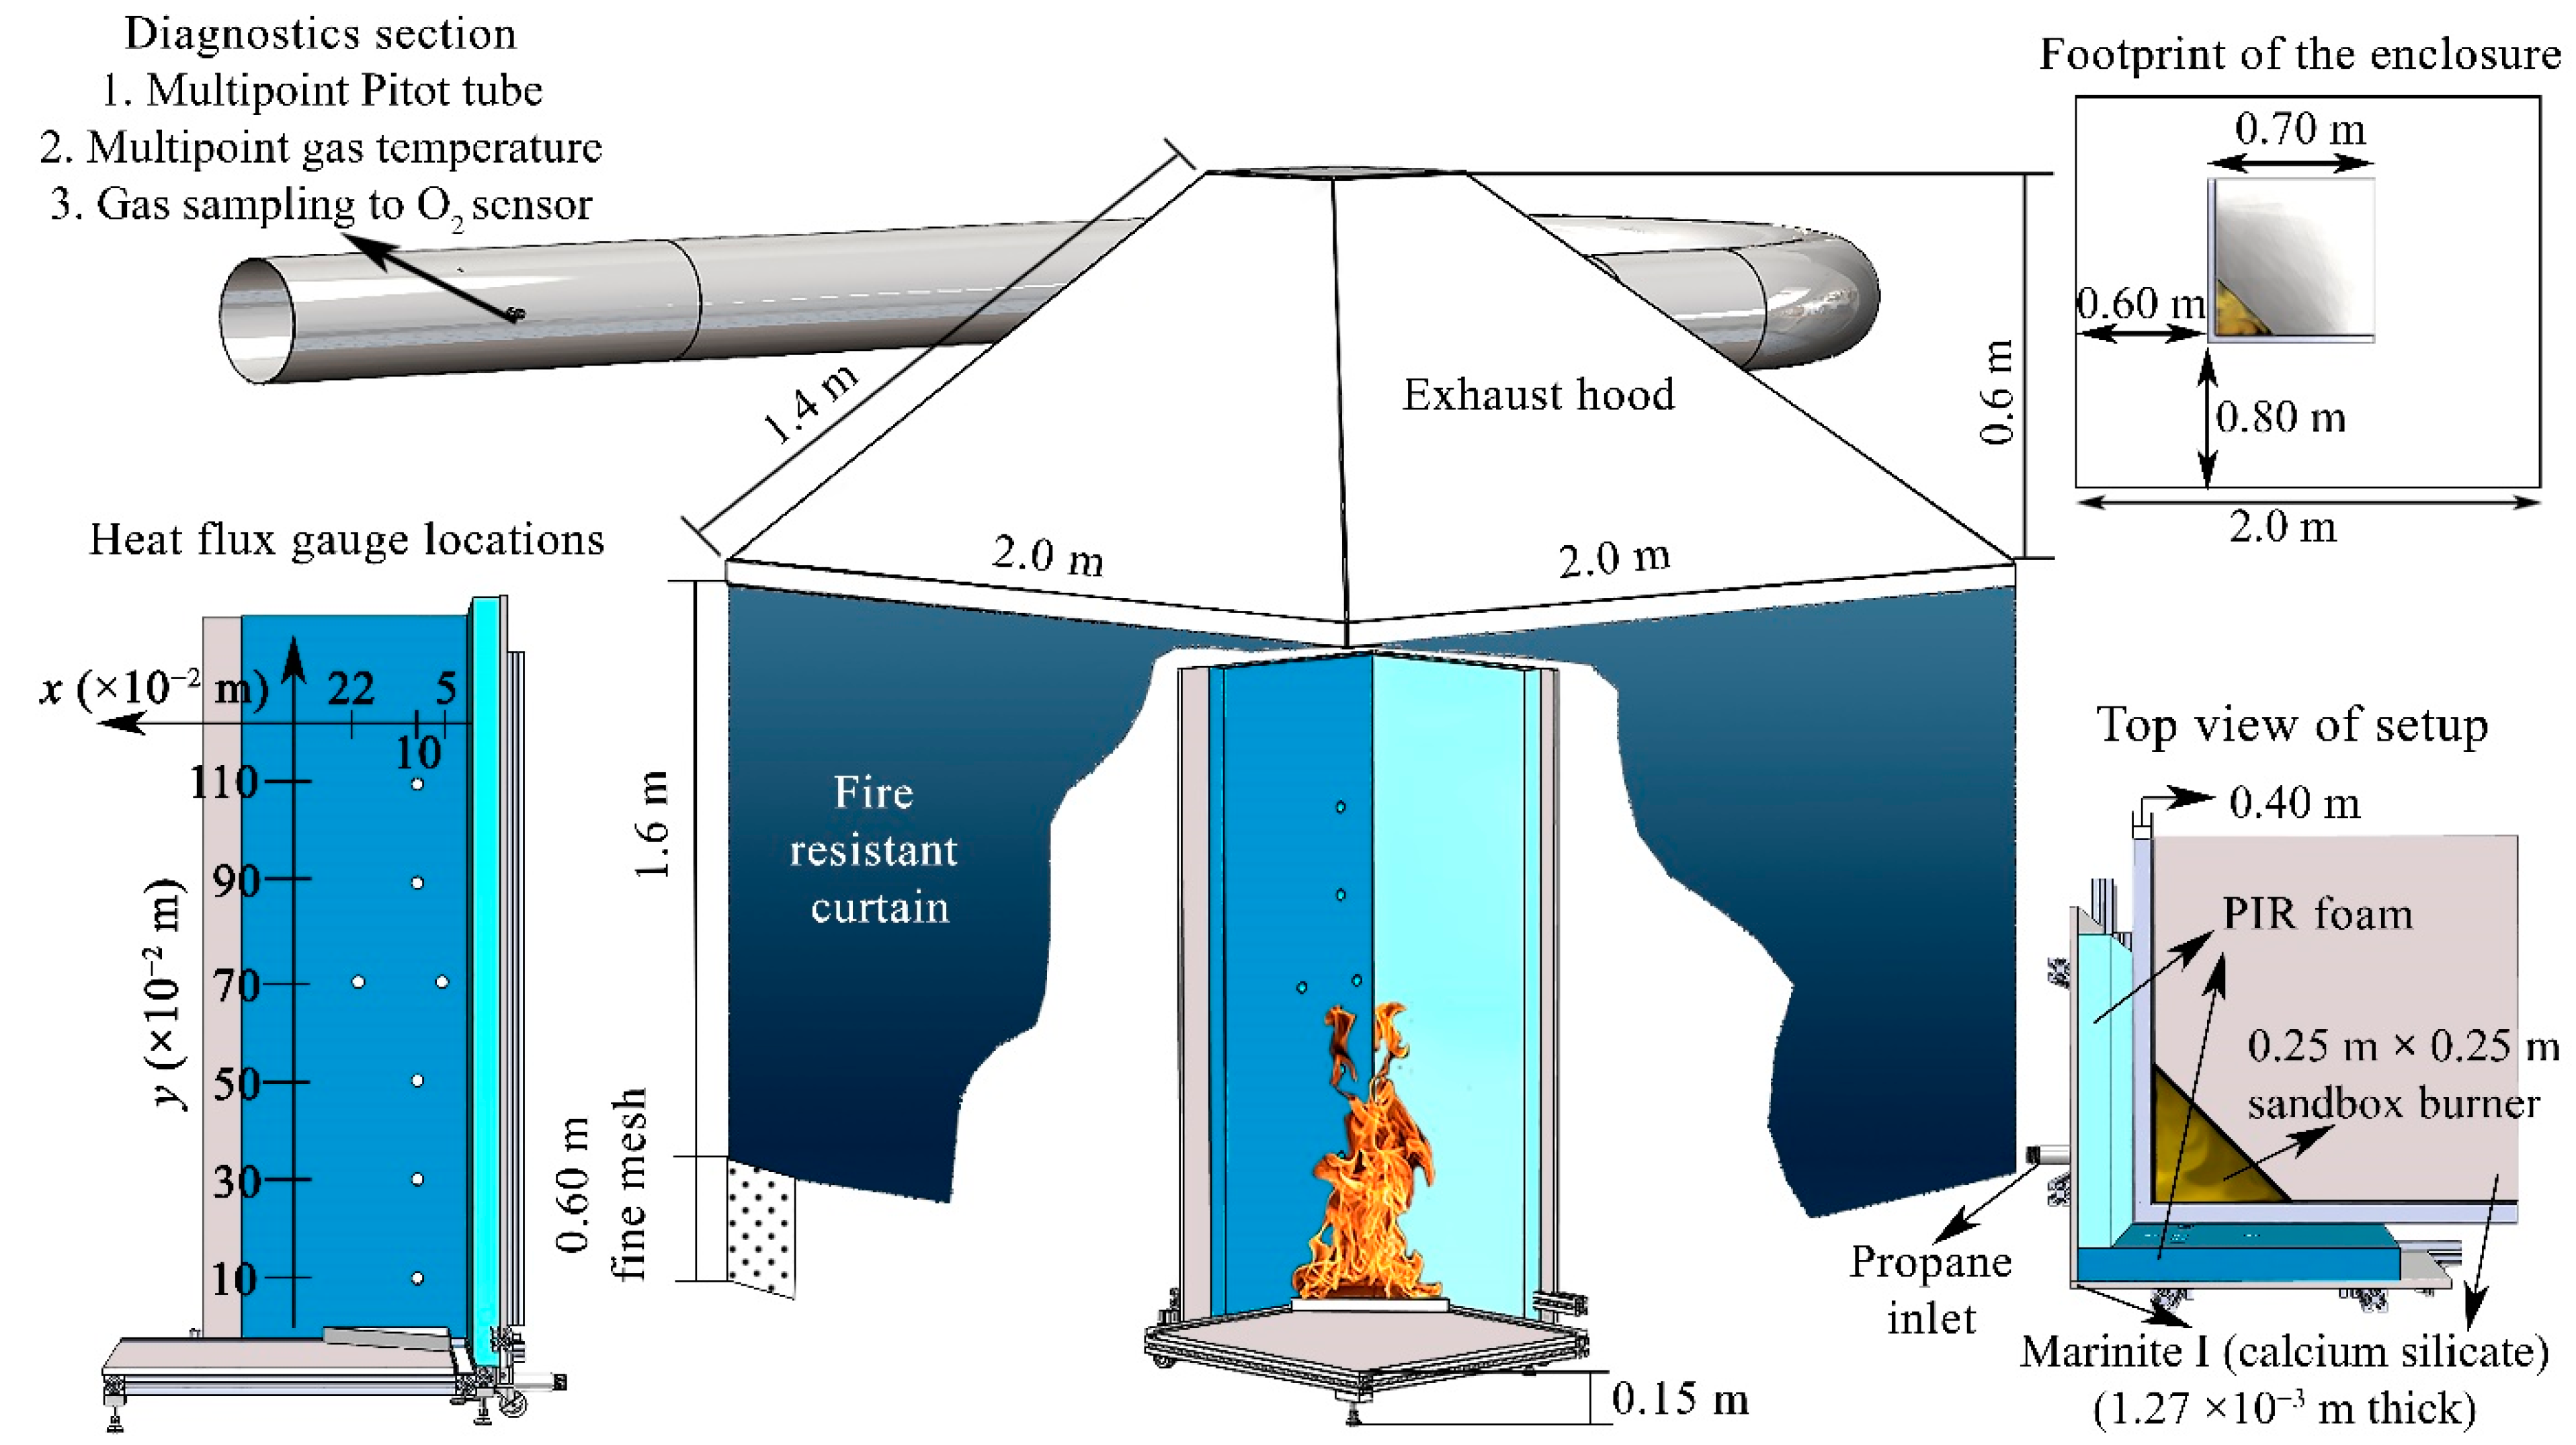
Figure 1. Schematic of the full-scale experiment.
Applsci 11 03463 g001
Figure 2. Workflow diagram for the corner wall flame spread modeling. Note that the heat flux gauge locations shown here represent locations from a previous study performed on PMMA [32].
Applsci 11 03463 g002
Figure 3. Mean experimental results and model predictions for the thermogravimetric analysis (TGA) and differential scanning calorimetry (DSC) tests performed on the PIR foam at 10 K min−1 in nitrogen.
Applsci 11 03463 g003
Figure 4. Mean experimental results and model predictions for the Microscale Combustion Calorimetry (MCC) tests performed on the PIR foam at 10 K min−1.
Applsci 11 03463 g004
Figure 5. Mean experimental results and model predictions for the Controlled Atmosphere Pyrolysis Apparatus II (CAPA II) tests performed on the PIR foam at 70 kW m−2 of set radiant heat flux.
Applsci 11 03463 g005
Figure 6. Mean experimental results and model predictions for the cone calorimetry tests performed on the PIR foam at 50 kW m−2 of set radiant heat flux.
Applsci 11 03463 g006
Figure 7. Heat release rates measured in the vertical corner flame spread experiments on the Tuff-R insulation panels with and without facers.
Applsci 11 03463 g007
Figure 8. Flame heat flux dependencies on heat release rate measured with water-cooled heat flux gauges in the vertical corner flame spread experiments on the Tuff-R insulation panels and on PMMA [32].
Applsci 11 03463 g008
Figure 9. A comparison of the mean experimental heat release rate obtained in the vertical corner flame spread experiments for the Tuff-R panels without facers with the modeling results using pyrolysis models without and with the blowing agent component.
Applsci 11 03463 g009
Table 1. The thermal decomposition reaction mechanism and parameters for the polyisocyanurate (PIR) foam. Positive ∆Hr corresponds to an endothermic reaction.
Reaction #Reaction EquationAr (s−1)Er (J mol−1)Hr (J kg−1)
1PIR → 0.992 PIR_Int_1 + 0.008 Gas_12.42 × 1088.09 × 1040
2PIR_Int_1 → 0.96 PIR_Int_2 + 0.04 Gas_22.27 × 1078.96 × 1042.16 × 104
3PIR_Int_2 → 0.80 PIR_Int_3 + 0.20 Gas_35.63 × 1081.24 × 1052.15 × 105
4PIR_Int_3 → 0.92 PIR_Int_4 + 0.08 Gas_41.00 × 1081.19 × 105−1.60 × 10⁵
5PIR_Int_4 → 0.83 PIR_Int_5 + 0.17 Gas_52.84 × 1071.24 × 1059.37 × 103
6PIR_Int_5 → 0.71 PIR_Int_6 + 0.29 Gas_66.85 × 1038.85 × 1041.06 × 105
7PIR_Int_6 → 0.73 PIR_Int_7 + 0.27 Gas_75.47 × 1016.89 × 1042.06 × 105
Table 2. Heat capacities of condensed-phase components of the PIR foam.
ComponentCp (J kg−1 K−1)
Glass fiber1.24 × T + 442
PIR4.86 × T − 357
PIR_Int_11684
PIR_Int_21684
PIR_Int_31684
PIR_Int_41684
PIR_Int_51684
PIR_Int_61684
PIR_Int_70.41 × T − 883
Table 3. Heats of combustion of gaseous products of decomposition of the PIR foam. Positive ∆Hc represents an exothermic process.
Component H c   (J kg−1)
Gas_10
Gas_21.5 × 107
Gas_31.5 × 107
Gas_40.8 × 107
Gas_52.4 × 107
Gas_62.0 × 107
Gas_73.3 × 107
Table 4. Thermal transport properties of condensed-phase components of the PIR foam.
Component ε
(-)
α
(m−1)
ρ
(kg m−3)
k
(W m−1 K−1)
Glass fiber0.81416026000.36
PIR0.95320031.40.05
PIR_Int_10.953200150.09
PIR_Int_20.953200300.04
PIR_Int_30.953200180.08
PIR_Int_40.953200170.06
PIR_Int_50.953200160.14
PIR_Int_60.953200140.15
PIR_Int_70.953200140.25
Publisher’s Note: MDPI stays neutral with regard to jurisdictional claims in published maps and institutional affiliations.