Abstract
Preharvest sprouting (PHS) is a key global issue in production and end-use quality of cereals, particularly in regions where the rainfall season overlaps the harvest. To investigate transcriptomic changes in genes affected by PHS-induction and ABA-treatment, RNA-seq analysis was performed in two wheat cultivars that differ in PHS tolerance. A total of 123 unigenes related to hormone metabolism and signaling for abscisic acid (ABA), gibberellic acid (GA), indole-3-acetic acid (IAA), and cytokinin were identified and 1862 of differentially expressed genes were identified and divided into 8 groups by transcriptomic analysis. DEG analysis showed the majority of genes were categorized in sugar related processes, which interact with ABA signaling in PHS tolerant cultivar under PHS-induction. Thus, genes related to ABA are key regulators of dormancy and germination. Our results give insight into global changes in expression of plant hormone related genes in response to PHS.
1. Introduction
Preharvest sprouting (PHS) is a key agronomic issue because it can reduce grain yield and crop quality, especially of milling and baking quality wheat [1,2], causing economic losses [3]. In Korea, the highest rainfall is in summer, with continuous rain during the harvest period, which is a major concern for wheat cultivation. Thus, controlling dormancy and germination in cereal grains and improving PHS tolerance has become a major aim of Korean wheat breeding.
Seed dormancy is a trait that blocks germination of seeds under apparently favorable conditions. Many cereal crops, including wheat, have been selected for rapid and uniform germination, and therefore show weak dormancy, making them susceptible to PHS [4,5]. In wheat, quantitative trait loci (QTLs) for dormancy and PHS tolerance have been studied by many researchers. Ogbonnaya et al. [6] utilized recombinant inbred lines (RILs) progeny populations from a cross between PHS-tolerant and -susceptible parents to study the genetic basis of dormancy and PHS tolerance, and identify the chromosomal position of QTLs for PHS tolerance. The relationships between seed color and PHS tolerance QTLs located on group 3, 4, 5, and 6 chromosomes have been studied in hexaploid wheat in Canada in breeding of white wheat [7].
Hormonal regulation is a primary mechanism of seed dormancy and germination in seed plants. Previous studies indicated that germination is regulated by phytohormones including abscisic acid (ABA) and gibberellic acid (GA). ABA and GA are key regulators of dormancy maintenance and release, respectively, with antagonistic functions [8,9,10]. Liu et al. [11] investigated the expressions of ABA, GA, jasmonic acid (JA), and IAA (indole-3-acetic acid) related genes in after-ripened wheat seeds using microarray. Seed ABA levels are regulated by balanced biosynthetic and catabolic pathways [12,13]. Genes encoding key enzymes in ABA metabolism and catabolism have been intensively studied in dormant and dormancy-released seeds [14,15]. GA breaks dormancy and promotes germination. Typically, GA levels increase and ABA levels decrease in imbibed non-dormant seeds. Light and GA promote the degradation of ABA and the expression of the GA hormone metabolism gene increase [16]. Other phytohormones, such as auxin and cytokinin, e also associated with seed dormancy and germination. Auxin, which plays an important role in regulating plant growth and development [17,18], regulates seed dormancy via an interaction with ABA signaling and ABI3 activation [19]. Crosstalk with cytokinin, a phytohormone that affects various plant developmental processes, has been thoroughly reviewed by El-Showk et al. [20].
To identify the putative key genes involved in responses to PHS and ABA treatment, RNA-seq analyses were performed. In this study, differentially expressed genes (DEGs) related to ABA and GA hormone metabolism and signaling pathways in two Korean wheat cultivars with different responses to PHS (tolerant/susceptible) were identified. Furthermore, DEGs related to auxin and cytokinin hormone metabolism and signaling were analyzed for their interactions with ABA on seed dormancy regulation. Here, we suggest the putative key genes related in phytohormone metabolism and signaling pathways for regulation of seed dormancy using comparative transcriptome analysis.
2. Materials and Methods
2.1. Plant Materials and Treatments
The research materials used were ‘Keumgang’ (Korea RDA accession no.IT213100), which is a vulnerable cultivar to PHS, and ‘Woori’ (Korea RDA accession no.IT175538) known as PHS tolerance cultivar. Seeds of both varieties were subjected to vernalization for 4 weeks at 4 °C, and then transplanted into plastic pots with a diameter of 11 cm to grow until 35 days after fertilization (DAF 35). The DAF 35 spikes were harvested as a control and stored −70 °C until RNA extraction. The sandbury method was conducted to confirm the dormant reaction of the seed by performing PHS treatments under artificial conditions, and was conducted based on the Bayer [21] experimental method. DAF 35 spikes were designated as an experimental group, and one-third of spikes of each cultivar were exposed to the ground in a plastic box of 590 mm × 380 mm containing wet sand. PHS of spikes was induced by mist treatment for 12 h for a total of 7 days.
Abscisic acid (ABA) treatment was injected with 0.1 mM ABA every 2 days to the harvested DAF 35 spikes for 7 days. After 7 days treatment of PHS or ABA, the spikes were harvested as a control and stored −70 °C until RNA extraction
‘Keumgang’ (KC),’Woori’ (WC) spikes harvested on DAF 35 were used as controls. ‘Keumgang’ (KP),’Woori’ (WP) spikes treated with PHS and ‘Keumgang’(KA), ‘Woori’ (WA) spikes treated with ABA were considered as the experimental group.
2.2. RNA Isolation and Illumina Sequencing
Total RNA extraction was performed on harvested spikes using the TRIzol method (Invitrogen, MA, USA) according to the manufacturer’s instructions. Libraries for RNA-seq analysis were prepared using the TruSeqTM RNA sample preparation kit and 100-bp paired-end sequencing was performed on the Illumina HiSeqTM-2500 platform (Illumina, CA, USA). The DynamicTrim and LengthSort provided in SolexaQA [22]. All clean readings were assembled using Oases [23] and Velvet assembler [24], and the contacts created by de novo assembly of readings are called unigenes.
2.3. Bioinformatic Analysis of Rna-Seq Data
For gene annotation, de novo assembled unigenes were compared against databases including the Phytozome, Gene Ontology (GO), UniProt, eukaryotic Ortholog Groups (LOG), Kyoto Encyclopedia of Genes and Genomes (KEGG), and The Arabidopsis Information Resource (TAIR). Unigene sequences were also mapped to IWGSC MIPS v2.2 wheat transcriptome sequences (IWGSC 2014) using BLAST with an e-value cutoff of 1 × 10⁻¹⁰; gene IDs with >95% identity and <2 bp mismatch were selected [25].
Paired-end clean reads were mapped back to de novo assembled unigenes to obtain read counts for expression analysis using Bowtie 2. Gene expression levels from read counts were normalized to Reads Per Kilobase per Million (RPKM) with the edgeR package of Bioconductor in the R software environment. Unigenes with > 500 raw read counts from at least one library were selected and the log2 value of the relative RPKM ratio was applied to determine relative expression levels. Genes with an absolute log2 value of the relative RPKM ratio > |1| (2-fold change) were defined as differentially expressed genes (DEGs). Heatmaps were generated by using the heatmap. 2 function in the gplots package in the R software environment. To analyze gene ontology (GO) enrichment and network analysis of DEGs, the lists of Arabidopsis thaliana orthologous were uploaded to ClueGO [26] plug-in of Cytoscape [27] and the hypergeometric test was applied (p < 0.05).
2.4. Validation of RNA-Seq by qRT-PCR
RNA-seq results were validated by qRT-PCR. Total RNA extraction was performed using RNA purification (RibospinTM Seed/Fruit, GeneAll® Biotechnology, Seoul, Korea) and extracted according to the protocol suggested by the manufacturer. After adjusting the total RNA concentration to be used for cDNA synthesis to 1000 ng/µL, first strand cDNA synthesis was performed using the Power cDNA Synthesis Kit (iNtRON Biotechnology, Seoul, Korea) as suggested by the manufacturer’s instructions. Quantitative Real-time PCR was conducted using QIAGEN’s Rotor-Gene Q (QIAGEN, Hilden, Germany) Real Time-PCR machine with Rotor-Gene SYBR Green PCR kit (QIAGEN, Hilden, Germany). Primer set for qRT-PCR were designed using Primer3 program and listed in Table S13 [28]. The relative expression level was normalized by DAF 35 Keumgang spike using the 2−ΔΔCt [29] method.
3. Results
3.1. RNA-Seq Data Analysis
A total of six libraries (control, PHS-induced and ABA treated samples of both cultivars, KC, KP, KA, WC, WP, and WA) were generated by paired-end sequencing on the Illumina HiSeqTM-2500 platform. After quality control and sequence pre-processing, clean reads with an average length of 82.22 bp were obtained and mapped to IWGSC MIPS v2.2 wheat transcriptome sequences. However, the average mapping rate for all samples was 45% and especially 10% for the WC library. The mapping results were not suitable for expression analysis and thus de novo assembly was performed. The Oases/Velvet assemblers generated 104,542 and 98,607 contigs for ‘Keumgang’ and ‘Woori,’ respectively; the ‘Keumgang’ assembled contigs, with an average length of 733 bp, were used as mapping reference sequences and regarded as unigene. A summary of the RNA-seq data is shown in Table 1. Among 104,542, a total of 16,727 unigenes according to our selection criteria (>500 raw read counts from at least one library) were selected for analysis.

Table 1.
Summary of transcriptome sequencing and mapping.
3.2. Gene Ontology (GO) Network Analysis of DEGs
To identify the genes that interacted with phytohormones metabolisms or signaling, the DEGs were divided into 8 groups based on their comparative expression levels. DEGs included in phytohormone metabolisms and signaling pathways were excluded for the GO analysis. The comparative expression levels and number of DEGs are illustrated in Table 2.
Table 2.
Grouping comparative expression levels and number of differentially expressed genes (DEGs).
Group-I to group-IV represents the DEGs that showed higher expression in ‘Woori’ compared to ‘Keumgang’, and group-V to group-VIII represents the DEGs that showed higher expression in ‘Keumgang’ compared to ‘Woori’. Group-I, II, V, and VI represents the DEGs that showed higher expression in ABA treatment, including the genes with differential expression between PHS treatment (group-I and V), or including the genes that are not the DEGs (group-II and VI). As we are interested in the DEGs expressed in the PHS tolerant cultivar, ‘Woori’, the DEGs that were known to interact with phytohormones were screened in the group-I to IV. GO analysis of group-V to VIII are represented in Figure S1 and Tables S5–S8.
To understand the biological relevance of the DEGs of each analysis groups, we performed functional enrichment analysis using ClueGO with ontology sources of cellular component (CC), biological process (BP), and molecular function (MF). Among 456 DEGs included in group-I, 230 genes were matched to Arabidopsis orthologous and were mainly involved in the flavonoid biosynthetic process, benzene-containing compound metabolic process, and alpha-amino acid catabolic process (Figure 1A, Table S1). Group-II have DEGs of four categories of L-phenylalanine metabolic processes, sugar:proton symporter activity, drug transmembrane transport, and positive regulation of translation (Figure 1B, Table S2). In group-III, 85 Arabidopsis orthologous were identified and functionally categorized. A total of 30 GO terms were categorized into 12 functional groups including filiform apparatus and trehalose biosynthetic processes (Figure 1C, Table S3). Group-IV has 7 categories including the trehalose biosynthetic process, potassium/proton antiporter activity, and GMP synthase (glutamine-hydrolyzing) activity (Figure 1D, Table S4). Group-V has 10 categories including cysteine-type peptidase activity, cytoplasmic side of plasma membrane, and DNA conformation change (Figure S1A, Table S5). Group-VI DEGs, which showed comparatively higher expression in ‘Keumgang’ under ABA-treatment but showed no significantly different expression between two cultivars under PHS-induction, were divided into 5 categories (nucleosome, regulation of anthocyanin metabolic process, cellulose biosynthetic process, GA mediated signaling pathway, and regulation of ABA-activated signaling pathway) (Figure S1B, Table S6). Among 428 DEGs included in group-VII, 308 genes were matched to Arabidopsis orthologous (TAIR gene IDs) and were mainly involved in chloroplast thylakoid, including photosynthetic processes (Figure S1C, Table S7). In group-VIII, there were 32 Arabidopsis orthologous genes among 43 DEGs divided into 7 functional categories including abscisic aldehyde oxidase activity, linoleate 9S-lipoxygenase activity, and the chitin catabolic process (Figure S1D, Table S8).

Figure 1.
Network analysis of (A) DEGs group-I; (B) II; (C) III; and (D) IV. Analysis shows specific gene ontology (GO) categories enrichment of DEGs that showed higher expression in ‘Woori’ compared to ‘Keumgang’.
3.3. Expression Analysis of Genes Related to ABA Hormone Metabolism and Signaling
A total of 8 unigenes were identified as encoding ABA metabolic enzymes, one for zeaxanthin epoxidase (ZEP), one for 9-cis-epoxycarotenoid dioxygenase (NCED), 4 for ABA-aldehyde oxidase (AAO), and two for ABA 8ʹ-hydroxylases (CYP707A) (Figure 2A). The genes encoding ZEP were up-regulated differentially (RPKM ratio > 1) in PHS tolerant cultivar ‘Woori’ under both PHS and ABA treatment (WP and WA, respectively) and not differentially (RPKM ratio < 1) in PHS susceptible cultivar ‘Keumgang’ under both PHS and ABA treatment (KP and KA, respectively). Along with ZEP, NCED is involved in the early phase of ABA hormone metabolism (conversion of violaxanthin to xanthoxin). The gene encoding NCED was up-regulated only in ‘Woori (WP and WA)’. Most AAO genes involved in ABA metabolic pathway were differentially up-regulated in all samples, and especially highly up-regulated in WA. Two ABA catabolic genes CYP707A were identified in our dataset and showed contrasting expression patterns.
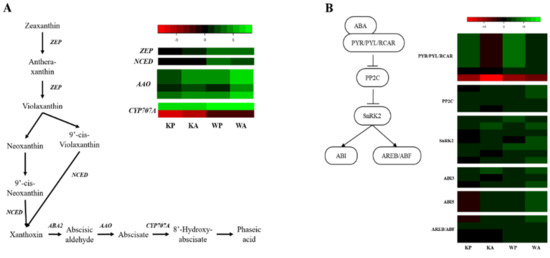
Figure 2.
Heat map analysis of DEGs from preharvest sprouting (PHS) and Abscisic Acid (ABA) treatment for ABA hormone metabolism and signaling: (A) hormone metabolism pathway of ABA and comparative expression of genes related to ABA hormone metabolism and signaling pathway of ABA; (B) comparative expression of genes related to ABA signaling. The heatmap shows an expression change compared to the controls for each cultivar, with log2 fold-change values.
Based on our RNA-seq results, 28 unigenes (7 PYR/PYL/RCAR, 4 PP2C, 7 SnRK, 6 ABIs, and 4 ABF/AREBs) were annotated as ABA signaling related genes (Figure 2B). Among 7 genes encoding ABA receptors PYR/PYL/RCAR, 5 genes showed same expression patterns (differentially up-regulated in KP, WP, and WA, and down-regulated in KA). Most signaling pathways downstream of PYR/PYL/RCAR were differentially up-regulated, but ABI5s and one AREB/ABF were differentially down-regulated in KP. The detailed information and comparative expression value of ABA metabolic and signaling genes are shown in Table S9.
3.4. GA Hormone Metabolism and Signaling Genes
Based on our RNA-seq dataset, a total of 12 unigenes were identified as encoding GA metabolic pathways. Among the GA metabolic genes, we identified 4 copalyl diphosphate synthase (CPS), 5 ent-kaurene synthase (KS), 2 ent-kaurene oxidase (KO), and one gibberellin 2-beta dioxygenase (GA2ox) (Figure 3A). Starting with geranylgeranyl pyrophosphate (GGPP), CPS converts GGPP to ent-Copalyl-PP. One CPS (Traes_7BL_02F3E2C78.1) was differentially down-regulated in KP and up-regulated in WP, whereas other 3 CPS (Traes_2AS_A4BAAEE05.1, Traes_2DS_7917F0E44.1, and Traes_2BL_80AC86A1A.1) were highly up-regulated under KP and WP. The former is located on chromosome 7 (7BL), and the latter are located on chromosome 2 (2AS, 2DS, and 2BL). The five KS unigenes proved to be located on chromosome group 2. Four of these genes were highly up-regulated in KP and WP (Traes_2AS_2610FD515.1, Traes_2AS_D3212BACF.1, Traes_2BL_212C1CE5C.1, and Traes_2BL_B06E350C2.1) and identified to be located on 2AS and 2BL. The other KS was located on 2DL (Traes_2DL_BEDDAC0D4.1). GA2ox, which catalyzes biologically active gibberellin G1 to in-active GA8, was differentially up-regulated in KP, WP, and WA, and not differentially down-regulated in KA.
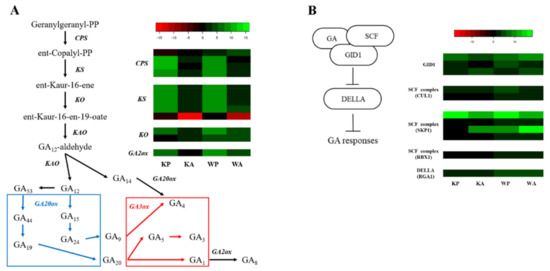
Figure 3.
Heat map analysis of DEGs from PHS and ABA treatment for gibberellic acid (GA) hormone metabolism and signaling: (A) hormone metabolism pathway of GAs and comparative expression of genes related to GAs hormone metabolism. All the process in blue box and red box are catalyzed by GA20ox and GA3ox, respectively; (B) Signaling pathway of GA and comparative expression of genes related to GA signaling. The heatmap shows an expression change compared to the controls for each cultivar, with log2 fold-change values.
In the GA signaling pathway, 3 unigenes were identified as encoding GA receptors, GID1, 7 unigenes as encoding SCF complex (2 CUL1, 4 SKP1, and 1 RBX1), and one DELLA protein (RGA1) (Figure 3B). Although most of the GA receptors and SCF complex genes were up-regulated, gene encoding RGA1, which repress the GA response, is also up-regulated in all treated samples and showed higher expression in ‘Woori’. The detailed information and comparative expression value of GA metabolic and signaling genes are shown in Table S10.
3.5. Expression of IAA and Cytokinin Hormome Metabolism and Signaling Genes
Auxin (IAA) and cytokinin are also important phytohormones that regulate many aspects of plant growth and development. Plants possess two major pathways for IAA hormone metabolism: the tryptophan (Trp)-independent and Trp-dependent pathways. The Trp-dependent pathway contains several routes: IAM, IPA, TAM, and IAOX [30,31]. In our dataset, there was a total of 64 metabolites and signaling unigenes of IAA and cytokinin (Tables S11 and S12). For IAA hormone metabolism, 36 unigenes representing IAA metabolic enzymes, including anthranilate synthase (ASA), phosphoribosylanthranilate transferase (PAT), phosphoribosylanthranilate isomerase (PAI), indole-3-glycerol phosphate synthase (IGS), tryptophan synthase α (TSA), tryptophan synthase β (TSB), amidase1 (AMI1) for the indole-3-acetamide (IAM) route, aldehyde oxidase (AAO), and flavin monooxygenase (YUC) for the indole-3-pyruvic acid (IPA) route, and cytochrome P450 (CYP79B2) and nitrilase (NIT) for the indole-3-acetaldoxime (IAOX) route, were identified (Figure 4A). In WP, all the metabolic genes except one TSA (Traes_5DL_508B4718C.1, which was down-regulated in all treated samples) and YUC (Traes_5BL_078A5DC9C1.1) were differentially up-regulated (94%) whereas 67% of IAA metabolic genes were up-regulated in KA (Table S11). In IAA signaling pathway, majority of genes were up-regulated in all treated samples (Figure 4B). In particularly, genes encoding ARF16, which is known to regulate expression of ABI3 on ABA signaling, showed higher up-regulations in ‘Woori’.
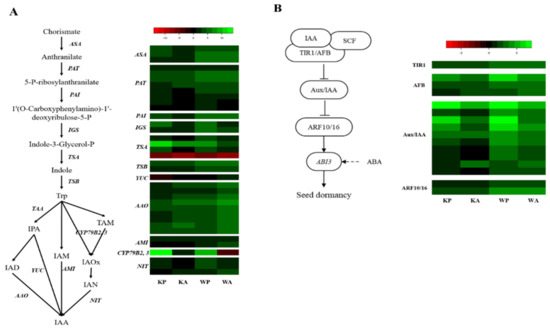
Figure 4.
Heat map analysis of DEGs from PHS and ABA treatment for indole-3-acetic acid (IAA) hormone metabolism and signaling: (A) hormone metabolism pathway of IAA and comparative expression of genes related to IAA hormone metabolism; (B) signaling pathway of IAA and comparative expression of genes related to IAA signaling. The heatmap shows an expression change compared to the controls for each cultivar, with log2 fold-change values.
Based on our RNA-seq data, two enzymes (IPP and IPT) related to cytokinin hormone metabolism were identified (Figure 5A). One of IPTs, Traes_1BL_5C0E7A70E.1, was up-regulated in all samples while the other one, Traes_2BS_8FF7A4DD7.1, was differentially up-regulated in WP and WA (Table S12). Three enzymes (HK, Type B ARR, and Type A ARR) were identified as associated protein for cytokinin signaling (Figure 5B). All the unigenes involved in the cytokinin signaling were up-regulated in all samples except one Type B ARR (Traes_4DL_2527CA8BF.1) in KA (RPKM ratio = 0.887).
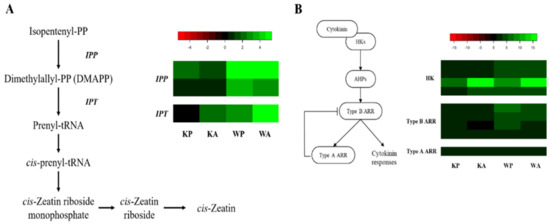
Figure 5.
Heat map analysis of DEGs from PHS and ABA treatment for GA hormone metabolism and signaling: (A) hormone metabolism pathway of cytokinin and comparative expression of genes related to cytokinin hormone metabolism; (B) signaling pathway of cytokinin and comparative expression of genes related to cytokinin signaling. The heatmap shows an expression change compared to the controls for each cultivar, with log2 fold-change values.
3.6. Validation of DEG Data by qRT-PCR
To confirm the expression patterns, qRT-PCR analysis was performed using randomly selected unigenes from hormone metabolism, signaling related DEGs. The selected DEGs for qRT-PCR were listed in Table S13. As shown in Figure 6, the RNA-seq results fold change values were agreed with the qRT-PCR expression patterns. The comparison of RNA-seq data and qRT-PCR data suggested accuracy of sequencing methods.
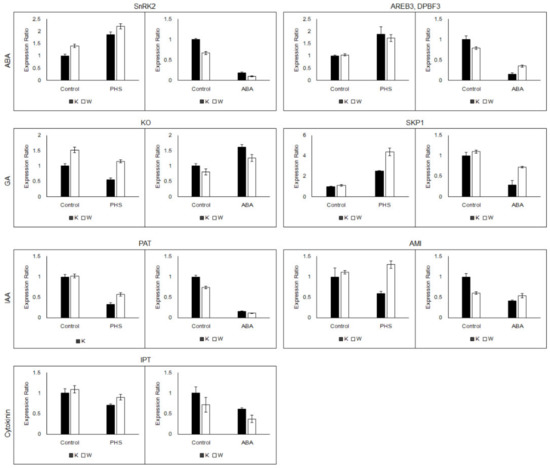
Figure 6.
Validation of selected DEGs for ABA, GA, IAA, and cytokinin by quantitative real-time RT-PCR.
4. Discussion
In this study, transcriptome analysis was performed to identify DEGs for PHS-induced and ABA-treated two Korean wheat cultivars with different PHS tolerance. The analysis was focused on the expression patterns of the genes related to hormones metabolism and signaling and differentially expressed genes between treatment and cultivars.
In ABA signaling pathway, ABI and AREB/ABF lead the ABA responses and are activated by SnRK2. Soon et al. [32] reported that activities of SnRK2.6 are controlled by ABA and four SnRK2.6 (Traes_2AS_64E0EF151.1, Traes_2DL_6CD064E13.1, Traes_5AL_4EE2511FA.1, and Traes_4AL_44E99BA01.1) were identified in our RNA-seq results (Table S9). The degree of up-regulation of SnRK2 and downstream genes ABIs and AREB/ABFs were higher in ‘Woori’ than ‘Keumgang’ in both PHS-induced and ABA-treated samples.
Figure 3 showed the GA hormone metabolism and the expression patterns of related genes in our RNA-seq data. Huang et al. [33] reported the identification and chromosomal location of genes related to GA hormone metabolism in wheat using ‘Chinese Spring’ nulli-tetrasomic lines. They isolated three TaCPS genes localized on chromosomes 7A, 7B, and 7D and three TaKS genes localized on chromosomes 2A, 2B, and 2D. DNA gel blotting using HvCPSL1 probe showed strong hybridization bands on chromosome group 7 and weak hybridization bands on chromosome group 2 of wheat [34]. Gibberellins have several forms of bio-active and bio-inactive (or precursors) such as GA1 and GA8, respectively. In our raw data there were GA20ox and GA3ox that convert bio-inactive GA19 to GA20 and bio-active GA1 from bio-inactive GA20, respectively, but these were not selected in analysis due to the gene selection criteria, unfortunately. GA20ox was down-regulated in ‘Keumgang’ (KP and KA) and up-regulated in WA and the contents of GA20 were lower in ‘Keumgang’ than ‘Woori’ (Figure 3). GA3ox showed no different expression between cultivars except PHS treated samples (higher in KP with RPKM ratio 2.362).
After the first identification of GID1 in GA signaling mutants of rice [35], GID1 orthologous were identified in Arabidopsis [36,37]. The ubiquitin-proteasome system (UPS), via SCF complex, is utilized in signaling via many plant hormones, including IAA, jasmonic acid (JA), GA, strigolactone, ethylene, and ABA [38], and SCF complex components were recently studied in developing wheat spikes [33,39]. Although all the genes encoding GA receptors and SCF complexes were up-regulated, DELLA gene was also up-regulated in ‘Woori’ (RPKM ratio 4.35 in WP and 4.72 in WA).
The other hormones, IAA and cytokinin, are known to regulate seed dormancy and germination via interactions with ABA. IAA interacts with ABA and ABI3. With high IAA content, ARF10/16 is activated and ABI3 is expressed to maintain seed dormancy [19,40], and PHS-tolerant cultivar ‘Woori’ showed up-regulation in all genes encoding ABI3 and ARF10/16, whereas 60% of the genes were up-regulated in ‘Keumgang’. Wang et al. [41] proposed that cytokinin regulates germination via interactions between cytokinin signaling and ABA, so that the Type A ARR represses ABI5, promoting germination. Although expression of Type A ARR showed higher up-regulation in ‘Woori’ than in ‘Keumgang,’ expression of all three ABI5 was up-regulated in WP and down-regulated in KP. All the transcriptome analysis results of phytohormone hormone metabolism and signaling suggest that GA, IAA, and cytokinin may play a subordinate role to ABA in terms of dormancy and germination and ABA is the primary regulator of dormancy and inhibition of germination.
The DEG analysis also supports the role of ABA in seed dormancy and germination inhibition. DEG analysis group-II, III, and IV, which showed significant higher expression of DEGs in PHS-tolerant cultivar ‘Woori’ than ‘Keumgang’, had GO categories related to sugar biosynthetic processing or transport (trehalose biosynthetic process and sugar/proton symporter activity). In particular, ‘Woori’ showed higher expression of genes related in the trehalose biosynthetic process when PHS induced (group-III and IV). Trehalose is a disaccharide synthesized from two glucose molecules (UDP-Glc + Glc-6-P) [42,43] and widely used economically in areas such as food industry and medicine [44,45]. Dekkers et al. [46] reported, via the effect of sugars in 10 different Arabidopsis accessions, that glucose induced the delay of germination. They also investigated the germination delay effect other sugars (galactose, sucrose, maltose and trehalose) and the interaction with phytohormones. GA or ethylene was independent from the sugars, and ABA contents led the glucose response although ABA seemed to be independent on ABI2, 4, and 5 signaling. The sugar-induced delay of germination is involved in ABI3-mediated ABA signaling, and RGL2 (RGA-like 2) and SPY (SPINDLY) in GA signaling. The effects of exogenous glucose on germination inhibition is studied using abi3, rgl2, and spy5 Arabidopsis mutants [47]. RNA-seq data revealed two RGL2 genes and one SPY gene which showed higher up-regulation in ‘Woori’ than in ‘Keumgang’, but these were not selected for investigation due to the gene selection criteria. There were DEGs categorized into flavonoid biosynthetic process and L-phenylalanine metabolic process in group-I and II, respectively, which showed comparatively higher expression in WA than KA whether genes were expressed differentially or not in KP and WP along with drug membrane transport (including ABCG40s in our raw dataset). A total of 6 DEGs were identified as encoding phenylalanine ammonia-lyase 1 (PAL1) in group-I and II (each group had 3 PAL1 genes). PAL1 catalyze the phenylpropanoid pathway and regulate the content of flavonoids. Trehalose is also known to activate PAL to enhance powdery mildew resistance [48,49]. Therefore, the majority of categorized DEGs that showed comparatively higher expression in ‘Woori’ (DEG analysis group-I to IV) were involved in sugar-ABA interactions and consequently the ABI3-mediated ABA signaling.
5. Conclusions
In conclusion, a total of 104,542 unigenes were identified from RNA-seq which were used as mapping reference of six samples of artificial PHS-induced and ABA-treated ‘Keumgang’ and ‘Woori’. Among them, 123 unigenes were identified to be related to hormone metabolism and signaling pathways of phytohormones, ABA, GA, IAA, and cytokinin and 1862 of differentially expressed genes. The transcriptome analysis of phytohormone metabolism and signaling related genes and GO categorization of DEGs suggest that the main factor affecting PHS is ABA and ABI-mediated signaling (Figure 7). These results provided the data of transcriptional changes during PHS and consequently provide the clues for understanding processes of PHS and seed dormancy.
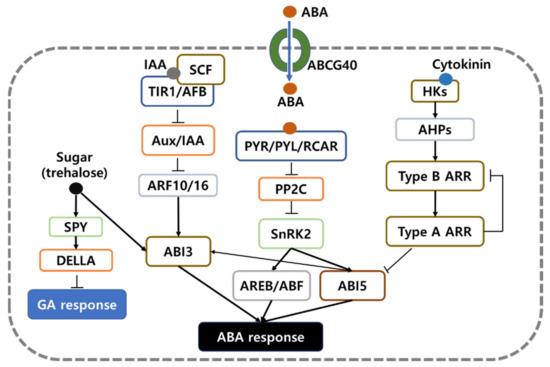
Figure 7.
Proposed schematic diagram of the DEGs identified by RNA-seq transcriptome analysis in this study.
Supplementary Materials
The following are available online at https://www.mdpi.com/article/10.3390/app11083562/s1, Figure S1: Network analysis of DEGs group-Ⅴ to Ⅷ, Table S1: Categorization of group-I differentially expressed genes (DEGs), Table S2: Categorization of group-II differentially expressed genes (DEGs), Table S3: Categorization of group-III differentially expressed genes (DEGs), Table S4: Categorization of group-IV differentially expressed genes (DEGs), Table S5: Categorization of group-V differentially expressed genes (DEGs), Table S6: Categorization of group-VI differentially expressed genes (DEGs), Table S7: Categorization of group-VII differentially expressed genes (DEGs), Table S8: Categorization of group-VIII differentially expressed genes (DEGs), Table S9: Expression of unigenes related in ABA hormone metabolism and signaling, Table S10: Expression of unigenes related in GA hormone metabolism and signaling, Table S11: Expression of unigenes related in IAA hormone metabolism and signaling, Table S12: Expression of unigenes related in cytokinin hormone metabolism and signaling, Table S13: List of selected ABA, GA, IAA, Cytokinin pathway genes and gene identification. Constructed pathway gene specific primers are listed as forward (F) and reverse (R) primers used in qRT-PCR analysis.
Author Contributions
Data curation, Y.J.L.; Writing-Original draft preparation, Y.J.L.; Investigation, S.Y.P.; Validation, S.Y.P.; Writing-Reviewing, S.Y.P.; Editing, S.Y.P., D.Y.K. and J.Y.K.; Conceptualization, J.Y.K.; methodology, D.Y.K., J.Y.K.; Funding acquisition, J.Y.K.; Supervision, J.Y.K. All authors have read and agreed to the published version of the manuscript.
Funding
This research was funded by Cooperative Research Program for Agriculture Science and Technology Development (Project No. PJ0148232021)” Rural Development Administration, Republic of Korea.
Institutional Review Board Statement
Not applicable.
Informed Consent Statement
Informed consent was obtained from all subjects involved in the study.
Data Availability Statement
Raw sequencing data have been deposited in the NCBI Bioproject (https://www.ncbi.nlm.nih.gov/bioproject/PRJNA658641, accessed on 22 August 2020) under the 6 accession numbers (SRX8986259, SRX8986260, SRX8986261, SRX8986262, SRX8986263, SRX8986264) in Sequence Read Archive (SRA).
Acknowledgments
This research was supported by the National University Development Project by the Ministry of Education in 2020.
Conflicts of Interest
The authors declare no conflict of interest.
References
- Groos, C.; Gay, G.; Perretant, M.R.; Gervais, L.; Bernard, M.; Dedryver, F.; Charmet, G. Study of the relationship between pre-harvest sprouting and grain color by quantitative trait loci analysis in a whitexred grain bread-wheat cross. Theor. Appl. Genet. 2002, 104, 39–47. [Google Scholar] [CrossRef]
- Roy, J.K.; Prasad, M.; Varshney, R.K.; Balyan, H.S.; Blake, T.K.; Dhaliwal, H.S.; Singh, H.; Edwards, K.J.; Gupta, P.K. Identification of a microsatellite on chromosomes 6B and a STS on 7D of bread wheat showing an association with preharvest sprouting tolerance. Theor. Appl. Genet. 1999, 99, 336–340. [Google Scholar] [CrossRef]
- Gubler, F.; Millar, A.A.; Jacobsen, J.V. Dormancy release, ABA and pre-harvest sprouting. Curr. Opin. Plant Biol. 2005, 8, 183–187. [Google Scholar] [CrossRef]
- Barrero, J.M.; Cavanagh, C.; Verbyla, K.L.; Tibbits, J.F.; Verbyla, A.P.; Huang, B.E.; Rosewarne, G.M.; Stephen, S.; Wang, P.; Whan, A.; et al. Transcriptomic analysis of wheat near-isogenic lines identifies PM19-A1 and A2 as candidates for a major dormancy QTL. Genome Biol. 2015, 16, 93. [Google Scholar] [CrossRef] [PubMed]
- Hilhorst, H. A critical update on seed dormancy. I. Primary dormancy. Seed Sci. Res. 1995, 5, 61–73. [Google Scholar] [CrossRef]
- Ogbonnaya, F.C.; Imtiaz, M.; Ye, G.; Hearnden, P.R.; Hernandez, E.; Eastwood, R.F.; van Ginkel, M.; Shorter, S.C.; Winchester, J.M. Genetic and QTL analyses of seed dormancy and preharvest sprouting resistance in the wheat germplasm CN10955. Theor. Appl. Genet. 2008, 116, 891–902. [Google Scholar] [CrossRef] [PubMed]
- Fofana, B.; Humphreys, G.; Rasul, G.; Cloutier, S.; Somers, D. Assessment of molecular diversity at QTLs for preharvest sprouting resistance in wheat using microsatellite markers. Genome 2008, 51, 375–386. [Google Scholar] [CrossRef]
- Holdsworth, M.J.; Bentsink, L.; Soppe, W.J. Molecular networks regulating Arabidopsis seed maturation, after-ripening, dormancy and germination. New Phytol. 2008, 179, 33–54. [Google Scholar] [CrossRef]
- Nambara, E.; Okamoto, M.; Tatematsu, K.; Yano, R.; Seo, M.; Kamiya, Y. Abscisic acid and the control of seed dormancy and germination. Seed Sci. Res. 2010, 20, 55–67. [Google Scholar] [CrossRef]
- Nonogaki, H. Seed dormancy and germination—emerging mechanisms and new hypotheses. Front. Plant Sci. 2014, 5, 223. [Google Scholar] [CrossRef]
- Liu, A.; Gao, F.; Kanno, Y.; Jordan, M.C.; Kamiya, Y.; Seo, M.; Ayele, B.T. Regulation of Wheat Seed Dormancy by After-Ripening Is Mediated by Specific Transcriptional Switches That Induce Changes in Seed Hormone Metabolism and Signaling. PLoS ONE 2013, 8, e56570. [Google Scholar] [CrossRef]
- Kushiro, T.; Okamoto, M.; Nakabayashi, K.; Yamagishi, K.; Kitamura, S.; Asami, T.; Hirai, N.; Koshiba, T.; Kamiya, Y.; Nambara, E. The Arabidopsis cytochrome P450 CYP707A encodes ABA 8’-hydroxylases: Key enzymes in ABA catabolism. EMBO J. 2004, 23, 1647–1656. [Google Scholar] [CrossRef] [PubMed]
- Saito, S.; Hirai, N.; Matsumoto, C.; Ohigashi, H.; Ohta, D.; Sakata, K.; Mizutani, M. Arabidopsis CYP707As Encode (+)-Abscisic Acid 8′-Hydroxylase, a Key Enzyme in the Oxidative Catabolism of Abscisic Acid. Plant Physiol. 2004, 134, 1439–1449. [Google Scholar] [CrossRef] [PubMed]
- Cadman, C.S.; Toorop, P.E.; Hilhorst, H.W.; Finch-Savage, W.E. Gene expression profiles of Arabidopsis Cvi seeds during dormancy cycling indicate a common underlying dormancy control mechanism. Plant J. 2006, 46, 805–822. [Google Scholar] [CrossRef]
- Lefebvre, V.; North, H.; Frey, A.; Sotta, B.; Seo, M.; Okamoto, M.; Nambara, E.; Marion-Poll, A. Functional analysis of Arabidopsis NCED6 and NCED9 genes indicates that ABA synthesized in the endosperm is involved in the induction of seed dormancy. Plant J. 2006, 45, 309–319. [Google Scholar] [CrossRef]
- Toyomasu, T.; Kawaide, H.; Mitsuhashi, W.; Inoue, Y.; Kamiya, Y. Phytochrome regulates gibberellin biosynthesis during germination of photoblastic lettuce seeds. Plant Physiol. 1998, 118, 1517–1523. [Google Scholar] [CrossRef]
- Chapman, E.J.; Estelle, M. Mechanism of auxin-regulated gene expression in plants. Annu. Rev. Genet. 2009, 43, 265–285. [Google Scholar] [CrossRef]
- Vanneste, S.; Friml, J. Auxin: A trigger for change in plant development. Cell 2009, 136, 1005–1016. [Google Scholar] [CrossRef] [PubMed]
- Liu, X.; Zhang, H.; Zhao, Y.; Feng, Z.; Li, Q.; Yang, H.Q.; Luan, S.; Li, J.; He, Z.H. Auxin controls seed dormancy through stimulation of abscisic acid signaling by inducing ARF-mediated ABI3 activation in Arabidopsis. Proc. Natl. Acad. Sci. USA 2013, 110, 15485–15490. [Google Scholar] [CrossRef]
- El-Showk, S.; Ruonala, R.; Helariutta, Y. Crossing paths: Cytokinin signalling and crosstalk. Development 2013, 140, 1373–1383. [Google Scholar] [CrossRef]
- Bayer, A.C. Pre-harvest sprouting. Annu. Wheat Newsl. 1987, 33, 40. [Google Scholar]
- Cox, M.P.; Peterson, D.A.; Biggs, P.J. SolexaQA: At-a-glance quality assessment of Illumina second-generation sequencing data. BMC Bioinform. 2010, 11, 485. [Google Scholar] [CrossRef] [PubMed]
- Schulz, M.H.; Zerbino, D.R.; Vingron, M.; Birney, E. Oases: Robust de novo RNA-seq assembly across the dynamic range of expression levels. Bioinformatics 2012, 28, 1086–1092. [Google Scholar] [CrossRef] [PubMed]
- Zerbino, D.R.; Birney, E. Velvet: Algorithms for de novo short read assembly using de Bruijn graphs. Genome Res. 2008, 18, 821–829. [Google Scholar] [CrossRef] [PubMed]
- Nussbaumer, T.; Martis, M.M.; Roessner, S.K.; Pfeifer, M.; Bader, K.C.; Sharma, S.; Gundlach, H.; Spannagl, M. MIPS PlantsDB: A database framework for comparative plant genome research. Nucleic Acids Res. 2013, 41, D1144–D1151. [Google Scholar] [CrossRef] [PubMed]
- Bindea, G.; Mlecnik, B.; Hackl, H.; Charoentong, P.; Tosolini, M.; Kirilovsky, A.; Fridman, W.H.; Pages, F.; Trajanoski, Z.; Galon, J. ClueGO: A Cytoscape plug-in to decipher functionally grouped gene ontology and pathway annotation networks. Bioinformatics 2009, 25, 1091–1093. [Google Scholar] [CrossRef]
- Shannon, P.; Markiel, A.; Ozier, O.; Baliga, N.S.; Wang, J.T.; Ramage, D.; Amin, N.; Schwikowski, B.; Ideker, T. Cytoscape: A software environment for integrated models of biomolecular interaction networks. Genome Res. 2003, 13, 2498–2504. [Google Scholar] [CrossRef] [PubMed]
- Rozen, S.; Skaletsky, H. Primer3 on the WWW for general users and for biologist programmers. Methods Mol. Biol. 2000, 132, 365–386. [Google Scholar]
- Livak, K.J.; Schmittgen, T.D. Analysis of Relative Gene Expression Data Using Real-Time Quantitative PCR and the 2−ΔΔCT Method. Methods 2001, 25, 402–408. [Google Scholar] [CrossRef]
- Normanly, J. Approaching cellular and molecular resolution of auxin biosynthesis and metabolism. Cold Spring Harb. Perspect. Biol. 2010, 2, a001594. [Google Scholar] [CrossRef]
- Woodward, A.W.; Bartel, B. Auxin: Regulation, action, and interaction. Ann. Bot. 2005, 95, 707–735. [Google Scholar] [CrossRef]
- Soon, F.F.; Ng, L.M.; Zhou, X.E.; West, G.M.; Kovach, A.; Tan, M.H.; Suino-Powell, K.M.; He, Y.; Xu, Y.; Chalmers, M.J.; et al. Molecular mimicry regulates ABA signaling by SnRK2 kinases and PP2C phosphatases. Science 2012, 335, 85–88. [Google Scholar] [CrossRef]
- Huang, Y.; Yang, W.; Pei, Z.; Guo, X.; Liu, D.; Sun, J.; Zhang, A. The genes for gibberellin biosynthesis in wheat. Funct. Integr. Genom. 2012, 12, 199–206. [Google Scholar] [CrossRef] [PubMed]
- Spielmeyer, W.; Ellis, M.; Robertson, M.; Ali, S.; Lenton, J.R.; Chandler, P.M. Isolation of gibberellin metabolic pathway genes from barley and comparative mapping in barley, wheat and rice. Theor. Appl. Genet. 2004, 109, 847–855. [Google Scholar] [CrossRef] [PubMed]
- Ueguchi-Tanaka, M.; Nakajima, M.; Katoh, E.; Ohmiya, H.; Asano, K.; Saji, S.; Hongyu, X.; Ashikari, M.; Kitano, H.; Yamaguchi, I.; et al. Molecular interactions of a soluble gibberellin receptor, GID1, with a rice DELLA protein, SLR1, and gibberellin. Plant Cell 2007, 19, 2140–2155. [Google Scholar] [CrossRef] [PubMed]
- Griffiths, J.; Murase, K.; Rieu, I.; Zentella, R.; Zhang, Z.L.; Powers, S.J.; Gong, F.; Phillips, A.L.; Hedden, P.; Sun, T.P.; et al. Genetic characterization and functional analysis of the GID1 gibberellin receptors in Arabidopsis. Plant Cell 2006, 18, 3399–3414. [Google Scholar] [CrossRef]
- Nakajima, M.; Shimada, A.; Takashi, Y.; Kim, Y.-C.; Park, S.-H.; Ueguchi-Tanaka, M.; Suzuki, H.; Katoh, E.; Iuchi, S.; Kobayashi, M.; et al. Identification and characterization of Arabidopsis gibberellin receptors. Plant J. 2006, 46, 880–889. [Google Scholar] [CrossRef] [PubMed]
- Santner, A.; Estelle, M. The ubiquitin-proteasome system regulates plant hormone signaling. Plant J. 2010, 61, 1029–1040. [Google Scholar] [CrossRef] [PubMed]
- Hong, M.J.; Kim, D.Y.; Seo, Y.W. Cullin, a component of the SCF complex, interacts with TaRMD5 during wheat spike development. Biol. Plant. 2014, 58, 218–230. [Google Scholar] [CrossRef]
- Nag, R.; Maity, M.K.; DasGupta, M. Dual DNA Binding Property of ABA insensitive 3 Like Factors Targeted to Promoters Responsive to ABA and Auxin. Plant Mol. Biol. 2005, 59, 821–838. [Google Scholar] [CrossRef]
- Wang, Y.; Li, L.; Ye, T.; Zhao, S.; Liu, Z.; Feng, Y.Q.; Wu, Y. Cytokinin antagonizes ABA suppression to seed germination of Arabidopsis by downregulating ABI5 expression. Plant J. 2011, 68, 249–261. [Google Scholar] [CrossRef] [PubMed]
- Gómez, L.D.; Gilday, A.; Feil, R.; Lunn, J.E.; Graham, I.A. AtTPS1-mediated trehalose 6-phosphate synthesis is essential for embryogenic and vegetative growth and responsiveness to ABA in germinating seeds and stomatal guard cells. Plant J. 2010, 64. [Google Scholar] [CrossRef]
- Lunn, J.E.; Delorge, I.; Figueroa, C.M.; Van Dijck, P.; Stitt, M. Trehalose metabolism in plants. Plant J. 2014, 79, 544–567. [Google Scholar] [CrossRef] [PubMed]
- Chang, S.W.; Chang, W.H.; Lee, M.R.; Yang, T.J.; Yu, N.Y.; Chen, C.S.; Shaw, J.F. Simultaneous production of trehalose, bioethanol, and high-protein product from rice by an enzymatic process. J. Agric. Food Chem. 2010, 58, 2908–2914. [Google Scholar] [CrossRef]
- Wang, J.-H.; Tsai, M.-Y.; Lee, G.-C.; Shaw, J.-F. Construction of a Recombinant Thermostable β-Amylase-Trehalose Synthase Bifunctional Enzyme for Facilitating the Conversion of Starch to Trehalose. J. Agric. Food Chem. 2007, 55, 1256–1263. [Google Scholar] [CrossRef]
- Dekkers, B.J.; Schuurmans, J.A.; Smeekens, S.C. Glucose delays seed germination in Arabidopsis thaliana. Planta 2004, 218, 579–588. [Google Scholar] [CrossRef]
- Yuan, K.; Wysocka-Diller, J. Phytohormone signalling pathways interact with sugars during seed germination and seedling development. J. Exp. Bot. 2006, 57, 3359–3367. [Google Scholar] [CrossRef]
- Reignault, P.H.; Cogan, A.; Muchembled, J.; Lounes-Hadj Sahraoui, A.; Durand, R.; Sancholle, M. Trehalose induces resistance to powdery mildew in wheat. New Phytol. 2001, 149, 519–529. [Google Scholar] [CrossRef]
- Tayeh, C.; Randoux, B.; Vincent, D.; Bourdon, N.; Reignault, P. Exogenous trehalose induces defenses in wheat before and during a biotic stress caused by powdery mildew. Phytopathology 2014, 104, 293–305. [Google Scholar] [CrossRef] [PubMed]


Publisher’s Note: MDPI stays neutral with regard to jurisdictional claims in published maps and institutional affiliations. |
© 2021 by the authors. Licensee MDPI, Basel, Switzerland. This article is an open access article distributed under the terms and conditions of the Creative Commons Attribution (CC BY) license (https://creativecommons.org/licenses/by/4.0/).