1. Introduction
While some researchers have evaluated main vulnerability discovery models by using actual data for different operating systems [
1], other researchers have assessed the major effects of the exploitation of those vulnerabilities and data security breaches.
It is now known that no organization may be immune to data breaches and that when breaches occur, they can have major consequences. The data breach may be looked at differently in different fields. Any security violation action on the protected data which results in the release of the data to unauthorized entities, could be considered as a data breach. The security violation may be a result of a cyber-attack, theft or loss of devices, theft or leak of the employee data, such as security credentials, and human errors. In industrial and business systems, the main cyber-attacks include SQL injection, cross-site scripting (XSS) and privilege escalation. SQL injection is one of the most common attacks that might destroy a database by the placement of a crafted malicious code in SQL statements via a web page input.
There have been many widely discussed data breaches in recent years. The published reports suggest widely different estimates of the costs. The different estimation methods lead to considerable confusion and disagreements. Therefore, it is important to develop a systematic and consolidated estimation model that will assist in a reliable determination of the quantitative estimates. This is important because of the economic impact on not only the shareholders’ stakes in an individual organization but also the society as a whole. In the quantitative assessment approach, the calculation of overall costs depends on the direct and indirect costs.
A systematic understanding of the costs of data breaches can aid in the optimization of the data breach response plans. According to a Symantec/Ponemon Institute study, this can potentially lead to a reduction of up to 47% in the costs related to the breaches [
2].
A formal quantitative model that takes a systematic approach for the estimation of the total cost based on the number of records and other factors is required. That model should reflect actual field data and should be based on realistic assumptions. As discussed later, the model includes economy of scale since the metric data breach cost per record is found to be misleading [
3]. In addition, a quantitative model for the probability of a breach during a one-year period is an important part of estimating data breach risk. Quantitative risk assessment takes into consideration all the risks related to the information technology systems where data are securely stored or handled.
Layton and Waters [
4] have estimated the tangible and intangible costs of data breaches for Telstra and LinkedIn. They only consider labor costs as tangible costs and reputation loss (stock price movement after breach) as intangible costs.
Recently, Algarni and Malaiya have proposed an approach for consolidating the factors that influence the cost [
3]. They have examined all the factors that impact data-breach risks incorporated in all the available data breach calculators and have removed the factors that are redundant or are not significant enough.
In existing models, the cost of security breaches is not appropriately calculated, because important aspects of estimating data breach risk are not considered. Although the levels of security solutions and the number of secure deployments have increased, the cost of the security breaches, which is growing linearly, is manageable. In order to quantify how a model performs in describing the data, we calculated the R-squared value, which gives an indication of how well the model fits the data. Using the power regression model, the computations of the cost calculations involved with a data breach can be improved. If the simplicity of the power regression model requires fewer computations with less complexity, the R-squared value will be better. The result will be between 0 and 1, with 1 or very close to 1 representing a perfect fit of the data. In a correct model, the regression line should have an upward slope, which suggests that abnormal churn and per capita costs are linearly related. One goal of this research is to develop a systematic model that provides insights into characteristics upon which the cost of a data breach can be based.
Using the data provided by the Ponemon Institute, we concluded that our portrayal of Ponemon’s model as simple is both accurate and entirely fair. In this analysis, we show that the approach used by Ponemon is not only overly simple but also misleading; it may even be harmful to organizations using the Ponemon research in their risk analyses. Using only the number of records lost in a breach is not an accurate indication of the impact of that breach. However, this model has an advantage in its simplicity. The end-user can multiply the number of records in their system by a fixed dollar figure and get an estimate of loss.
In this paper, we propose computational models for both the cost and likelihood of security breaches. The cost is divided into a few partial costs, and a model is proposed for each. The proposed model is based on the available data; it formalizes and consolidates the computational approaches used by the existing calculators. A preliminary modeling approach had been proposed [
3] using a linear relationship between the breach size (number of records involved in the breach) and the cost of the breach. A careful examination of the data (when the breach sizes span several orders of magnitude) suggests that a power regression model (considered here) is more appropriate than a linear model.
Quantitative assessment of cybersecurity risks for managing security costs and mitigating data breaches in the business system allows us to maintain the security issues of data management considered in the business environments. Cybersecurity risks are studied using datasets related to cyber-attacks, which occur in many data handling organizations.
The paper is organized as follows.
Section 2 presents the literature review. In
Section 3, the applicability of the existing models is examined.
Section 4 presents an estimation approach using an economy of scale since the concept of cost per record is misleading for breaches of different magnitudes. In
Section 5, a formal model for data breach costs is introduced. In
Section 6, an approach for estimating the likelihood of a data breach within a year for an organization is discussed. Existing challenges and limitations are discussed in
Section 7. Finally, in
Section 8, conclusions are presented with further work.
2. Literature Review
According to [
5], the requirements of security against data breach risk, challenges of securing health-related data, and existing security techniques are important and provide rudiments for the investigation of security management for analyzing data security and privacy. Requirements depend on the changing laws of health-related data, ethics of human life, and health domains. The number of issues in the security challenges is growing, because the health data handling with emerging technologies is not kept in one place for the health analysis. In this challenge, managing health data with computing is one of the potential security and privacy issues. Additionally, other related challenges are legal and ethical compliance, consent management, etc. This research takes cryptographic security, blockchain-based security, access control and security analysis, and network security into consideration for improving data security solutions.
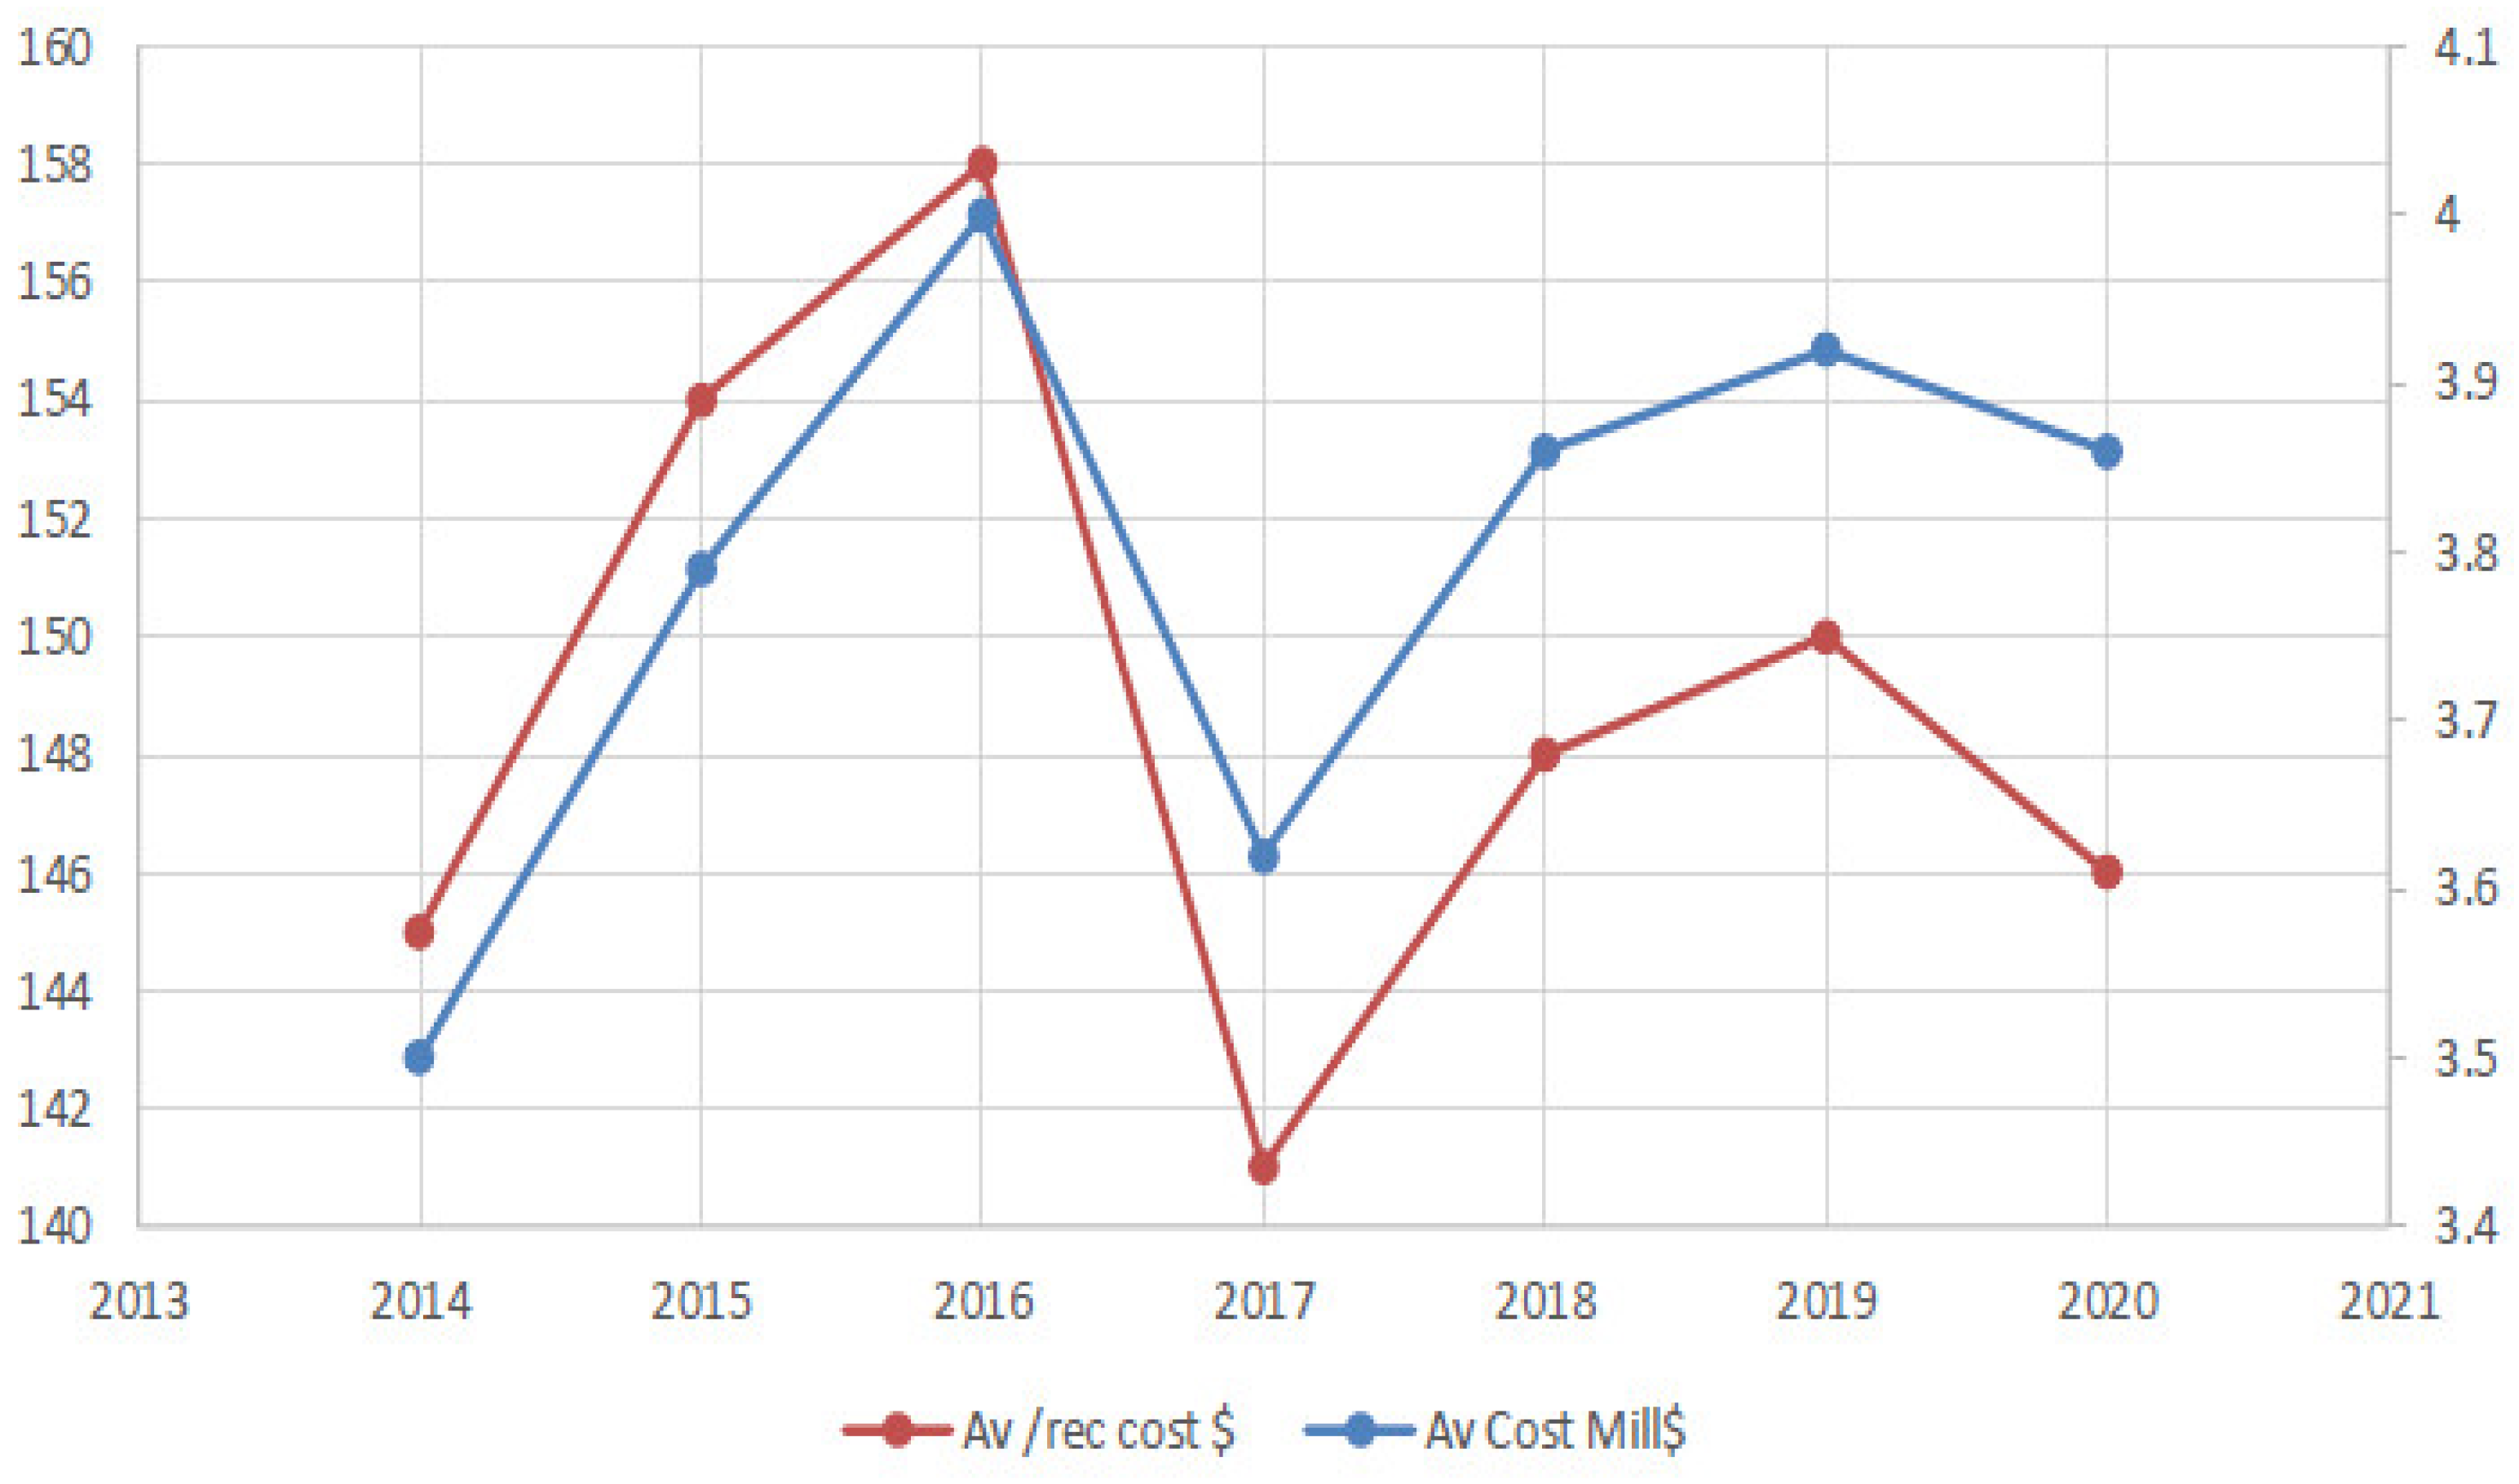
Some of the latest details of the data-related costs are given in [
6], as illustrated in
Figure 1 and
Figure 2. Many attestations contain information about confidential messages and the future occurrence of specific types of security breaches [
7]. In the case of inefficient data handling, a security breach can lead to damage to the potential data management systems, which includes the misstatement of accounts that are affected by the breach. Entertainment, public, and consumer industries had the highest percentage of data breaches caused by human error.
According to [
8], information security culture affects data breaches through human behavior in organizations where threats of human to information protection are increasing. To solve these problems, some security-related factors were investigated. As a result, the factors that could positively influence an information security culture were identified, consolidated, and expanded to five external factors and twenty internal factors.
To analyze quantitative aspects, valance (intensity) and contingency (interrelation) analysis are briefly considered with other comprehensive models [
9]. For information security based on the comprehensive model, not only relevant information without data breach has to be clarified, but also their other security issues have to be considered.
Definition of attacks and breaches based on cost models are analyzed in [
10,
11,
12,
13] for improving the overall cost of the security problems and detection challenges and impacts of breaches. These models allow business managers to analyze the quantifiable and comparable evaluations of cyber defense capabilities.
According to [
14], IoT privacy and security have been investigated through many attacks. These include eavesdropping, spoofing, RF jamming, Sybil attack, sinkhole attack, etc. DoS attacks nowadays have become sophisticated because these attacks affect security management. A DoS attack may offer a smokescreen to carry out a parallel attack to intrude into an information security defense system and breach the privacy of the users by gaining access to the data.
Information security and data breaches are critical problems for public and private organizations where security breaches affect business dealings, damage security management, and create financial losses [
15].
The work in [
16] has covered cost optimization schemes using security vulnerability measurement for enhancing efficient security, which reduces security management. The security assessment methods and budget allocation methods allow the security managers to improve the cost optimization with minimum risk.
The authors in [
17,
18] have developed a quantitative framework for assessing the risk management and the vulnerability of the ecosystem. They introduced the response-based quantitative assessment method. In some specific applications, semi-quantitative approaches can be used for assessing the risk of groundwater vulnerability.
Among all data breaches in the potential systems, security of the health-related data may be considered the most important and influencing factor on the business systems. The security of health-related confidential data cannot be overemphasized [
19,
20]. Privacy-preserving techniques for genomic data support the privacy and security problems related to genomic data sharing/computation [
21].
3. Applicability of Existing Models
Although previous researchers discussed many models for creating security solutions, an efficient model for preventing data breaches and cyber-attacks is still being investigated. As reported in [
3], there are two main computational models, each with its own set of data: NetDiligence, which created the Hub International calculator (2012) and contributed to the Verizon report, Ponemon, which created calculators with sponsorships from Symantec (2010), Megapath (2013), and IBM (2014). However, no critical studies of these two approaches have been conducted. In addition, we examine the claims made by Jay Jacobs of Verizon. He collaborated with NetDiligence [
22], and has been critical of the computations model used by Ponemon because the Ponemon approach yields a cost per record that he believes is too high.
The difference between the two models is readily illustrated using the average cost per record implicit in the two approaches. The cost per record of customer personally identifiable information (PII) increased to USD 175 in breaches caused by a malicious attack. As shown in
Figure 2, the per-record cost of customer PII was USD 175 in malicious attacks during 2020, nearly 17% more than the overall average per-record cost of customer PII (USD 162 per record) compromised in any type of breach.
PII is a value that represents the personal cost and the personal share of the breach, and it includes records containing a customer’s personal information. The cost per record of PII increases with malicious attacks and data breaches. In the previous work by various researchers that we studied, PII was not determined appropriately because the existing models did not have enough relevant data. Eighty percent of the breached organizations stated that the customer’s PII was compromised during the breach, far more than any other type of record. As in [
6], the average cost in 2020 has decreased, and it is further decreasing in 2021 because of improvements in cybersecurity solutions. Costs have also decreased because information systems in the organizations are securely maintained with all available resources. In an organization, security risks create loss and increase the cost per record. Security risks may come from external hackers, staff mistakes, malware or viruses, and ransomware. When a model that does not count all proactive risk details is used, it may end up causing a huge loss to the organization, and its data and calculations will be misleading.
By using the Ponemon formula (all costs of data breach divided by compromised records: USD 400 million/700 million records = USD 0.58), the average cost per record in the 2015 Verizon Data Beach Investigations Report (DBIR) is USD 0.58 [
23]. The magnitude difference of two to three orders of magnitude raises several questions.
Both organizations make extensive and varied use of datasets. Ponemon gathered information from over 1600 business companies across several countries. Data from 191 cyber insurance payouts were included in the NetDiligence data from the 2015 Verizon (DBIR) [
23].
We can compare the cost per record with the available numbers for the Target and the Home Depot breaches, which come out to be USD 6.30 and USD 1.13 per record, respectively. In December 2013, Target Brands Inc. experienced a significant data breach involving 40 million credit and debit card records [
24]. The overall cost of the data breach was reported to be about USD 252 million, based on Target’s financial statements [
25,
26]. These estimates numbers are nearer to the NetDiligence numbers. Since no lawsuit has yet been filed, the findings are close to Hub International’s estimate (
Table 1) if we deduct the estimated lawsuit cost (USD 12.57 − 7.09 = USD 5.48). This breach’s cost per record is not even comparable to Ponemon’s cost per record.
The other notable example is that of the Home Depot data breach in 2014, which involved 56 million customer payment cards [
24]. The available information about the cost of this breach is given in [
27,
28]. We found that the cost per card was USD 63 million divided by 56 million, which equals USD 1.13. This cost is much smaller than what the Ponemon calculators would expect, and it is actually closer to the Hub International estimate.
There are two apparent sources of the discrepancy:
What is included in the data breach cost: Intangible costs, such as reputation loss and its effect on the business loss, are included in Ponemon costs. These costs are not included in NetDiligence. Furthermore, NetDiligence uses insurance claims as a cost measurement. The insurance claims, it has been argued, only reflect the costs covered by the insurance purchased [
29]. Nonetheless, the insurance coverage should be of the same order of magnitude as the actual cost. The cost of a lost reputation can be difficult to measure. Recent attempts to calculate it using stock price as a metric seem to indicate that the effect may be minor in several cases, and that the effect may be masked by more important factors in stock price movement.
The data breach sizes: The fact that total cost is unlikely to be proportional to the number of records involved is most likely the major contributor to the cost per record discrepancies. The average number of records used in the Ponemon report in 2015 was 28,070, with no more than 100,000 records in total, while the NetDiligence data includes breaches involving far more records, with the average breach involving 3,166,600 records [
30]. There are two reasons for this: some costs of data breaches are largely constant and independent of the affected records number. As a result, for a greater number of records, the cost per record will be lower. Even if the cost rises in tandem with the number of records, economies of scale come into play. An organization that encounters a significant number of data breaches should be able to manage them more cost-effectively and receive better prices from recovery service providers. According to a 2015 Verizon report, the average cost per record for 100 lost records was USD 254 because the expected breach cost is USD 25,445, but the cost was just USD 0.09 per record for 100 million lost records because of the expected breach cost is USD 9 million [
23]. As a result, cost per record alone is considered to be a misleading metric.
Our analysis of the Hub International calculator, which uses NetDiligence’s data breach cost data, suggests that it assumes a linear trend. On the other hand, the calculators that rely on Ponemon data, where the number of breaches does not exceed 100,000 records, the trend is not linear [
22].
We thus propose a model that is non-linear relative to the number of records since a linear model implies that there is a cost per record that is meaningful.
4. Economy of Scale
Since the cost per record is misleading when it comes to estimating the data breach cost, the economy of scale concept will assist in making the cost per record consistent with other factors instead of the constant cost per record that is obtained by dividing the total breach cost by the total breach size. Therefore, using the economy of scale is important in order to remove the correlation between the high breach cost and breach size and ensure that the relationship relies not only on the cost per record factor only but also on other factors. For example, cyber-attacks and data breaches decrease profits and affect the global economy. The data breach is one of the fastest-growing crimes and has increased in scale, cost, and sophistication, posing a major threat to both businesses and individuals. Some of the cyberattacks that cost a fortune and affected the global economy include Epsilon, WannaCry and Petya.
The current issue is that the total breach cost increases when the size of the data breach increases. To investigate this issue, the concept of economy of scale should be considered for analysis, along with actual data. This concept is defined as a decrease in the average long-term costs resulting from an increase in the size of the operating unit [
31]. As is depicted by the data [
2,
32], many organizations have disclosed that their business has been affected by data breaches and cybersecurity attacks. These organizations depend on data management which is influenced by the costs of the data breach. Therefore, we present two hypotheses:
The overall cost rises with breach size.
For larger breaches, the breach cost per record will decline. Thus, the overall breach cost will rise less than linearly.
Although the economy of scale depends on the increasing breach cost, the larger breach may be simplified with cost per record. The cost per affected record declines when the number of affected records (breach size) of the whole data breach is too large because we have to divide the total cost by the number of affected records. According to the concept of economy of scale, the cost of development per unit decreases as the number of records increases. Therefore, the relationship variables are the number of affected records and the cost per record.
A residual analysis suggests that the trend appears to change slightly for record sizes greater than about 25,000. This suggests that the model may be amenable to further refinement. Perhaps a piecewise regression may yield better accuracy, which may be addressed in future research. The reason is that the two data collection approaches are different. The Verizon/NetDiligence data are based on insurance payments, while the Ponemon data include more complete costs such as opportunity costs.
As the global economy relies more and more on information technology (IT) based on the Internet of Things (IoT), the economy of scale will depend on greater usage of secure connections. With the growing scalability of IoT and emerging technologies such as IoT-based IT, interconnectedness, cybersecurity threats pose an increasing challenge.
Figure 3 depicts the relationship between abuse, attack, cybercrime and data breach.
According to [
33], a data breach is involved with the abuse, attack, and cybercrime (CCr) as shown in
Figure 3. Abuse encompasses any negative and/or undesirable use of technology that affects the breaching and cost of the breach. An attack refers to a deliberate unlawful action that perpetrates the breach or physical action targeted against another party. The CCr results from any illegal use of technology and procedures which results in an unauthorized breach.
Figure 3 examines the problems posed by abuse, attack and CCr as well as how the public perceives the security issues and how this, in turn, affects their data breach, trust and business engagement with the security technology. Cyberattacks and CCr are both categorized as abuse. However, a cyberattack will be considered a cybercrime according to the jurisprudence of the applicable law at the premises of the attack. Misuse of legitimately assigned permissions could be categorized as abuse and cybercrime, but it may not constitute an attack.
Further exacerbating the problem, organizations may not invest in social activities rather than cybersecurity solutions. Cyberattacks and data breaches on private individuals and on other organizations are not considered seriously. These security issues in private and public organizations raise social costs as the technological resource stock externality is exacerbated. Since there are several factors that impact the overall breach cost, it is to be expected that there would be a significant variation that is not explained by breach size alone. For very small breaches, the fixed costs would dominate, and thus the trend would not be clearly visible.
The regression model for calculating costs is important because it helps determine which risk or breach factors matter the most, which can be ignored, and how these factors interact with each other. In this model, regression analysis lies in the fact that it provides a powerful statistical method that allows an R-squared value to examine the relationship between two or more variables of interest used in the calculator.
The actual computation of R-squared requires several steps. These steps include taking the data points of dependent and independent variables related to breach costs. Using a statistical computation, these data points allow finding the line of best fit and R-squared values that are determined from a regression model. From there, we would calculate predicted values, subtract actual values, and square the results. This process yields a list of errors squared, which is then summed to equal the unexplained variance. To calculate the total variance, we would subtract the average actual value from each of the actual values, square the results, and sum them. From there, we would divide the first sum of errors (explained variance) by the second sum (total variance) and subtract the result from 1. These calculations provide the R-squared value.
R-squared correlates the changes in a dependent variable with those in an independent variable. It does not by itself tell whether the chosen model is good or bad, nor does it tell whether the data and predictions are biased or not. Specifically, a high or low R-squared is not necessarily desirable, because it does not convey the reliability of the model. Similarly, its value does not explain whether the regression is right. A good model can yield a low R-squared value. Likewise, a poorly fit model can result in a high R-squared value.
What qualifies as a good R-squared value depends on the context. In some disciplines, such as the social sciences, even a relatively low R-squared such as 0.5 could be considered relatively strong. In other fields, the standards for a good R-squared reading can be much higher, such as 0.9 or above. In finance, an R-squared above 0.7 is generally seen as showing a high level of correlation, whereas a value measured below 0.4 is considered to show a low correlation. This is not a hard-and-fast rule, however, and it depends on the specific analysis.
Table 2 gives the values of the two parameters for the Ponemon 2013, Ponemon 2014, and NetDiligence data. According to the latest report of NetDiligence published in 2020, cyber claims studies and cybercrimes (ransomware, business interruption, social engineering) also depend on these parameters. As observed above, the parameter values for the two Ponemon datasets are close, suggesting that the two datasets, while distinct, were collected using the same approach. The NetDiligence data yields somewhat different values, which is likely due to the fact that the numbers were collected differently.
Based on the available datasets, a model of the total breach cost (y) after incorporating economy of scale can be formulated as below:
where a and b are applicable parameters, and size x refers to the breach sizes bigger than or equal to 1000 records. (Equation (1) is not applicable to the cases where a smaller number of records is affected.) The cost per record (CPR) after incorporating economy of scale is obtained by dividing (1) by the breach size, which yields,
The two hypotheses mentioned above are both supported by the three datasets. The parameter values in (2) should conform with how the numbers are to be interpreted.
Sample size justification is considered for existing and proposed models. Effect size has both theoretical and practical considerations. If the effect size is not known, it can be calculated from the mean and standard deviation values. The practical aspect of justifying the sample size is the monetary cost and the time needed to collect the data. Nonlinearity is caused by the economy of scale; thus, b should be <1. The size of the data breach is positively associated with a higher negative return on the short-term market value of the breached company. Although
Table 3,
Table 4,
Table 5,
Table 6,
Table 7 and
Table 8 allow us to analyze the justifications of the models given in (1) and (2), the average cost in 2020 is better as given in [
6].
5. Comprehensive Cost Computation Model
A comprehensive model for a data breach cost and hence the cost of annual security is shown in
Figure 4. It incorporates the concepts from the current computational models. Some data breach costs are direct financial expenses, and indirect costs such as the time, effort, and others according to Ponemon Institute terms. Therefore, there are five partial costs that comprise the total data breach cost: incident investigation, crisis management, regulatory and industry sanctions related to governmental procedures, a class-action lawsuit, and opportunity cost.
The total security cost is made up of two parts: the total direct cost of a data breach and the cost of security maintenance and upgrades, which would be required even if the breach had not occurred. These two costs participate in an organization’s expected annual security cost (3) in the event of a security data breach. Expected annual security cost (ESC) is the addition of annual expected cost due to breaches (EB) and cost regardless of any breaches (RB).
The overall risk evaluation model, as in
Figure 4 allows us to analyze the cost of the data breach through the available data. Many risks influence the costs of a data breach, including various types of security technologies and practices.
The expected annual cost of potential data breaches is determined by the probability of a particular type of data breach (4). Therefore, if there are n types of data, EB is the multiplication of the likelihood of data breach type (P
i) and the total cost per breach for type (A
i).
The expected costs due to the breach could cover the past data breach that occurred or the data breach that could occur in the future. For the past breach, the data breach probability is 1, and the actual cost of a data breach is computed normally. However, for future data breach, the data breach probability is less than 1.
5.1. Compiled Cost Data
As mentioned in [
3], we analyzed the available calculators that estimate data breach risks. We studied the Hub International Calculator to collect actual data such as a and b parameters by using the power regression equations that computed partial costs but did not calculate the probability. The IDT911’s calculator was popular in 2016 and is considered as examples for tables in this paper. The presented costs for each option can be calculated for future recordings. These costs are part of the total breach cost, but such small figures may not be the appropriate method for the estimation of the breach cost. With the IBM/Ponemon calculator, the details of the cost per record and the probability of breach which may occur within the next 12 months are provided. However, IBM/Ponemon does not publish how it estimates each cost per record for each option that is chosen for different factors. Our proposed model is based on the numbers of the Hub International calculator since it was obtained by our analysis, and the IBM/Ponemon calculator provides the multiplier factor values that represent the variation between options.
Two types of data breaches are used in the personal security system: they are personal health information (PHI) and social security numbers (SSN). Although credit cards (CC) provide personal security information, they secure financial transactions in many different ways for various business organizations. Many public organizations use the PHI and SSN for validating the personal information before they accept the CC.
We ignore three factors during the estimation of partial costs per record for several reasons. For instance, factor 3 is ignored since its data about costs and probability are redundant and are overlapped with factor 2, which is industry classification. In addition, we ignore factor 10 in the incident investigation cost classification during the estimation of that cost because the estimation of the breach cost is small and might be insignificant, but we use this factor when we compute the cost per record (CPR). Moreover, factor 12 is redundant, as it is similar to factor 1. Therefore, we ignore it because its impact of more headcount will equal the impact of more breach size. Below, different cost components are described briefly.
5.2. Computation of Factors
Our model of data breach cost per record and the probability uses the “multiplicative model” approach similar to the other quantitative models such as the defect density models by Chulani and Boehm [
34] and Malaiya and Denton [
35], software cost estimation model by Barry Boehm et al. [
36], and MIL-HDBK-217 Chip failure rate model [
37]. This multiplicative model illustrates the variation between the selected options of each factor for data breach cost and probability when the user chooses one.
5.3. Security Costs Due to Data Breach
Some partial costs contribute to the total data breach cost. These costs are impacted by two factors: affected records number, and the type of data breach. The partial costs per record equations are presented after incorporating the economy of scale. Then, we can obtain the partial breach cost by multiplying the cost per record with the breach size. The partial costs include the costs described in the following subsections.
5.3.1. Incident Investigation Cost
The incident investigation cost includes all costs associated with assisting the organization in detecting the data breach [
38]. Forensic, investigation, and consulting services, as well as assessment and audit services and technology staff costs, are examples. We use the factors’ values to note the variation between options in the data of IBM/Ponemon. The investigation cost per record (ICPR) shown in (5) depends on cost factors 4, 5, and 6 considered in
Table 5.
where the values of a and b can be selected from
Table 5. The cost factors used in (5) are costs due to data breach causes (F
BC), sensitive data encryption (F
E) and organization’s privacy (F
P) respectively.
According to [
6], security details of incident investigation costs in 2019 and 2020 show that many organizations have spent less money than the previous years. Although remote work during COVID-19 increased, the data breach costs and incident response times (IRT) decreased thereby reducing average data breach costs. By combining testing with IRT, organizations can reduce the cost of a data breach.
The causes that lead to a data breach have a different impact on the cost of a data breach. The expected cost in the case of a malicious attack is higher (factor 7), as seen in
Table 5.
Table 9 gives the values for this factor, where “Don’t know” is the default case. The encryption of sensitive data on laptops or removable storage (if applicable) costs the organization less if the organization has a data breach, but it costs more if the data are not encrypted. The values for this factor are shown in
Table 10.
The privacy and the protection of data have a huge effect on the data breach cost based on the fact whether they are applied or not. The factor values can be obtained from the cost factor of the organizations’ privacy reports.
5.3.2. Crisis Management Cost
The activities that enable the organization to warn the public that personal information has been lost or compromised are referred to as crisis management [
38] and manage the impact of the current data breach. For example, in the case of a credit card company, these activities include notifications, credit tracking/monitoring, and reissuing credit cards (if any). The organization that is affected by the data breach may not be responsible for the expense of reissuing the cards, but rather the bank that issued the card will bear the cost based on the current rules. The crisis management cost per record (CMCPR) allows us to estimate the crisis management cost with cost factor 11 and is given below.
where the values of a and b can be used from
Table 6. In (6), the cost factor 11 related to the values of the team of business continuity management (F
BCM) is discussed and shown in
Table 11.
This team usually knows how to detect the data security risk in the organization, and it has an emergency plan to deal with a potential breach. Therefore, the existence of this team in the organization will reduce the data breach cost.
5.3.3. Regulatory and Industry Sanctions Cost
This cost relies on the Payment Card Industry (PCI) compliance. Fines and penalties will be placed on the PCI organization if it is not compliant. The sanctions cost per record (SCPR) depends on factor 14, which is in
Table 7. The regulatory and industry sanctions cost is estimated as below:
where the values of a and b can be chosen from
Table 7. Regarding the cybersecurity risks, the PCI industries have used (7) and verified the cost analysis of SCPR in recent years up to 2020.
5.3.4. Class Action Lawsuit Cost
The organization will undertake several costs due to litigation, legal defense, damages, and others, if a federal class-action lawsuit is filed. When we calculate the class action lawsuit cost per record (CALCPR), factors 15 and 16 should be considered from
Table 8 The class-action lawsuit cost is estimated as follows:
where the values of a and b can be used from
Table 8, quantitative assessment of cybersecurity risks. This depends on many factors, including CALCPR. It is to be noted that SCPR cost in (7) and CALCPR cost in (8) are calculated in a similar manner. However, parameters a and b are chosen differently in both cases.
5.3.5. Opportunity Cost
It is also known as lost business costs, which are incurred as a result of lost business opportunities and reputation after disclosure of a data breach to victims and the public in the media [
38]. This can be difficult to estimate since determining the precise opportunity loss caused by the breach can be hard.
It has been debated that the data breach will affect the organization’s stock price. Although some previous research indicated that there is a substantial effect on stock price, a more recent study cast doubt on this. This may be because data breaches are thought to be widespread [
39]. The effect on the stock price is determined by the relationship between the overall cost of the data breach and the company’s annual revenue. If the data breach cost is minimal, the breach would have little effect on stock prices.
5.4. Computation of Data Breach Cost
To calculate the total data breach cost (CPR) for each compromised record, we combine all the partial costs for the type of data breach. Then, we can use the values of some factors that impact the total breach cost per record by using the data from the IBM/Ponemon calculator that is shown in
Table 4,
Table 5 and
Table 6. These values are used as a variation measure when the user chooses options for those factors. The expression of the cost per record is given by:
where the factors impacting the cost per record for type i are the country of an organization that had a data breach F
country (F
C), the organization’s industry classification F
industry (F
I), and the duration that the business keeps the sensitive information of employees, customers, and patients F
duration (F
D).
These factors will be multiplied by the total cost per record of the four partial costs that include incident investigation, crisis management, regulatory and industry sanctions, and class action lawsuit. Each factor has a default value that is equal to one. Each factor is discussed below.
Cost factor based on F
C depends on the organization’s country and countries for which data breach cost data were collected in the IBM/Ponemon 2015 Global analysis [
40]. We take the USA as the default choice. The cost in some countries is significantly lower. Then, we use a weighted cost/factor for the rest of the countries relative to the cost per record for the US, which is USD 217.
Cost factor F
I represents the organization’s industry classification. This factor takes into account different types of industry classifications. Some of the classifications have a bigger effect on the breach cost per record than others. The values of the factor of industry classifications are shown in (
Table 12), and the default value is one.
Cost factor F
D focuses on sensitive information keeping. This factor takes into consideration the fact that the businesses keep some information about their employees, customers, and patients for different lengths of time. The cost of the breach will depend on the length of time this information is retained. We determine how many months approximately are in each duration. The durations are as follows: 3, 12, 48, 72. Then, we make 48 months as the default one. After that, we plot the months with cost, make a trend line, and obtain the expression: y = 37 * months + 317. In addition, we normalize that expression by dividing all values by 2000, which is the cost of 48 months (the default). The expression becomes: y= 0.0185 * months + 0.158. The values of a factor are found by dividing the cost of each duration by 2000 that is the cost of 48 months. The values are presented in (
Table 13).
The cost of the data breach not only depends on the duration but also the volume of the sensitive information that is vulnerable to a breach and which should be protected using encryption [
6]. After calculation of the cost per record, the total cost due to breach for type i (
) can be computed by multiplication of the cost per record by the number of affected records (x) as shown in (10):
The cost of protecting sensitive data in a cloud environment using policy and technology increases with the security level and the level of the sensitive information.
5.5. Security Costs Regardless of Data Breach
An organization takes steps to reduce the risk of data breaches based on the organization’s size and the potential security risks. The indirect data breach costs comprise recurring costs of the security measures and security upgrades. Upgrading means bridging internal security holes to protect the organization against data loss or harm. Such security upgrades minimize the data breach probability, and then the cyber insurance at one time.
In general, it is difficult to obtain the essential information on the costs due to security upgrades because these upgrades happen internally, and organizations do not disclose the details. As a result, developing a preliminary economics model to estimate the cost of a security upgrade for an organization is still an open issue. However, some security-related cost information can be obtained from some occasionally published articles. For example, LinkedIn spent between USD 2–3 million in 2012 to prevent password theft [
41].
These costs can be hard to calculate for departments in small organizations because each staff member spends time, which is hard to measure, engaging in serval tasks such as installing security patches, configuring systems and applications to improve security, and managing system behavior in response to a security breach.
In order to calculate the cost regardless of a data breach (CRDB), we should add the following costs: the security maintenance cost (SM), security upgrade cost (SU), and an insurance premium (IP). Equation (11) shows how to compute the elements that comprise general security costs for any organization.
The effectiveness of security processing and automation of SU on data breach costs enhance the SM. Deployment of security levels varies with many factors; some of these factors are IP, security tools, trust security models, etc.
5.6. Cyber Liability Insurance Coverage
Cyber liability insurance is also known as data breach insurance. It provides the required coverage after a data breach occurs resulting in a data loss. This coverage by insurance companies is partial. In the current days, the demand for cyber insurance has increased since the number of data breaches has also increased [
38]. There are several cyber insurance companies that cover the first-party costs and third-party costs of the data breach. Cyber insurance is becoming the main element during cyber risk management, especially through data breach risks. Thus, cyber insurance is an essential part of a data breach incident response plan that assists in minimizing the organization’s damage, liability, and performance. Therefore, cyber insurance can cover any business loss and reduce the impact due to a data breach.
The cost of cyber insurance and its coverage vary depending on how the cost is accounted for by the organization’s agenda. Sometimes, the insurance cost is considered a security cost, and other times it is simply considered a cost of doing business. Insurance coverage needs further analysis and investigation in the future.
6. Modeling Data Breach Probability
The organization’s data breach probability relies on some factors: internal [vulnerabilities (if any) that could contribute to a data breach and if they are still open, which would mean that there is inadequate protection], external (attacker motivation and capabilities), or Bayesian (previous breaches can indicate weaker security unless security is dramatically improved as a result of a breach). It is worth noting that some factors that are considered by the Ponemon Institute to influence cost can also be considered to influence likelihood, such as BCM team and data encryption.
There are two main factors to predict the data breach probability: number of affected records, lost or stolen, and industry classification of organizations that is considered a factor under the classification of data types of breach. We extracted the probability data from the 2015 Ponemon report [
40]. We find that the probability is computed from the size of the data breach and from the country as shown in (
Figure 5 and
Figure 6). The expression for the probability of data breach based on the breach size as given in (12) is based on the data points in
Figure 5 using a trend line for the data. In (12), the probability
represents the annual data probability calculated over a period of 12 months or a year.
where, α = 0.4405, β = 4 × 10
−5, and x is the breach size. After studying the probability of data breach, we found that most researchers estimate the probability based on limited methods, such as surveys and collecting experts’ opinions like the Ponemon estimation. Some researchers do not discuss how the probability is computed.
Ponemon calculators (Symantec and IBM) use a survey with questions that we identify in this paper as factors to examine the cost and probability incurred by organizations after experiencing data breach incidents. We calculate the probability of data breaches for different periods. The probability of a breach of data type i (
) calculates the data breach probability (13) for the organization in the next 12 months:
where α = 0.4405, β = 4 × 10
−5, x is the breach size, and the F factors are the six factors that impact the data breach probability. In (13), many probability factors are considered and discussed for calculating the
in different data types. These factors are the country of the organization that had a data breach F
C, the organization’s business continuity management team involved in the data breach incident response process F
BCM, the organization’s industry classification F
I, and the most likely cause of a data breach F
BC, the sensitive data encrypted on al laptops or removable storage F
E, and the organization’s privacy and availability of data protection program F
P. The factors are multiplied with the probability obtained using (12). Each factor has a default value that is equal to one as well. Each of these factors is discussed below.
Probability Factor of Organization’s Country (F
C): Like the data breach cost, the probability of a data breach is impacted by the country where the data are located. The country-based probability factor data are taken from the 2015 Ponemon report [
40]. We take the USA as the default choice. Then, we use a weighted factor for the rest of the countries based on the probability for the US, increasing each year by a small percentage (0.2–0.3%), as presented in [
6]. France and Brazil have a relatively higher probability of a data breach.
Probability Factor of Business Continuity Management Team (F
BCM): This factor is essential to identify the potential threats faced by the organization and the impact that comes from these threats. Therefore, this factor has a different impact based on whether or not the team is involved in the data breach incident response plan or not. (
Table 14) shows the values of the factor for different scenarios.
Probability Factor of Organization’s Industry Classification (F
I): The different industry classifications also contribute to different probabilities of a data breach, as well as the cost of the data breach. The factor values and data from any organizations’ business report allow researchers to calculate the
as given in [
42].
Probability Factor of Data Breach Causes (F
BC): The probability of data breach varies based on the reason due to which the data are breached.
Table 15 shows the possible values of this factor.
Probability Factor of Sensitive Data Encryption (F
E): If the sensitive data on the laptops or removable storage are encrypted (if applicable), that lowers the probability of data breach compared to data that are not encrypted. The possible values of this factor are presented in
Table 16.
Probability Factor of Organization’s Privacy (FP): The private and public enterprises expect to provide higher privacy, security, and reliability for mission-critical services through network slicing, which supports to lower the data breaches with appropriate and factor’s values. The forms of applied privacy in an organization will impact data breach probabilities. Therefore, if the organization has strict privacy, the probability of data breaches will be lower.
Our proposed model reveals that there is an average probability that the annual cost of a data breach enhances with a few percentages (<1). However, overall security in 2020 is improved within the organizations.
7. Challenges and Limitations
Companies that have experienced data breaches frequently do not publish details on the real costs of damage, though some figures do appear in reports. The Ponemon Institute and NetDiligence collect proprietary information and publish an annual summary report. Thus, our analysis has focused on the published reports and the news reports. Cost estimates for data breaches differ from one source to another. We attempted to clarify and address the obvious discrepancies. We develop our model of computational components to ensure that it makes realistic assumptions backed by data from multiple sources.
The calculators of data breach cost are considered an important step towards estimating breach costs in a systematic way. However, these are primarily designed for online estimation for particular cases and are intended to be used for the promotion of security-related services. In certain cases, we must obtain computational results by filling in the calculator inputs at various steps, and the calculator will then send us the results. The computation methodology, however, is not disclosed. The cost per breach is usually given though for particular chosen values for a factor in most calculators. The values returned are often not broken down into cost components; for example, the Hub International calculator only produces the cost per breach. Moreover, some of the calculators, such as CyberTab, do not use any underlying data to measure the cost of security breaches, and the users have to mention the data breach cost themselves to estimate the cost. Thus, some of the calculators provide little information that would allow the construction of an accurate model for the cost of data breaches.
According to [
43,
44], the costs of cybersecurity issues around the world are increasing continuously with many factors. Cybersecurity risk management decisions require the knowledge of evolving threats within the organizations through the use of technology and security measurements applied during the data management. For the calculation of the cost of security management, the factors such as the definition of the cyberattack, behavior of the organization, and requirements of technology impact the outcome for an organization. Regarding technical perspective, cyberattacks (e.g., financial, espionage) need to be prevented through intelligent security management.
8. Conclusions and Future Works
There exist significant variations in how the costs of specific breaches should be computed and how the associated risks can be estimated. In this study, we developed a systematic model for this purpose based on available data and existing approaches. The model uses the factors that are found to be significant. We consider the economy of scale, as observed in actual data, to develop the model relating the cost to the number of records. We also consider the factors that may impact the probability of a breach.
We identify several issues that need to be addressed by further research. We need to develop a model that can estimate the costs regardless of the data breaches, such as upgrading and maintenance costs. In addition, we need to develop more detailed approaches for estimating and validating data breach probabilities. We did not consider the insurance payouts to cover security breach losses or the insurance premium costs. They need to be addressed separately in detail. The proposed model can be implemented using a suitable interface with the capability to update the parameters as further data becomes available.


