Article

PC12 and THP-1 Cell Lines as Neuronal and Microglia Model in Neurobiological Research

1
Department of Pharmacology, Wroclaw Medical University, Mikulicza-Radeckiego 2, 50-345 Wrocław, Poland
2
Department of Basic Medical Sciences, Wroclaw Medical University, Borowska 213, 50-556 Wrocław, Poland
*
Author to whom correspondence should be addressed.
Appl. Sci. 2021, 11(9), 3729; https://doi.org/10.3390/app11093729
Submission received: 28 February 2021 / Revised: 18 April 2021 / Accepted: 20 April 2021 / Published: 21 April 2021
(This article belongs to the Special Issue Sports Science, Medicine and Rehabilitation)

Abstract

:
Models based on cell cultures have become a useful tool in modern scientific research. Since primary cell lines are difficult to obtain and handle, neoplasm-derived lines like PC12 and THP-1 offer a cheap and flexible solution for neurobiological studies but require prior differentiation to serve as a neuronal or microglia model. PC12 cells constitute a suitable research model only after differentiation by incubation with nerve growth factor (NGF) and THP-1 cells after administering a differentiation factor such as phorbol 12-myristate-13-acetate (PMA). Still, quite often, studies are performed on these cancer cells without differentiation. The study aimed to assess the impact of PC12 or THP-1 cell differentiation on sensitivity to harmful factors such as Aβ25-35 (0.001–5 µM) (considered as one of the major detrimental factors in the pathophysiology of Alzheimer’s disease) or lipopolysaccharide (1–100 µM) (LPS; a pro-inflammatory factor of bacterial origin). Results showed that in most of the tests performed, the response of PC12 and THP-1 cells induced to differentiation varied significantly from the effect in undifferentiated cells. In general, differentiated cells showed greater sensitivity to harmful factors in terms of metabolic activity and DNA damage, while in the case of the free radicals, the results were heterogeneous. Obtained data emphasize the importance of proper differentiation of cell lines of neoplastic origin in neurobiological research and standardization of cell culture handling protocols to ensure reliable results.

1. Introduction

In vitro studies and, in particular, cell models have become an inseparable part of modern scientific research on new drugs and treatments. Cell cultures are a reliable tool that, if handled correctly, constitutes an irreplaceable supplement to biochemical testing and experiments on rodents. The In vitro studies on cell cultures also provide great insight into prevention, progression and potential causes of various diseases, including, e.g., neurodegenerative disorders, tumors or other disorders resulting from a genetic predisposition. As a result, these studies make it possible to discover new, more effective therapies [1,2].
Main applications of cell cultures in scientific studies include:
  • Screening for toxicity in pharmacological studies of newly synthesized drugs and discovered natural substances prior to in vivo testing;
  • Studying the effect of drugs on tissues, cells and their organelles;
  • Studying pathways and pathophysiological mechanisms involved in disease onset and progression;
  • Production of specific proteins or cellular substances, which are not yet obtained in recombinant form;
  • Microbiology and virology (mainly multiplication of intracellular pathogens).
Increasing pressure is put on creating well-defined, standardized cell models. Primary cultures based on mature cells are usually hard or even impossible to obtain. Therefore studies are usually conducted on cancer-derived cell lines induced to differentiation or otherwise stimulated to acquire the desired phenotype. Cultures gradually become more sophisticated and structurally complex—for example, cultures in the form of spheroids or cultures on microcarriers such as dextran, gelatin or glass beads. Co-cultures of different cells can serve to derive an even closer model of real human tissues, organs or systems, with the physiological and pathophysiological cross-talk between different cell types and the exchange of bioactive compounds and stimuli. A wide range of available cell lines and the possibility of their differentiation and targeted modification with environmental factors or various cytokines and stimulants allow for the appropriate adjustment of the cell model to reliably test the assumed hypothesis [1].
On the other hand, the lack of standardization in selecting and treating cell cultures is one of the main factors responsible for the poor reproducibility of various studies [3]. Therefore, proper preparation of cell lines, including necessary differentiation, should always be considered in planning a new study (Table 1).
Alzheimer’s disease (AD) is a neurodegenerative disorder and, in its sporadic/late-onset (LOAD) form, is the main cause of dementia in patients over 65 years old. Pathophysiological hallmarks of AD include extracellular amyloid β (Aβ) deposits in the form of senile plaques and intracellular neurofibrillary tangles (NFTs) comprised of hyperphosphorylated tau protein. These histological changes are often accompanied by chronic neuroinflammation with persistent activation of microglia and astrocytes [4,5,6]. Even though the disease has been known for more than a century, the exact molecular pathomechanism of this neurodegenerative disorder and the factors triggering AD onset are yet to be elucidated. Neuroinflammation is a complex and multidimensional phenomenon involving various cells that affect many extra- and intracellular signaling pathways and cytokine production [7]. The macrophages of the brain (microglia) are the main agent of innate immunity in the central nervous system (CNS) and perform various functions, ranging from protective to even harmful, in response to received signals [8,9]. Their activation for a short period as a response to an acute pathological state is beneficial, but chronic microglial activation inevitably leads to neuroinflammation, neuronal death and cognitive decline observed in AD [4,5,10,11,12,13].
Neurobiological studies on cell cultures mostly rely on PC12, SH-SY5Y, P19 and Neuro-2a continuous cell lines as neuronal models. Microglia-type cells like THP-1 or BV-2 often accompany neuronal cultures in studies focused on neurodegeneration since neuroinflammation plays a crucial role in disease progression and quite possibly in its development. Activated microglia participate in developing neuroinflammation, responding to toxic exogenous substances (like lipopolysaccharide; LPS) or endogenous substances (like amyloid β). Each cell line exhibits a unique set of properties in its morphology and expresses specific antigens and bioactive substances (e.g., neurotransmitters and cytokines) involved in different pathways and response mechanisms. Therefore, studying mechanisms of neurodegeneration and CNS inflammation, as well as the search for possible therapies and targeted drugs, requires standardized and well-defined cellular In vitro models [1,3,14].
Although tissue-derived primary cultures are most preferred, it is difficult to obtain sufficient amounts of these cells. Indispensable substitutes are well-defined cell lines of neoplastic origin. However, these cells often acquire the desired morphology and functionality only after differentiation. Authors in their studies show different approaches using either induced to differentiation or undifferentiated cells as neurobiological models, often without considering this discrepancy in cell lines preparation protocol.
Our study investigated the impact of PC12 or THP-1 cell differentiation on sensitivity to Aβ (considered as one of the major detrimental factors in the pathophysiology of AD) or lipopolysaccharide (a pro-inflammatory factor of bacterial origin). PC12 and THP-1 cell lines were selected based on their prevalence in recent neurobiological studies according to PubMed archive (on 20 November 2020).

2. Materials and Methods

2.1. Cell Lines

PC12 (CRL-1721) and THP-1 (TIB-202) cell lines were obtained from ATCC (Manassas, VA, USA). PC12 cells, derived from rat pheochromocytoma, after stimulation with nerve growth factor (NGF), differentiate into cells both morphologically and functionally similar to adult sympathetic neurons. Thus, the PC12 cell line growing in suspension is widely used as a suitable model for neurobiological studies. THP-1 is a monocytic leukemia cell line obtained from human peripheral blood that can be differentiated into macrophages using phorbol 12-myristate-13-acetate (PMA).
Both cell lines were cultured in similar conditions at 37 °C, 5% CO2, and passaged every 3 to 4 days. PC12 cells were grown on type I collagen-coated plates to allow cell adherence to the surface of wells (collagen coating procedure described below). PC12 cells, after removal of the growth medium, were treated with TrypLE Express solution (Gibco, Thermo Fisher Scientific, Waltham, MA, USA; cat. no. 12604-021) for 5 min at 37 °C. Then, the cell suspension was transferred to a centrifuge tube, and a complete medium was added (1:1 volume ratio) to inactivate trypsin. Next, cells were centrifuged at 1000× g for 5 min, the supernatant was removed, and cells were resuspended in a fresh medium. THP-1 cells as non-adherent were transferred to a collection tube and centrifuged under the same conditions as PC12 cells. After removing the supernatant from PC12 cell cultures, a fresh medium was added, and the cell suspension was pressed twice through a 0.7 mm needle to break cell clumps.

2.2. Coating Culture Plates with Type I Collagen

PC12 cells growing in suspension do not adhere to uncoated plastic culture vessels. Meanwhile, the adherence of cells to the surface is necessary for the proper differentiation and development of neurites. To allow PC12 cells to adhere, the surface of the wells was coated with type I collagen (Sigma-Aldrich; cat. no. C9791). The collagen was dissolved in 0.1 M acetic acid to a concentration of 0.1% (w/v) and stored at −20 °C for up to 6 months. In order to cover the culture plate, the stock solution was then diluted 10 times with distilled water and added to wells in the amount needed to cover each well’s surface. Plates were then left at 4 °C overnight. Afterward, the solution was removed and wells were washed with phosphate-buffered saline (PBS) three times for 5 min. Collagen-coated plates were stored at 4 °C for up to a month.

2.3. Culture Media

In this study, different types of media were used for cell growth and differentiation. The PC12 cell line was cultured in a complete medium composed of RPMI-1640 (Lonza, Basel, Switzerland; cat. no. BE12-702F) supplemented with 10% donor horse serum (DHS; Biological Industries, Beit-Haemek, Israel; cat. no. 04-004-1A), 5% fetal bovine serum (FBS; Biological Industries; cat. no. 04-001-1A), 2 mM L-glutamine (Lonza; cat. no. 17-605E), 25 μg/mL gentamicin (Lonza; cat. no. 17-518L) and 2.5 μg/mL amphotericin B (Gibco; cat. no. 15290026). Differentiation medium for PC12 cells was created by adding 100 ng/mL nerve growth factor (NGF) (Sigma-Aldrich, Saint Louis, MO, US; cat. no. N2513) to the complete medium with serum reduced to 1% DHS.
Growth medium for THP-1 cells consisted of RPMI-1640 (Lonza, Basel, Switzerland; cat. no. BE12-702F) supplemented with 10% fetal bovine serum (FBS; Biological Industries, cat. no. 04-001-1A), 2 mM L-glutamine (Lonza, cat. no. 17-605E), 25 μg/mL gentamicin (Lonza, cat. no. 17-518L) and 2.5 μg/mL amphotericin B (Gibco, cat. no. 15290026). For differentiation, 5 ng/mL PMA was added to the growth complete medium.

2.4. Used Harmful Compounds

LPS (Sigma-Aldrich, Saint Louis, USA; cat. no. L2630) from Escherichia coli was dissolved in distilled water to the concentration of 1 mM. A stock solution of LPS was stored at −20 °C for up to 6 months. Final LPS concentrations of 1, 5, 50 and 100 µM were used in this study.
Amyloid β (25-35) (Aβ25-35; Sigma-Aldrich, Saint Louis, MO, USA; cat. no. A4559) was dissolved in distilled water to the concentration of 1 mM. Aβ25-35 stock solution was stored at −20 °C for up to 6 months and placed at room temperature 45 min before use to ensure the same initial aggregation level and repeatability. The final concentrations used in the study were 0.001, 0.1, 1, and 5 µM.

2.5. Experimental Design

The study evaluated mitochondrial metabolic activity (MTT assay), cytotoxicity of the used harmful compounds (lactate dehydrogenase assay; LDH), the level of reactive oxygen species (DCF-DA assay), and the DNA damage—the amount of DNA strand breaks measured by fast halo assay (FHA). The length and density of PC12 cell neurites were also examined.
For the experiments, cells were always seeded at a density of 15,000 cells/well in 96-well (MTT, LDH and DCF-DA assays) or 24-well culture plates (FHA). For tests on undifferentiated cells, 24 h after seeding, LPS and Aβ25-35 were added. After 24 h of incubation with these harmful compounds, all biological assays were carried out.
In the case of cells induced to differentiation, NGF was added into PC12 cultures for 3 days and PMA into THP-1 cultures for 5 days. From this point, differentiated and undifferentiated cells were treated identically, i.e., LPS or Aβ25-35 was administered for 24 h, and tests were performed.
In each experiment, the control cultures were incubated in a medium without harmful compounds (LPS or Aβ25-35).

2.6. Immunofluorescence Staining For Doublecortin

To confirm the successful differentiation of PC12 cells, immunofluorescence staining was performed using the antibody against doublecortin (DCX) conjugated with phycoerythrin (PE) fluorochrome (Novus Biologicals, Littleton, CO, USA; cat. no. NBP1-92684PE). The staining was carried out according to the standard procedure described in previous studies [15].
Anti-DCX antibody was used in a concentration of 1:500 in PBST supplemented with 1% bovine serum albumin (BSA). PBST is a solution of 0.1% polysorbate 20 (Tween 20) in PBS. All incubations were performed at room temperature.
After 3 days incubation in differentiation medium, cells were fixed with pure methanol for 5 min and then washed with PBST three times for 5 min each. Cells were then treated with 0.1% solution of non-ionic surfactant (Triton X-100) in PBS for 10 min to ensure cell membrane permeabilization. Non-specific antibody binding was blocked with a solution containing 1% BSA and 10% NGS (normal goat serum) in PBST for 30 min and then cells were incubated with anti-DCX antibody for 1 h. After washing and preserving in a mounting medium, the cultures were analyzed using an EVOS FL microscope (Thermo Fisher Scientific, Waltham, MA, US) equipped with a Sony ICX445 monochrome CCD camera (1280 × 960 resolution) and fluorescence filter.

2.7. MTT Assay

The MTT assay assessed the mitochondrial metabolic activity (and thus indirectly the viability) of cells. MTT (3-(4,5-dimethylthiazol-2-yl)-2,5-diphenyltetrazolium bromide) is only converted to purple formazan due to active mitochondrial metabolism. MTT assay was performed according to the 10993-5 ISO standard. The assay solution was prepared by dissolving MTT in MEM (Minimum Essential Medium) to a 1 mg/mL concentration. After the supernatant was removed, the MTT solution was added to each well. The incubation period was 2 h at 37 °C. Finally, the supernatant was removed, and the formed formazan crystals were dissolved in 100 µL of isopropanol (30 min incubation) for spectrophotometric evaluation. Absorbance was measured with a Victor2 microplate reader (PerkinElmer, Waltham, MA, USA) at 570 nm.

2.8. LDH Assay

Cytotoxicity of Aβ25-35 and LPS was evaluated by the measurement of extracellular LDH activity. Intracellular lactate dehydrogenase is released upon cell membrane disruption, and its enzymatic activity is proportional to the cell damage. After incubation with Aβ25-35 or LPS, the supernatant was collected and placed on another culture plate. A mixture of 686 µM iodonitrotetrazolium chloride (INT), 291 µM phenazine methyl sulfate (PMS), 1.35 mM B-nicotinamide adenine dinucleotide (NAD+), 200 mM Tris (pH 8.2), and 55.5 mM lithium L-lactate was added to the supernatant. Plates were incubated for 20 min at RT and protected from light. At the end of incubation, absorbance was measured using a Victor2 microplate reader at 490 nm and 680 nm.

2.9. DCF-DA Assay

DCF-DA assay was used to determine the level of reactive oxygen species (ROS) after incubating cells with harmful compounds for 24 h. The DCF-DA (2′,7′-dichlorofluorescin diacetate) solution was made by mixing the DCF-DA ethanol solution with PBS in a ratio of 1:1000. In this assay, three controls without harmful compounds were used: positive control with DCF-DA solution and 0.03% H2O2, negative control with DCF-DA, and additional control without DCF-DA to evaluate endogenous ROS production. After incubating cells with LPS or Aβ25-35, the medium was removed from wells, 100 μL of DCF-DA solution in PBS was added, and plates were further incubated for 1 h at 37 °C. ROS level was measured using Victor2 microplate reader with excitation at 485 nm and emission at 535 nm.

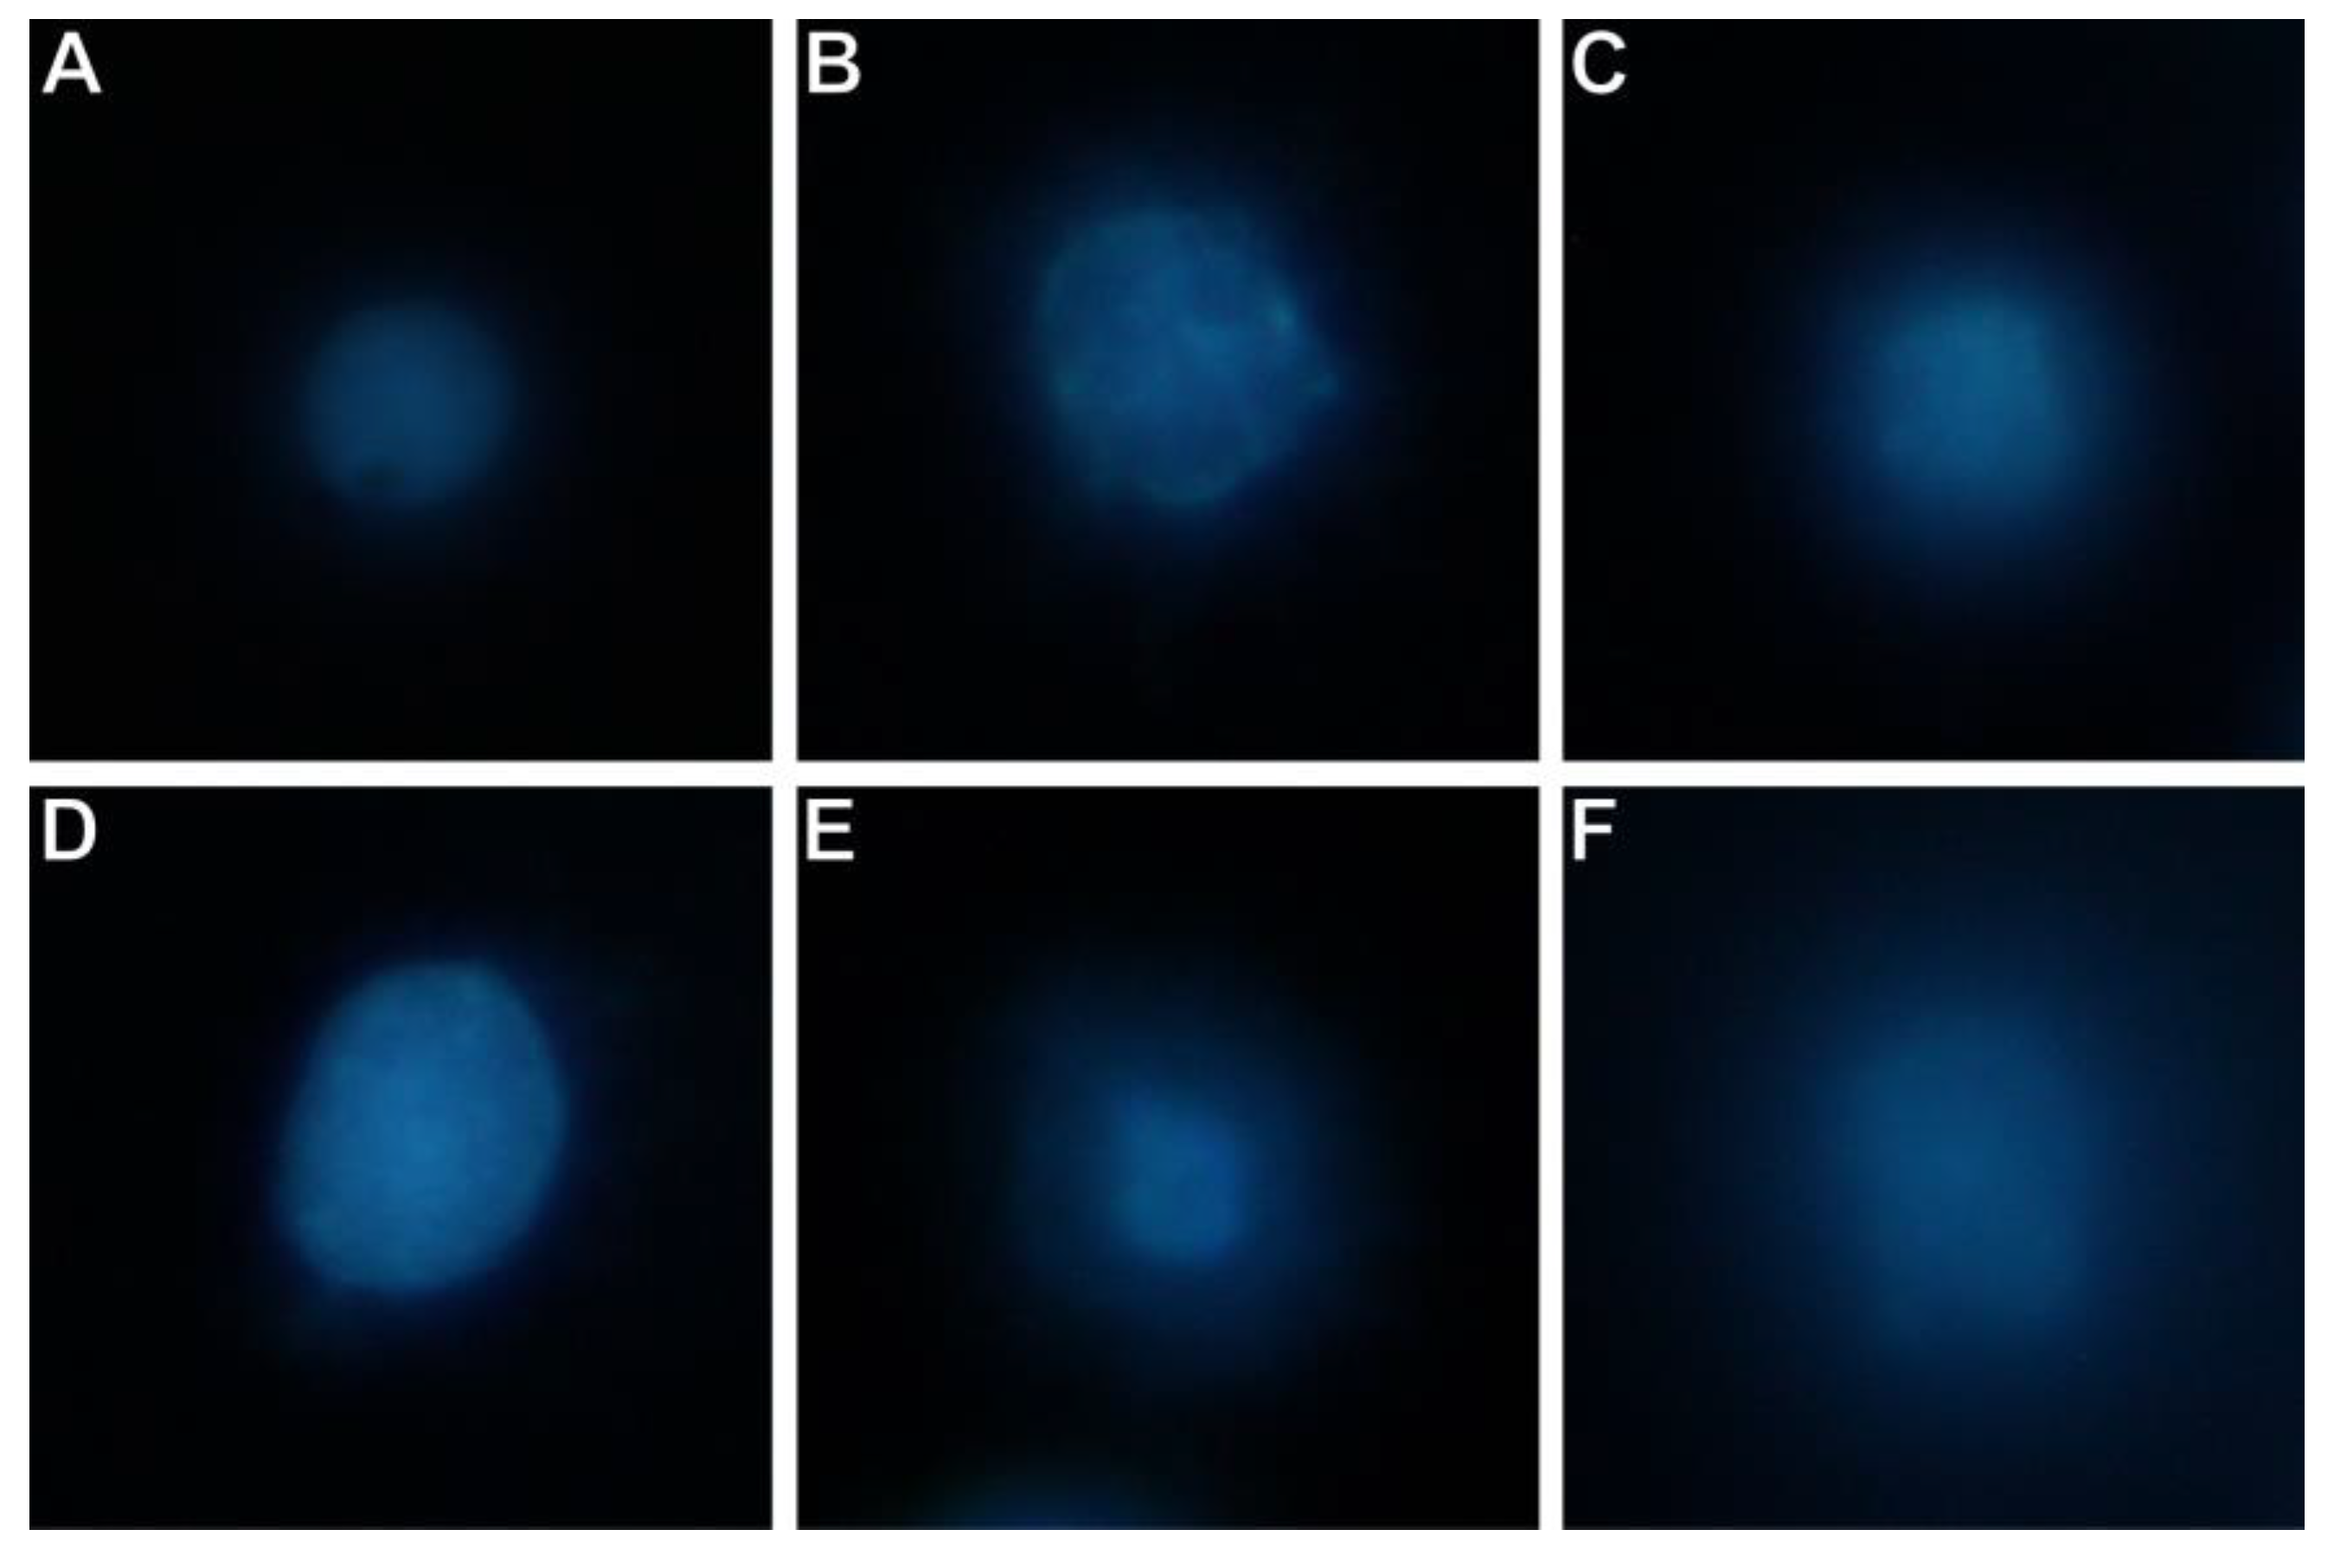
2.10. Fast Halo Assay (FHA)

FHA assay was used to measure DNA damage in the form of double-strand breaks (DSBs). After 24 h incubation with LPS or Aβ25-35 on 24-well plates, the supernatant was collected to centrifuge tubes. Cells were detached by incubation with TrypLE for 5 min at 37 °C and transferred to the tubes. Wells were washed additionally with HBSS (Hank’s Balanced Salt Solution) to collect as many cells as possible. Tubes were centrifuged for 5 min at 1000× g, the supernatant was removed, and HBSS was added to wash the cells. The centrifugation and washing processes were carried out twice for each tube. In a warm water bath at 37 °C, 130 μL of 1.25% low melting point agarose was added to the remaining pellet. The created cell suspension was placed on slides pre-coated with high melting point agarose and covered with a coverslip. Slides were then put on a cool block for 10 min to enable gel formation. After removing coverslips, slides were placed in lysis buffer * overnight at 4 °C, transferred to alkaline buffer ** (pH 13) for 30 min, and washed twice in neutralizing buffer *** for 5 min. Slides were stained using 5 µM DAPI (4′,6-diamidino-2-phenylindole) for 20 min (protected from light).
Cells were photographed using Nikon Eclipse E-600 (Nikon, Tokyo, Japan) fluorescence microscope with UV 1A filter and Canon EOS 650D (Canon, Tokyo, Japan) camera (5184 × 3456 resolution). The level of DSBs was then evaluated based on the ratio between diameters of the cell nucleus and halo using in-house developed software designed to facilitate the analysis of the FHA assay results.
* An amount of 100 mL of lysis buffer consisted of 89 mL distilled water, 29.28 g NaCl, 3.72 g Na2EDTA and 0.12 g Tris-base heated for better solubility, and brought to pH 10 with NaOH; buffer was stored at 4 °C; 1 mL of Triton X-100 and 10 mL of DMSO (dimethyl sulfoxide) were added before use.
** An amount of 150 mL of buffer consisted of 1.8 g of NaOH and 55 g of Na2EDTA in distilled water; before the use, the solution was filtered through Whatman filter paper no. 2.
*** 4.6% Tris-base solution in distilled water brought to pH 7.5 with HCl.

2.11. Length and Number of Neurites

Cultures were analyzed using an EVOS FL microscope equipped with a Sony ICX445 monochrome CCD camera (1280 × 960 resolution) and fluorescence filters. Additional image processing and analysis were performed using ImageJ software.
The length and number of neurites were measured in 5 replicates for 50 cells in each replicate. Only neurites that were twice as long as the cell body were included in the assessment.

2.12. Statistical Analysis

The normal distribution and the equality of variance of the results were proved using the Shapiro-Wilk’s and Levene’s tests. Thus, it was possible to use parametric tests for statistical calculations. ANOVA and Tukey’s post hoc analyses were carried out. The p-value lower than 0.05 was assumed as the level of significance. Results are presented as means and standard errors of the mean.

3. Results and Discussion

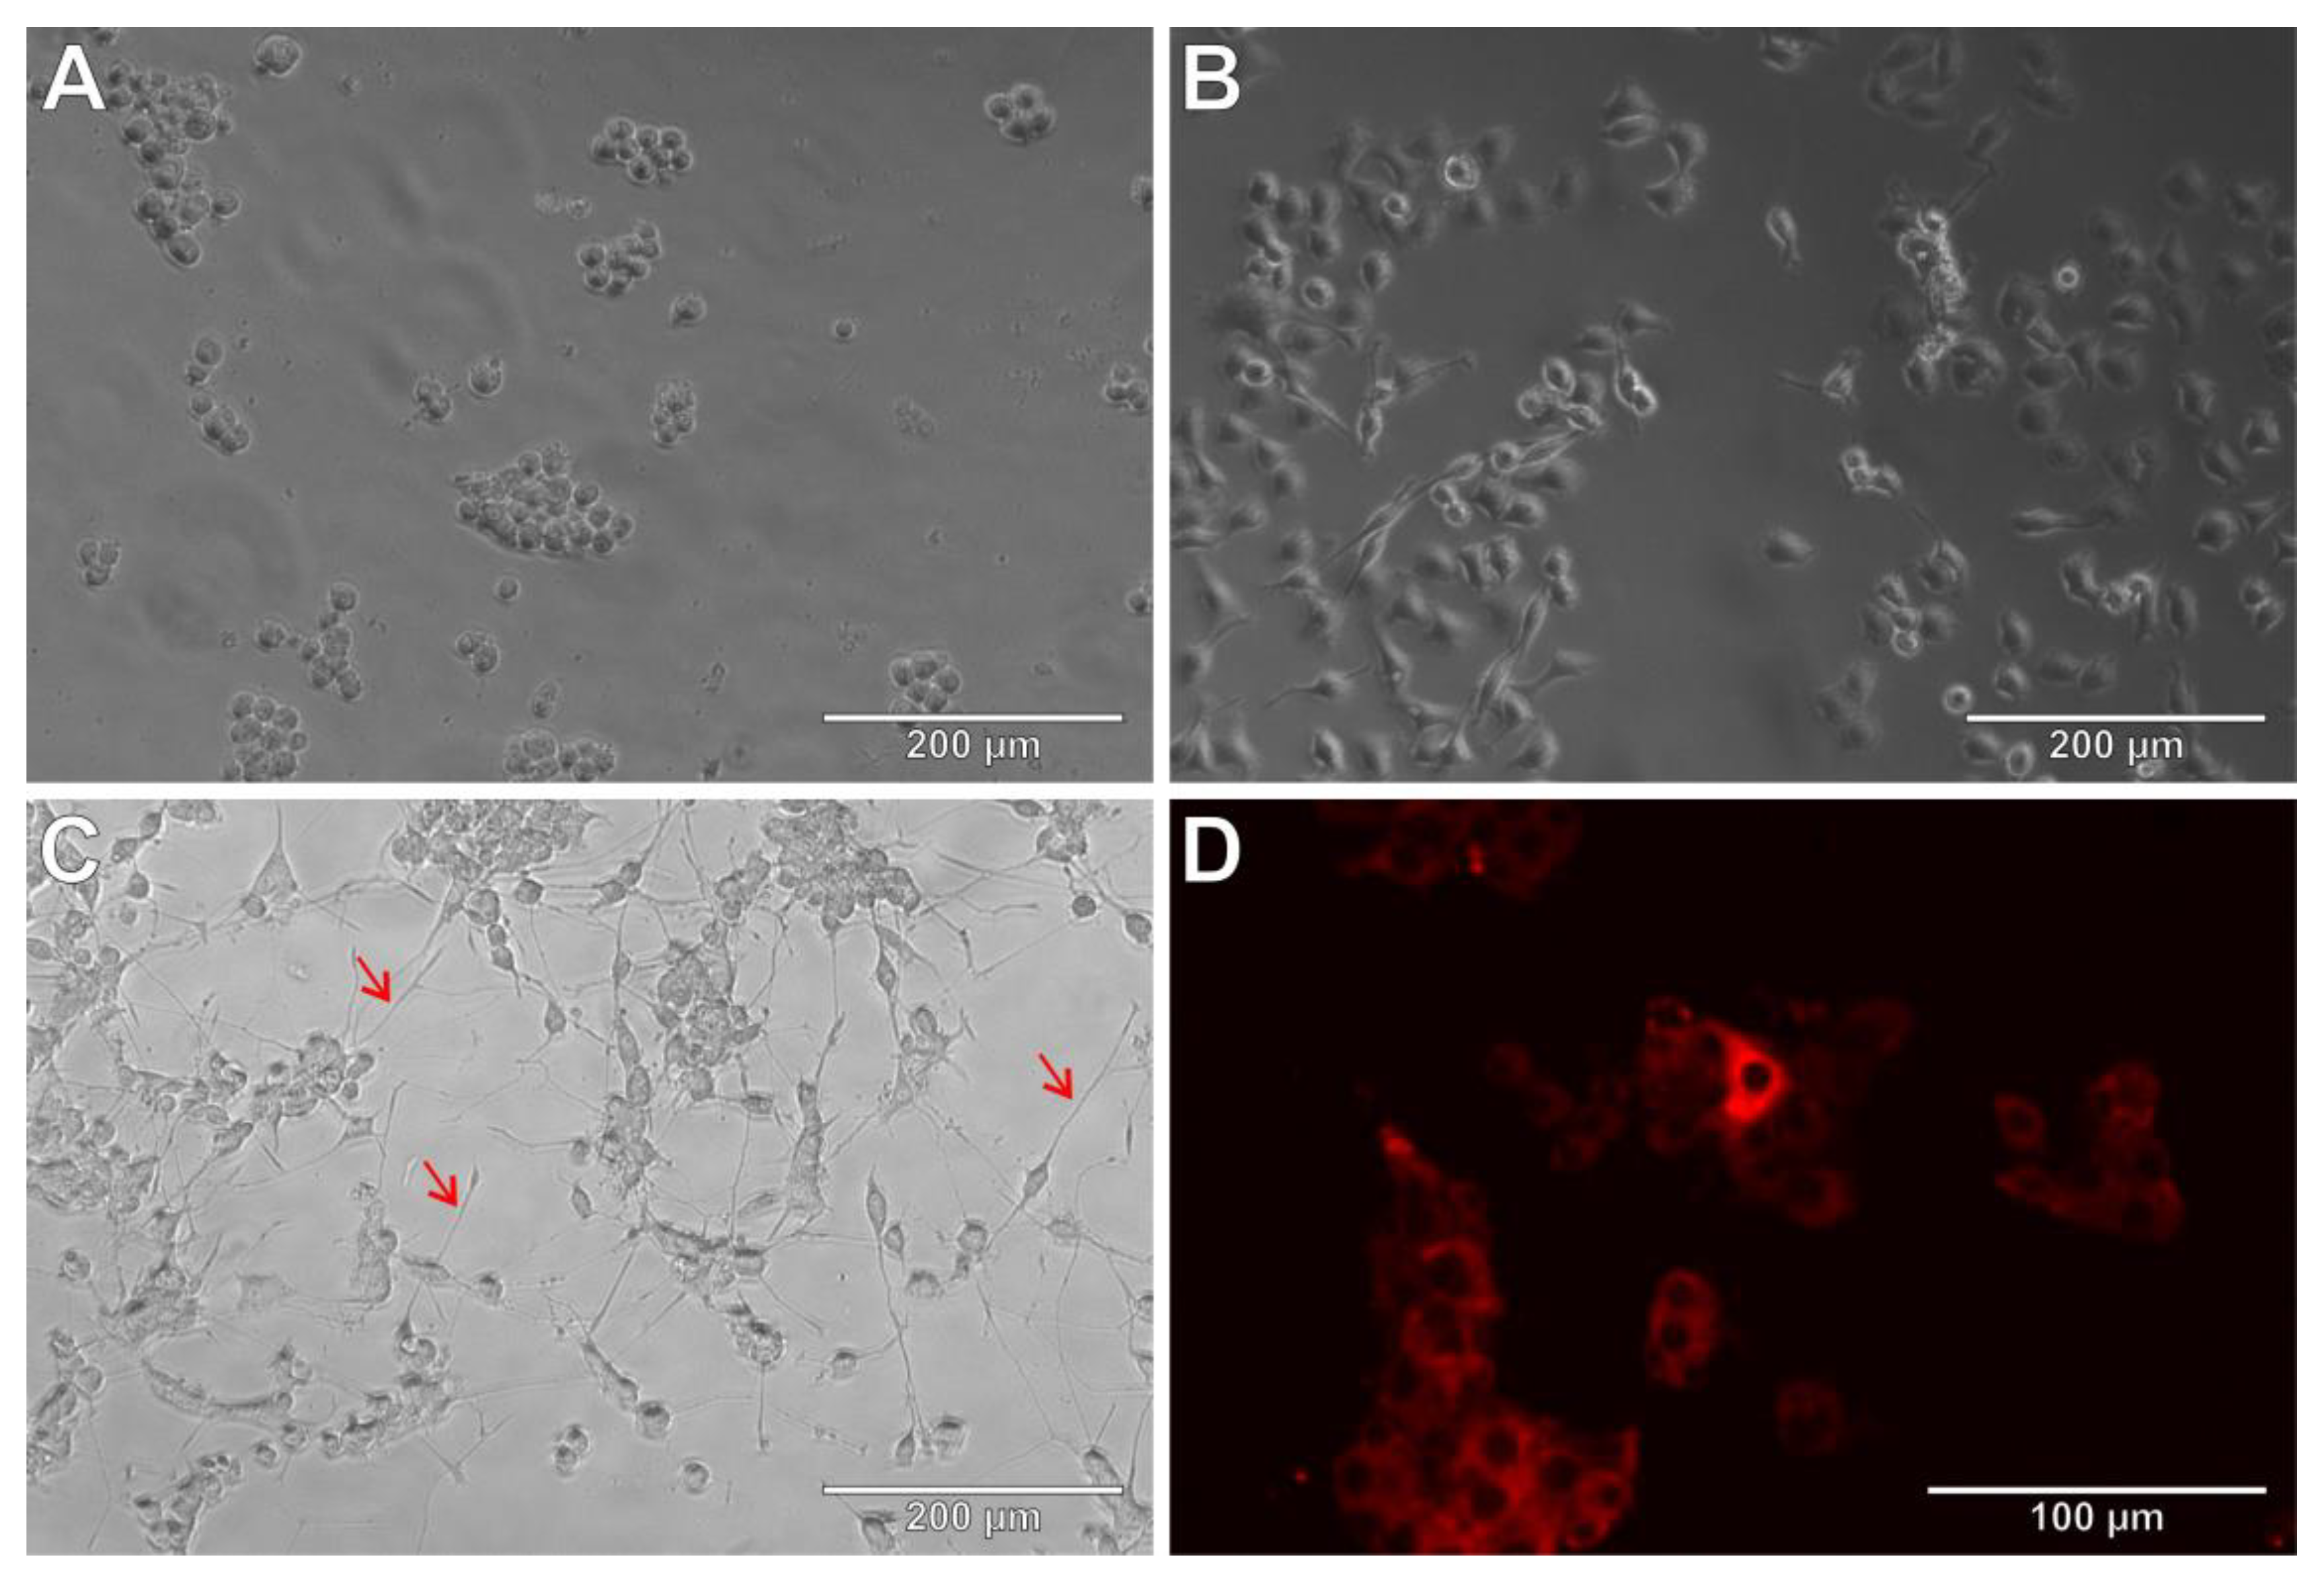
3.1. PC12 Cell Line as Neurobiological Model

The undifferentiated pheochromocytoma PC12 cells, due to their neoplastic origin, can be used in cancer research or pharmacological testing of newly discovered anticancer treatment [16]. However, incubation with NGF induces differentiation of these cells to sympathetic-like neurons, making them a valuable neuronal model used to study neurotoxicity or neuroprotective effect of newly synthesized drugs or discovered natural substances [15,17,18]. Differentiated PC12 cells also allow the study of the impact of these compounds on neurite outgrowth and neurodevelopment [19,20]. PC12 cells expressing neuron-like properties, cultured in properly adjusted conditions, constitute an easily accessible and reliable model for studying pathomechanisms of neurodegenerative diseases like AD or Parkinson’s disease and developing potentially effective treatments (Table 2) [10,21,22,23,24].
Although the protocols for proper preparation of PC12 cell line to serve as a neuronal model have already been described, numerous studies on neurodegeneration do not include cell differentiation in their study design, therefore conducting their experiments on cells expressing properties of the adrenal pheochromocytoma cells. Sakagami et al. proved that PC12 cells, after neuronal differentiation with NGF, develop resistance to some anticancer drugs [26].
Scientists quite often use undifferentiated PC12 cells to test neurotoxicity or anti-inflammatory or neuroprotective properties of new pharmacotherapeutics, searching for effective treatment for neurodegenerative and neuroinflammatory diseases like AD. LPS and Aβ are often used to induce a state of inflammation and simulate conditions found in the AD-affected brain [27,28,29,30,31]. Unfortunately, as we prove in our study, undifferentiated PC12 cells show altered response to Aβ25-35 and LPS compared to NGF-treated cultures induced to differentiation. Therefore, results obtained with undifferentiated PC12 pheochromocytoma cells cannot be interpreted as representative of neuronal cells.
Two main types of PC12 cell lines are available from the ATCC collection—cells growing in suspension or adherent. Previous work proved that only PC12 cells growing in suspension could be an appropriate research model in neurobiology experiments. To use the PC12 cells for these studies, it is necessary to prepare the culture plates’ surface properly [15]. The PC12 cells growing in suspension form aggregates and are round and small (Figure 1A). In order to differentiate them into neuron-like cells, they must first adhere to the surface of the culture vessel. Meanwhile, these cells do not adhere to plastic surfaces, and a modification of the surface of wells is necessary, e.g., by coating with type I collagen. PC12 cells seeded on the modified surface become flattened due to the reorganization of the cytoplasm, and the shape of the cells becomes polygonal (Figure 1B).
According to the literature, PC12 cultures should be differentiated in the presence of NGF from 48 h to 7 days. In our opinion, the time of differentiation should be at least 72 h [15]. Therefore, the time of 72 h was chosen in this study, examining the effect of differentiation on sensitivity to harmful factors (LPS and Aβ25-35).
Characteristics of PC12 cells differentiation were assessed after incubation with 100 ng/mL NGF for 72 h by observing the cell morphology: the elongation of the branches (emerging neurites from cells), polygonal shape and adherence of the culture to the surface of wells. Expression of DCX, characteristic of developing neuronal cells, was observed in the cytoplasm (Figure 1D) [15].

3.2. PC12 Cells and Amyloid β (25-35)

PC12 cells induced to differentiation and treated with amyloid β (25-35) presented a decrease in mitochondrial metabolic activity in a dose-dependent manner (Figure 2A). Moreover, the differences in MTT assay results between differentiated and undifferentiated ones are statistically significant in the entire studied concentration range—activity was 17.9–35.2% lower in differentiated cells. As observed in numerous previous studies, Aβ presents a pronounced affinity towards the mitochondrial membrane and neurons are physiologically characterized by the presence of many mitochondria in each cell, especially in branching neurites that can be observed only in differentiated PC12 cells [23]. It is currently believed that amyloid β might be a member of the antimicrobial peptides family. It is assumed that Aβ possesses the ability to self-aggregate in the presence of bacteria or fungi and bind to their particles leading to the neutralization of such harmful agents. Unfortunately, due to mitochondria’s origin (theory of endosymbiosis), these organelle share some similarities in membrane composition and properties with microbes, making them especially prone to amyloid toxicity [8,9].
A concentration dependence was also observed in the LDH assay (Figure 2B). In the concentrations between 0.1 and 5.0 µM, slightly higher cytotoxicity measured as LDH release was noted in the culture of differentiated PC12 cells compared to undifferentiated (by 3.7–16.4% but without the statistical significance of difference).
Literature data show that amyloid β is pro-oxidative in both In vitro studies on neuron-like cells and in Alzheimer’s disease patients. Our study found a pro-oxidative effect of Aβ25-35 at concentrations of 1 and 5 µM, regardless of whether the cell cultures were differentiated (Figure 2C). In our previous paper, however, we showed that Aβ25-35 exhibits antioxidant activity at low physiological concentrations. Results of the DCF-DA assay in this study at 0.001 and 0.1 µM Aβ25-35 concentrations in both cell types and 0.1 µM Aβ25-35 in undifferentiated PC12 cells confirm this observation. Different antioxidant and pro-oxidative responses depending on cell cultures’ differentiation may result from different phenotypes and cell activity. Undifferentiated cells are in constant proliferation, so their metabolism is faster, and in this case, higher ROS production is possible.
25-35 caused a significant increase in the amount of DNA damage, at concentrations of 1 and 5 µM Aβ25-35 in both types of cells, and in differentiated PC12 cells also at the concentration of 0.1 µM Aβ25-35 (Figure 2D). The genotoxicity of Aβ25-35 in concentrations of 0.1–5 µM caused more than twice as much damage (from 71.8% to 116.4%) in differentiated cells than in undifferentiated cultures. The difference was most profoundly demonstrated at the highest Aβ25-35 concentration (5.0 μM). Exemplary micrographs of the nuclear halo taken in the FHA assay are shown in Figure 3.

3.3. PC12 Cells and Lipopolysaccharide

In all tests on PC12 cells, a dose-dependent adverse effect of LPS was observed regardless of cell differentiation. The only exception was the MTT assay with a 1 µM LPS, where mitochondrial activity was higher than in control (by 29.0% in undifferentiated and 8.2% in differentiated cells).
According to MTT assay results, differentiated PC12 cells treated with LPS at concentrations of 1–50 µM showed significantly lower (by 9.2–16.1%) mitochondrial metabolic activity compared to undifferentiated cells (Figure 4A).
A statistically significant increase of cytotoxicity (LDH release) in the culture of undifferentiated cells occurred only at the 100 µM LPS concentration (19.6%), while for differentiated PC12 cells at each LPS concentration administered (32.8–94.2%; Figure 4B). A substantially higher LDH release (by 31.6–62.3%) was observed in differentiated PC12 cultures. Moreover, these differences between the effects of LPS on differentiated and undifferentiated cells were significant for each LPS concentration used.
DCF-DA assay showed the expected increase in the level of free radicals dependent on the LPS concentration (Figure 4C). A slightly higher ROS production level was observed in differentiated PC12 cells (compared to undifferentiated cells) incubated with LPS at concentrations of 5–100 µM (by 7.1–17.0%; without statistical significance but with a clear trend in this concentration range).
In the concentration range of 5–100 µM LPS, the increase in DNA damage level was statistically significant compared to negative control in both cell types and in differentiated cells at each LPS concentration used. The differences depending on the differentiation of PC12 cells were statistically significant at each LPS concentration and ranged from 15.3% to 42.4% (Figure 3 and Figure 4D).

3.4. Neuronal Features of PC12 Cells after Incubation with Aβ25-35 or LPS

In PC12 cell cultures differentiated in the presence of NGF, the average number of neurites per cell and the length of neurites were measured after treatment with either Aβ25-35 or LPS. The mean values of obtained results were presented relative to the negative control of cell cultures incubated only in a medium without tested compounds (Figure 5). Both the length and the average number of neurites decreased with increasing Aβ25-35 and LPS concentrations.
In PC12 cells treated with LPS, a statistically significant reduction in both the average length (by 25.6–39.1%) and the number of neurites (by 6.7–42.9%) was observed over the entire range of LPS concentrations tested (Figure 5C,D).
In turn, at low Aβ25-35 concentration (0.001–0.1 µM), a statistically significant up to 63% increase in the number of neurites per cell was observed (Figure 5B). At 0.001 µM Aβ25-35 concentration, there was also no reduction in the average neurite length (Figure 5A). At higher concentrations, Aβ25-35 caused adverse effects. The physiological concentrations of Aβ25-35 showed neuroprotective and neurotrophic effects similar to those observed in our previous study [32]. These findings seem to be in line with the recent shift in the perception of amyloid β, from the purely pathological and hallmark of disease to a potential antimicrobial peptide necessary for the brain’s proper functioning [33,34]. However, further research into the effects of physiological Aβ concentrations on cells under various simulated states and conditions is still needed to understand better its role in human health and disease.

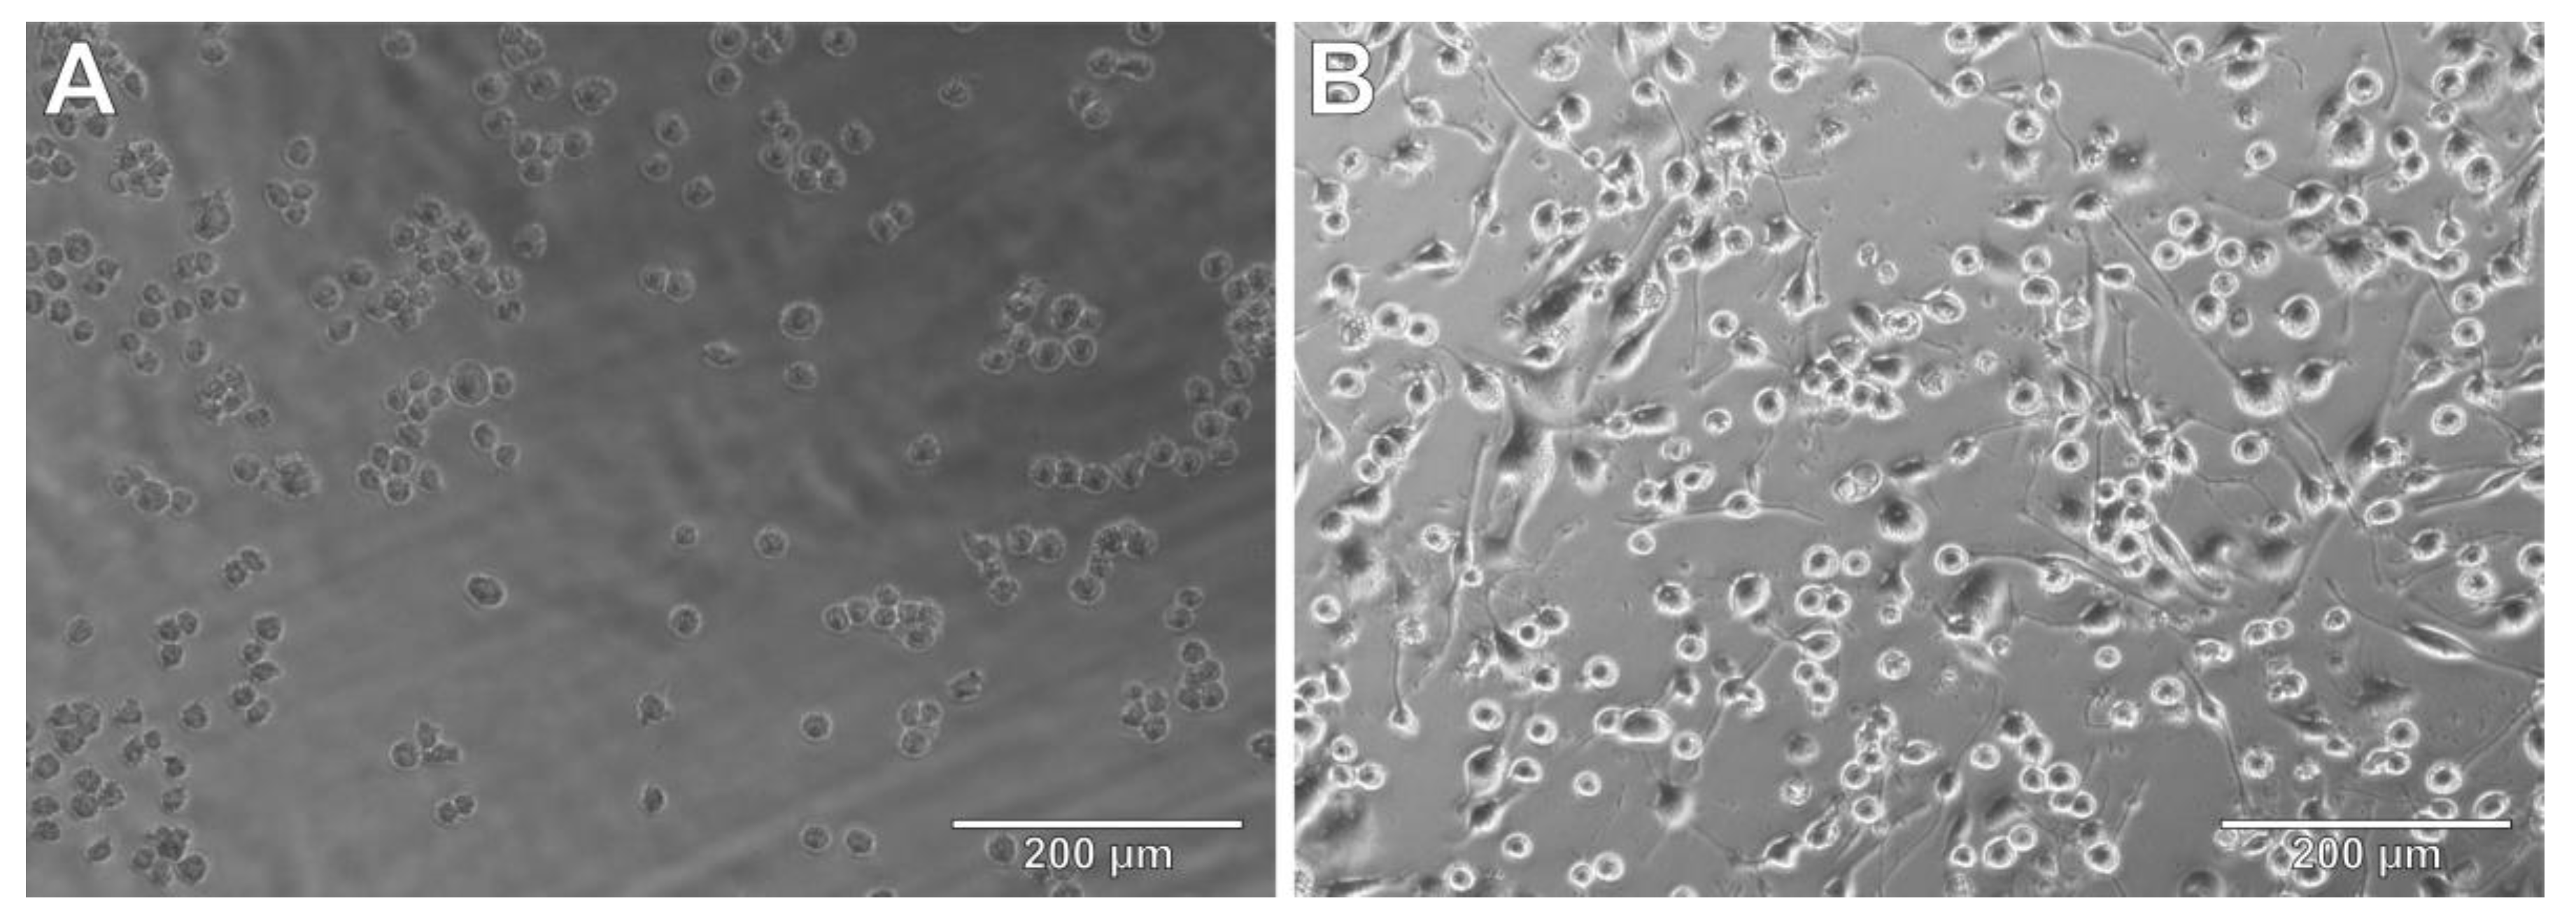
3.5. THP-1 Cells as Microglia Model

The same tests (except for LDH assay) were also performed on a second cell line—THP-1. As mentioned earlier, in studies focusing on neurodegeneration and neuroinflammation, in addition to neuronal cultures, the microglia model is a useful research tool.
Macrophages in their primary form (as an inherently heterogeneous group) are difficult to obtain in sufficient quantities and are usually replaced by the cancer-derived THP-1 cell line. Differentiation with macrophage colony-stimulating factor (M-CSF), retinoic acid, 1,25-dihydroxy vitamin D3 (vD3), or PMA causes the monocytic cells to acquire functional and morphological resemblance to macrophages (microglia) (Table 3). Contrary to the situation with PC12 cells, the need to differentiate THP-1 cells to constitute a macrophage model is widely recognized in the scientific community. However, it is worth noting that choosing the right PMA differentiation protocol is crucial to obtain reliable results [35,36].
The THP-1 cell line is grown in suspension. Cells are spherical and regular in shape. They are small, grow singly and do not aggregate like PC12 cells (Figure 6A). THP-1 cells do not require modification of the culture vessels’ surface to differentiate in the presence of the differentiation factor. After a 5-day incubation with 5 ng/mL PMA, it can be seen that the cells adhered to the surface and approximately 90% of cells have elongated morphology (Figure 6B).

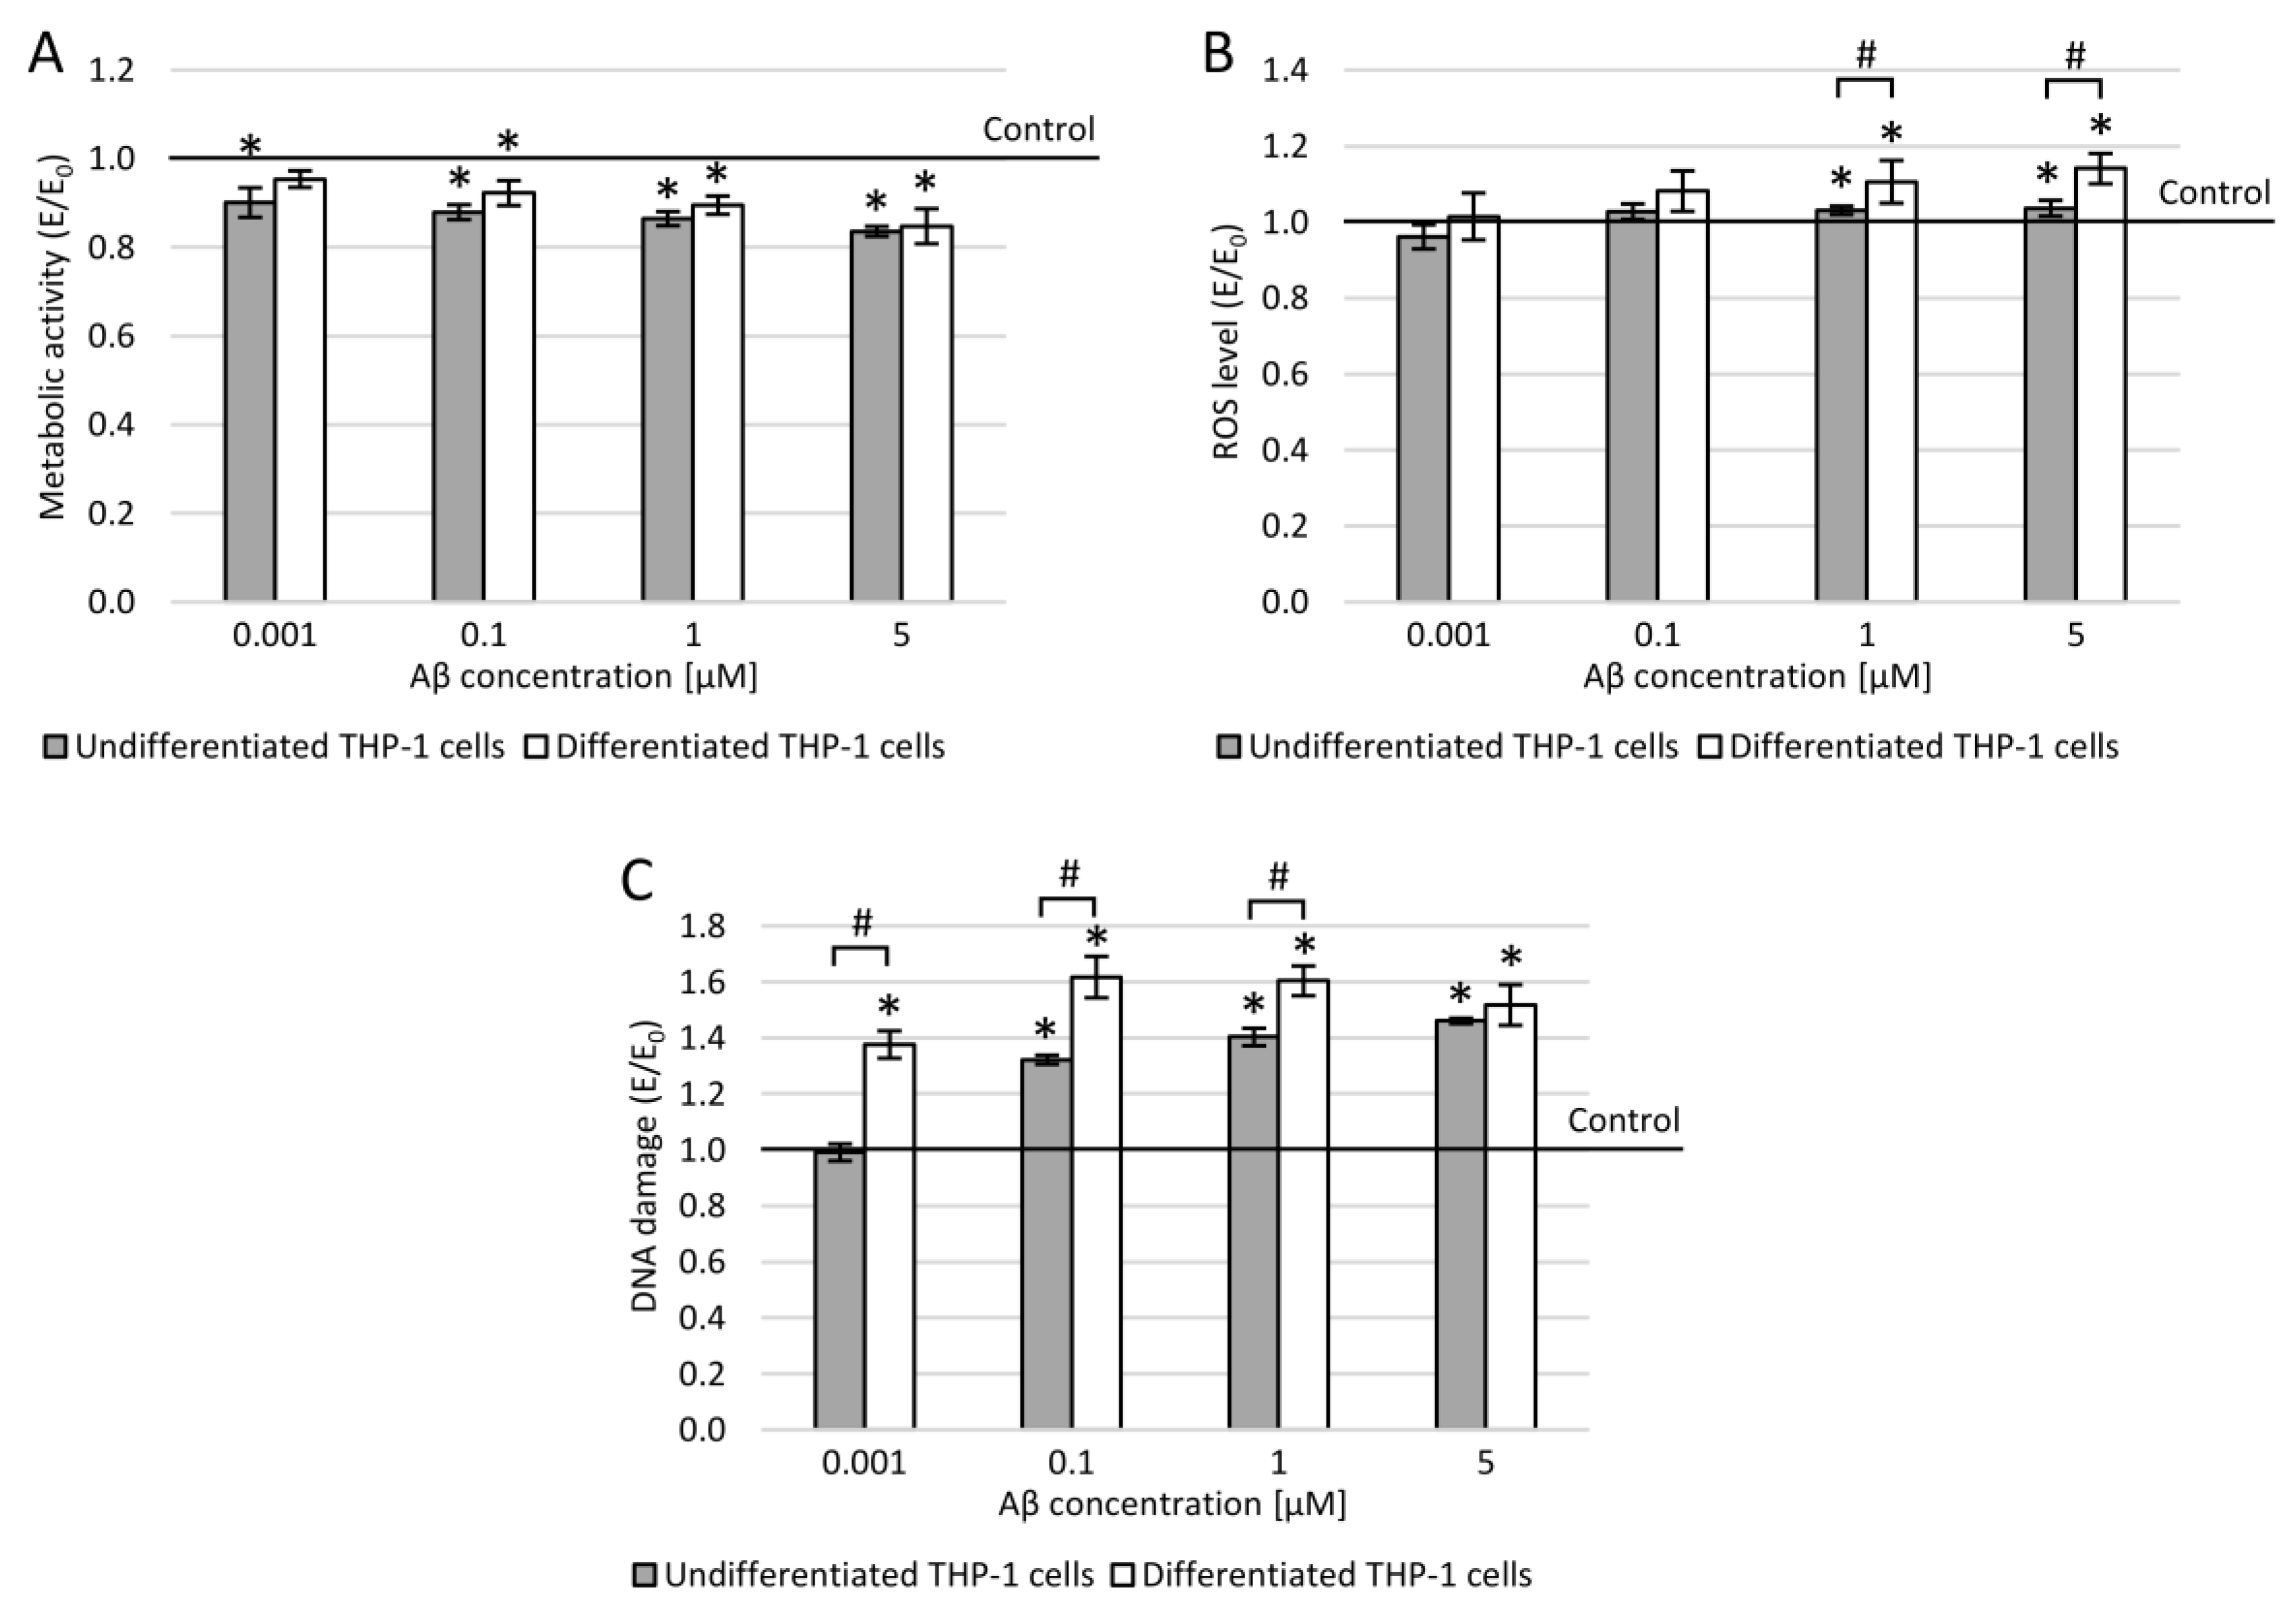
3.6. THP-1 Cells and Amyloid β (25-35)

Incubation of THP-1 cells with amyloid β (25-35) caused a significant decrease in mitochondrial metabolic activity (measured in the MTT assay) in all tested cases except for 0.001 µM Aβ25-35 concentration in differentiated cells (up to 16.4% or 15.2% at 5 µM Aβ25-35, respectively). However, the differences depending on cell differentiation were small and statistically insignificant (Figure 7A).
The ROS level in the THP-1 cultures incubated with Aβ25-35 was, like the metabolic activity, dependent on the Aβ25-35 concentration (Figure 7B). At the concentrations of 1 and 5 µM, the level of free radicals was significantly higher than in control, and the differences between undifferentiated and differentiated cells were also statistically significant—the level of ROS in differentiated cells was 7.3–10.1% higher.
The FHA assay showed a significant increase in the amount of DNA damage in THP-1 cells differentiated to microglia at all Aβ25-35 concentrations, while in undifferentiated cells, at 0.1–5 µM Aβ25-35 (Figure 7C and Figure 8). Except for the highest concentration of 5 µM, the level of DSBs in differentiated cells was statistically significantly higher (by 14.3–38.9%), especially at 0.001 µM Aβ25-35 to which undifferentiated THP-1 cells were completely insensitive.

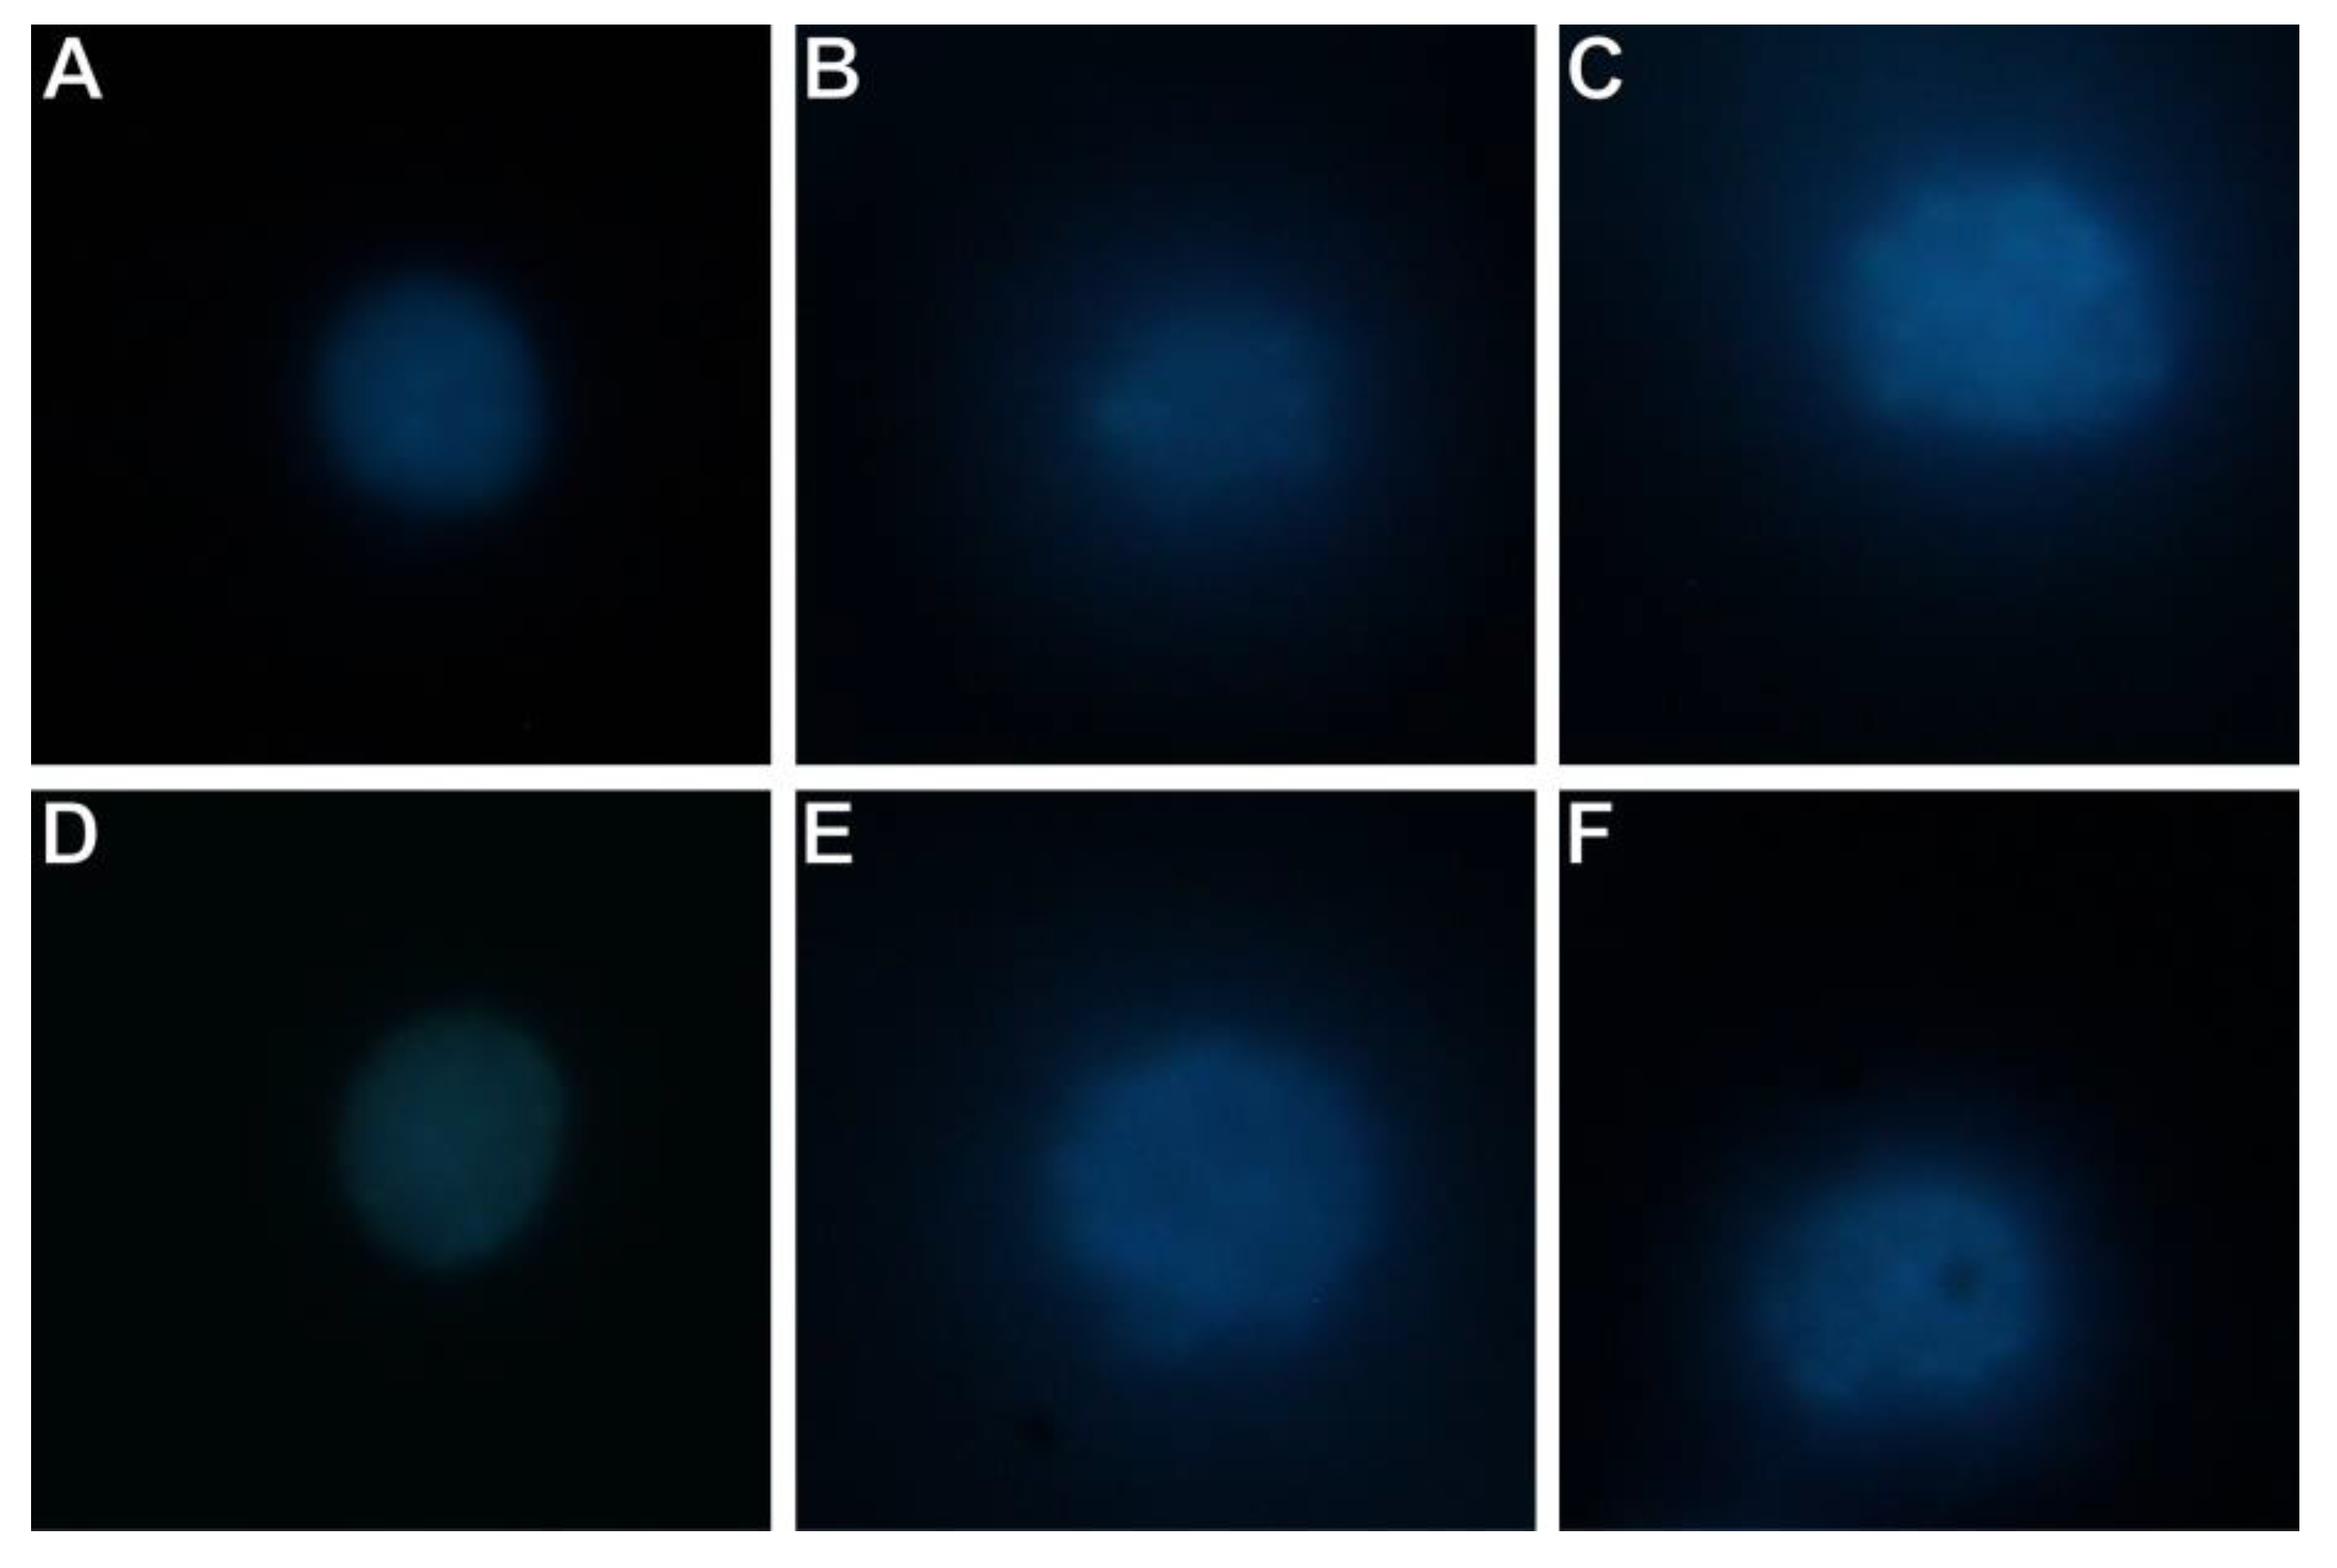
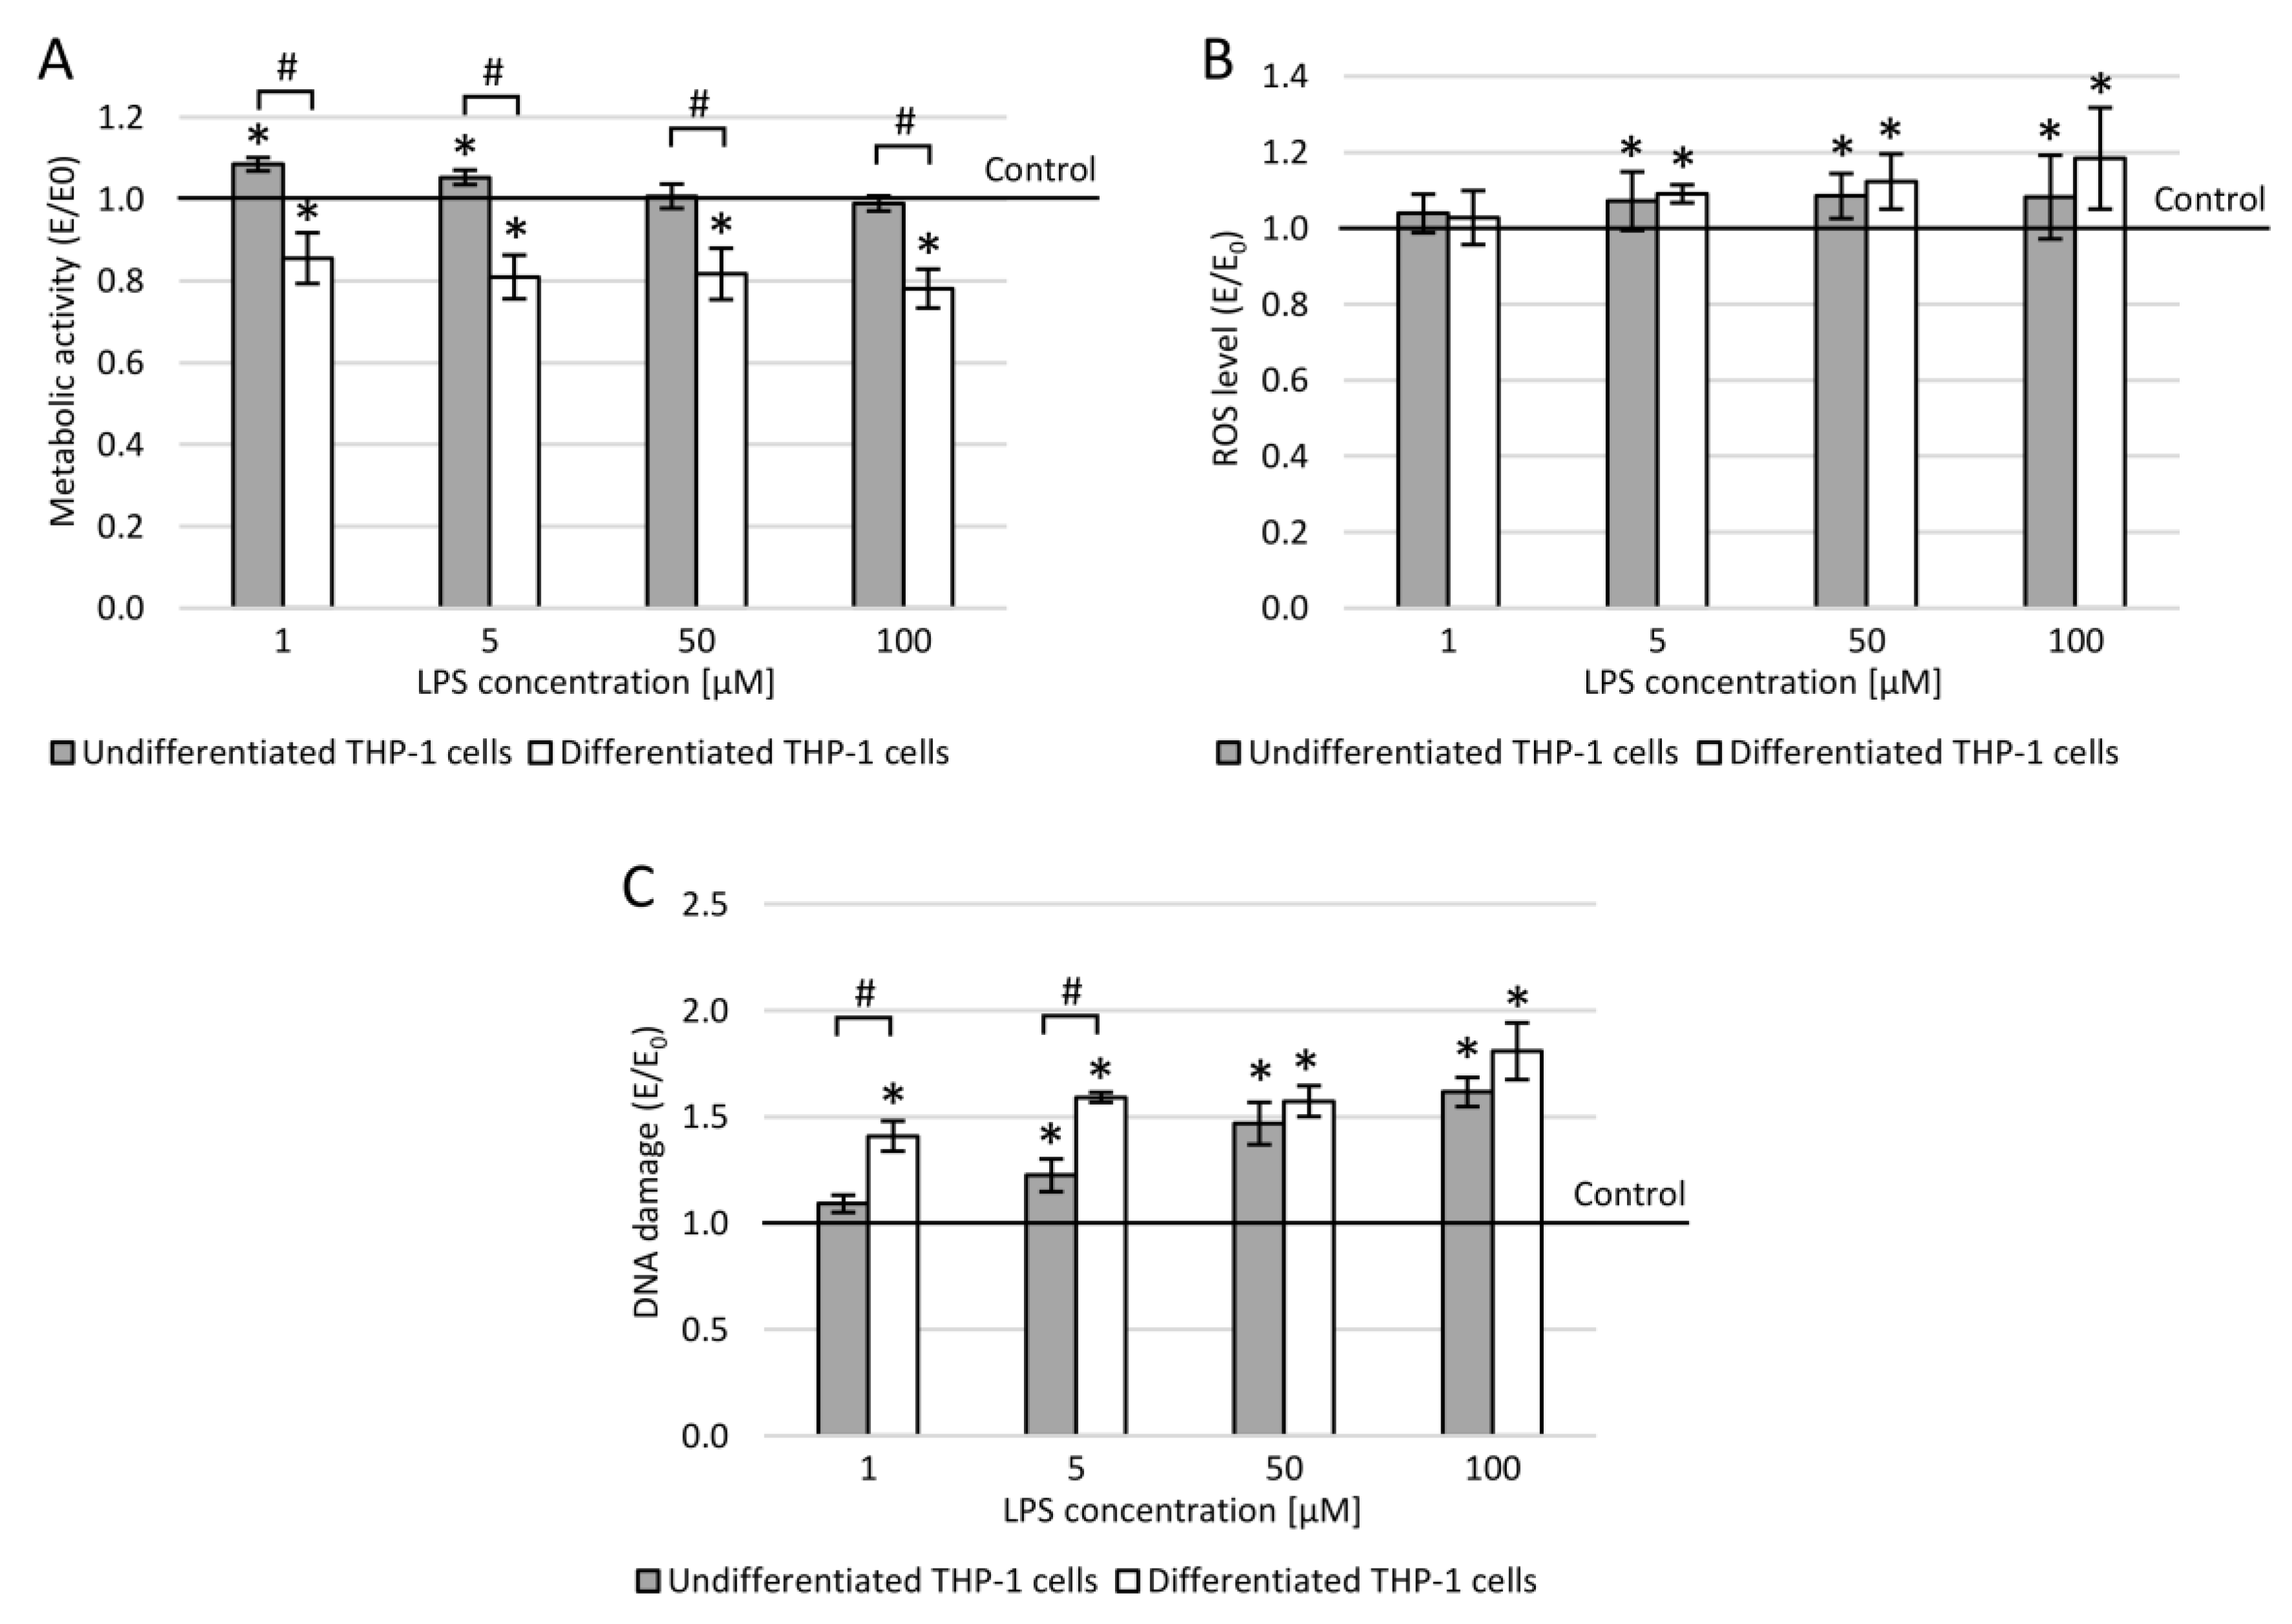
3.7. THP-1 Cells and Lipopolysaccharide

MTT assay performed on undifferentiated THP-1 cells showed no decrease of metabolic activity after incubation with bacterial lipopolysaccharide in any of the tested concentrations, while in cells differentiated with PMA significant decrease was noted (Figure 9A). The differences depending on the differentiation were significant and ranged from 18.9% to 23.1%.
In the DCF-DA assay, a significant increase in the ROS level was observed (by 7.1–18.4%), except for the concentration of 1 µM LPS. The oxidant response was LPS dose-dependent (Figure 9B). The free radicals level was slightly higher in cells differentiated with PMA, but these were not statistically significant differences.
In THP-1 cells differentiated to microglia, each applied concentration of LPS (1–100 μM) caused a significant increase of DSBs (40.9–80.8%), while in undifferentiated cells, at 5–100 µM LPS concentrations (22.4–61.6%) (Figure 8 and Figure 9C). Significant differences depending on cell differentiation were observed at LPS concentrations of 1 and 5 µM—29.2–29.9% more DNA damage in differentiated THP-1 cells.
Microglia serve as innate immunity agents in the immune-privileged brain by producing pro-inflammatory cytokines, removing microbes, their parts or cellular debris via phagocytosis. Both bacterial LPS and amyloid β interact with microglia through Toll-like receptors (TLRs), triggering the inflammatory response, stimulating upregulated production of reactive oxygen species and cytokines and making the phagocytosis of these harmful compounds ineffective, leading to cellular death [40,41].

4. Conclusions

The study results showed that in most of the tests performed, the biological response of PC12 and THP-1 cells induced to differentiation (with NGF or PMA, respectively) varied significantly from the effect in undifferentiated cells. Differentiated cells showed greater sensitivity to harmful factors in terms of metabolic activity and DNA damage, while in the case of free radicals, the results were heterogeneous. Significantly higher cytotoxicity (LDH release) was also observed in differentiated PC12 cells incubated with bacterial LPS (compared to undifferentiated). Therefore, it is important to prepare neoplasm-derived cell cultures accordingly when designing In vitro experiments for neurobiological research.

Author Contributions

Conceptualization, B.W.; methodology, B.W.; formal analysis, K.B. and B.W.; investigation, K.B. and B.W.; data curation, K.B. and B.W.; writing—original draft preparation, K.B and B.W.; writing—review and editing, K.B. and B.W.; visualization, B.W.; supervision, B.W.; All authors have read and agreed to the published version of the manuscript.

Funding

The publication was prepared under a project financed from funds granted by the Ministry of Science and Higher Education in the “Regional Initiative of Excellence” program for the years 2019–2022, project number 016/RID/2018/19, the amount of funding: PLN 11,998,121.30.

Institutional Review Board Statement

Not applicable.

Informed Consent Statement

Not applicable.

Data Availability Statement

The data generated and analyzed during the current study are available from the corresponding author upon reasonable request.

Conflicts of Interest

The authors declare no conflict of interest.

References

  1. Saeidnia, S.; Manayi, A.; Abdollahi, M. From in vitro Experiments to in vivo and Clinical Studies; Pros and Cons. Curr. Drug Discov. Technol. 2016, 12, 218–224. [Google Scholar] [CrossRef]
  2. García, Y.; Díaz-Castro, J. Advantages and disadvantages of the animal models v. in vitro studies in iron metabolism: A review. Animal 2013, 7, 1651–1658. [Google Scholar] [CrossRef]
  3. Chanput, W.; Mes, J.J.; Wichers, H.J. THP-1 cell line: An in vitro cell model for immune modulation approach. Int. Immunopharmacol. 2014, 23, 37–45. [Google Scholar] [CrossRef] [PubMed]
  4. Spangenberg, E.E.; Green, K.N. Inflammation in Alzheimer’s disease: Lessons learned from microglia-depletion models. Brain. Behav. Immun. 2017, 61, 1–11. [Google Scholar] [CrossRef] [PubMed] [Green Version]
  5. Nichols, M.R.; St-Pierre, M.K.; Wendeln, A.C.; Makoni, N.J.; Gouwens, L.K.; Garrad, E.C.; Sohrabi, M.; Neher, J.J.; Tremblay, M.E.; Combs, C.K. Inflammatory mechanisms in neurodegeneration. J. Neurochem. 2019, 149, 562–581. [Google Scholar] [CrossRef] [PubMed] [Green Version]
  6. Batista, C.R.A.; Gomes, G.F.; Candelario-Jalil, E.; Fiebich, B.L.; de Oliveira, A.C.P. Lipopolysaccharide-Induced Neuroinflammation as a Bridge to Understand Neurodegeneration. Int. J. Mol. Sci. 2019, 20, 2293. [Google Scholar] [CrossRef] [PubMed] [Green Version]
  7. Yang, Q.; Zhou, J. wei Neuroinflammation in the central nervous system: Symphony of glial cells. Glia 2019, 67, 1017–1035. [Google Scholar] [CrossRef]
  8. Welling, M.M.; Nabuurs, R.J.A.; Van Der Weerd, L. Potential role of antimicrobial peptides in the early onset of Alzheimer’s disease. Alzheimer’s Dement. 2015, 11, 51–57. [Google Scholar] [CrossRef]
  9. Moir, R.D.; Lathe, R.; Tanzi, R.E. The antimicrobial protection hypothesis of Alzheimer’s disease. Alzheimer’s Dement. 2018, 14, 1602–1614. [Google Scholar] [CrossRef]
  10. Dewapriya, P.; Li, Y.X.; Himaya, S.W.A.; Pangestuti, R.; Kim, S.K. Neoechinulin A suppresses amyloid-β oligomer-induced microglia activation and thereby protects PC-12 cells from inflammation-mediated toxicity. Neurotoxicology 2013, 35, 30–40. [Google Scholar] [CrossRef]
  11. Hansen, D.V.; Hanson, J.E.; Sheng, M. Microglia in Alzheimer’s disease. J. Cell Biol. 2018, 217, 459–472. [Google Scholar] [CrossRef]
  12. Cai, Z.; Hussain, M.D.; Yan, L.J. Microglia, neuroinflammation, and beta-amyloid protein in Alzheimer’s disease. Int. J. Neurosci. 2014, 124, 307–321. [Google Scholar] [CrossRef]
  13. Rajendran, L.; Paolicelli, R.C. Microglia-mediated synapse loss in Alzheimer’s disease. J. Neurosci. 2018, 38, 2911–2919. [Google Scholar] [CrossRef] [Green Version]
  14. Slanzi, A.; Iannoto, G.; Rossi, B.; Zenaro, E.; Constantin, G. In vitro Models of Neurodegenerative Diseases. Front. Cell Dev. Biol. 2020, 8, 328. [Google Scholar] [CrossRef]
  15. Wiatrak, B.; Kubis-Kubiak, A.; Piwowar, A.; Barg, E. PC12 Cell Line: Cell Types, Coating of Culture Vessels, Differentiation and Other Culture Conditions. Cells 2020, 9, 958. [Google Scholar] [CrossRef]
  16. Yang, H.H.; Zhang, C.; Lai, S.H.; Zeng, C.C.; Liu, Y.J.; Wang, X.Z. Isoliquiritigenin Induces Cytotoxicity in PC-12 Cells In Vitro. Appl. Biochem. Biotechnol. 2017, 183, 1173–1190. [Google Scholar] [CrossRef]
  17. Mendonça, L.M.; da Silva Machado, C.; Correia Teixeira, C.C.; Pedro de Freitas, L.A.; Pires Bianchi, M.D.L.; Greggi Antunes, L.M. Curcumin reduces cisplatin-induced neurotoxicity in NGF-differentiated PC12 cells. Neurotoxicology 2013, 34, 205–211. [Google Scholar] [CrossRef] [PubMed] [Green Version]
  18. Hara, Y.; Sakagami, H.; Shi, H.; Abe, T.; Tamura, N.; Takeshima, H.; Horie, N.; Kaneko, T.; Shiratsuchi, H.; Kaneko, T. Partial protection of paclitaxel-induced neurotoxicity by antioxidants. In Vivo 2018, 32, 745–752. [Google Scholar] [CrossRef] [PubMed]
  19. Zhou, T.; Xu, B.; Que, H.; Lin, Q.; Lv, S.; Liu, S. Neurons derived from PC12 cells have the potential to develop synapses with primary neurons from rat cortex. Acta Neurobiol. Exp. 2006, 66, 105–112. [Google Scholar]
  20. Christen, V.; Rusconi, M.; Crettaz, P.; Fent, K. Developmental neurotoxicity of different pesticides in PC-12 cells in vitro. Toxicol. Appl. Pharmacol. 2017, 325, 25–36. [Google Scholar] [CrossRef]
  21. Malagelada, C.; Greene, L.A. PC12 Cells as a model for parkinson’s disease research. In Parkinson’s Disease; Nass, R., Przedborski, S., Eds.; Academic Press: Cambridge, MA, USA, 2008; pp. 375–387. [Google Scholar]
  22. Jesky, R.; Chen, H. The neuritogenic and neuroprotective potential of senegenin against Aβ-induced neurotoxicity in PC 12 cells. BMC Complement. Altern. Med. 2016, 16, 26. [Google Scholar] [CrossRef] [Green Version]
  23. Eggers, C.; Fujitani, M.; Kato, R.; Smid, S. Novel cannabis flavonoid, cannflavin A displays both a hormetic and neuroprotective profile against amyloid β-mediated neurotoxicity in PC12 cells: Comparison with geranylated flavonoids, mimulone and diplacone. Biochem. Pharmacol. 2019, 169, 113609. [Google Scholar] [CrossRef]
  24. Bokare, A.M.; Praveenkumar, A.K.; Bhonde, M.; Nayak, Y.; Pal, R.; Goel, R. 5-HT6 Receptor Agonist and Antagonist Against β-Amyloid-Peptide-Induced Neurotoxicity in PC-12 Cells. Neurochem. Res. 2017, 42, 1571–1579. [Google Scholar] [CrossRef]
  25. Guroff, G. PC12 cells as a model of neuronal differentiation. In Cell Culture in the Neurosciences; Springer: Boston, MA, USA, 1985; pp. 245–272. [Google Scholar]
  26. Sakagami, H.; Hara, Y.; Shi, H.; Iwama, S.; Nakagawa, M.; Suzuki, H.; Tanaka, K.; Tomoyuki, A.B.E.; Tamura, N.; Takeshima, H.; et al. Change in anticancer drug sensitivity during neuronal differentiation of PC12 cells. In Vivo 2018, 32, 765–770. [Google Scholar] [CrossRef]
  27. Zhu, D.-J.; Chen, X.-W.; Wang, J.-Z.; Ju, Y.-L.; Ou Yang, M.-Z.; Zhang, W.-J. Proteomic analysis identifies proteins associated with curcumin-enhancing efficacy of irinotecan-induced apoptosis of colorectal cancer LOVO cell. Int. J. Clin. Exp. Pathol. 2014, 7, 1–15. [Google Scholar]
  28. Zhang, D.; Wang, Z.; Sheng, C.; Peng, W.; Hui, S.; Gong, W.; Chen, S. Icariin Prevents Amyloid Beta-Induced Apoptosis via the PI3K/Akt Pathway in PC-12 Cells. Evidence-Based Complement. Altern. Med. 2015, 235265. [Google Scholar] [CrossRef] [Green Version]
  29. Zhang, G.; Liu, Y.; Xu, L.; Sha, C.; Zhang, H.; Xu, W. Resveratrol alleviates lipopolysaccharide-induced inflammation in PC-12 cells and in rat model. BMC Biotechnol. 2019, 19, 10. [Google Scholar] [CrossRef]
  30. Jiang, J.; Wang, G. Matrine protects PC12 cells from lipopolysaccharide-evoked inflammatory injury via upregulation of miR-9. Pharm. Biol. 2020, 58, 314–320. [Google Scholar] [CrossRef] [PubMed] [Green Version]
  31. Ma, S.; Zhang, C.; Zhang, Z.; Dai, Y.; Gu, R.; Jiang, R. Geniposide protects PC12 cells from lipopolysaccharide-evoked inflammatory injury via up-regulation of miR-145-5p. Artif. Cells Nanomed. Biotechnol. 2019, 47, 2875–2881. [Google Scholar] [CrossRef] [PubMed] [Green Version]
  32. Wiatrak, B.; Balon, K. Protective Activity of Aβ on Cell Cultures (PC12 and THP-1 after Differentiation) Preincubated with Lipopolysaccharide (LPS). Mol. Neurobiol. 2020, 58, 1453–1464. [Google Scholar] [CrossRef] [PubMed]
  33. Brothers, H.M.; Gosztyla, M.L.; Robinson, S.R. The Physiological Roles of Amyloid-β Peptide Hint at New Ways to Treat Alzheimer’s Disease. Front. Aging Neurosci. 2018, 10, 118. [Google Scholar] [CrossRef]
  34. Soscia, S.J.; Kirby, J.E.; Washicosky, K.J.; Tucker, S.M.; Ingelsson, M.; Hyman, B.; Burton, M.A.; Goldstein, L.E.; Duong, S.; Tanzi, R.E.; et al. The Alzheimer’s Disease-Associated Amyloid β-Protein Is an Antimicrobial Peptide. PLoS ONE 2010, 5, e9505. [Google Scholar] [CrossRef]
  35. Park, E.K.; Jung, H.S.; Yang, H.I.; Yoo, M.C.; Kim, C.; Kim, K.S. Optimized THP-1 differentiation is required for the detection of responses to weak stimuli. Inflamm. Res. 2007, 56, 45–50. [Google Scholar] [CrossRef] [PubMed]
  36. Lund, M.E.; To, J.; O’Brien, B.A.; Donnelly, S. The choice of phorbol 12-myristate 13-acetate differentiation protocol influences the response of THP-1 macrophages to a pro-inflammatory stimulus. J. Immunol. Methods 2016, 430, 64–70. [Google Scholar] [CrossRef] [PubMed]
  37. Tedesco, S.; De Majo, F.; Kim, J.; Trenti, A.; Trevisi, L.; Fadini, G.P.; Bolego, C.; Zandstra, P.W.; Cignarella, A.; Vitiello, L. Convenience versus Biological Significance: Are PMA-Differentiated THP-1 Cells a Reliable Substitute for Blood-Derived Macrophages When Studying in Vitro Polarization? Front. Pharmacol. 2018, 9, 71. [Google Scholar] [CrossRef] [Green Version]
  38. Daigneault, M.; Preston, J.A.; Marriott, H.M.; Whyte, M.K.B.; Dockrell, D.H. The Identification of Markers of Macrophage Differentiation in PMA-Stimulated THP-1 Cells and Monocyte-Derived Macrophages. PLoS ONE 2010, 5, e8668. [Google Scholar] [CrossRef] [PubMed]
  39. Starr, T.; Bauler, T.J.; Malik-Kale, P.; Steele-Mortimer, O. The phorbol 12-myristate-13-acetate differentiation protocol is critical to the interaction of THP-1 macrophages with Salmonella Typhimurium. PLoS ONE 2018, 13, e0193601. [Google Scholar] [CrossRef]
  40. Boutajangout, A.; Wisniewski, T. The innate immune system in Alzheimer’s disease. Int. J. Cell Biol. 2013, 576383. [Google Scholar] [CrossRef] [Green Version]
  41. Minter, M.R.; Taylor, J.M.; Crack, P.J. The contribution of neuroinflammation to amyloid toxicity in Alzheimer’s disease. J. Neurochem. 2016, 136, 457–474. [Google Scholar] [CrossRef]
Figure 1. Morphology of PC12 cells used in the study: (A) PC12 cells incubated in a primary medium; (B) PC12 cells incubated for 72 h in primary medium on the surface covered with collagen type I; (C) PC12 cells incubated in differentiation medium on the surface covered with collagen type I (red arrows indicate neurites); (D) PC12 cells incubated in differentiation medium on the surface covered with collagen type I for 72 h and fluorescently stained with DCX antibody conjugated with PE fluorochrome.
Applsci 11 03729 g001
Figure 2. Effect of Aβ25-35 on undifferentiated and differentiated PC12 cells: (A) metabolic activity (MTT assay); (B) cytotoxicity (LDH assay); (C) level of reactive oxygen species (DCF-DA assay); (D) double-stranded DNA damage (FHA assay); Control—cell culture incubated without Aβ25-35; * p < 0.05—significant difference compared to control; # p < 0.05—significant difference between undifferentiated and differentiated PC12 cells.
Applsci 11 03729 g002
Figure 3. Exemplary micrographs of nuclear halo in undifferentiated (AC) and differentiated (DF) PC12 cells taken in the FHA assay: (A) control culture of undifferentiated cells; (B) undifferentiated cells incubated with 5 µM Aβ25-35; (C) undifferentiated cells incubated with 100 µM LPS; (D) control culture of differentiated cells; (E) differentiated cells incubated with 5 µM Aβ25-35; (F) differentiated cells incubated with 100 µM LPS.
Applsci 11 03729 g003
Figure 4. Effect of lipopolysaccharide (LPS) on undifferentiated and differentiated PC12 cells: (A) metabolic activity (MTT assay); (B) cytotoxicity (LDH assay); (C) level of reactive oxygen species (DCF-DA); (D) double-stranded DNA damage (FHA assay); Control—cell culture incubated without LPS; * p < 0.05—significant difference compared to control; # p < 0.05—significant difference between undifferentiated and differentiated PC12 cells.
Applsci 11 03729 g004
Figure 5. Effect of Aβ25-35 (A,B) or lipopolysaccharide (C,D) on differentiated PC12 cells: (A) average length of neurites after incubation with Aβ25-35; (B) average number of neurites after incubation with Aβ25-35; (C) average length of neurites after incubation with LPS; (D) average number of neurites after incubation with LPS; Control—cell culture incubated without LPS or Aβ25-35; * p < 0.05—significant difference compared to control.
Applsci 11 03729 g005
Figure 6. Morphology of THP-1 cells used in the study: (A) cells incubated in the primary medium; (B) cells incubated in differentiation medium for 5 days.
Applsci 11 03729 g006
Figure 7. Effect of Aβ25-35 on undifferentiated and differentiated THP-1 cells: (A) metabolic activity (MTT assay); (B) level of reactive oxygen species (DCF-DA assay); (C) double-stranded DNA damage (FHA assay); Control—cell culture incubated without Aβ25-35; * p < 0.05—significant difference compared to control; # p < 0.05—significant difference between undifferentiated and differentiated THP-1 cells.
Applsci 11 03729 g007
Figure 8. Exemplary micrographs of nuclear halo in undifferentiated (AC) and differentiated (DF) THP-1 cells taken in the FHA assay: (A) control culture of undifferentiated cells; (B) undifferentiated cells incubated with 5 µM Aβ25-35; (C) undifferentiated cells incubated with 100 µM LPS; (D) control culture of differentiated cells; (E) differentiated cells incubated with 5 µM Aβ25-35; (F) differentiated cells incubated with 100 µM LPS.
Applsci 11 03729 g008
Figure 9. Effect of lipopolysaccharide (LPS) on undifferentiated and differentiated THP-1 cells: (A) metabolic activity (MTT assay); (B) level of reactive oxygen species (DCF-DA assay); (C) double-stranded DNA damage (FHA assay); Control—cell culture incubated without LPS; * p < 0.05—significant difference compared to control; # p < 0.05—significant difference between undifferentiated and differentiated THP-1 cells.
Applsci 11 03729 g009
Table 1. Advantages and disadvantages of using cell cultures in scientific research.
AdvantagesDisadvantages
  • Relatively cheap and easy to maintain
  • Provide results faster than in vivo studies
  • Allow multiple replicates of the experiment
  • The abundance of cell types/lines
  • Cells can be easily genetically modified
  • Do not require animal experiments (so no need to apply for the consent of the ethics committee for animal testing)
  • Adjustable 3D structure and culture environment
  • Co-cultures enable cellular cross-talk
  • Obtained results cannot be easily related to the human organism
  • Cells require proper handling and preparation to become a viable model
  • Knowledge of cells characteristics and phenotype is essential for the interpretation of results
Table 2. Characteristic properties of undifferentiated and differentiated PC12 cells [19,21,22,25].
Undifferentiated PC12 CellsDifferentiated PC12 Cells
  • Pheochromocytoma cells
  • Synthesize and secrete catecholamines
  • Express NGF receptors
  • Regarded as a model for adrenal chromaffin tumor
  • Morphologically similar to sympathetic neurons
  • Synthesize and secrete dopamine
  • Express various neuronal markers
  • Form synapses with primary neurons
  • Sensitive to neurotransmitters and electrically excitable
  • Regarded as a model of neuronal cells
Table 3. Characteristic properties of undifferentiated and differentiated THP-1 cells [35,37,38,39].
Undifferentiated THP-1 CellsDifferentiated THP-1 Cells
  • Monocytic cells
  • Growing in suspension
  • Higher expression of CD14
  • Macrophages (microglia)
  • Cells adhere to the surface of the wells
  • Decreased expression of CD14
  • Can phagocytose opsonized particles
  • Produce cytokines IL-1β and TNF-α upon TLR2 or TLR4 stimulation
Publisher’s Note: MDPI stays neutral with regard to jurisdictional claims in published maps and institutional affiliations.

