Article

Extending Cooling Rate Performance of Fast Scanning Chip Calorimetry by Liquid Droplet Cooling

1
State Key Laboratory of Coordination Chemistry, Department of Polymer Science and Engineering, School of Chemistry and Chemical Engineering, Nanjing University, Nanjing 210023, China
2
Shenzhen Research Institute, Nanjing University, Shenzhen 518057, China
3
Chair of Materials Science, University of Rostock, 18051 Rostock, Germany
4
Institute of Physics and Competence Centre °CALOR, University of Rostock, 18051 Rostock, Germany
5
Interdisciplinary Center for Transfer-Oriented Research in Natural Sciences (IWE TFN), Martin Luther University Halle-Wittenberg, 06108 Halle (Saale), Germany
6
Alexander Butlerov Institute of Chemistry, Kazan Federal University, 420008 Kazan, Russia
*
Authors to whom correspondence should be addressed.
Appl. Sci. 2021, 11(9), 3813; https://doi.org/10.3390/app11093813
Submission received: 24 February 2021 / Revised: 22 March 2021 / Accepted: 8 April 2021 / Published: 23 April 2021
(This article belongs to the Special Issue Recent Advance and Applications in Chip Calorimetry)

Abstract

:
The liquid droplet cooling technique for fast scanning chip calorimetry (FSC) is introduced, increasing the cooling rate for large samples on a given sensor. Reaching higher cooling rates and using a gas as the cooling medium, the common standard for ultra-fast temperature control in cooling requires reducing the lateral dimensions of the sample and sensor. The maximum cooling rate is limited by the heat capacity of the sample and the heat exchange between the gas and the sample. The enhanced cooling performance of the new liquid droplet cooling technique is demonstrated for both metals and polymers, on examples of solidification of large samples of indium, high-density polyethylene (HDPE) and poly (butylene 2,6-naphthalate) (PBN). It was found that the maximum cooling rate can be increased up to 5 MK/s in room temperature environment, that is, by two orders of magnitude, compared to standard gas cooling. Furthermore, modifying the droplet size and using coolants at different temperatures provide options to adjust the cooling rate in the temperature ranges of interest.

1. Introduction

The option of fast cooling is important for the analysis of crystallization and vitrification of materials, as it allows for designing specific solidification pathways, including crystallization at high melt–supercooling or full suppression of crystallization [1]. In the case of metal alloys, the critical cooling rate, avoiding the precipitation of alloying elements on cooling, is of particular importance for optimizing the age hardening processes, needed for understanding precipitation kinetics (commonly from 0.5 to 1000 K/s) [2,3]. Industrially important polymers exhibit critical cooling rates for avoiding crystallization on cooling covering a wide range: 0.5 K/s for poly(L-lactic acid) [4], 800 K/s for isotactic polypropylene [5] and more than 106 K/s for linear polyethylene [6]. Generally, there are two ways to reach high cooling rates for fast scanning chip calorimetry (FSC). The first option is reducing the mass of the sample and of the lateral dimensions of the measuring cell, as proposed by Minakov et al. [6,7]. In the case of fast scanning chip calorimetry (FSC), the cooling of nanogram-size samples is possible with rates up to 107 K/s [8]. However, decreasing the sample mass typically results in a reduced signal-to-noise (S/N) ratio. Rapid cooling of larger samples is possible with a cooling medium with a higher thermal effusivity, e.g., using a liquid or solid as a heat sink instead of a gas.
Nevertheless, as already discussed in reference [9], the maximum cooling rate cannot be increased by such an approach because, during heating, too much energy is stored in the cooling medium. Suppose the cooling medium is in thermal contact to the sample only during cooling, e.g., by immersing the hot part into a liquid quenching bath, gun technique of splat-quenching [10], melt-spinning techniques [11], sliding the sample from a hot to a cold place [12], or moving it into a region with a water spray [13]. Then, the limitation of too much stored energy in the device is not valid anymore. Such approaches are used in numerous homemade experimental setups for polymer-quenching experiments [14,15,16,17,18] or for producing amorphous metals [19].
So far, we are not aware of attempts to combine liquid quenching and FSC. However, this method would allow us to quench larger samples at higher cooling rates and measure them on heating at the device’s optimum heating rate. In this work, we introduce such a combination and demonstrate its advantages and limitations.
It is accepted and common practice to minimize the sample size in FSC experiments to reach high cooling rates, because fast cooling requires fast removal of the heat stored in the sample-calorimeter system. The maximum possible cooling rate in FSC is limited by the heat exchange between the sample and the surroundings and the sample size/heat capacity. As the measured heat flow is proportional to the apparent heat capacity multiplied by the temperature scanning rate, larger samples exhibit an increased S/N ratio, being important when scanning at lower rates. On the other side, smaller samples can be cooled fast without significant thermal lag. Though the dynamic range of FSC is already much larger than that of the conventional DSC, sensors of different sizes are presently used (Figure 1). Reduction in the sensor membrane thickness, of the lateral size of the heated spot and of the sample mass allows for increasing the cooling rate up to a few ten Megakelvin per second (MK/s). However, the small sample has a correspondingly low S/N ratio and a large surface-to-volume ratio. FSC commonly consists of a differential measurement scheme, where the heat losses from the sample and empty reference side are supposed to compensate each other. In the case of big samples, the different surface contributions to the heat losses are often neglected or corrected for heat capacity measurements [20,21,22,23]. Smaller samples, such as that shown on the far right, have much smaller bulk volume, and their relatively large surface disturbs the heat capacity measurement significantly.
Though it is common to change the temperature linearly with time in DSC and FSC experiments, approaching the temperature of the surrounding gas, cooling typically turns non-linear due the limited cooling capacity (Newtonian cooling). Figure 2 shows the cooling rate as a function of the temperature of an unloaded sensor XI392. Cooling performance depends on the thermal conductivity of the used gas, as a more conductive gas such as helium improves the performance [6,24]. The temperature of the surrounding gas is typically controlled by a thermostat and will be designated as Tt. The reduction in Tt, e.g., by cooling the thermostat with liquid nitrogen, is often used for extending the cooling rate at the relevant temperatures. However, in the case of the combination of instruments, e.g., FSC with X-ray diffraction (XRD) in a synchrotron facility [25] or with atomic force microscopy (AFM) [26] or optical microscopy (POM) [27], room temperature conditions and a nitrogen atmosphere are preferable.
Increasing the temperature range of the high cooling rate for a larger sample seems achievable by placing a liquid on top of the sample for rapid cooling. To perform heating scans at the optimum heating rate after cooling, the liquid needs to be removed. In this case, a volatile liquid is required to keep the performance of the standard FSC measurement in a gas surrounding after the fast heat treatment by the liquid.

2. Experimental

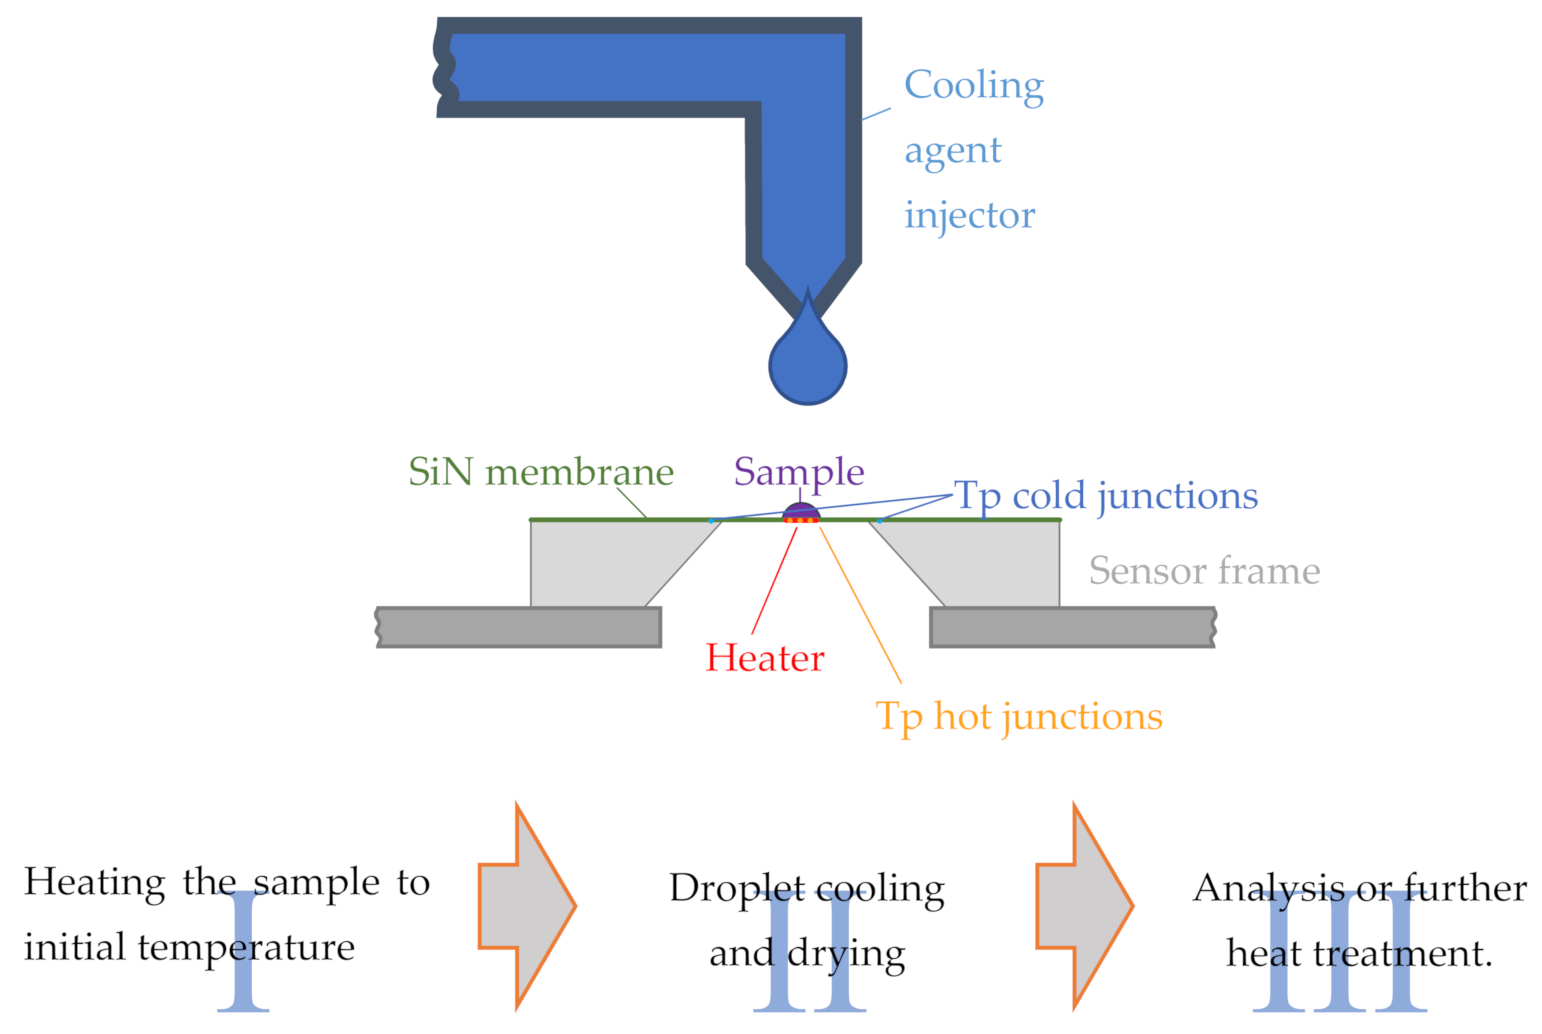
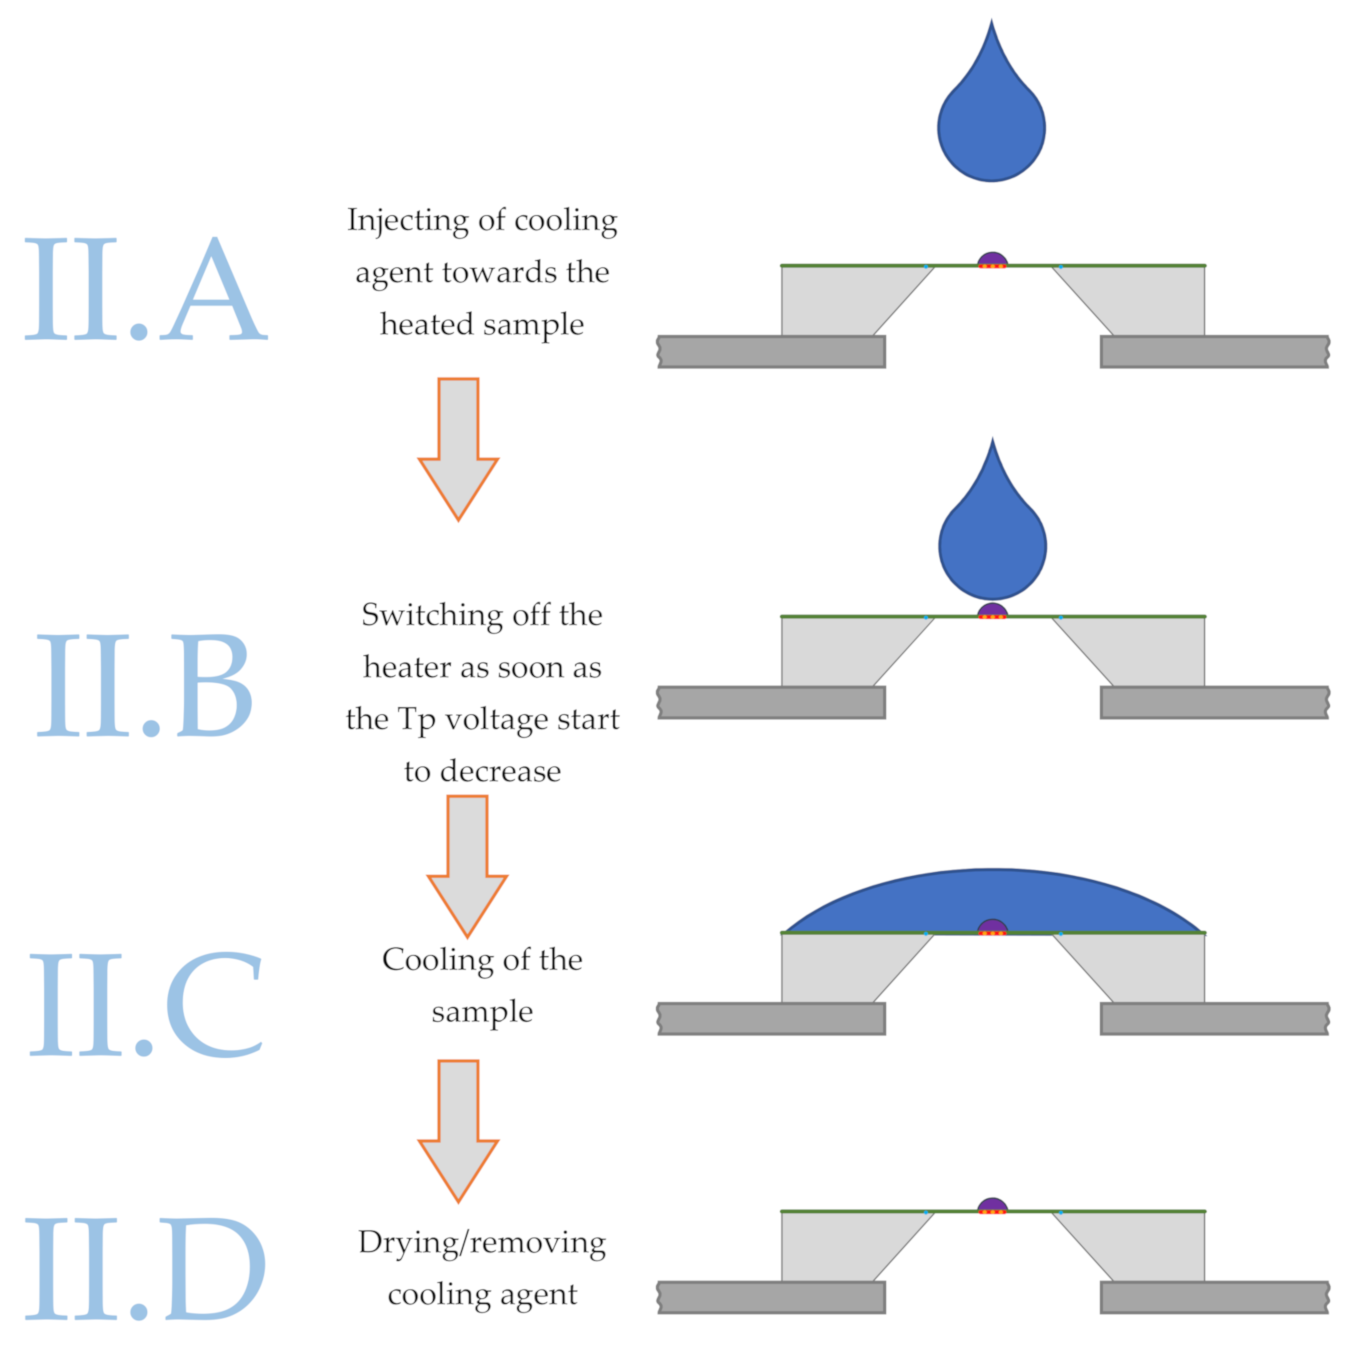
2.1. Liquid Droplet Cooling

The first experiment in that field was performed by Schröter [29]. Rapid cooling of the hot sample was realized by placing an ethanol droplet on the sample and simultaneously switching off the sensor heater. Preliminary tests showed that cooling up to 100 times faster, compared to gas cooling, was possible. In the present work, further implementation of droplet cooling in FSC is developed. Test measurements on the example of indium, high-density polyethylene (HDPE) and poly (butylene 2,6-naphthalate) (PBN) solidification show the possibilities and limitations of the new technique. In the case of PBN, the liquid cooling allows for vitrifying a large sample with the sensor at room temperature.
Liquid cooling is applied to quench the sample for a subsequent calorimetric measurement or other heat treatments. The method consists of three steps, as schematically shown in Figure 3:
  • Heating the sample by the internal sensor heater to the start temperature, commonly above the melting temperature.
  • Cooling the sample by synchronous deposition of a liquid droplet of the coolant and switching off the internal heater.
  • Analyzing the obtained structure by a heating scan or other combined experimental techniques or performing a further heat treatment.
The heater voltage at stage I can be defined from the FSC device in the common way, knowing the temperature readings of the thermopile. Droplet cooling, Stage II, is described in more detail in Figure 4. After the sample was molten, an injector with a specific diameter between 0.5 and 2 mm is used to provide a droplet of a cold liquid, moving towards the heated sample after its release by gravimetric forces (II.A). The thermopile voltage is tracked during the whole experiment. When the droplet approaches the sensor, the thermopile voltage starts to decrease (indicating the arrival of the liquid droplet on the sensor), and the electronics switches off the heater (II.B). During the cooling process, the temperature, respectively, of the cooling rate is recorded (II.C). If the droplet is not evaporating fully, a dry gas (e.g., N2 gas, used for experiments with reheating in this work) or even solvent flow (acetone) may be applied (II.D). At stage III in Figure 3, for further analysis or heat treatment, the calorimeter shall be turned into the normal FSC measurement mode.

2.2. Implementation of the Liquid Droplet Cooling into the FSC Electronics

In droplet cooling mode, for temperature recording and triggering the switching off of the heater voltage, the thermopile of the sample loaded sensor is connected to a high input impedance JFET voltage preamplifier SRS SIM910 (see amplifiers in Figure 5). The temperature signal from the preamplifier is monitored and recorded at the desired rate in the ring buffer of the NI DAQ (ADC/DAC) board. The data sampling rate was 1,000,000 samples per second per channel. In order to independently prove the validity of the thermopile readings, particularly during cooling with liquids at low temperature, the heater resistance was recorded too by applying a small voltage to the heater. Heater resistance can be calibrated to temperature and, thus, gives an additional confirmation of the temperature, e.g., when the thermopile cold junction temperature is unknown or changes during the droplet cooling.
The heater, which is needed to set up the initial temperature, must be switched off synchronous with the droplet arrival in stage II.B in Figure 4. If it remains powered, the temperature will not drop at maximum speed and levels off above the environmental temperature. Thus, an adjusted triggering of the heater voltage off is needed to increase the cooling rate.
For a better understanding of the triggering conditions, preliminary liquid droplet measurements were performed without switching off the heater. It was observed that few microseconds before contact with the droplet, the sensor thermopile detects a temperature deviation, probably caused by cold gas pushed in front of the moving droplet. This deviation can be used to program the trigger using the pre-amplified thermopile voltage as the source and switch off the heater voltage output of the DAQ board internally. The functionality of the NI DAQ 6356, used in the current version of the FSC, allows us to carry this out. After several tests, it was confirmed that the trigger delay is negligible and suitable for liquid cooling purposes. Thus, direct implementation into the FSC hardware was realized, avoiding additional electronics, such as the Schmidt trigger used previously [29].

2.3. Materials and Sensors

Different cooling liquids, including water (bi-distilled), ethanol (Sigma-Aldrich, St. Louis, MO, USA, 99.8%), acetone (Sigma-Aldrich, 99.9%), glycerol (Sigma-Aldrich, 99.5%), silicon oil (Sigma-Aldrich, Wacker (Burghausen, Germany)) and commercial cold-spray (Liqui Moly, −45 °C), were tested in this work. The glycerol and silicon oil require additional cleaning with acetone after each quenching, which is not preferable for some materials but can expand the list of possible cooling agents if needed. Water, even after being mixed with ethanol, was accumulating over several runs on the sensor membrane and its surroundings. It was not possible to remove it completely without using acetone or heating of the whole sensor to relatively high temperatures. The remaining water layer on the sample surface introduces significant disturbances to the FSC measurements after cooling. Chilled pure ethanol was also tested. For chilled ethanol experiments, the ethanol bottle was cooled to −50 °C and transported in a thermally isolated box. Then, chilled ethanol was deposited on the sensor as fast as possible using the approach shown in Figure 4 to avoid heating during transportation. Later on, the injector with ethanol was chilled with the cold-spray, thus giving more reliable cooling. The additional cooling was seen through the increased viscosity of the ethanol. Chilled ethanol may cause a misleading temperature measurement because of cooling the thermopile cold junctions.
The cold-spray was delivered in pressurized bottles. Therefore, it needs first extraction of the liquid out of the bottle nozzle and then providing the cold-spray towards the liquid cooling injector. The aim was to deposit a cooling liquid on the sensor without an upcoming gas front, because the gas movement will cause sample temperature oscillations and premature heater off triggering.
Sensors of different lateral size were used for the experimental test of the cooling rate performance of the droplet cooling, namely, the large Mettler Toledo Flash DSC UFS1 sensor and the medium-sized XI395 sensor (comparable to the UFH1 sensor from Mettler Toledo), with heated-area sizes of 500 µm diameter and 60 × 80 µm2, respectively.
The deposited droplets of the coolant were varied in size. In the case of the UFS1 sensor, the droplets were also placed on the different sides of the sensor. The moving droplet was causing a gas movement in front of it, which was detected by the sensor. Triggering sensitivity and delay were adjusted for each particular cooling agent to avoid triggering by the cold gas moving in front of the droplet. The aim was to switch off the heater simultaneously with arriving of the cooling liquid. Typical triggering deviations of the amplified thermopile voltage of 10–20 mV (ca. 5–10 K) were selected.
For further testing of liquid droplet cooling under realistic conditions, molten HDPE, PBN and indium samples were cooled. HDPE with a melting temperature Tm of 414 K and from previous FSC experiments [31,32] known cooling rate dependent crystallization temperatures was used. HDPE Paxon was provided by ExxonMobil and PBN by Teijin Shoji Europe GmbH. Indium of high purity (99.9%), as typically used for temperature calibration of calorimeters, was selected as a material with minor effects due to crystallization kinetics. Mass of HDPE was estimated from heat capacity value at fixed temperature. Mass of the PBN sample was estimated from the value of the glass transition step in heat capacity. For HDPE and indium, the solidification peak was visible on cooling, and therefore, the reheating was not necessary.
In case of PBN, in order to confirm the vitrified state of the sample after the droplet-cooling cycle, the sample was measured on heating in normal FSC mode. Prior to the measurement reheating cycle, the cooling agent was dried for 30 s.

3. Results

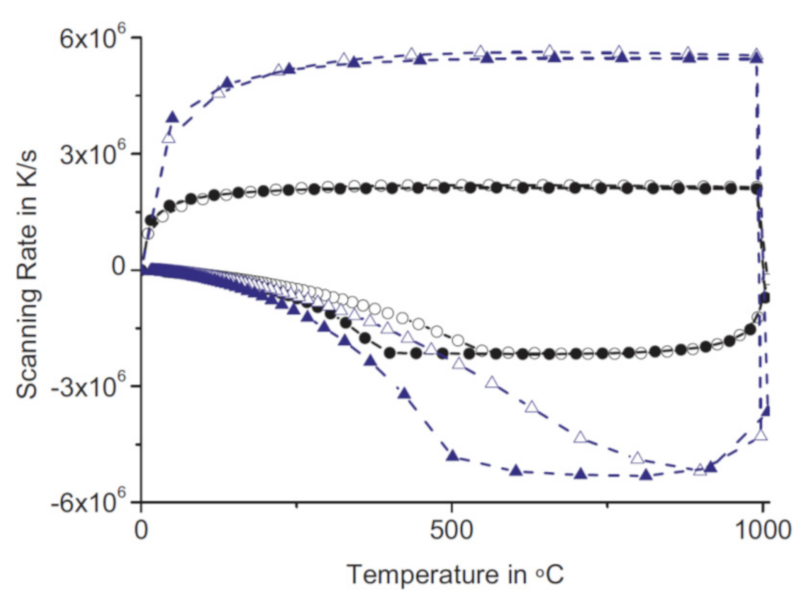
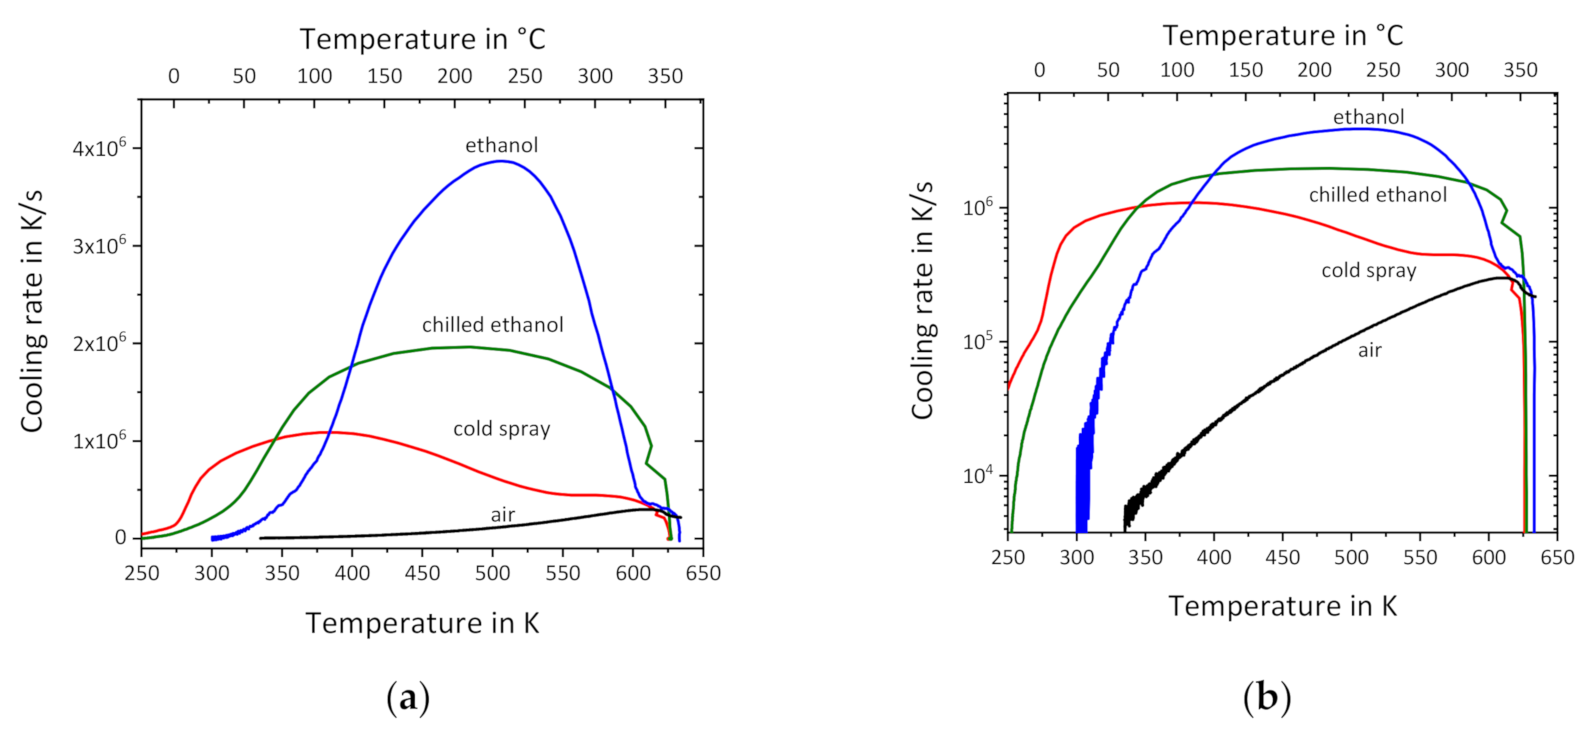
3.1. Liquid Cooling of Empty Sensors

The cooling performance is significantly improved by using liquid droplet cooling and synchronous switching off the heater, as illustrated in Figure 6a on the example of an empty XI395 sensor cooled with chilled ethanol from ca. 620 K to room temperature. Because the ballistic cooling follows an exponential law, Figure 6b shows the data plotted on a logarithmic scale. It is visible that in the entire temperature range down to the surrounding temperature, the liquid droplet cooling gives two orders of magnitude increase in the cooling rate. The insert of Figure 6a shows the work of a trigger system. The upcoming droplet causes a gas movement, which reduces the measured temperature by ca. 3 K. The heater voltage switches off after a 4 K temperature reduction caused by the droplet itself. The initial temperature difference between the blue and the red line is due to slight variations of the experimental conditions during the experiments, e.g., the sensor surface was not thoroughly cleaned after previous droplet cooling.
Figure 7 shows the achieved cooling rates for different cooling agents. Results using ethanol, chilled ethanol and cold-spray are shown and compared to gas cooling (air). The other cooling media did not improve the cooling rate compared to the shown liquids. Room temperature ethanol is most useful to achieve a maximum cooling rate of 4,000,000 K/s at 500 K, though the cooling rate quickly decays when approaching the base temperature (Figure 7a). If compared in logarithmic scale (Figure 7b), all liquid coolants level at approximately the same order of magnitude of 1,000,000 K/s, but cold liquids are more efficient at temperatures closer to ambient. Cold ethanol has less peak efficiency, since wetting of the surface is delayed because of higher viscosity. Cold-spray allows cooling to lower temperatures, therefore giving better cooling efficiency at 300 K. At high temperatures, cold-spray is the least efficient among the tested three liquids but still allows cooling at rates above 200,000 K/s. This can be explained by the lower boiling temperature of the cold-spray solution and the time required for the liquid to get in contact with the sample, avoiding formation of a gas layer (Leidenfrost phenomenon). The kink at around 270 K is probably due to water condensation, as all experiments were performed at ambient conditions. In a dry gas, the efficiency of the cold-spray at low temperatures may even be better.
A water–ethanol mixture was also tested as a cooling agent. The cooling rate around 300 K was significantly increased compared to pure ethanol, similar to chilled ethanol but lower than the cold-spray. It was found that a thin surface layer of water was accumulating on the membrane even when using chilled ethanol due to the condensation of water from the air. This layer was detected by the FSC and makes it challenging to compare the heating curves of the quenched material with reheating curves after gas cooling. Removing surface water would require heating the sensor. Therefore, water–ethanol mixtures were not used eventually, and results are not shown in Figure 7. Other liquids, e.g., acetone or glycerol, were not very useful in the tested temperature range because of the boiling at the sensor surface (Leidenfrost phenomenon) or delayed wetting due to high viscosity, respectively.
The evolution of the cooling rate with decreasing temperature is shown in Figure 8a. In the beginning, at high temperature, the cooling rate increases, while it takes until the droplet covers the sample and heat flows from the sample through the whole interface to the droplet. After the whole droplet has reached the surface of the sensor and sample and starts to spread along it and evaporate, the cooling rates decreases, showing an exponential decay. In the case of a small droplet (orange line in Figure 8), as soon as all liquid is removed/evaporated from the sample, the cooling rate returns to the values of gas cooling. Consequently, for larger droplets, the temperature range of fast cooling is extended to lower temperatures.
Various measurements showed that liquid droplet cooling efficiency mostly depends on the droplet size and the arrival place. By varying the injector diameter, liquid droplets with various size/volume, from approximately 1 to 200 µL, were tested, with their deposition on sensors with different heated areas (XI395 60 × 80 µm2 and UFS1 ø500 µm). Cooling with larger droplets is more efficient, providing a higher maximum cooling rate (see Figure 8a, blue curve). Surprisingly, the droplet becomes efficient only when its size is orders of magnitude larger than the sample. A water droplet of ca. 1 µL has a lateral dimension of ca. 1 mm, which is much larger than the heated area of the sensor, which is in the order of 50 µm in lateral dimension, but its cooling is inefficient. In contrast, a ca. 200 µL drop, which is basically a flow of liquid around the sample, gives maximum cooling efficiency.
A smaller heating area of the sensor shows better cooling performance in terms of boiling (see Figure 8b). The peak cooling rate of the XI395 sensor increased at the temperature of maximum around 500 K from 105 to almost 2.5 × 10⁶ K/s. On the larger UFS1 sensor, intensive boiling of pure ethanol and the ethanol–water mixture was observed because of the large heat capacity of this sensor, resulting in a reduction in the maximum cooling rate. It was found earlier that convection does not significantly contribute to the heat losses on the here relevant length and time scales [33]. The effect seems to be related to the enlarged contact area with the sensor.
Interestingly, below 350 K both curves (liquid cooling on both XI495 and UFS1 sensors) coincide, proposing that if boiling is avoided, e.g., by replacing the coolant with a high boiling temperature ionic liquid [34], the droplet cooling of the UFS1 sensor may be even more efficient relative to its performance with gas cooling.

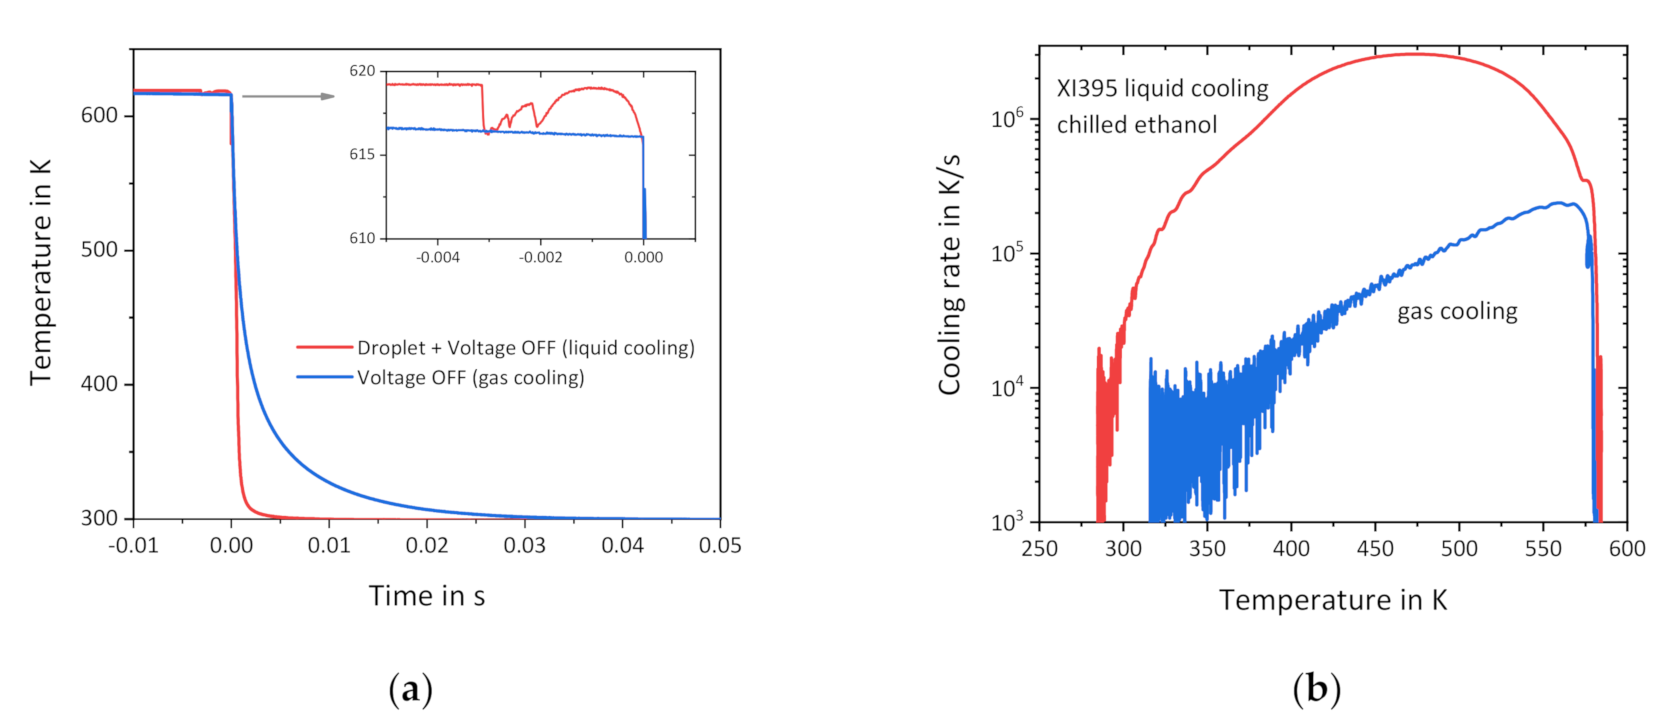
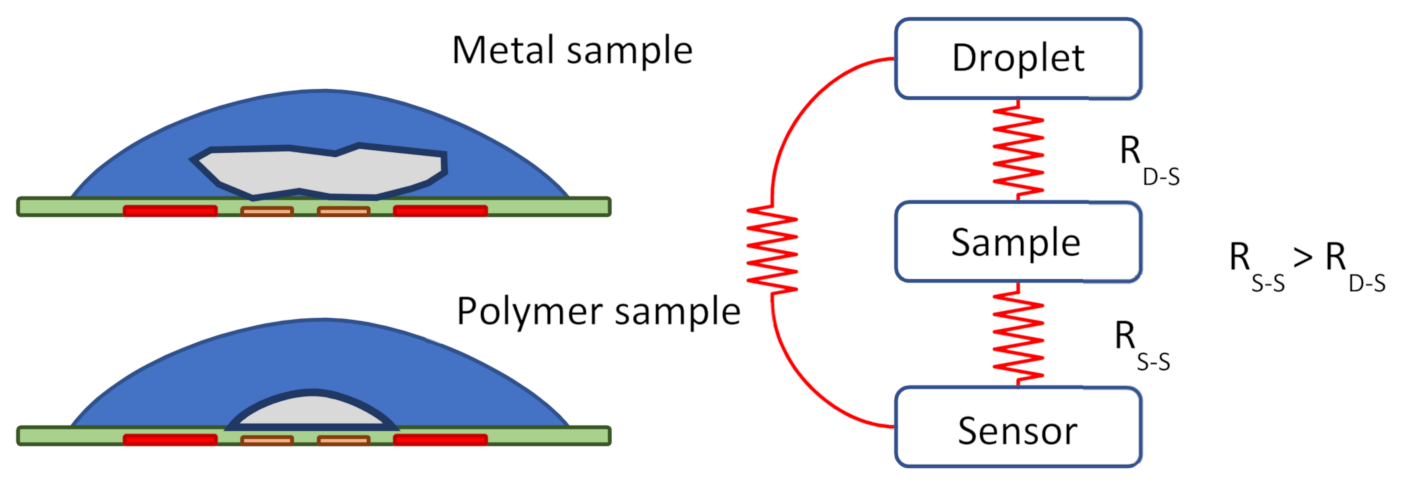
3.2. Liquid Cooling of Sensors with Samples

For a further test of liquid droplet cooling on the sensor, HDPE and indium samples were loaded on the sensor and cooled by room temperature ethanol droplets. Samples and cooling liquids were chosen such that any interaction between the solvent and the samples was excluded. Note that using a solvent for the polymer under study or a water-containing liquid for hygroscopic materials such as polyamides as cooling liquid is not possible. The efficiency improvement by liquid droplet cooling for sample-loaded sensors is less pronounced due to the larger heat capacity of the sample-sensor system and the low thermal conductivity of the polymer sample. Figure 9 shows HDPE (a) and indium (b) crystallization on the same sensor (XI395) using just heater voltage off switching (air cooling, black) and synchronized liquid droplet with voltage off cooling (liquid cooling, red).
Sample crystallization can be followed as an exothermic effect, resulting in a reduced cooling rate. From Figure 9, it can be seen that the HDPE crystallization temperature decreases with increasing measured cooling rate, while the indium crystallization onset is shifting towards higher temperatures due to faster cooling of the indium sample compared to the sensor membrane. An increase in cooling rate by more than one order of magnitude is achieved by using droplet cooling in both cases.
Delamination due to temperature gradient was also not observed, probably because of fast cooling of the membrane under the sample, comparable to the sample cooling itself.

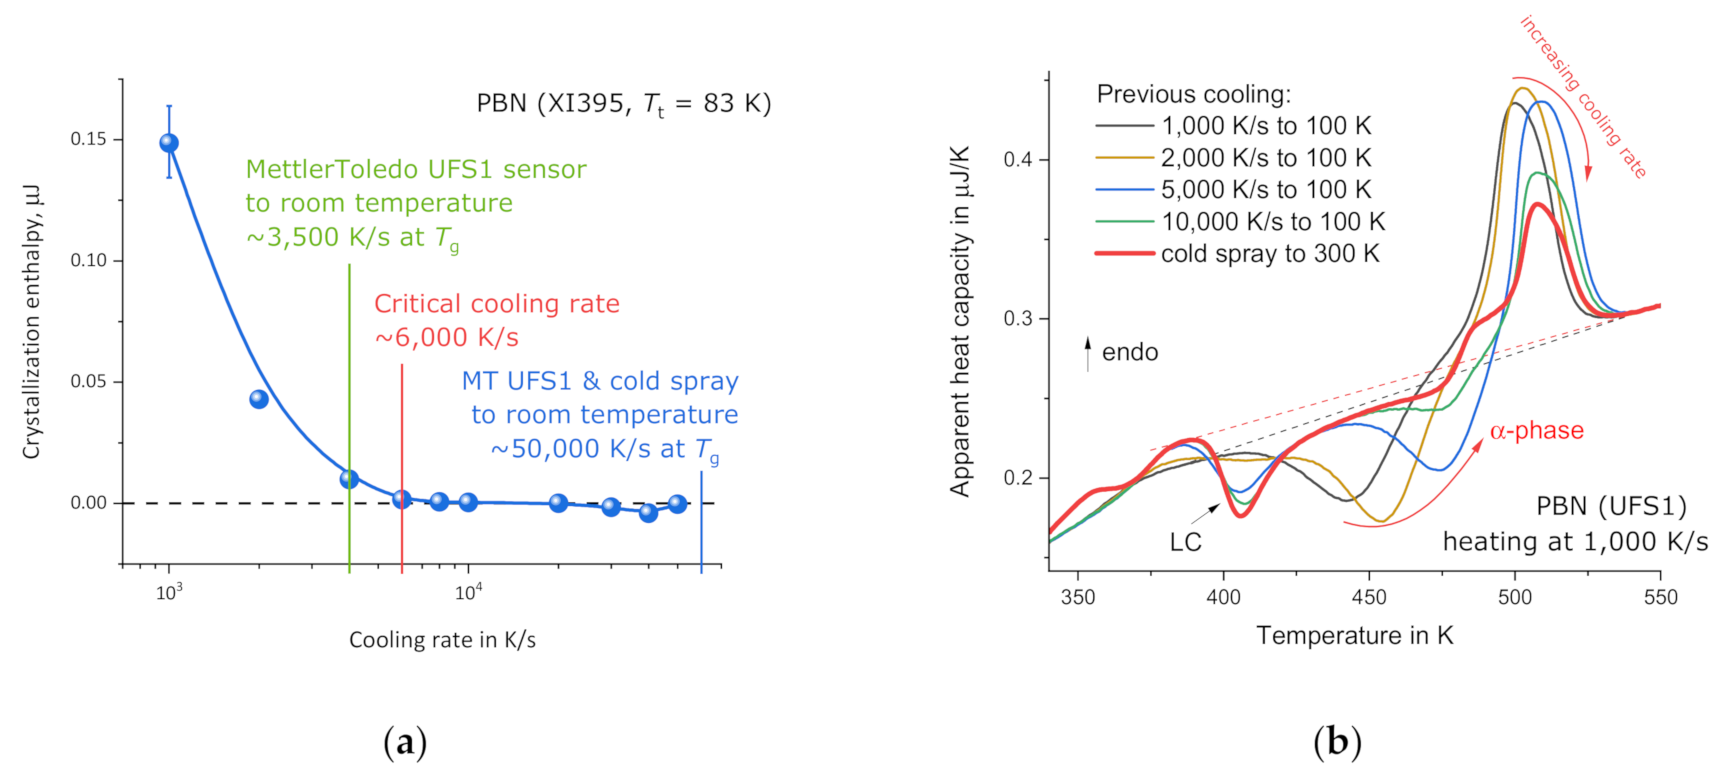
3.3. PBN Vitrification

The power of the droplet cooling is further demonstrated by reheating at 1000 K/s a relatively large PBN sample (ca. 150 ng) on the large Mettler Toledo UFS1 sensor. After liquid quenching, the remaining liquid was removed from the sample and the sensor by purging the sensor with dry nitrogen for 30 s. Unlike HDPE, the critical cooling rate for suppression of crystallization in PBN is only ca. 6000 K/s [35]. PBN is a thermoplastic material with a relatively high glass transition temperature of about 360 K. This gives the possibility of room-temperature studies of PBN by X-ray diffraction (XRD) [36], atomic force microscopy (AFM) [26] and optical microscopy [35]. With the Mettler Toledo optical sensor (XEN 39476-50 and -100, which are based on the UFS1 sensor, but have an optically transparent window of 50 and 100 µm diameter, respectively, in the center [37], the amount of material on the sensor is large enough to perform XRD and even FTIR measurements [38] after or during rapid thermal treatments. However, the cooling of this sensor in a room temperature environment, such as that usually used in combined devices, is limited by ballistic cooling and reaches a maximum of 3500 K/s at the glass transition temperature of PBN. Since the critical cooling rate is about 6000 K/s, obtaining an amorphous material for reference measurements and following crystallization at deep undercooling is impossible.
The cold-spray allows for quenching a relatively large sample on the Mettler Toledo Flash DSC UFS1 sensor, loaded with a large (150 ng) sample with a rate of at least 50,000 K/s in the region of the glass transition temperature, even at room temperature environment (Tt = 300 K). The reheating of the cold-spray-cooled PBN (red curve) compared to PBN quenched under a liquid nitrogen cooled environment is shown in Figure 10b and is discussed in the next section.

4. Discussion

Liquid droplet cooling with the sensor at room temperature conditions enhances the cooling rate compared to gas cooling by about two orders of magnitude. For the empty sensor XI395, comparable with the UFH1 sensor of Mettler Toledo, cooling rates of 5,000,000 K/s are achievable. The possibilities of liquid droplet cooling are further illustrated by experiments with indium, HDPE and PBN. HDPE quenching was done with varying the liquid droplet size, and the crystallization peak maximum temperatures versus cooling rate were compared to data measured earlier on different calorimeters (Figure 11) [31]. The range of cooling rates from 1000 to 1,000,000 K/s is covered by ultra-fast scanning calorimetry, using a combination of a small sensor (XI392, heated area 8 × 6 µm2), loaded with an ultra-small sample (ca. 1 ng) and using helium gas at 83 K as the heat transfer fluid. The new liquid droplet cooling technique (red stars) allows for measuring solidification of a 40 ng HDPE sample with the sensor at room temperature at rates up to 100,000 K/s. The crystallization temperatures are compared for the same cooling rate for a 40× smaller sample and with Tt = 83 K. The measured values of the crystallization temperatures of the HDPE at different cooling rates coincide with previously measured values within the error of the measurements. This confirms that the temperature of the thermopile represents the temperature of the sample, and there are no significant gradients evident in the large system at these rates.
A different situation is seen with the cooling of the indium particle (Figure 9b). The crystallization onset temperature of indium shifts unexpectedly towards higher temperatures with an increasing cooling rate. Crystallization of the indium particle occurs at the peak of the cooling performance. Due to comparable thermal contact resistances between sample, droplet and thermopiles, strong temperature gradients arise in the system, with details schematically shown in Figure 12. This is different for polymer samples, as polymers wet the sensor surface and have better thermal contact with the sensor. Thus, the measured higher onset temperature of the tiny indium sample indicates that the real temperature of the sample is lower than the thermopile temperature, which means the actual cooling rate is even faster than measured by the thermopile.
Further experiments with larger liquid droplets support this idea. The apparent increase in the crystallization onset temperature in the cooling curve is seen in Figure 9b, red and pink curves.
As shown in Figure 8a, the cooling rate can potentially be controlled using different droplet sizes. In all shown measurements, the droplet was significantly larger (about 100×) than the heated area of the sensor and the sample, but it is still possible to realize a rough control of the cooling rate. Further investigations in this direction are required. Additionally, limitations of the liquid droplet cooling by reducing the cooling rate caused by intense boiling of the cooling liquid, especially on sensors with the larger heated area, need to be prevented, e.g., by choosing a more suitable coolant.
The heating curves of PBN in Figure 10b can be interpreted following an analysis scheme provided previously [39], using the Mettler Toledo Flash DSC. Compared to [39], a higher maximum cooling rate was achieved with the same sensor, but by using it in combination with self-made FSC electronics [20,30]. PBN crystallization is a multi-step process involving the intermediate formation of a liquid-crystalline phase, transforming into crystals. With increasing cooling rate, first crystallization and then also liquid-crystal formation is suppressed; at even higher rates, crystal nucleation is also inhibited. Depending on the frozen-in state of the structure, when cooling to below the (similar) glass transition temperatures of the melt and the liquid-crystalline phase (around 370 K), on subsequent heating, formation of liquid crystals (slightly above Tg) and crystals from the liquid-crystalline phase are observed. More details, although not the subject of the present study, can be found in earlier works [40,41]. The strong cooling rate dependence shown in Figure 10b highlights the need for an extended cooling rate range, simultaneously with a detailed analysis of the consecutive heating scan at a constant, much lower scanning rate.

5. Conclusions

The implementation of liquid droplet cooling for fast scanning calorimetric sensors into the FSC hardware allows for enhanced cooling up to two orders of magnitude faster than with gas as the cooling medium. Significantly higher cooling rates can be achieved in the temperature region near ambient temperature. Experimental setups, combining FSC with other experimental techniques, are becoming feasible even under preferential external conditions such as room temperature and air or nitrogen as the purge gas.
Liquid droplet cooling at 105 K/s of a polyethylene sample of 40 ng became possible with Tt at room temperature. Achieving the same speed with gas cooling requires a 1 ng sample in a liquid nitrogen-cooled He environment. Using different cooling liquids and controlling the droplet size, it was possible to roughly control the maximum cooling rate. However, boiling of coolants, which reduced the cooling rate (Leidenfrost phenomenon), limits the application of droplet cooling in FSC. Further investigations in this direction and application of other coolants are needed.
The application of liquid droplet cooling in this work includes the vitrification of relatively large samples under conditions of limited gas temperature control, e.g., when the surrounding gas is at room temperature. The cooling rate, achieved with the droplet cooling technique at room temperature, recorded by the thermopile was ca. 50,000 K/s at the temperature of the glass transition of PBN, which is almost one order of magnitude faster than in the Mettler Toledo Flash DSC 1 with the same sensor with a cooling system and Tt = 180 K (5000 K/s) and 1.5 orders of magnitude faster than the same sensor when operated at room temperature environment (3500 K/s). Gas cooling of a sensor and sample of this size is only capable of making PBN fully amorphous (cooling faster than 6000 K/s) when used with a cooler at gas temperature Tt = 100 K and lower. Liquid cooling can quench large samples of PBN at rates up to 50,000 K/s at room temperature (Tt = 300 K), opening opportunities for combinations with other experimental techniques, such as XRD, FTIR, POM and AFM.

Author Contributions

Conceptualization, C.S. and E.Z.; methodology, E.Z.; software, E.Z.; validation, R.A., C.S. and D.Z.; investigation, E.Z.; resources, D.Z.; data curation, C.S.; writing—original draft preparation, J.J.; writing—review and editing, E.Z.; visualization, J.J.; supervision, C.S.; project administration, D.Z.; funding acquisition, J.J., D.Z. and C.S. All authors have read and agreed to the published version of the manuscript.

Funding

This research was funded by National Key R&D Program of China, grant number 2020YFA0711504, the National Natural Science Foundation of China, grant number 21790345 and 51673094, the German Science Foundation (DFG) priority program SPP2122, grant number ZH 661/3-1. And The APC was funded by University of Rostock.

Institutional Review Board Statement

Not applicable.

Informed Consent Statement

Not applicable.

Data Availability Statement

The datasets generated during and/or analyzed during the current study are available from the corresponding author on reasonable request.

Acknowledgments

This work was financially supported by National Key R&D Program of China (Grant No. 2020YFA0711504), the National Natural Science Foundation of China (No. 21790345, 51673094) and the Shenzhen Science and Technology Innovation Committee (JCYJ20200109150656717 and JCYJ20170818110613113). E.Z. acknowledges financial support by the German Science Foundation (DFG) priority program SPP 2122 (Project No. ZH 661/3-1). C.S. acknowledges financial support from the Ministry of Education and Science of the Russian Federation (Grant No. 14.Y26.31.0019).

Conflicts of Interest

The authors declare no conflict of interest.

References

  1. Yi, F.; LaVan, D.A. Nanocalorimetry: Exploring materials faster and smaller. Appl. Phys. Rev. 2019, 6, 031302. [Google Scholar] [CrossRef]
  2. Milkereit, B.; Reich, M.; Kessler, O. Detection of Quench Induced Precipitation in Al Alloys by Dilatometry. Mater. Sci. Forum 2016, 877, 147–152. [Google Scholar] [CrossRef]
  3. Zohrabyan, D.; Milkereit, B.; Shick, C.; Kessler, O. Continuous cooling precipitation diagram of high alloyed Al-Zn-Mg-Cu 7049A alloy. In Proceedings of the First Asian Conference on Aluminum Alloys, Beijing, China, 13–17 October 2013. [Google Scholar]
  4. Syazwan, M.; Sasaki, T. Rapid crystallization and mesophase formation of poly(L-lactic acid) during precipitation from a solution. e-Polymers 2018, 18, 331–337. [Google Scholar] [CrossRef]
  5. De Santis, F.; Adamovsky, S.; Titomanlio, A.G.; Schick, C. Scanning Nanocalorimetry at High Cooling Rate of Isotactic Polypropylene. Macromolecules 2006, 39, 2562–2567. [Google Scholar] [CrossRef]
  6. Minakov, A.A.; Schick, C. Ultrafast thermal processing and nanocalorimetry at heating and cooling rates up to 1MK/s. Rev. Sci. Instrum. 2007, 78, 073902. [Google Scholar] [CrossRef]
  7. Minakov, A.A.; Adamovsky, S.A.; Schick, C. Non-adiabatic thin-film (chip) nanocalorimetry. Thermochim. Acta 2005, 432, 177–185. [Google Scholar] [CrossRef]
  8. Xensor. Gas Nanocalorimeters. Available online: https://xensor.nl/images/pdf-files/nanogas3939.pdf (accessed on 15 April 2021).
  9. Minakov, A.A.; Van Herwaarden, A.; Wien, W.; Wurm, A.; Schick, C. Advanced nonadiabatic ultrafast nanocalorimetry and superheating phenomenon in linear polymers. Thermochim. Acta 2007, 461, 96–106. [Google Scholar] [CrossRef]
  10. Klement, W.; Willens, R.H.; Duwez, P.O.L. Non-crystalline Structure in Solidified Gold–Silicon Alloys. Nat. Cell Biol. 1960, 187, 869–870. [Google Scholar] [CrossRef]
  11. Liebermann, H.; Graham, C. Production of amorphous alloy ribbons and effects of apparatus parameters on ribbon dimensions. IEEE Trans. Magn. 1976, 12, 921–923. [Google Scholar] [CrossRef]
  12. Toda, A.; Taguchi, K.; Kono, G.; Nozaki, K. Crystallization and melting behaviors of poly(vinylidene fluoride) examined by fast-scan calorimetry: Hoffman-Weeks, Gibbs-Thomson and thermal Gibbs-Thomson plots. Polymer 2019, 169, 11–20. [Google Scholar] [CrossRef]
  13. Brucato, V.M.B.; De Santis, F.; Lamberti, G.; Titomanlio, G. A new method for on-line monitoring of non isothermal crystallization kinetics of polymers. Polym. Bull. 2002, 48, 207–212. [Google Scholar] [CrossRef]
  14. Zia, Q.; Androsch, R.; Radusch, H.-J.; Piccarolo, S. Morphology, reorganization and stability of mesomorphic nanocrystals in isotactic polypropylene. Polymer 2006, 47, 8163–8172. [Google Scholar] [CrossRef]
  15. Cavallo, D.; Gardella, L.; Alfonso, G.C.; Portale, G.; Balzano, L.; Androsch, R. Effect of cooling rate on the crystal/mesophase polymorphism of polyamide 6. Colloid Polym. Sci. 2011, 289, 1073–1079. [Google Scholar] [CrossRef]
  16. Mollova, A.; Androsch, R.; Mileva, D.; Gahleitner, M.; Funari, S.S. Crystallization of isotactic polypropylene containing beta-phase nucleating agent at rapid cooling. Eur. Polym. J. 2013, 49, 1057–1065. [Google Scholar] [CrossRef] [Green Version]
  17. Mileva, D.; Cavallo, D.; Gardella, L.; Alfonso, G.C.; Portale, G.; Balzano, L.; Androsch, R. In situ X-ray analysis of mesophase formation in random copolymers of propylene and 1-butene. Polym. Bull. 2011, 67, 497–510. [Google Scholar] [CrossRef]
  18. Toda, A.; Kojima, I.; Hikosaka, M. Melting Kinetics of Polymer Crystals with an Entropic Barrier. Macromolecules 2008, 41, 120–127. [Google Scholar] [CrossRef]
  19. Greer, A.L. Metallic Glasses. Science 1995, 267, 1947–1953. [Google Scholar] [CrossRef]
  20. Zhuravlev, E.; Schick, C. Fast scanning power compensated differential scanning nano-calorimeter: 2. Heat capacity analysis. Thermochim. Acta 2010, 505, 14–21. [Google Scholar] [CrossRef]
  21. Quick, C.; Schawe, J.; Uggowitzer, P.; Pogatscher, S. Measurement of specific heat capacity via fast scanning calorimetry—Accuracy and loss corrections. Thermochim. Acta 2019, 677, 12–20. [Google Scholar] [CrossRef]
  22. Cebe, P.; Partlow, B.P.; Kaplan, D.L.; Wurm, A.; Zhuravlev, E.; Schick, C. Using flash DSC for determining the liquid state heat capacity of silk fibroin. Thermochim. Acta 2015, 615, 8–14. [Google Scholar] [CrossRef] [Green Version]
  23. Bolmatenkov, D.N.; Yagofarov, M.I.; Mukhametzyanov, T.A.; Ziganshin, M.A.; Schick, C.; Solomonov, B.N. A new method for heat capacity determination in supercooled liquid state using fast scanning calorimetry: Thermochemical study of 9,9′-bifluorenyl. Thermochim. Acta 2020, 694, 178805. [Google Scholar] [CrossRef]
  24. Minakov, A.A.; Schick, C. Heat conduction in ultrafast thin-film nanocalorimetry. Thermochim. Acta 2016, 640, 42–51. [Google Scholar] [CrossRef]
  25. Baeten, D.; Mathot, V.B.F.; Pijpers, T.F.J.; Verkinderen, O.; Portale, G.; Van Puyvelde, P.; Goderis, B. Simultaneous Synchrotron WAXD and Fast Scanning (Chip) Calorimetry: On the (Isothermal) Crystallization of HDPE and PA11 at High Supercoolings and Cooling Rates up to 200 °C s−1. Macromol. Rapid Commun. 2015, 36, 1184–1191. [Google Scholar] [CrossRef] [PubMed]
  26. Zhang, R.; Zhuravlev, E.; Androsch, R.; Schick, C. Visualization of Polymer Crystallization by In Situ Combination of Atomic Force Microscopy and Fast Scanning Calorimetry. Polymers 2019, 11, 890. [Google Scholar] [CrossRef] [Green Version]
  27. Androsch, R.; Di Lorenzo, M.L.; Schick, C. Optical Microscopy to Study Crystal Nucleation in Polymers Using a Fast Scanning Chip Calorimeter for Precise Control of the Nucleation Pathway. Macromol. Chem. Phys. 2017, 219, 1700479. [Google Scholar] [CrossRef]
  28. Minakov, A.A.; Schick, C. Dynamics of the temperature distribution in ultra-fast thin-film calorimeter sensors. Thermochim. Acta 2015, 603, 205–217. [Google Scholar] [CrossRef]
  29. Schröter, C. Fast Droplet Cooling of Bulk Tellurium on a Chip Calorimeter. Master’s Thesis, Institute of Physics, Rostock University, Rostock, Germany, 2015. [Google Scholar]
  30. Zhuravlev, E.; Schick, C. Fast scanning power compensated differential scanning nano-calorimeter: 1. The device. Thermochim. Acta 2010, 505, 1–13. [Google Scholar] [CrossRef]
  31. Zhuravlev, E.; Madhavi, V.; Lustiger, A.; Androsch, R.; Schick, C. Crystallization of Polyethylene at Large Undercooling. ACS Macro Lett. 2016, 5, 365–370. [Google Scholar] [CrossRef]
  32. Bourque, A.J.; Locker, C.R.; Tsou, A.H.; Vadlamudi, M. Nucleation and mechanical enhancements in polyethylene-graphene nanoplate composites. Polymer 2016, 99, 263–272. [Google Scholar] [CrossRef]
  33. Minakov, A.; Morikawa, J.; Ryu, M.; Zhuravlev, E.; Schick, C. Variations of interfacial thermal conductance at melting and crystallization of an indium micro-particle in contact with a solid. Mater. Des. 2021, 201, 109475. [Google Scholar] [CrossRef]
  34. Beck, M.; Schmidt, C.; Ahrenberg, M.; Schick, C.; Kragl, U.; Keßler, O. The Ideal Quenching Medium?—Characterisation of Ionic Liquids for Heat Treatment of Metallic Components. HTM J. Heat Treat. Mater. 2013, 68, 214–223. [Google Scholar] [CrossRef]
  35. Ding, Q.; Soccio, M.; Lotti, N.; Cavallo, D.; Androsch, R. Melt Crystallization of Poly(butylene 2,6-naphthalate). Chin. J. Polym. Sci. 2019, 38, 311–322. [Google Scholar] [CrossRef]
  36. Konishi, T.; Nishida, K.; Matsuba, G.; Kanaya, T. Mesomorphic Phase of Poly(butylene-2,6-naphthalate). Macromolecules 2008, 41, 3157–3161. [Google Scholar] [CrossRef]
  37. Detailed Technical Information about FSC Chips Are Available by Xensor Integration®. 2015. Available online: https://xensor.nl/images/pdf-files/Calorimeter_chips/nanogas-opto-xen-39476.pdf (accessed on 15 April 2021).
  38. Anton, A.M.; Zhuravlev, E.; Kossack, W.; Andrianov, R.; Schick, C.; Kremer, F. Fingerprints of homogeneous nucleation and crystal growth in polyamide 66 as studied by combined infrared spectroscopy and fast scanning chip calorimetry. Colloid Polym. Sci. 2020, 298, 697–706. [Google Scholar] [CrossRef]
  39. Androsch, R.; Soccio, M.; Lotti, N.; Cavallo, D.; Schick, C. Cold-crystallization of poly(butylene 2,6-naphthalate) following Ostwald’s rule of stages. Thermochim. Acta 2018, 670, 71–75. [Google Scholar] [CrossRef]
  40. Zhuravlev, E.; Schmelzer, J.W.P.; Abyzov, A.S.; Fokin, V.M.; Androsch, R.; Schick, C.; Schmelzer, J.W.P. Experimental Test of Tammann’s Nuclei Development Approach in Crystallization of Macromolecules. Cryst. Growth Des. 2015, 15, 786–798. [Google Scholar] [CrossRef]
  41. Androsch, R.; Zhuravlev, E.; Schick, C. Solid-state reorganization, melting and melt-recrystallization of conformationally disordered crystals (α′-phase) of poly (l-lactic acid). Polymer 2014, 55, 4932–4941. [Google Scholar] [CrossRef]
Figure 1. Sensors of different sizes are used to cover a large range of scanning rates. Left to right: XI395, XI369, XI392 (all 500 nm thick), XEN394372b (250 nm thick) and Flash UFS1 sensor in the background (2000 nm thick) with polyethylene samples on them. Sensors are produced by Xensor Integration [8].
Applsci 11 03813 g001
Figure 2. Heating (top) and cooling (bottom) of a XI392 sensor at different programmed scan rates. The problem of ballistic cooling (Newtonian cooling) and its dependence on different gases is evident below 500 °C. The figure is reproduced with permission from [28], Copyright 2015, Elsevier.
Applsci 11 03813 g002
Figure 3. Methodology of liquid droplet cooling.
Applsci 11 03813 g003
Figure 4. Details of the droplet cooling step.
Applsci 11 03813 g004
Figure 5. Liquid droplet cooling realized as a part of the fast scanning calorimeter described in [30] Thermo-chim. Acta 2010.
Applsci 11 03813 g005
Figure 6. Cooling with liquid droplet and synchronous switching off the heater (red) and just switching off the heater in air (black). Temperature versus time (a) and cooling rate (b) for liquid cooling of XI395 sensor with chilled ethanol.
Applsci 11 03813 g006
Figure 7. The cooling efficiency of different cooling agents in linear (a) and logarithmic (b) scales on the sensor XI395 with a measuring area of 60 × 80 µm2.
Applsci 11 03813 g007
Figure 8. Influence of droplet size and sensor type: (a) sensor XI395, ethanol at room temperature, droplet size from ca. 1 to 200 µL, (b) different sensor size, cooled with 200 µL chilled ethanol (XI395 60 × 80 µm2 and UFS1 ø500 µm).
Applsci 11 03813 g008
Figure 9. HDPE (a) and indium (b) solidification in air and liquid cooling (ethanol) on the XI395 sensor at room conditions. Crystallization of HDPE at high cooling rates occurs very close to room temperature.
Applsci 11 03813 g009
Figure 10. Poly (butylene 2,6-naphthalate) (PBN) crystallization enthalpy as a function of cooling rate on the XI395 sensor under liquid nitrogen conditions (a). The maximum possible cooling rate at Tg when using the Mettler Toledo UFS1 sensor at room temperature is indicated by the vertical green line. The vertical red line corresponds to the critical cooling rate avoiding crystallization on cooling, and the vertical blue line provides the maximum cooling rate at Tg achieved by liquid droplet cooling. Fast scanning chip calorimetry (FSC)-reheating curves of PBN prepared as indicated in the legend, with the measurements done using the UFS1 in a self-designed calorimeter (b).
Applsci 11 03813 g010
Figure 11. Comparison of the cooling rate dependence of the crystallization peak maximum temperatures of HDPE, cooled using standard FSC with a smallest sensor at Tt = 83 K and with the droplet cooling on a medium-sized sensor at room temperature (Tt). The sensors are shown on the right.
Applsci 11 03813 g011
Figure 12. Temperature gradients in polymer vs. metal systems, caused by different thermal contact resistances at the interfaces involved. Thermal resistance between sensor, sample and droplet are designated RS-S and RD-S, respectively.
Applsci 11 03813 g012
Publisher’s Note: MDPI stays neutral with regard to jurisdictional claims in published maps and institutional affiliations.

