Abstract
Manufacturing industries are constantly identifying ways to automate machinery and processes to reduce waste and increase profits. Machines that were previously handled manually in non-standardized manners can now be automated. Converting non-digital records to digital formats is called digitization. Data that are analyzed or entered manually are subject to human error. Digitization can remove human error, when dealing with data, via automatic extraction and data conversion. This paper presents methodology to identify automation opportunities and eliminate manual processes via digitized data analyses. The method uses a hybrid combination of Lean Six Sigma (LSS), CRISP-DM framework, and “pre-automation” sequence, which address the gaps in each individual methodology and enable the identification and analysis of processes for optimization, in terms of automation. The results from the use case validates the novel methodology, reducing the implant manufacturing process cycle time by 3.76%, with a 4.48% increase in product output per day, as a result of identification and removal of manual steps based on capability studies. This work can guide manufacturing industries in automating manual production processes using data digitization.
1. Introduction
The manufacturing industry contributes to 15.39% of the global gross domestic product (GDP) and 22.8% of overall employment [1,2]; it also makes up more than 20% of the GDP in the EU [3]. Manufacturing output is growing as more machines are being installed on factory floors in order to maximize machine availability, and satisfy product quality, delivery, and cost demands for the customers [4]. Therefore, there is a drive to reduce operating costs and limit material and energy usage to ensure sustainability and profits. According to Fera et al. [5], companies can gain competitive advantages by focusing on the six competitive priorities: quality products and services, reliability, flexibility, speed, cost, and innovation. Quality is arguably the most important priority for sustaining business and maintaining customer satisfaction in such industries [6]. The key elements that impact a company’s decision to improve quality are: cost, risk management, firm size, and the cost implications of scraps [7].
Accurate dimensional specifications are required in complex and high-valued manufacturing industries [4]. Components that fall outside specification limits are rejected or reworked when possible. Rework costs can add wasteful elements to a process; such as material costs, labor hours, labor hour costs, and tool costs [8].
In 2018, 30.5% of the EU-27’s total energy consumption belonged to transport, 25.8% to the industrial sector, 2.9% to the agricultural sector, and 26.1% to the households sector. These stats included 27 countries of the European Union; rework contributed to 3–15% of economic losses [9,10]. Therefore, it is crucial to establish the main problems, causes, and actions to reduce defect levels. Defects can occur as a result of machine and human errors. Errors can be analyzed, systematically and accurately, by using data analyses methods. However, industries are still struggling to appropriately use data to minimize waste; thus, a systematic data-driven analysis method is required. Human error can be minimized by eliminating manual, non-value added steps, in order to standardize and automate processes via data analyses. This is described in detail in the following sections.
This work contributes to process automation by providing a methodology that (1) utilizes in-process digitized data for identifying processes to automate, and (2) automates previously unautomated parts of a process. There are methods available to improve processes (e.g., Lean and Six Sigma), data analytics (e.g., CRISP-DM), and process automation (such as robotic process automation). However, no validated method exists in literature to:
- Identify the manual complex process steps with the most potential of adding value when automated in terms of standardization and process improvement.
- Automate the identified steps in a complex manufacturing process via analysis of digitized data.
The process improvement method in this study does not solely rely on traditional Lean or Six Sigma alone, as these methods lack the capacity of processing Industry 4.0 data. The methodology outlined in this paper uses digitized data and a combination of process improvement techniques to identify and standardize processes to achieve automation. Section 2 of the paper details the different process improvement methods that were previously used in industries. Section 3 describes challenges faced in industries that are associated with process improvement and data analysis. Section 4 presents the methodology used to identify and solve existing problems in industries. Section 5 explains the implementation of the methodology. Section 6 and Section 7 discuss the implementation results and conclusion, respectively. Section 8 suggests future work in this area.
2. Literature Review
2.1. Data Driven Process Improvement
Many process improvement models were developed over the years for improving specific aspects in the manufacturing industry, based on the six competitive priorities above-mentioned. Models, such as total quality management (TQM), Lean manufacturing, Six Sigma, and Lean Six Sigma (LSS) are most widely known for process improvement [11].
Lean was a systematic concept introduced by Toyota in the 1950s after World War II; it was labelled as Lean manufacturing in 1990, in a book by Womack, Jones, and Roos [12]. It was the more common process improvement model adopted by industries for reducing waste and improving processes. Eliminating waste allows reducing process cycle time [13]. Cycle time is defined as the total time taken by the component in the production cycle [14]. Reducing cycle time will increase overall product output and ensure that customer demand is met.
Six Sigma was first developed in 1986 by Motorola [15]. It uses statistical means to produce high-quality products by reducing process variation [16]. The aim of Six Sigma is to maintain a defect rate of below 3.4 defective parts per million for a process. This means that 99.99% of the process output will consist of fault-free good parts. Reduction in defective parts will reduce the cost of non-conformance and energy consumption. Two methodologies can be applied in Six Sigma: DMAIC for improving existing process and DMADV for developing a new improved process [12]. Al Kindi and Abbas [7] stated that large companies have benefited (i.e., profit increasing) by implementing Six Sigma, which is a tool used by organizations to minimize process variation and eliminate waste. With the implementation of Six Sigma, it is possible to determine the critical factors, the optimal operating levels or tolerances, and other improvement opportunities [7]. Six Sigma was used to reduce electrical defects in a circuit cartridge manufacturing plant [17]. It was also used to improve product dents in forging plants [16]. Chaudhary [18] used Six Sigma to improve the heat treatment process and hardness quality of tools and dies. Safwat and Ezzat [19] decreased the scrap rate in a plastic injection molding plant by using the Six Sigma methodology. IT departments have also benefited from using Six Sigma by reducing customer support issues [20]. Tchidi and He [21] investigated the existing problems in a software industry and proposed the improved engineering process improvement model (using an engineering design process called Design for Six Sigma). A corrugated box manufacturing company reduced 22.7% of its waste by applying the DMAIC Six Sigma framework [22]. Implementation of Six Sigma in automobile industries and thermal power plants have also shown positive outcomes [23,24]. Table 1 summarizes the methodologies described in various research publications on the subject.

Table 1.
Summary of literature review in application of Lean Six Sigma and its tools in industries.
Lean Six Sigma (LSS) has also been used in equipment maintenance in industries for quality management and process optimization [13,30]. Thomas et al. [25] successfully reduced non-value-added activities and delivery time by implementing LSS in the aerospace industry. Lean and Six Sigma were previously used in conjunction because Six Sigma uses statistical means to improve the process and Lean focuses on value stream mapping (VSM) for reducing waste and non-value-added operations [31]. Lean was also used with robotic process automation (RPA) in literature for process improvement, in terms of automation [29]. RPA is defined as a category of software tools that allows repeated or routine actions to be automated using structured data, rules, or logged interactions [32,33]. Therefore, the identification of automation opportunities using RPA is very limited. The Lean strategy helped identify the action to be automated in this study [29].
2.2. ‘Continuous’ Process Improvement
The Lean and Six Sigma concepts, when used together, can enhance the performance of industrial products, better than when each concept is individually implemented [34]. However, these models typically use manual methods of data collection, where automated collection is not available, to drive decision-making, with a view of making improvements. Thus, data are not available in automated ways to enable ‘continuous’ process improvements. Collection of these data could allow a kind of continuous Lean Six Sigma loop to be put in place. The manual data collections and analyses that the process improvement mechanisms are heavily reliant on are subject to human errors. Several researchers have conducted studies on assessing human reliability in industries; it was concluded that errors resulting from incorrect operator actions accounted for around 20–40% of the defects, on average [35]. This is because factors, such as time, machine design, and stress on factory floors can impact perception, information-processing, and actions of the operators [36]. Havlikova, Jirgl, and Bradac [36] highlighted significant operator errors, include misreading information, incorrect data collection, failed or delayed response, leaving out important steps, and incorrect diagnoses or decision-making. The variabilities associated with human errors make production processes less standard. Heinrich and Deutschländer [37] described standardization as a key step to optimize the process and achieve automation. A process can only be automated once all of the variations that compromise a standard process (e.g., manual interaction, decision-making, etc.) have been eliminated. One way to potentially overcome the human–machine interaction issues is through the implementation of Industry 4.0 [38].
2.3. Tacit Knowledge and Digitization
Industry 4.0 is the fourth industrial revolution in manufacturing, where machines are integrated with each other, and are capable of monitoring processes and making smart decisions using training data autonomously [39,40]. Thus, standardizing the processes by reducing human error variabilities. One key feature of Industry 4.0 is decentralized production, where all machines are connected to the cloud, allowing data to be accessed from a secured line for fault analysis and data-driven decision-making [41]. However, collecting and storing data are challenges due to non-interoperability of machines and tools [42,43]. Deriving and sharing useful knowledge from the dataset for optimizing processes still poses as a challenge for industries as production data are usually inconsistent [44]. Implementing advanced functions, such as fault diagnosis, fast recovery, and fast reconfiguration of the machine parameters to adapt to production changes, increases the complexity of automatic machines, requiring technical understanding. The rise in complexity will require highly-educated and well-informed workers [45]. Proprietary communication protocols also need to be maintained. Data formats need to be unified to allow data to be shared across different levels of manufacturing without information being lost [46]. Villagran [47] explained that there are several issues that hinder standardization, which is crucial for fully transitioning to Industry 4.0. For instance, it is difficult to create a common language for all interconnected platforms for data exchange. The existing standards developed for Industry 4.0 may not be applicable to all systems; new or modified standards are required in such cases. Data exchange between platforms require secured lines to protect the privacy of businesses. More importantly, there is a lack of data availability for effective decision-making in the manufacturing sector, because acquiring data related to machine faults for monitoring the degradation progress is very challenging, and impossible in certain scenarios [48]. One study explained that the absence of detailed and functional computer numerical control (CNC) databases compels operators to select suitable machining parameters based on tacit knowledge [46]. Tacit knowledge is defined as the valuable heuristic knowledge accumulated by the operator over years of experience [49]. However, studies have shown that sharing tacit knowledge is difficult due to the knowledge gap and the terminologies used between workers from different roles and experience levels. For instance, process engineers might face difficulty in fully understanding a data analyst and vice versa. Decision-making becomes mentally exhaustive to a skilled, knowledgeable worker, because tacit knowledge is not properly defined [50]. The machining parameters are adjusted using tacit knowledge and tested during the first-off inspections (which are wasteful, in terms of time and resources) [46]. First-off inspections are conducted when machine configuration is changed between production batches, to check whether the first part that is machined is correct. It is then assumed that the rest of the parts in the batch will be machined correctly. If the correct specification on the part is not achieved, then the machine configuration is adjusted. This is to prevent a batch of faulty parts from being produced, which can have a significant impact on revenue (i.e., reducing scrap reduces material loss and energy consumption) [51]. Processes in industries are still controlled and constantly supervised by people, leading to inefficiencies; thus, indicating that industries are far from making processes completely autonomous [52,53]. If such issues with machine interoperability, data availability, non-automated production lines, etc., could be improved, then lights-out manufacturing is possible without human supervision, where machines can manufacture products without lights and operators [54].
One method to assist users would be to enable machines to perform the value-adding decision-making automatically, with the aid of data. Petrillo et al. (2018) explained that digitization and automation are essential components of Industry 4.0, which can enable machines to be intelligent [54,55]. ‘Intelligent’ machines use cutting-edge technologies, such as advanced digital systems, networked control systems, or machine learning algorithms, to auto-correct themselves, and run on their own systems via self-made decisions [56]. Data digitization allows data collection, which was previously manually collected, and data mining affects the quality of products in industries, by either detecting faults in the production process or by predicting a fail; thus, minimizing waste using digitized data [44]. Minimizing energy consumption and cost of production It can help in adding value to the process [56,57,58]. Digitization can also identify useful information from the data and facilitate in automating process steps.
Rule-based expert systems for decision-making can be developed using tacit knowledge in absence of historical data [59]. For instance, the authors developed an adaptive expert system in an earlier study that automatically made CNC tool adjustments based on a digitized coordinate measuring machine (CMM) and CNC data [60]. The expert system acted as a bridge between the CMM and CNC machines to allow continuous data sharing and processing; therefore, automating data collection and standardizing the decision-making process by eliminating manual tool adjustment. This helped in eliminating one aspect of the manual interaction during the production process. In order to achieve a more standardized and automated manufacturing process, more non-value added tasks need to be identified and eliminated using the newly digitized data.
2.4. Proposed Problem Statement and Research
Automation is a key aspect of Industry 4.0, which is still very challenging for some industries to adopt [61]. This is because full automation across the factory floor requires interconnected machines, reliable communication lines, data collection from multiple sensors, standardized processes, expert knowledge, and skills to tackle the increased complexity, etc. Standardization can address the interoperability issues in machines and data [43,62]. There was a direct correlation observed between the degree of standardization and the RPA usage in a process in organizations [63]. Geyer-Klingeberg et al. [64] presents an overview of how process mining and RPA has benefitted industries where RPA automates the tasks that are highly repetitive and error free, since processes are required to be simplified and standardized before RPA can be applied. One study [65] presented an overview of the implementation of RPA and described that the function of the RPA needs to be specified, as software robots are data-related, integration-related, or process-related. The data-related function allows data transfer, formatting, and analysis, while the integration-related function ensures connection and control between different machines and processes. The process-related function facilitates event triggers and control. The key RPA skills are listed as, collect and collate information; validate; record data; calculate and generate results; plan; transport and connect; and report. Depending on the level of human interaction to maintain with the process, RPA applications can be of three types—attended (performs alongside human), unattended (performs without human interaction), and hybrid (can perform with or without human) [66]. Researchers are investigating tools and approaches to identify automation opportunities, as the field is still nascent. This is explained by the low volume of application and adoption of RPA [67]. The adopted RPA have limited and specific functionalities, such as customer service and risk assessment [33]. To address this issue, the authors in [68] proposed a methodology to identify the level of automation (manual, hybrid or automated) of an existing task from textual description via supervised machine learning. The limitation of this study was the reliability of the proposed RPA approach. Further testing and real-world implementation were suggested to validate the approach. Dey and Das [69] reviewed the motivation and challenges in adopting RPA and found that, despite the benefits gained from successful RPA implementation, most companies are not adopting RPA because the compatibility and integration of RPA tools for the IT sector are still not understood clearly. Another study [32] presented the basic concept and challenges involved in a pipeline robotic process mining (RPM) tool. It was explained in this study that there is a risk of identifying partially automated tasks for full automation, in certain cases, because the robotic software is incapable of determining the partially automated task with the given input data. The information or data to identify potential tasks to automate requires cleaning to improve the accuracy of the process discovery algorithm, as explained by the study conducted by [70] on emerging trends in RPA. The European Commission [43] stated that the data currently available in industries for re-use are limited. This indicates that data are processed manually because collecting, processing, and storing data are still challenging. Rule-based, knowledge-based, and learning-based software robots use predefined rules, information search, and machine learning techniques, respectively, to analyze given data in RPA [63]. Rule-based software robots are mostly used compared to the other two. As the complexity of the process increases, RPA adoption decreases. Therefore, RPA adoption for industrial manufacturing processes is not common due to the complex nature of the processes [63]. Kumar and Prasad [71] listed the examples of common RPA applications as data entry or information retrieval, automatic e-mail response, user registration, identity verification, and processing of customer orders and payment.
Data digitization can aid in automating process steps in Industry 4.0. Heinrich and Deutschländer [37] listed the steps required to automate an industrial process and referred to it as a “pre automation” sequence, which includes:
- Step 1—Stabilization.
- Step 2—Standardization.
- Step 3—Optimization.
- Step 4—Automation.
However, the “pre-automation” sequence method cannot assist in identifying areas where improvement is required, and it does not describe the tools used in each step in detail. It is important to note that no detailed step-by-step guidelines were found in literature for both identifying and transitioning manual operations to full automation using digitized data. Other existing techniques can be utilized in combination with the “pre-automation” sequence to add more structure to the framework. By coupling industry 4.0 capabilities with Lean and Six Sigma methodologies, further improvements could potentially result in standardizing and fully automating the production process because the purpose of Lean and Six Sigma is to reduce waste or non-value added steps, which in turn will reduce manual interactions and make the process more automated. Lean and Six Sigma principles have been used in businesses and academia for many years. However, the traditional Six Sigma method alone may be restrictive or inapplicable for some problem scenarios. For example, traditional Six Sigma alone is unsuitable in an Industry 4.0 setting because of the noisy in-process data produced from complex technologies [72]. Digitization of data produces large quantities of unorganized data, which can be difficult and time consuming to analyze manually. The Lean and Six Sigma implementations listed in Table 1 in Section 2.1 were specific to particular issues in their respective industries with no automation intention [16,17,18,19,20,21,22,23,24,25,26,27,28]. The Strategic Lean Six Sigma Framework proposed to reduce build time in an aerospace industry that required validation from new areas within the industry [25]. The authors in [27] used Six Sigma and measure–validate–predict (MVP) to predict faults using alert notifications. However, the methodology used was unclear as no detailed description was provided. The interactions between all of the variables affecting the process makes it difficult to use the traditional Six Sigma method alone; it is important to understand the process to identify problems and offer suggestions for improvements [73]. In contrast to digitized data, the traditional Lean Six Sigma data contain clean data of the required variables that can be measured manually. Digitized data require pre-processing prior to analyses because such large datasets can contain data from multiple variables, and only relevant variables are selected for analysis [74]. Therefore, the Cross-Industry Standard Process for Data Mining (CRISP-DM) framework was utilized in literature for data mining [28,75]. Numerous studies have shown that modifying the phases of Six Sigma methodologies or integrating data mining techniques with the traditional Six Sigma methodology can customize the process improvement method to cater to a specific problem and provide better outcome for the study [21,25,27,28]. While Lean Six Sigma can help in providing tools to be used for identifying and analyzing problem areas [76] prior to the “pre-automation” sequence, data mining techniques can guide in handling digitized data for process optimization. Combining the techniques can allow the researcher to customize the phases of the techniques, and the use of the process improvement tools based on what the study requires. For example, one study reported that the number of defects were only reduced in the software industry with the help of Six Sigma alone, but it failed to effectively eliminate them [21]. Another study reported that the data-mining technique CRISP-DM lacks a detailed method description in literature and existing quality management tools can be utilized for process improvement. It was also noted in that study that data mining was more capable at handling a large dataset and analyzing the unknown parameters than Six Sigma [75]. According to Lugert, Batz, and Winkler [77], integrating Lean thinking with Industry 4.0 presents a far better framework to reduce waste and improve processes than Lean methodology alone. As explained earlier in Section 2.1, Lean can be combined with RPA for automating tasks in a process since the automation opportunities discovery using RPA is very limited and the Lean strategy has helped in identifying the action to be automated. However, RPA can only be applied to repetitive tasks that run 24/7 in the background [29]. Table 2 summarizes the advantages and the gap in each of the methodologies described in this paper.
Table 2.
Methodology comparison.
The authors of this paper created a novel methodology to assist decision-making in selecting the optimal combination of methodologies to use for process improvement in a data-rich environment. This is shown in Figure 1. Priority was given to the goals and data availability to select the appropriate methodologies.
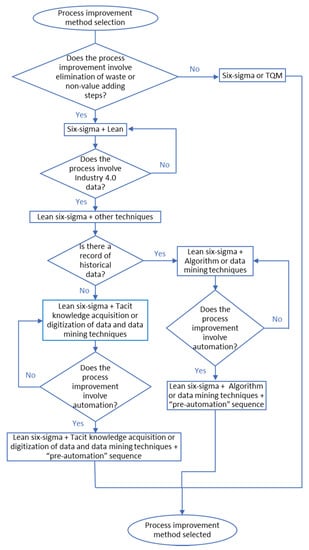
Figure 1.
Process improvement methodology selection flowchart.
Since the aim of this study is to automate the medical device manufacturing process used as a case study by analyzing digitized data, the LSS, CRISP-DM, and the “pre-automation” sequence methodologies were selected from the flowchart in Figure 1. The manufacturing process was standardized by using digitized data that was previously manually or not collected at all and automated by removing the problems associated with non-standardized complex decision-making and operations, and human error in data collection and analysis. The combined method proposed adds Industry 4.0 and digitization capabilities to LSS, while adding structure to the existing CRISP-DM methodology via LSS. The “pre-automation” sequence also adds an automation framework to LSS and CRISP-DM, while LSS and CRISP-DM adds a defined structure to process digitized data for analysis in the “pre-automation” sequence. The proposed methodology also addresses the gaps in RPA implementation, as described in the literature, in terms of automation opportunity identification, by providing an alternative method to identify processes and automate them.
3. Methodology
The proposed methodology derived from the novel flowchart uses combined steps from the LSS, CRISP-DM, and the “pre-automation” sequence to find and solve problems related to automation in an industrial process. The novel flowchart enables selection and customization of the required steps used for improving or automating a chosen process. The combined methodology bridges the gaps in individual techniques to allow better understanding and analysis of processes and its data. The general order of the steps that can be used in the integrated methodology chosen from the flowchart is shown in Figure 2, which shows the three basic phases involved in optimizing processes. The combination of the methodologies described, and the order of the steps used in each phase, are other novel aspects of this study, as no other study has outlined the positioning of the steps in the overall methodology to this detail.
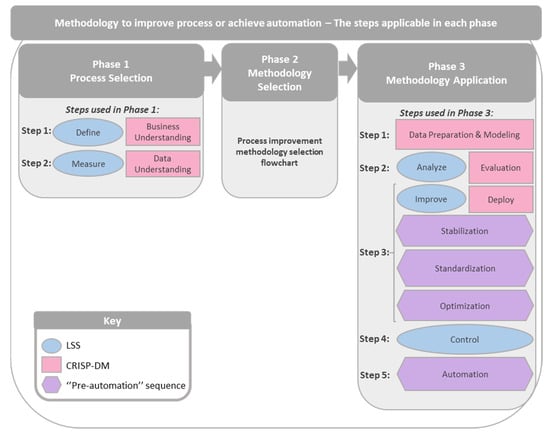
Figure 2.
Methodology to achieve automation—the steps applicable in each phase.
The methodology is outlined in detail below, in three phases, with the following steps,
- Phase 1—Process Selection for Improvement
- 1.
- Define and business understanding—it is crucial to understand the problems in the current business and recognize useful data. A project charter can then be created as a quality management tool in CRISP-DM to set a clear scope for this study.
- 2.
- Measure and data understanding—this step involves mapping out the processes and listing the critical processes based on scrap history or operational records.
- Phase 2—Methodology Selection for Process Improvement Based on Flowchart
- Phase 2 involves selection of a combination of methodologies to use for process improvement in a data-rich environment using the novel flowchart shown in Figure 1.
- Phase 3—Selected Methodology Application
- 3.
- Data preparation and modeling—if Industry 4.0 data are used for process improvement, then the raw data might require some pre-processing such as filtering, cleaning or data transformation. This step was adopted from the CRISP-DM methodology since LSS cannot assist with Industry 4.0 data.
- 4.
- Analyze and evaluation—this step is used to conduct test for process capability and root cause identification.
- 5.
- Improve and deploy/stabilization/standardization/optimization—once the issues have been identified from step 2, the suggestions for improvement are provided in this step. The tasks that require user management or any causes of instabilities are removed for stabilization. Any modification of equipment, tasks, or processes that allow the task or process to perform or function automatically facilitates standardization of the process. This step also involves an evaluation of the improved task or process for optimization.
- 6.
- Control—this step involves continued process verification.
- 7.
- Automation—if the process requires new hardware connections as improvements, and then the connections are integrated in this step.
The steps used from the Six Sigma methodology are: define, measure, analyze, improve, and control. Each step requires thorough knowledge analysis and several tools are available to analyze process metrics [53]. The Lean tools are designed to remove wasteful steps from the process. The steps for LSS are data driven where prioritized parameters are used in statistical analysis [75]. These data for LSS traditionally lean on both automated data collection and human centric data collection. The digitization of currently manually collected data could offer further efficiency gains and streamline the DMAIC process further to answer the research question,
“Can digitized CNC and CMM data be used to identify, reduce or remove manual non-value added interactions from a medical device manufacturing process using the “pre-automation” sequence, LSS and CRISP-DM methodology to automate and improve the process?”
The phases in the CRISP-DM framework are shown in Figure 3 [78].
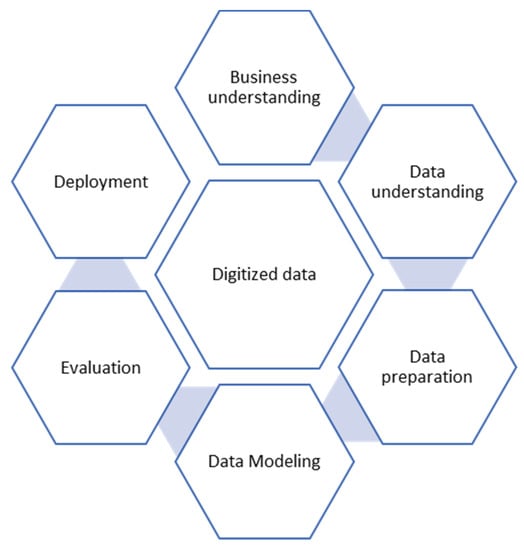
Figure 3.
Phases in the CRISP-DM framework.
Integrating CRISP-DM with Lean Six Sigma methodology adds more structure to the Six Sigma methodology, in obtaining more accurate results from large datasets [28]. An expert system was developed for a process on the factory floor as a part of previous research using tacit knowledge. An adaptive system that served as a communication bridge using MTConnect between CNC and CMM was developed during this research work [60]. MTConnect is a standard communication protocol that recently gained popularity, since its first release in 2008, for open exchange of data between two machines using a network connection [79]. As part of the expert system development, MTConnect was installed that can retrieve CNC tool data and CMM data directly from the machines; it allowed the steady flow of digitized data to be recorded for analysis. However, the usability of these data depended on data preparation, which included data selection, cleaning, classification, and formatting. Once the data were analyzed, the “pre-automation” sequence steps (stabilization, standardization, optimization, and automation) was integrated with the LSS and CRISP-DM methodologies to add more structure around the automation output aspect of this study by.
In summary, the integration of the DMAIC method in LSS, CRISP-DM, and the “pre-automation” sequence was proposed to analyze and interpret digitized data to find effective ways to improve the current process by reducing manual operation and waste [75].
4. Case Study Description
This study focused on a medical device company dedicated to the production of knee, hip, and shoulder implants, where Lean and Six Sigma was used for many years, and achieved good results in this regard. The manufacturing plant in this study faced issues, such as non-standard processes and complex manual-based decision-making that could have resulted in a high waste volume on the production line. These challenges were considered when outlining the proposed methodology to find potential areas where the highest waste occurred due to non-standard ways, and used data-centric approaches to solve and automate the solution via standardization. CNC and CMM constituted the majority of the machines on the manufacturing floor. The implant parts were measured in the CMM after being machined in the CNC machine to check whether the dimensional accuracy of the implant was acceptable. Digitization allowed collection of previously untapped data from CNC and CMM via MTConnect for data mining, adding value to the production process. LSS and CRISP-DM allowed the newly digitized data to be analyzed for identifying areas of improvement in the production process and the “pre-automation” sequence provided guidelines to achieve an automated process. A process map of the current and digitized state is shown in Figure 4.
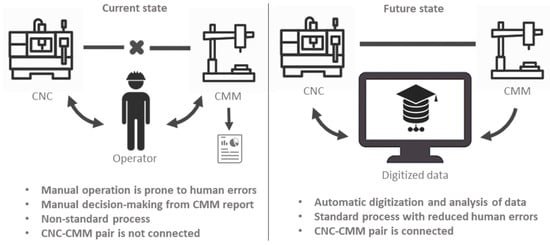
Figure 4.
Process map—current and future states.
5. Implementation
The proposed methodology was applied to the use case in a real manufacturing environment. Details of the implementation are described in the following phases.
5.1. Phase 1—Process Selection for Improvement
The breakdown of the steps involved in Phase 1 is summarized in Figure 5 and the implementation is discussed in detail in the subsections below.
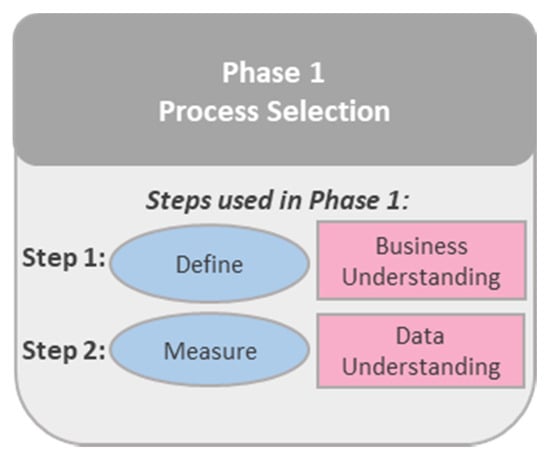
Figure 5.
Combined methodology—Phase 1.
5.1.1. Define and Business Understanding
In this phase, a detailed description of the problems with the current business was required to identify manual steps in a process, and implement solutions for machining operations. Waste can be reduced if the dimensional accuracy of the part is maintained perfectly. This would mean that the machine and the tools would always have to be in perfect order. Botsaris and Tsanakas [80] described tool failure as responsible for 20% of the sudden disruption during manufacturing; thus, leading to revenue losses and decreased productivity. Two types of faults were discussed in Botsaris and Tsanakas’ [80] research that caused tool failure: hard and soft faults. Hard faults are unpredictable and abruptly halt the production process, e.g., tool breakage, whereas soft faults occur gradually over a period, such as tool wear. In this study, indications of both soft and hard faults have been traced in the data and their associations with scrap rates were analyzed. A project charter is shown in Table 3. Tools, such as Ishikawa diagram, flow diagram, histogram, Pareto chart, scatter diagram, control charts, and trend chart are used in literature for process improvement in Six Sigma and CRISP-DM [34]. The primary objective of this study is to optimize the machining process using data digitization and Six Sigma.
Table 3.
Project charter.
5.1.2. Measure and Data Understanding
In this phase, the current operations involved in manufacturing a medical implant were mapped and measured to detect potential areas for improvement. Figure 6 illustrates the process map for the manufacturing operation.
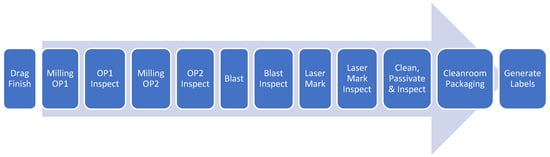
Figure 6.
Process flowchart.
Scrap history over 9 months was collected for targeting the operation with the lowest performance for improvement. The source of this scrap data were available in manual scrap records. The operation with the highest scrap rate from the Pareto chart in Figure 7 was then selected for further analysis.
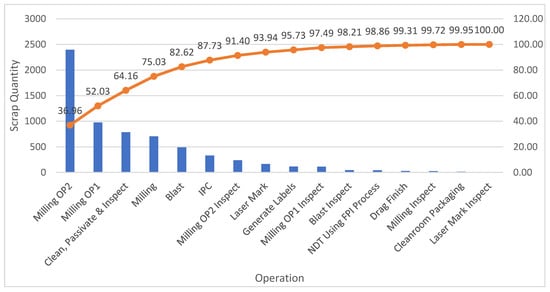
Figure 7.
Pareto chart of operational scrap.
Milling operation 2, which involved the CNC–CMM pair, had the highest percentage of scrap (36.96%). The total cycle time for this operation was 314 min/batch. The daily target output from this operation was 67 parts/day.
A focus group with engineers and operators was organized to discuss the causes of scrap, which is primarily tool variation. Key factors that contributed towards scrap were identified from scrap history for milling operation 2 and illustrated in the Ishikawa diagram in Figure 8, which presents the relationship between the causes of scrap and the effect.
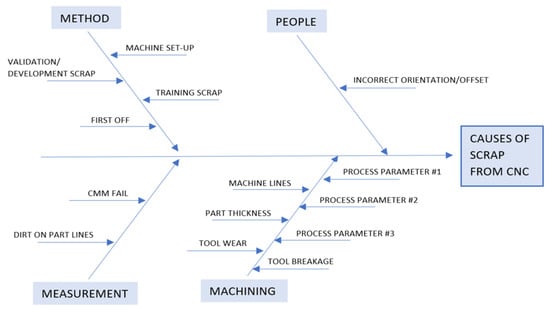
Figure 8.
Ishikawa diagram of scrap causes.
A Pareto chart of the causes of scrap in milling operation 2 was plotted to identify the most significant factor that was responsible for the highest number of scraps (Figure 9).
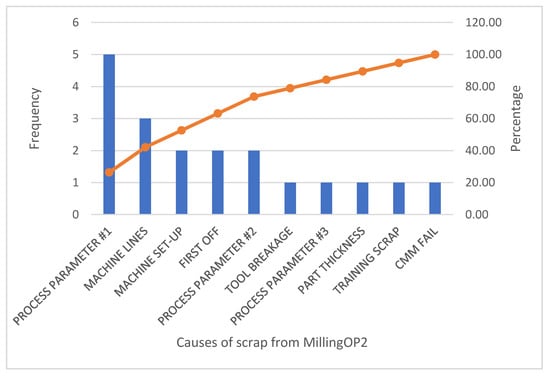
Figure 9.
Pareto chart of causes of scrap in CNC–CMM.
It was observed that the highest percentage of scrap detected was due to process parameter #1 (26.31%), and scraps resulting from the failed dimensional profile of the machined part can be caused by misaligned or damaged CNC tools. Therefore, it was critical to check which tools had significant contribution to the scrap rate. An observational study was conducted for one shift to monitor the milling operation 2 process. The CNC tools were then mapped to the related dimensions of the part measured on the CMM, shown in Table 4. The dimensions on the medical implants were referred to as DIM.
Table 4.
Tool map.
From the observational study, an Ishikawa diagram was used to highlight all the manual actions in milling operation 2, as shown in Figure 10. Reducing manual operations will reduce scrap that results from product mishandling while making the process more automated. It was noticed that first-off inspection included all the major manual steps, i.e., visual inspection, product movement, documentation, and system setup. First-off inspection is required in industries to ensure that the process setup is in order for production operations.
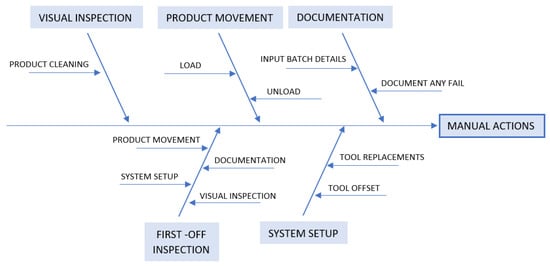
Figure 10.
Ishikawa diagram of manual actions in milling operation 2.
However, the amount of scrap produced from milling operation 2 was insignificant compared to the total product output. This indicated that the process was stable and did not require a first-off inspection step. Thorough analysis was required to confirm process stability in order to remove first-off inspection from milling operation 2. Previous work in this area involved developing a decision-making expert system using tacit knowledge that can make automatic CNC tool adjustments [60]. The expert system allowed CNC and CMM data to be captured and used in tool adjustment decisions, which was one-step forward in automating milling operation 2. This newly digitized CNC–CMM data can allow this process to be automated through,
- Investigation of the process parameter #1 caused by CNC tools.
- Analysis of the stability of the process to remove first-off inspection.
5.2. Phase 2—Methodology Selection for Process Improvement Based on Flowchart
The focus of this study was to identify and automate a selected process with an emphasis on the use of digitized data. The steps from the novel process selection flowchart (Figure 11) indicated that using digitized CNC–CMM data meant that the CRISP-DM methodology sequence needed to be used in conjunction with LSS and the “pre-automation” sequence was required to meet the automation objective. The traditional Six Sigma method alone was not capable of handling this newly tapped digitized data that was previously documented manually, thus adding great value to the study. The path taken in the flowchart in Phase 2 is highlighted in Figure 11.
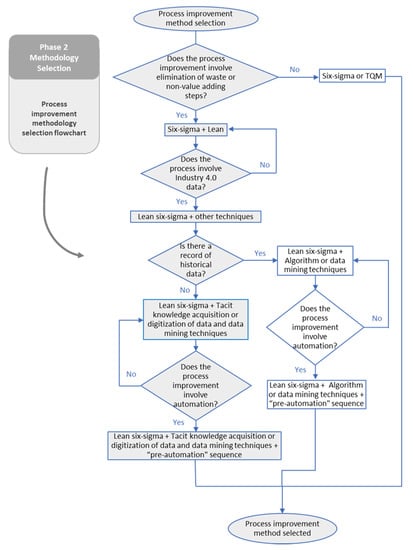
Figure 11.
Combined methodology—Phase 2.
5.3. Phase 3—Selected Methodology Application
The breakdown of the steps involved in Phase 3 is summarized in Figure 12 and the implementation is discussed in detail in the subsections below.
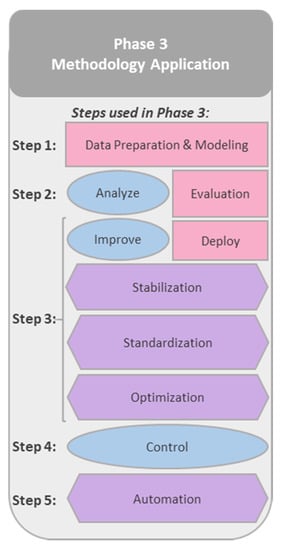
Figure 12.
Combined methodology—Phase 3.
5.3.1. Data Preparation and Modeling/Analyze/Evaluation
The root cause of the problem in milling operation 2 and process stability was analyzed in this phase. The data on tool wear and drift were obtained from a newly developed CNC–CMM line and it was disorganized because the size of the medical implants being machined, and its production demand was different for each batch. The data preparation step in CRISP-DM was employed to examine the raw data and preprocess it for analysis. The dimensions of the parts were referred to as DIM on the CMM report and each DIM was machined by a particular tool. The validity of the measurement was assessed by conducting the normality test [34]. Statistical strategies, such as capability studies and Design of Experiments (DoE), have been used in literature to reduce variation [81]. Capability studies are used to analyze process performance with respect to its specifications, and DoEs provide more information on process performance by emphasizing on how different factors affect the process significantly [81,82]. Since the number of sensors installed were limited, designing a DoE using different factors in this study was unfeasible. The stability of milling operation 2 was analyzed in this phase using the Six Sigma capability analysis tool on Minitab to emphasize on the need for first-off inspection. Process capability index (Cpk) and process performance index (Ppk) are the two indexes that can be used to conduct capability study. Cpk determines how well the output of a process lies within the customer’s specification limit. A capable process has less variation, and it is well within the specification limit. It is given as,
where,
σ—within standard deviation.
USL—upper specification limits.
LSL—lower specification limits.
—mean [83].
Ppk gives information about how the process varies from the specification limits. Ppk evaluates the performance of the actual process. It is given as,
where,
s—overall standard deviation.
USL—upper specification limits.
LSL—lower specification limits.
—mean [83].
Cpk and Ppk values of higher than or equal to 1.67 indicates that the process is in statistical control whereas the process might be within specification limits, but not centered, which would indicate that the performance is low.
- Low capability is when Cp ≤ 1, Cpk ≤ 1, Pp ≤ 1 and Ppk ≤ 1.
- Good capability is when 1 < Cp ≤ 1.67, 1 < Cpk ≤ 1.67, 1 < Pp ≤ 1.67 and 1 < Ppk ≤ 1.67.
- High capability is when Cp > 1.67, Cpk > 1.67, Pp > 1.67 and Ppk > 1.67 [82,83].
The variables for CNC milling operation 2 from the CMM were measured for 330 sample parts and then collected for analysis via MTConnect. In statistics, a population is defined as a collection of people about whom certain information must be gathered. A statistical population does not only have to be made up entirely of people. There can be a population of heights, weights, BMIs, or any other set of data points [84]. A sample consists of one or more observations drawn from the population. A sample may have fewer observations than the population, the same number of observations as the population, or more observations depending on the sampling process. From the same population, several samples can be obtained. Sample size determination is a way of selecting the number of observations to comprise in a sample. It is an important feature of any study in which the objective is to make implications about the population from a sample [85]. The sample size for this study was selected as 330 because the default sample size used in medical device industries for capability studies is 59 at the minimum [86].
Cpk and Ppk values were calculated for each DIM and it was observed that the data were not normal (p < 0.005) for any DIM, but Cpk and Ppk values were greater than 1.67 for all except 18 DIMs (detailed in Table 5). The Anderson–Darling test was used to check if the data fit normal distribution because it is sensitive to data variability [87].
Table 5.
Capability study.
The test was based on null (H0) and an alternative hypothesis (H1), where [88],
Hypothesis 0
(H0): the data follows the normal distribution.
Hypothesis 1
(H1): the data does not follow the normal distribution.
α: level of significance (normally set at 5%, α = 0.05).
If p < α, then the null hypothesis is rejected and the alternative hypothesis is true i.e., the data does not follow the normal distribution.
If p > α, then we fail to reject the null hypothesis and alternative hypothesis is rejected i.e., the data follows the normal distribution.
A plot of the capability index for all the DIMs is shown in Figure 13.
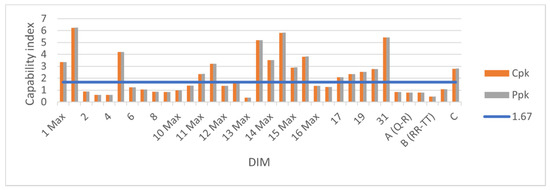
Figure 13.
Plot of capability index for all DIMs.
Thorough analysis of the capability index showed that only 11 DIMs have low capability (capability index ≤ 1), which accounts for 31.4% of the total 35 DIMs. Only seven DIMs showed good capability (1 < capability index ≤ 1.67). The DIMs with low capability were analyzed on a case-by-case basis and the following conclusions were derived after discussion with the process engineers: DIM 2 and 10 MAX had an outlier, DIM 13 MAX had very narrow limits which made it a critical dimension, DIM 3, 4, 9, and B (RR-TT) might have had the wrong machine setup and plenty of variation was observed for DIM 8, A (M-N), A (Q-R), and A (S-T) due to unknown reasons. The histograms for the 11 DIMs with low capabilities are shown in Figure 14.
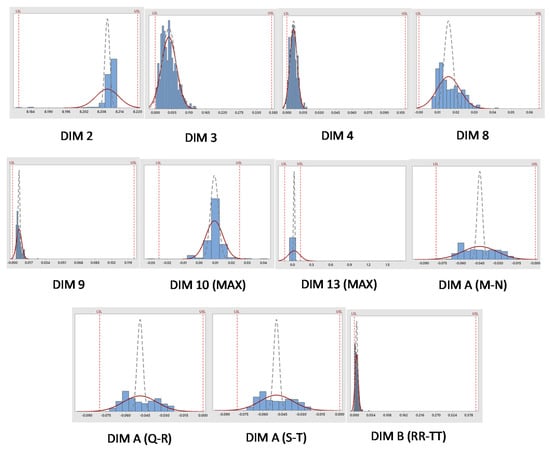
Figure 14.
Histogram for low capability DIMs.
Since the number of parts machined for each size were not consistent, the analysis was difficult, and more consistent data were required for proper analysis. Traditional Six Sigma would not be able to incorporate a large unfiltered dataset into its framework and integrating CRISP-DM methodology to prepare the data from digitization for analysis is the novel aspect of this study. The CRISP-DM data preparation step was used again to prepare the data for evaluating whether the different sizes of the implants in the batches was a factor contributing to low capability index. It was assumed that a smaller dataset with reduced variables will provide better consistency. Therefore, the data were filtered out for each size using the data for the DIM with lowest index (DIM 13 Max). It was found that the data were not normal for only four instances (p < 0.005) as shown in Table 6. A plot of the capability index for all the DIMs based on sizes is shown in Figure 15. All capability index values were very high, except for the instance when an outlier was detected.
Table 6.
Normality and capability analysis based on size.
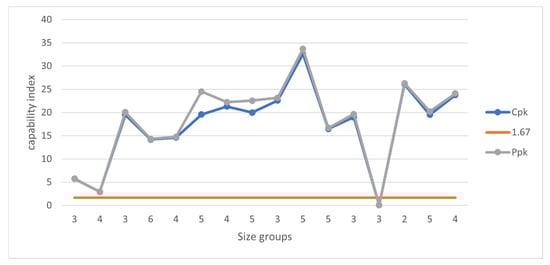
Figure 15.
Plot of capability index for all DIMs based on sizes.
The data were then filtered out for the DIM with lowest Ppk (DIM 13 Max) based on both sizes and LengthA (tool adjustment) changes. LengthA is the measurement of the tip of the tool to the roof of the tool fixture. As the tool wore down during operation, LengthA shortened and the associated CNC tool required an adjustment in the y-axis. The changes in LengthA over the duration of machining parts is shown in Figure 16. It was found that the data were not normal for three instances (p < 0.005). All capability index values were very high, except for the instance when an outlier was detected. The Cpk and Ppk values were calculated again after removing the outlier. This is shown in Table 7. A plot of the capability index for all the DIMs based on sizes and LengthA is shown in Figure 17.
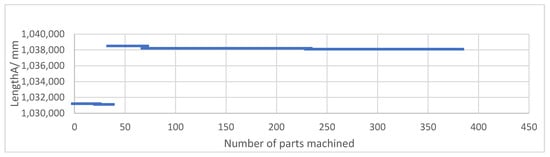
Figure 16.
LengthA changes for Tool 3 over number of parts machined.
Table 7.
Normality and Ppk analysis based on size and LengthA.
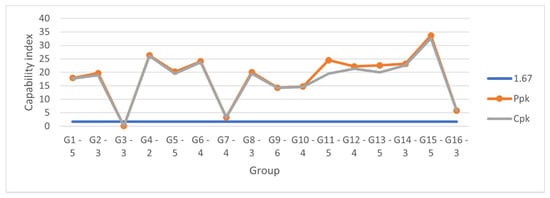
Figure 17.
Plot of capability index for all DIMs based on sizes and LengthA.
However, it was not possible to filter data for all DIMs based on sizes and LengthA changes because,
- The DIM-tool association was identified for only specified DIMs and tools.
- Each tool had more than 1 DIM associated.
- Some tools had no LengthA changes, so there was nothing to filter.
- Some tools had too many LengthA changes.
- Traceability of any drift in the CMM data were difficult to identify because it was difficult to correlate the CMM data with the LengthA changes (assuming they are tool adjustment changes).
- Tool adjustments could be automatically made by the machine (NOT operator) in certain cases, such as for DIM A where the operator has little control over tool adjustments to keep DIM A within specification.
The Cpk and Ppk values were higher than the index ‘1.67’ after the data were filtered to sizes and LengthA changes. Outliers were identified in the dataset, which were removed during the data preparation step to improve the accuracy of the results. The capability study reflected the low scrap rate from profile damage, which has a defect rate of 0.6%, i.e., 5 parts out of 882 machined parts were scrapped due to process parameter #1 caused by CNC tools over a period of 9 months. Thus, the statistical analysis showed that the variables had minimal effect on the dimensional accuracy of the part and the process was considered stable.
5.3.2. Improve and Deploy/Stabilization/Standardization/Optimization
The results from evaluation showed that the selected process ‘Milling operation 2′ was stable and it did not require the first-off inspection process, which is the most manual task that was highlighted earlier in this paper. The business objectives were met by the results as a manual action was identified to be removed from the overall process, and the capability study supported the removal of the inspection step, thus standardizing and automating the process by reducing the number of non-value added manual steps. The strategy for deploying this improvement to the process was discussed via brainstorming sessions with the team of process engineers and operators to recommend significant improvement to the process. Other than removal of the manual step, several other solutions were proposed. Around 80% of the scrap from milling operation 2 results from defects caused by the CNC tool (i.e., process parameter #1, machine lines, tool breakage, process parameter #3), machine set-up and first-off. The following solutions were proposed for process optimization based on the scrap causes and results achieved from the analyze phase,
- Solution 1—remove the manual step, first-off inspection.
- Solution 2—based on the categorization of different levels of capability in CNC tools, the training protocol for new operators can be simplified by focusing only on the critical tools, thus saving training time. Monitoring only the critical tools will also reduce cognitive load on the operator since the nature of the tool adjustment calculations is complicated.
- Solution 3—improve accuracy of the previously developed expert system for automating CNC tool adjustments to correct faults [60].
- Solution 4—install more sensors on the line and collect more data. This can be used to isolate the different variables that have an impact on the CNC tool during machining.
Deploying Solution 1 reduced the average cycle-time and increased the output of the implant manufacturing process. The average cycle time, with and without manual steps, were calculated using Equations (5) and (6), respectively. The difference and the percentage difference in cycle time from removing manual steps were calculated using Equations (7) and (8), respectively.
where
tM = total time taken to machine a number of parts with the manual steps during the process in minutes.
tWM = total time taken to machine a number of parts without the manual steps during the process in minutes.
N = number of parts machined during the process.
TM = average cycle time with manual steps in minutes.
TWM = average cycle time without manual steps in minutes.
∆T = difference in cycle time from removing manual steps in minutes.
∆T% = difference in cycle time from removing manual steps as a percentage.
The percentage difference in daily product output was calculated using Equations (9) and (10).
where
PM = product output per day with manual steps.
PWM = product output per day without manual steps.
∆P = difference in cycle time from removing manual steps.
∆P% = difference in cycle time from removing manual steps as a percentage.
The comparison of the process before and after removing the first-off inspection manual step is given in Table 8. The operational efficiency was set as 82% by the organization. Thus, the process was optimized with an improvement made to the standardization aspect.
Table 8.
Effect of removing first-off inspection.
After implementing the first-off removal, the validation process included:
- Creating a change control to manage the implementation in a structured manner.
- Completing a risk assessment.
- Executing a sectional installation qualification (IQ).
- Setting a target or nominal value for the operation qualification (OQ) and performance qualification (PQ).
The success of the process validations can be determined by a process capability calculation. A confidence statement needed to be developed for the outcome (pass or fail) of the validation steps.
Thus, the manual interaction involving first-off inspection was removed from the process; and removing first-off inspection added value to the process by reducing cycle-time and increasing product output.
5.3.3. Control and Automation
The improved process was monitored to control the changes over time by maintaining the implemented changes and collecting more data for ongoing monitoring and modifications. New policies and training plans were presented to sustain the changes. Implementation of first-off inspection removal required commitment from the team and consent from quality engineers. Poka-yoke was used to reduce the number of defects from machine set-up by providing operators with updated training that outlines all the new critical tools and related quality issues [89]. A checklist was prepared to be used by the operator before proceeding to machine a batch in the CNC to ensure that the tools are in the right condition. The steps carried out were documented as a standard. It was essential to store quality records and manage document control using a secured line and allowing for future access. Data storage requirements needed assessment. Process validation steps provided input into determining which process parameters need to be monitored and/or controlled and these factors be used for Continued Process Verification. Risk management included designing change controls to account for any changes and to assess the impact of the change.
6. Discussion of Results
The combined LSS, CRISP-DM methodology, and the “pre-automation” sequence was successfully executed, and the process was improved in terms of reduced manual steps, reduced cycle times, and improved product output by using newly digitized CNC–CMM data. The process cycle time was reduced by 3.76% and the output was 4.48% higher after implementing first-off removal, which was the removal of the non-value added manual step since the capability analysis proved that the process was stable with the capability index Cpk > 1.67. These values obtained help in answering the research question by confirming that digitized CNC and CMM data can be used to identify, reduce, or remove manual non-value added interactions from a medical device manufacturing process using the “pre-automation” sequence, LSS, and CRISP-DM methodology to automate and improve the process. A sample size of 330 parts were machined and measured for analysis. However, the data collected lacked in both quantity and quality. This made the capability analysis very challenging. Although the defect rates were low and the process was stable, the lower quantity of scrap that resulted from the CNC tool and machine set-up can be prevented with better training and by completely automating milling operation 2 via an expert system, which will help standardize the process by reducing operator interaction. Removing the first-off inspection process further reduces manual interaction in the overall process. It was vital to inform and work with the operators from the initial phase of this study because some operators feel more productive with more manual interactions, and they would not have welcomed the idea of reduced labor. Furthermore, reduced manual actions will allow the operators to focus on other tasks. The reduction of cycle time and increase in product output showed that the methodology was effective at identifying the manual step that did not add value to the process, and could be removed; thus, allowing standardization and automation. RPA described in literature for automation can automate processes by automating repetitive actions within the processes while our method can automate by reducing manual steps, thus improving the overall automation of the process.
The novel methodology selection flowchart aided in selecting the appropriate strategy to approach the non-standard automation issue on the factory floor. The “digitization of data” addition to a traditional Six Sigma process improvement technique facilitated the capability study significantly, as the analysis would not have been as efficient with manually acquired data. The transformation of digitized data from tacit knowledge allowed a continuous automatic flow of data that was not prone to human errors. Traditional Six Sigma approaches are only limited to small-scale applications when data are involved. The data mining techniques in CRISP-DM and the process improvement tools in LSS greatly helped in analyzing a large dataset and preparing the data for capability study for making the process better. The “pre-automation” sequence added emphasis on the automation objective of this study, which was achieved by standardization via the removal of a manual step in the process. The flow of the steps fit better with the combined methodology as it expanded the pool of tools to use and tasks to carry out in each step. The combined steps bridged the gaps in the methodology and assisted in meeting the main objective of the study.
The methodology proposed is repeatable and can be deployed to optimize any process regardless of availability of data. This is because automatic flow of data can be obtained using tacit knowledge to create digitized data in absence of sensors and historical data. Analysis of digitized data will add value to the process by successfully identifying areas that require standardization and automation. Digitization of data enabled process automation, as it is a crucial element in analysis for automation. Raw production data are noisy, which is not ideal for automation. The CRISP-DM methodology functioned as a tool in addition to Lean Six Sigma and the “pre-automation sequence” to format the noisy data to a more manageable format. By integrating Lean Six Sigma and data mining tools into the methodology, it was possible to identify automation opportunities as the two strategies were widely and successfully used for root cause analysis of a problem. Higher product output from the same operator will save on overheads as labor hours are reduced. Methods to identify potential automation opportunities in academia is still very limited and several researchers have been investigating this area. This was indicated by the number of review articles found in literature that discussed the gaps in theoretical knowledge around process or task identification for automation in RPA. The low maturity of the space was evident due to no evaluated and validated methods being found in literature for identifying the steps in a process, which would be most beneficial to automate from both standardization and process improvement perspectives. The “pre-automation” sequence in our methodology provided a framework to reach the automation goal via standardization and optimization. Our study contributes to the knowledge around process automation by presenting a methodology with an implementation that can be used to guide future studies to identify value from digitized data and automate processes using digitized data.
7. Conclusions
The digitization of CNC–CMM data, DMAIC methodology in LSS, CRISP-DM technique in data mining, and the “pre-automation” sequence were used to successfully identify the most significant areas of non-standard manual interaction and propose an effective solution to mitigate the problem with automation. The solution was then implemented and controlled for the updated production process. All manual interactions in the process were listed and the concept was to eliminate manual steps to achieve standardization and automation. The first-off inspection step was discarded from the process after conducting thorough analysis using the newly digitized data. The originality of this study results from selecting the most suitable methodologies to identify non-standard manual processes in a newly developed CNC–CMM pair for a medical implant manufacturing plant and automate them by eliminating waste and manual interactions. Using digitized data, developed from operators’ tacit knowledge, added significant value to the process as it provided the LSS and the CRISP-DM methods the means to reduce waste and non-value added steps.
8. Limitations and Future Research
Two major limitations in this study could be addressed in future research:
- Although the presented methodology can facilitate automation by reducing manual steps from the process, it can only focus on an individual process or step at a time. A method to identify multiple different processes with varying dataset to automate would be beneficial in terms of scalability in industries. However, controlling the number of the variables in a dynamic production environment for multiple processes will be challenging.
- The methodology uses standardization and the elimination of manual steps to achieve automation. Therefore, it does not guarantee full automation of the process as some manual aspect might still need to be addressed in the process.
The next phase of this research will monitor, calculate, and verify the tangible and intangible benefits such as cost savings and reduced labor hour, respectively, from the implemented process improvement by liaising with process engineers. This will add to the capability study, which proved that the CNC–CMM process under investigation was stable with a capability index greater than 1.67. The authors will also identify ways to automatically detect and prevent soft faults using the digitized data with the goal to fully automate the production process. It was observed from this study that the tools drift slowly during machining and it could lead to a part failure if not noticed. Further research will experiment with an ARMA tool drift model that should be able to identify a tool drifting outside the specification limits. The model will allow continuous monitoring of CNC tool data and aid the current ad hoc nature of manual interaction, or potentially take an automated correction step to further move the line towards full automation.
Author Contributions
Conceptualization, M.M.A. and K.B.; Data curation, M.M.A. and E.A.; Formal analysis, M.M.A.; Investigation, M.M.A. and E.A.; Methodology, M.M.A., A.B., and K.B.; Supervision, D.O. and K.B.; Validation, M.M.A. and E.A.; Writing—original draft, M.M.A.; Writing—review and editing, M.M.A., A.B., D.O., and K.B. All authors have read and agreed to the published version of the manuscript.
Funding
This study was supported by the DePuy Ireland Unlimited Company and Science Foundation Ireland on a co-funded grant agreement (SFI Targeted Project Agreement Reference No. 12/RC/2302).
Institutional Review Board Statement
Not applicable.
Informed Consent Statement
Not applicable.
Data Availability Statement
The data presented in this study are available on request from the corresponding author. The data are not publicly available due to the non-disclosure agreement with DePuy Ireland Unlimited Company.
Conflicts of Interest
The authors declare no conflict of interest.
References
- E. & G. Indicators. Manufacturing, Value Added (% of GDP); The World Bank. 2021. Available online: https://data.worldbank.org/indicator/NV.IND.MANF.ZS (accessed on 13 March 2021).
- Eurpean Commission. Manufacturing Statistics—NACE Rev. 2 Statistics. Eurostat. 2021. Available online: https://ec.europa.eu/eurostat/statistics-explained/index.php?title=Manufacturing_statistics_-_NACE_Rev._2&oldid=502915 (accessed on 12 March 2021).
- European Commission. Communication from the Commission to the European Parliament, the European Council, the Council, the European Economic and Social Committee and the Committee of the Regions: A New Industrial Strategy for Europe; EU Publications. 2020. Available online: https://op.europa.eu/en/publication-detail/-/publication/8ac0eb6c-6394-11ea-b735-01aa75ed71a1/language-en (accessed on 12 March 2021).
- Shagluf, A.; Fletcher, S.; Longstataff, A. Derivation of a cost model to aid management of cnc machine tool accuracy maintenance. J. Mach. Eng. 2015, 15, 17–43. [Google Scholar]
- Fera, M.; Greco, A.; Caterino, M.; Gerbino, S.; Caputo, F. Line Balancing Assessment Enhanced by IoT and Simulation Tools. In Proceedings of the 2019 IEEE International Workshop on Metrology for Industry 4.0 and IoT, Naples, Italy, 4–6 June 2019; pp. 84–88. [Google Scholar]
- Parvadavardini, S.; Vivek, N.; Devadasan, S. Impact of quality management practices on quality performance and financial performance: Evidence from Indian manufacturing companies. Total. Qual. Manag. Bus. Excel. 2016, 27, 507–530. [Google Scholar] [CrossRef]
- Al Kindi, M.; Abbas, A.E. A decision analysis view of six sigma. In Proceedings of the 2010 IEEE International Systems Conference, SysCon 2010, Istanbul, Turkey, 10–13 October 2010; IEEE: Piscataway, NJ, USA, 2010; pp. 389–393. [Google Scholar]
- Xie, D.; Hui, W. Research on quality cost based on manufacturing process. In Proceedings of the 2010 IEEE International Conference on Intelligent Computing and Intelligent Systems, Xiamen, China, 29–31 October 2010; Volume 2, pp. 37–40. [Google Scholar]
- European Commission. Energy, Transport and Environment Statistics—2020 Edition; Publications Office of the European Union: Luxembourg, 2020. [Google Scholar]
- Ezeanyim, O.C.; Nwosu, M.C.; Uchendu, O.; Chukwuneke, J. A Comparative Analysis of Cost of Rework and Cost of Conformance to Quality in Manufacturing Sector: A Case Study of Aluminium Industry in Nigeria. Int. J. Mater. Sci. Manuf. Eng. 2014, 41, 1140–1146. [Google Scholar]
- Drohomeretski, E.; Da Costa, S.E.G.; De Lima, E.P.; Garbuio, P.A.D.R. Lean, Six Sigma and Lean Six Sigma: An analysis based on operations strategy. Int. J. Prod. Res. 2014, 52, 804–824. [Google Scholar] [CrossRef]
- Andersson, R.; Eriksson, H.; Torstensson, H. Similarities and differences between TQM, six sigma and lean. TQM Mag. 2006, 18, 282–296. [Google Scholar] [CrossRef]
- Wang, X.; Wang, Y.; Xu, D. Lean six sigma implementation in equipment maintenance process. In Proceedings of the 2012 International Conference on Quality, Reliability, Risk, Maintenance, and Safety Engineering, Chengdu, China, 15–18 June 2012; pp. 1391–1395. [Google Scholar]
- Banga, H.K.; Kumar, R.; Kumar, P.; Purohit, A.; Kumar, H.; Singh, K. Productivity improvement in manufacturing industry by lean tool. Mater. Today Proc. 2020, 28, 1788–1794. [Google Scholar] [CrossRef]
- Wang, Y. Data mining from simulation of Six Sigma in manufacturing company. In Proceedings of the 2008 International Conference on Computer Science and Software Engineering, Wuhan, China, 12–14 December 2008; Volume 4, pp. 423–426. [Google Scholar]
- Liu, J. Application of six sigma methodology in forging manufacturing plants: An example study. In Proceedings of the 2011 IEEE 2nd International Conference on Computing, Control and Industrial Engineering, Wuhan, China, 20–21 August 2011; Volume 2, pp. 354–357. [Google Scholar]
- Valles, A.; Sanchez, J.; Noriega, S.; Nuñez, B.G. Implementation of Six Sigma in a manufacturing process: A case study. Int. J. Ind. Eng. Theory Appl. Pract. 2009, 16, 171–181. [Google Scholar]
- Chaudhary, A.K. Application of Lean Six Sigma in Manufacturing of Precision Tools and Die. In Proceedings of the IOE Graduate Conference, Kathmandu, Nepal, 24–25 May 2019. [Google Scholar]
- Safwat, T.; Ezzat, A. Applying six sigma techniques in plastic injection molding industry. In Proceedings of the 2008 IEEE International Conference on Industrial Engineering and Engineering Management, Singapore, 8–11 December 2008; pp. 2041–2045. [Google Scholar]
- Ramly, N.N.; Yaw, L.K. Six Sigma DMAIC: Process Improvements towards Better IT Customer Support. Int. J. e-Educ. e-Bus. e-Manag. e-Learn. 2012, 2, 359–364. [Google Scholar] [CrossRef]
- Tchidi, M.F.; He, Z. The requirements engineering process model based on Design for Six Sigma. In Proceedings of the 2010 2nd IEEE International Conference on Information Management and Engineering, Chengdu, China, 16–18 April 2010; Volume 1, pp. 287–290. [Google Scholar]
- Deshmukh, S.V.; Lakhe, R.R. Six Sigma—An innovative approach for waste reduction: A case study of an Indian SME. In Proceedings of the 2008 IEEE International Conference on Industrial Engineering and Engineering Management, Singapore, 8–11 December 2008; pp. 1553–1556. [Google Scholar]
- Venkatesh, N.; Sumangala, C. Evaluation of Six Sigma in automobile manufacturing industries. J. Contemp. Res. Manag. 2014, 9, 45–54. [Google Scholar]
- Kaushik, P.; Khanduja, D. Application of Six Sigma DMAIC methodology in thermal power plants: A case study. Total. Qual. Manag. Bus. Excel. 2009, 20, 197–207. [Google Scholar] [CrossRef]
- Thomas, A.J.; Francis, M.; Fisher, R.; Byard, P. Implementing Lean Six Sigma to overcome the production challenges in an aerospace company. Prod. Plan. Control. 2016, 27, 1–13. [Google Scholar] [CrossRef]
- Kumar, C.S.C.; Naidu, N.V.R. Performance improvement of manufacturing industry by reducing the Defectives using Six Sigma Methodologies. IOSR J. Eng. 2011, 1, 1–9. [Google Scholar] [CrossRef]
- Baharudin, F.; Mohamed, R.; Ismail, I.; Bala, A. Deployment of Six Sigma Methodology in Plant Data Analytics. In Proceedings of the 2018 International Conference on Intelligent and Advanced System (ICIAS) 2018, Kuala Lumpur, Malaysia, 13–14 August 2018; pp. 1–4. [Google Scholar]
- Fahmy, A.F.; Mohamed, H.K.; Yousef, A.H. A data mining experimentation framework to improve six sigma projects. In Proceedings of the 2017 13th International Computer Engineering Conference (ICENCO), Cairo, Egypt, 27–28 December 2017; Volume 2018, pp. 243–249. [Google Scholar]
- Martins, C.M.G.; Técnico, I.S. Robotic Process Automation: A Lean Approach to RPA. 2018. Available online: https://fenix.tecnico.ulisboa.pt/downloadFile/563345090416333/79153-Carina-Martins-ExtAbs.pdf (accessed on 13 March 2021).
- Zhao, D.; Ye, W.; Gao, C. Research on process optimization for equipment maintenance based on lean six sigma management. In Proceedings of the 2012 International Conference on Quality, Reliability, Risk, Maintenance, and Safety Engineering, Chengdu, China, 15–18 June 2012; pp. 1333–1337. [Google Scholar]
- Slack, N. The Manufacturing Advantage: Achieving Competitive Manufacturing Operations; Mercury: London, UK, 1991. [Google Scholar]
- Leno, V.; Polyvyanyy, A.; Dumas, M.; La Rosa, M.; Maggi, F.M. Robotic Process Mining: Vision and Challenges. Bus. Inf. Syst. Eng. 2020, 1–14. [Google Scholar] [CrossRef]
- Chakraborti, T.; Isahagian, V.; Khalaf, R.; Khazaeni, Y. From robotic process automation to intelligent process automation: Emerging trends. In Proceedings of the International Conference on Business Process Management, Sevilla, Spain, 13–18 September 2020; pp. 215–228. [Google Scholar]
- Shahada, T.M.; Alsyouf, I. Design and implementation of a Lean Six Sigma framework for process improvement: A case study. In Proceedings of the 2012 IEEE International Conference on Industrial Engineering and Engineering Management, Hong Kong, China, 10–13 December 2012; pp. 80–84. [Google Scholar]
- Su, Q.; Liu, L.; Whitney, D.E. A Systematic Study of the Prediction Model for Operator-Induced Assembly Defects Based on Assembly Complexity Factors. IEEE Trans. Syst. Man Cybern. Part A Syst. Humans 2009, 40, 107–120. [Google Scholar] [CrossRef]
- Havlikova, M.; Jirgl, M.; Bradac, Z. Human Reliability in Man-machine Systems. Procedia Eng. 2015, 100, 1207–1214. [Google Scholar] [CrossRef]
- Heinrich, H.; Deutschlander, A. The long journey from standardisation to full automation of a mature 200 mm fab. In Proceedings of the 2018 29th Annual SEMI Advanced Semiconductor Manufacturing Conference (ASMC), Saratoga Springs, NY, USA, 30 April–3 May 2018; pp. 353–358. [Google Scholar]
- Longo, F.; Nicoletti, L.; Padovano, A. Smart operators in industry 4.0: A human-centered approach to enhance operators’ capabilities and competencies within the new smart factory context. Comput. Ind. Eng. 2017, 113, 144–159. [Google Scholar] [CrossRef]
- Zhong, R.Y.; Xu, X.; Klotz, E.; Newman, S.T. Intelligent Manufacturing in the Context of Industry 4.0: A Review. Engineering 2017, 3, 616–630. [Google Scholar] [CrossRef]
- Chengula, Z.; Morato, M.A.R.; Thurner, T.; Wiedensohler, Y.; Martin, L. State of Industry 4.0 Across Six French Companies. In Proceedings of the 2018 IEEE International Conference on Engineering, Technology and Innovation (ICE/ITMC), Stuttgart, Germany, 17–20 June 2018. [Google Scholar]
- Upasani, K.; Bakshi, M.; Pandhare, V.; Lad, B.K. Distributed maintenance planning in manufacturing industries. Comput. Ind. Eng. 2017, 108, 1–14. [Google Scholar] [CrossRef]
- Subrahmanian, E.; Rachuri, S.; Fenves, S.J.; Foufou, S.; Sriram, R.D. Product lifecycle management support: A challenge in supporting product design and manufacturing in a networked economy. Int. J. Prod. Lifecycle Manag. 2005, 1, 4–25. [Google Scholar] [CrossRef]
- European Commission. Communication from the Commission to the European Parliament, the Council, the European Economic and Social Committee and the Committee of the Regions: A European Strategy for Data; EU Publications. 2020. Available online: https://op.europa.eu/en/publication-detail/-/publication/ac9cd214-53c6-11ea-aece-01aa75ed71a1 (accessed on 12 March 2021).
- Omar, Y.M.; Minoufekr, M.; Plapper, P. Business analytics in manufacturing: Current trends, challenges and pathway to market leadership. Oper. Res. Perspect. 2019, 6, 100127. [Google Scholar] [CrossRef]
- Hecklau, F.; Galeitzke, M.; Flachs, S.; Kohl, H. Holistic Approach for Human Resource Management in Industry 4.0. Procedia CIRP 2016, 54, 1–6. [Google Scholar] [CrossRef]
- Li, Y.; Liu, Q.; Xiong, J.; Wang, J. Research on data-sharing and intelligent CNC machining system. In Proceedings of the 2015 IEEE International Conference on Mechatronics and Automation (ICMA), Beijing, China, 2–5 August 2015; pp. 625–630. [Google Scholar]
- Villagran, N.V.; Estevez, E.; Pesado, P.; Marquez, J.d. Standardization: A key factor of industry 4.0. In Proceedings of the 2019 Sixth International Conference on eDemocracy & eGovernment (ICEDEG), Quito, Ecuador, 24–26 April 2019; pp. 350–354. [Google Scholar]
- Kim, N.H.; Choi, J.H.; An, D. Prognostics and Health Management of Engineering Systems: An Introduction; Springer: Berlin/Heidelberg, Germany, 2016. [Google Scholar]
- Yuan, G.; Li, Y.; Wang, W. A Game Analysis of Tacit Knowledge Transferring within Organizations. In Proceedings of the 2009 Second International Symposium on Knowledge Acquisition and Modeling, Wuhan, China, 30 November–1 December 2009; Volume 1, pp. 256–259. [Google Scholar]
- Zaraté, P.; Irit, T. A New Trend for Knowledge Based Decision Support Systems Design. Int. J. Inf. Decis. Sci. 2015, 8, 1–13. [Google Scholar] [CrossRef]
- Sheil, J. First-off inspection of capable manufacturing processes. J. Oper. Res. Soc. 2001, 52, 642–651. [Google Scholar] [CrossRef]
- Plaza, M.; Zębala, W.; Matras, A. Decision system supporting optimization of machining strategy. Comput. Ind. Eng. 2019, 127, 21–38. [Google Scholar] [CrossRef]
- Hannola, L.; Richter, A.; Richter, S.; Stocker, A. Empowering production workers with digitally facilitated knowledge processes–a conceptual framework. Int. J. Prod. Res. 2018, 56, 4729–4743. [Google Scholar] [CrossRef]
- Bahrin, M.A.K.; Othman, M.F.; Azli, N.H.N.; Talib, M.F. Industry 4.0: A review on industrial automation and robotic. J. Teknol. 2016, 78, 137–143. [Google Scholar]
- Petrillo, A.; De Felice, F.; Cioffi, R.; Zomparelli, F. Fourth Industrial Revolution: Current Practices, Challenges, and Opportunities. In Digital Transformation in Smart Manufacturing; Petrillo, A., De Felice, F., Cioffi, R., Eds.; IntechOpen: Rijeka, Croatia, 2018; pp. 1–20. [Google Scholar] [CrossRef]
- Oliff, H.; Liu, Y. Towards Industry 4.0 Utilizing Data-Mining Techniques: A Case Study on Quality Improvement. Procedia CIRP 2017, 63, 167–172. [Google Scholar] [CrossRef]
- Tortorella, G.L.; Fettermann, D. Implementation of Industry 4.0 and lean production in Brazilian manufacturing companies. Int. J. Prod. Res. 2018, 56, 2975–2987. [Google Scholar] [CrossRef]
- Paulus-Rohmer, D.; Schatton, H.; Bauernhansl, T. Ecosystems, Strategy and Business Models in the age of Digitization—How the Manufacturing Industry is Going to Change its Logic. Procedia CIRP 2016, 57, 8–13. [Google Scholar] [CrossRef]
- Katipamula, S.; Brambley, M.R. Methods for Fault Detection, Diagnostics, and Prognostics for Building Systems—A Review, Part I. HVAC&R Res. 2005, 11, 3–26. [Google Scholar]
- Adrita, M.M.; Brem, A.; O’Neill, P.; Gorman, E.; O’Sullivan, D.; Bruton, K. Development of a Decision Support System to Enable Adaptive Manufacturing. Smart Sustain. Manuf. Syst. 2020, 4, 20190036. [Google Scholar] [CrossRef]
- Zawra, L.M. Migration of Legacy Industrial Automation Systems in the Context of Industry 4.0—A Comparative Study. In Proceedings of the 2019 International Conference on Fourth Industrial Revolution (ICFIR), Manama, Bahrain, 19–21 February 2019. [Google Scholar]
- European Commission. Rolling Plan for ICT Standardisation; European Commission: Luxembourg, 2018; pp. 1–148. [Google Scholar]
- Kroll, C.; Bujak, A.; Darius, V.; Enders, W.; Esser, M. Robotic Process Automation—Robots conquer business processes in back offices. Capgemini Consult. 2016, 1–48. Available online: https://www.capgemini.com/consulting-de/wp-content/uploads/sites/32/2017/08/robotic-process-automation-study.pdf (accessed on 13 March 2021).
- Geyer-Klingeberg, J.; Nakladal, J.; Baldauf, F.; Veit, F. Process mining and Robotic process automation: A perfect match. CEUR Workshop Proc. 2018, 2196, 124–131. [Google Scholar]
- Hofmann, P.; Samp, C.; Urbach, N. Robotic process automation. Electron. Mark. 2020, 30, 99–106. [Google Scholar] [CrossRef]
- Georgieva, S.; Manzurova, R. Robotic process automation (rpa) the example of coca-cola hellenic business service organization. Int. J. Sci. Arts IDEA 2018, 43, 71–156. [Google Scholar]
- Daugherty, P.R.; Wilson, H.J. Human + Machine: Reimagining Work in the Age of AI; Harvard Business Press: Boston, MA. USA, 2018. [Google Scholar]
- Leopold, H.; van der Aa, H.; Reijers, H.A. Identifying candidate tasks for robotic process automation in textual process descriptions. In Proceedings of the International Conference on Business Process Modeling, Development and Support, Tallinn, Estonia, 11–12 June 2018; Springer: Berlin/Heidelberg, Germany, 2018; Volume 19, pp. 67–81. [Google Scholar]
- Dey, S.; Das, A. Robotic process automation: Assessment of the technology for transformation of business processes. Int. J. Bus. Process. Integr. Manag. 2019, 9, 220. [Google Scholar] [CrossRef]
- Jimenez-Ramirez, A.; Reijers, H.A.; Barba, I.; del Valle, C. A Method to Improve the Early Stages of the Robotic Process Automation Lifecycle. In Proceedings of the International Conference on Advanced Information Systems Engineering, Rome, Italy, 3–7 June 2019; Volume 1, pp. 446–461. [Google Scholar]
- Kumar, S.; Prasad, P. Robotic Process Automation. Int. Res. J. Mod. Eng. Technol. Sci. 2020, 2, 1248–1251. [Google Scholar]
- Giannetti, C.; Ransing, R.S. Risk based uncertainty quantification to improve robustness of manufacturing operations. Comput. Ind. Eng. 2016, 101, 70–80. [Google Scholar] [CrossRef]
- Giannetti, C.; Ransing, M.R.; Ransing, R.S.; Bould, D.C.; Gethin, D.T.; Sienz, J. Organisational Knowledge Management for Defect Reduction and Sustainable Development in Foundries. Int. J. Knowl. Syst. Sci. 2015, 6, 18–37. [Google Scholar] [CrossRef]
- Almqvist, O. A Comparative Study between Algorithms for Time Series Forecasting on Customer Prediction. Bachelor’s Thesis, School of Informatics, University of Skövde, Skövde, Sweden, 2019. Available online: http://urn.kb.se/resolve?urn=urn:nbn:se:his:diva-16974 (accessed on 13 March 2021).
- Schafer, F.; Zeiselmair, C.; Becker, J.; Otten, H. Synthesizing CRISP-DM and Quality Management: A Data Mining Approach for Production Processes. In Proceedings of the 2018 IEEE International Conference on Technology Management, Operations and Decisions (ICTMOD), Marrakech, Morocco, 21–23 November 2018; pp. 190–195. [Google Scholar]
- Nascimento, D.L.D.M.; Quelhas, O.L.G.; Caiado, R.G.G.; Tortorella, G.L.; Garza-Reyes, J.A.; Rocha-Lona, L. A lean six sigma framework for continuous and incremental improvement in the oil and gas sector. Int. J. Lean Six Sigma 2019, 11, 577–595. [Google Scholar] [CrossRef]
- Lugert, A.; Batz, A.; Winkler, H. Empirical assessment of the future adequacy of value stream mapping in manufacturing industries. J. Manuf. Technol. Manag. 2018, 29, 886–906. [Google Scholar] [CrossRef]
- Wirth, R. CRISP-DM: Towards a Standard Process Model for Data Mining. In Proceedings of the Fourth International Conference on the Practical Application of Knowledge Discovery and Data Mining, Manchester, UK, 11–13 April 2000; pp. 29–39. [Google Scholar]
- Chen, S.; Yin, C.; Li, X. Implementation of MTConnect in Machine Monitoring System for CNCs. In Proceedings of the 2017 5th International Conference on Enterprise Systems (ES), Beijing, China, 22–24 September 2017; pp. 70–75. [Google Scholar]
- Botsaris, P.N.; Tsanakas, J.A. State-of-the-Art in Methods Applied To Tool Condition Monitoring (Tcm) in Unmanned Machining Operations: A Review. Int. Conf. COMADEM 2008, 73–87. [Google Scholar]
- Lundkvist, P. Experiments and Capability Analysis in Process Industry. Licentiate Thesis, Luleå University of Technology, Luleå, Sweden, 2012. [Google Scholar]
- Raisinghani, M.S.; Ette, H.; Pierce, R.; Cannon, G.; Daripaly, P. Six Sigma: Concepts, tools, and applications. Ind. Manag. Data Syst. 2005, 105, 491–505. [Google Scholar] [CrossRef]
- Pyzdek, T.; Keller, P.A. The Six Sigma Handbook, 3rd ed.; McGraw-Hill: New York, NY, USA, 2003. [Google Scholar]
- Banerjee, A.; Chaudhury, S. Statistics without tears: Populations and samples. Ind. Psychiatry J. 2010, 19, 60. [Google Scholar] [CrossRef] [PubMed]
- Singh, A.S.; Masuku, M.B. Sampling Techniques & Determination of Sample Size in Applied Statistics Reseaech: An Overview. Int. J. Econ. Commer. Manag. 2014, 2, 32–33. [Google Scholar]
- Kwiecien, J.W. Process Capability Calculations with Nonnormal Data in the Medical Device Manufacturing Industry. Ph.D. Thesis, College of Management and Technology, Walden University, Minneapolis, MN, USA, 2017; p. 185. [Google Scholar]
- Cousineau, D.; Engmann, S. Comparing Distributions: The Two-Sample Anderson—Darling Test as an Alternative to the Kolmogorov—Smirnov test. J. Appl. Quant. Methods 2011, 6, 1–17. [Google Scholar]
- Ogunleye, L.I.; Oyejola, B.A.; Obisesan, K.O. Comparison of Common Tests for Normality. Int. J. Probab. Stat. 2018, 7, 130–137. [Google Scholar]
- Kumar, M.; Antony, J.; Singh, R.K.; Tiwari, M.K.; Perry, D. Implementing the Lean Sigma framework in an Indian SME: A case study. Prod. Plan. Control. 2006, 17, 407–423. [Google Scholar] [CrossRef]


Publisher’s Note: MDPI stays neutral with regard to jurisdictional claims in published maps and institutional affiliations. |
© 2021 by the authors. Licensee MDPI, Basel, Switzerland. This article is an open access article distributed under the terms and conditions of the Creative Commons Attribution (CC BY) license (https://creativecommons.org/licenses/by/4.0/).