Classification Performance of Thresholding Methods in the Mahalanobis–Taguchi System
Abstract
1. Introduction
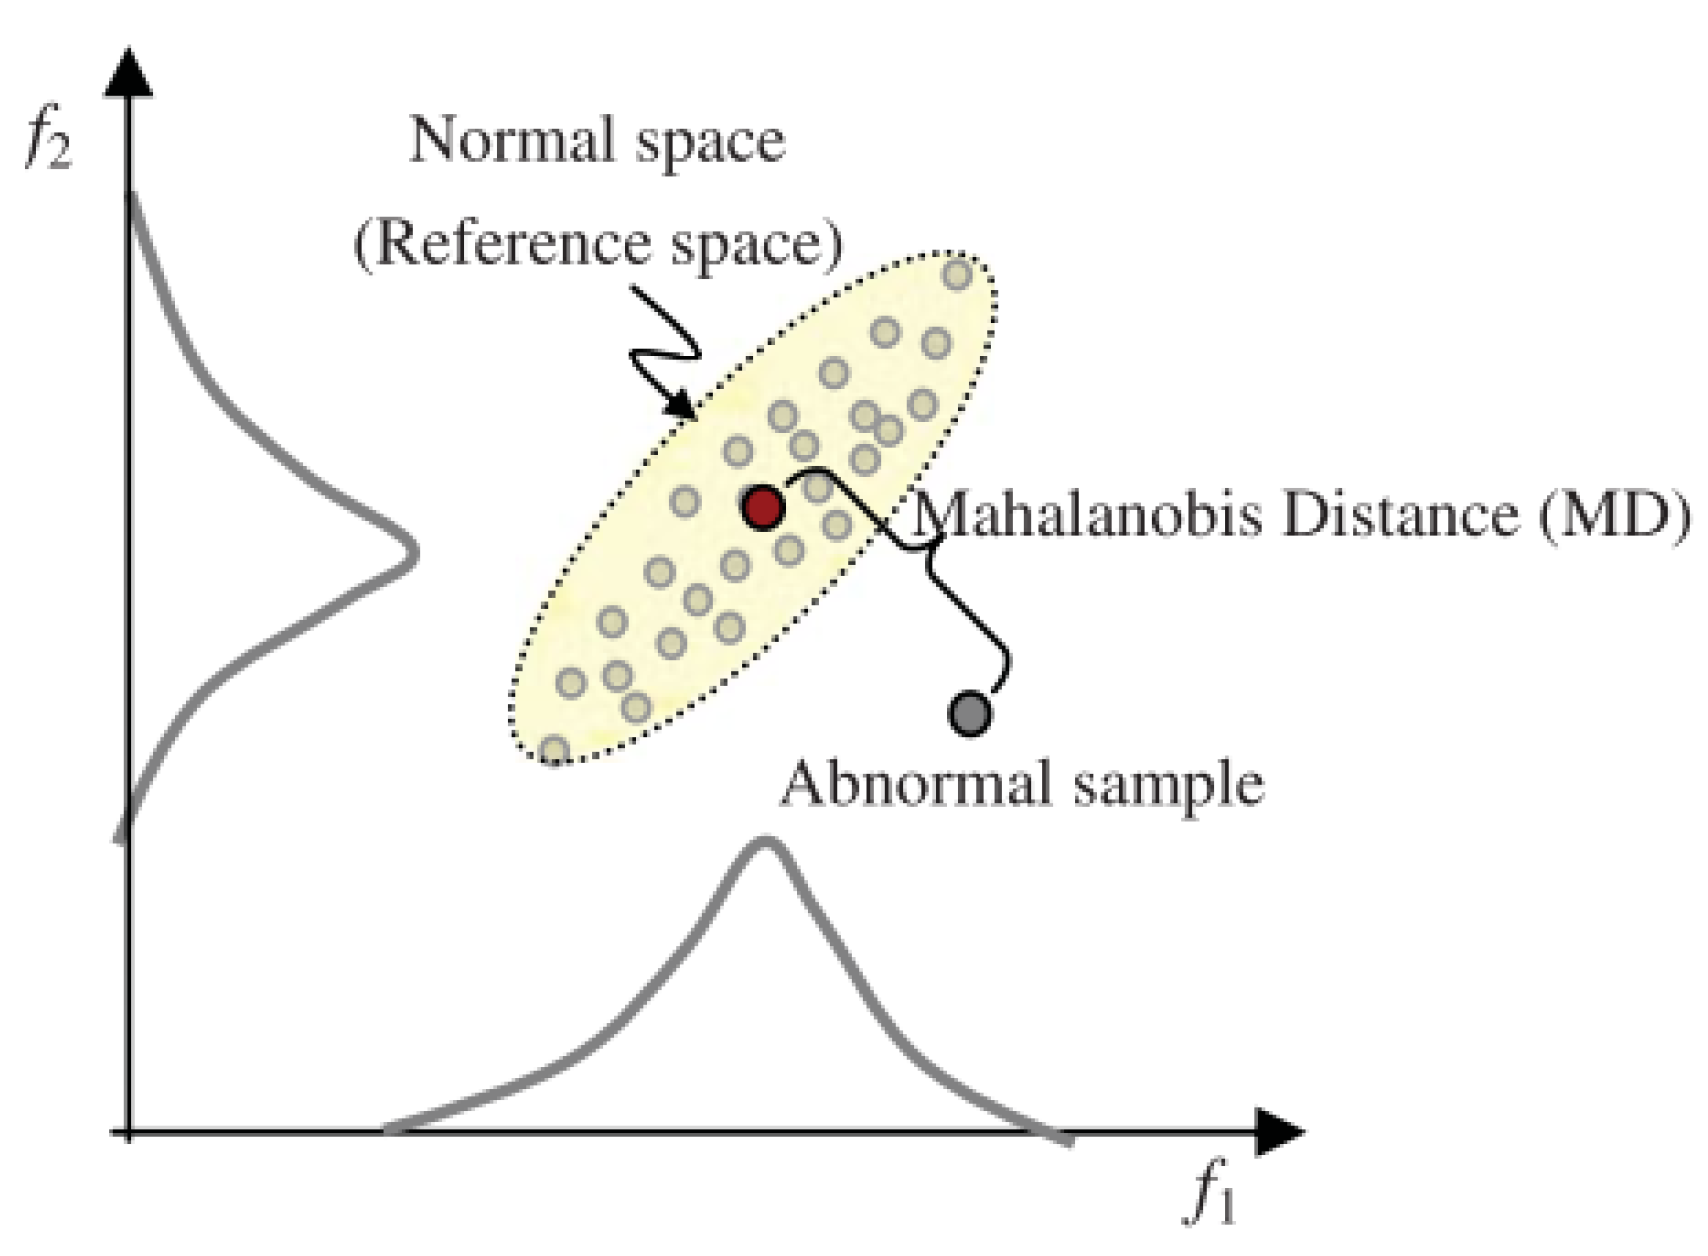
2. The Concept of Mahalanobis Distance (MD)
2.1. Mahalanobis Distance (MD) Formulation
- ●
- k = the total number of features;
- ●
- i = the number of features (i = 1, 2, …, k);
- ●
- j = the number of samples (j = 1, 2, …, n);
- ●
- Zij = the standardized vector of normalized characteristics of xij;
- ●
- xij = the value of the ith characteristic in the jth observation;
- ●
- mi = the mean of the ith characteristic;
- ●
- si = the standard deviation of the ith characteristic;
- ●
- T = the transpose of the vector;
- ●
- C−1 = the inverse of the correlation coefficient matrix.
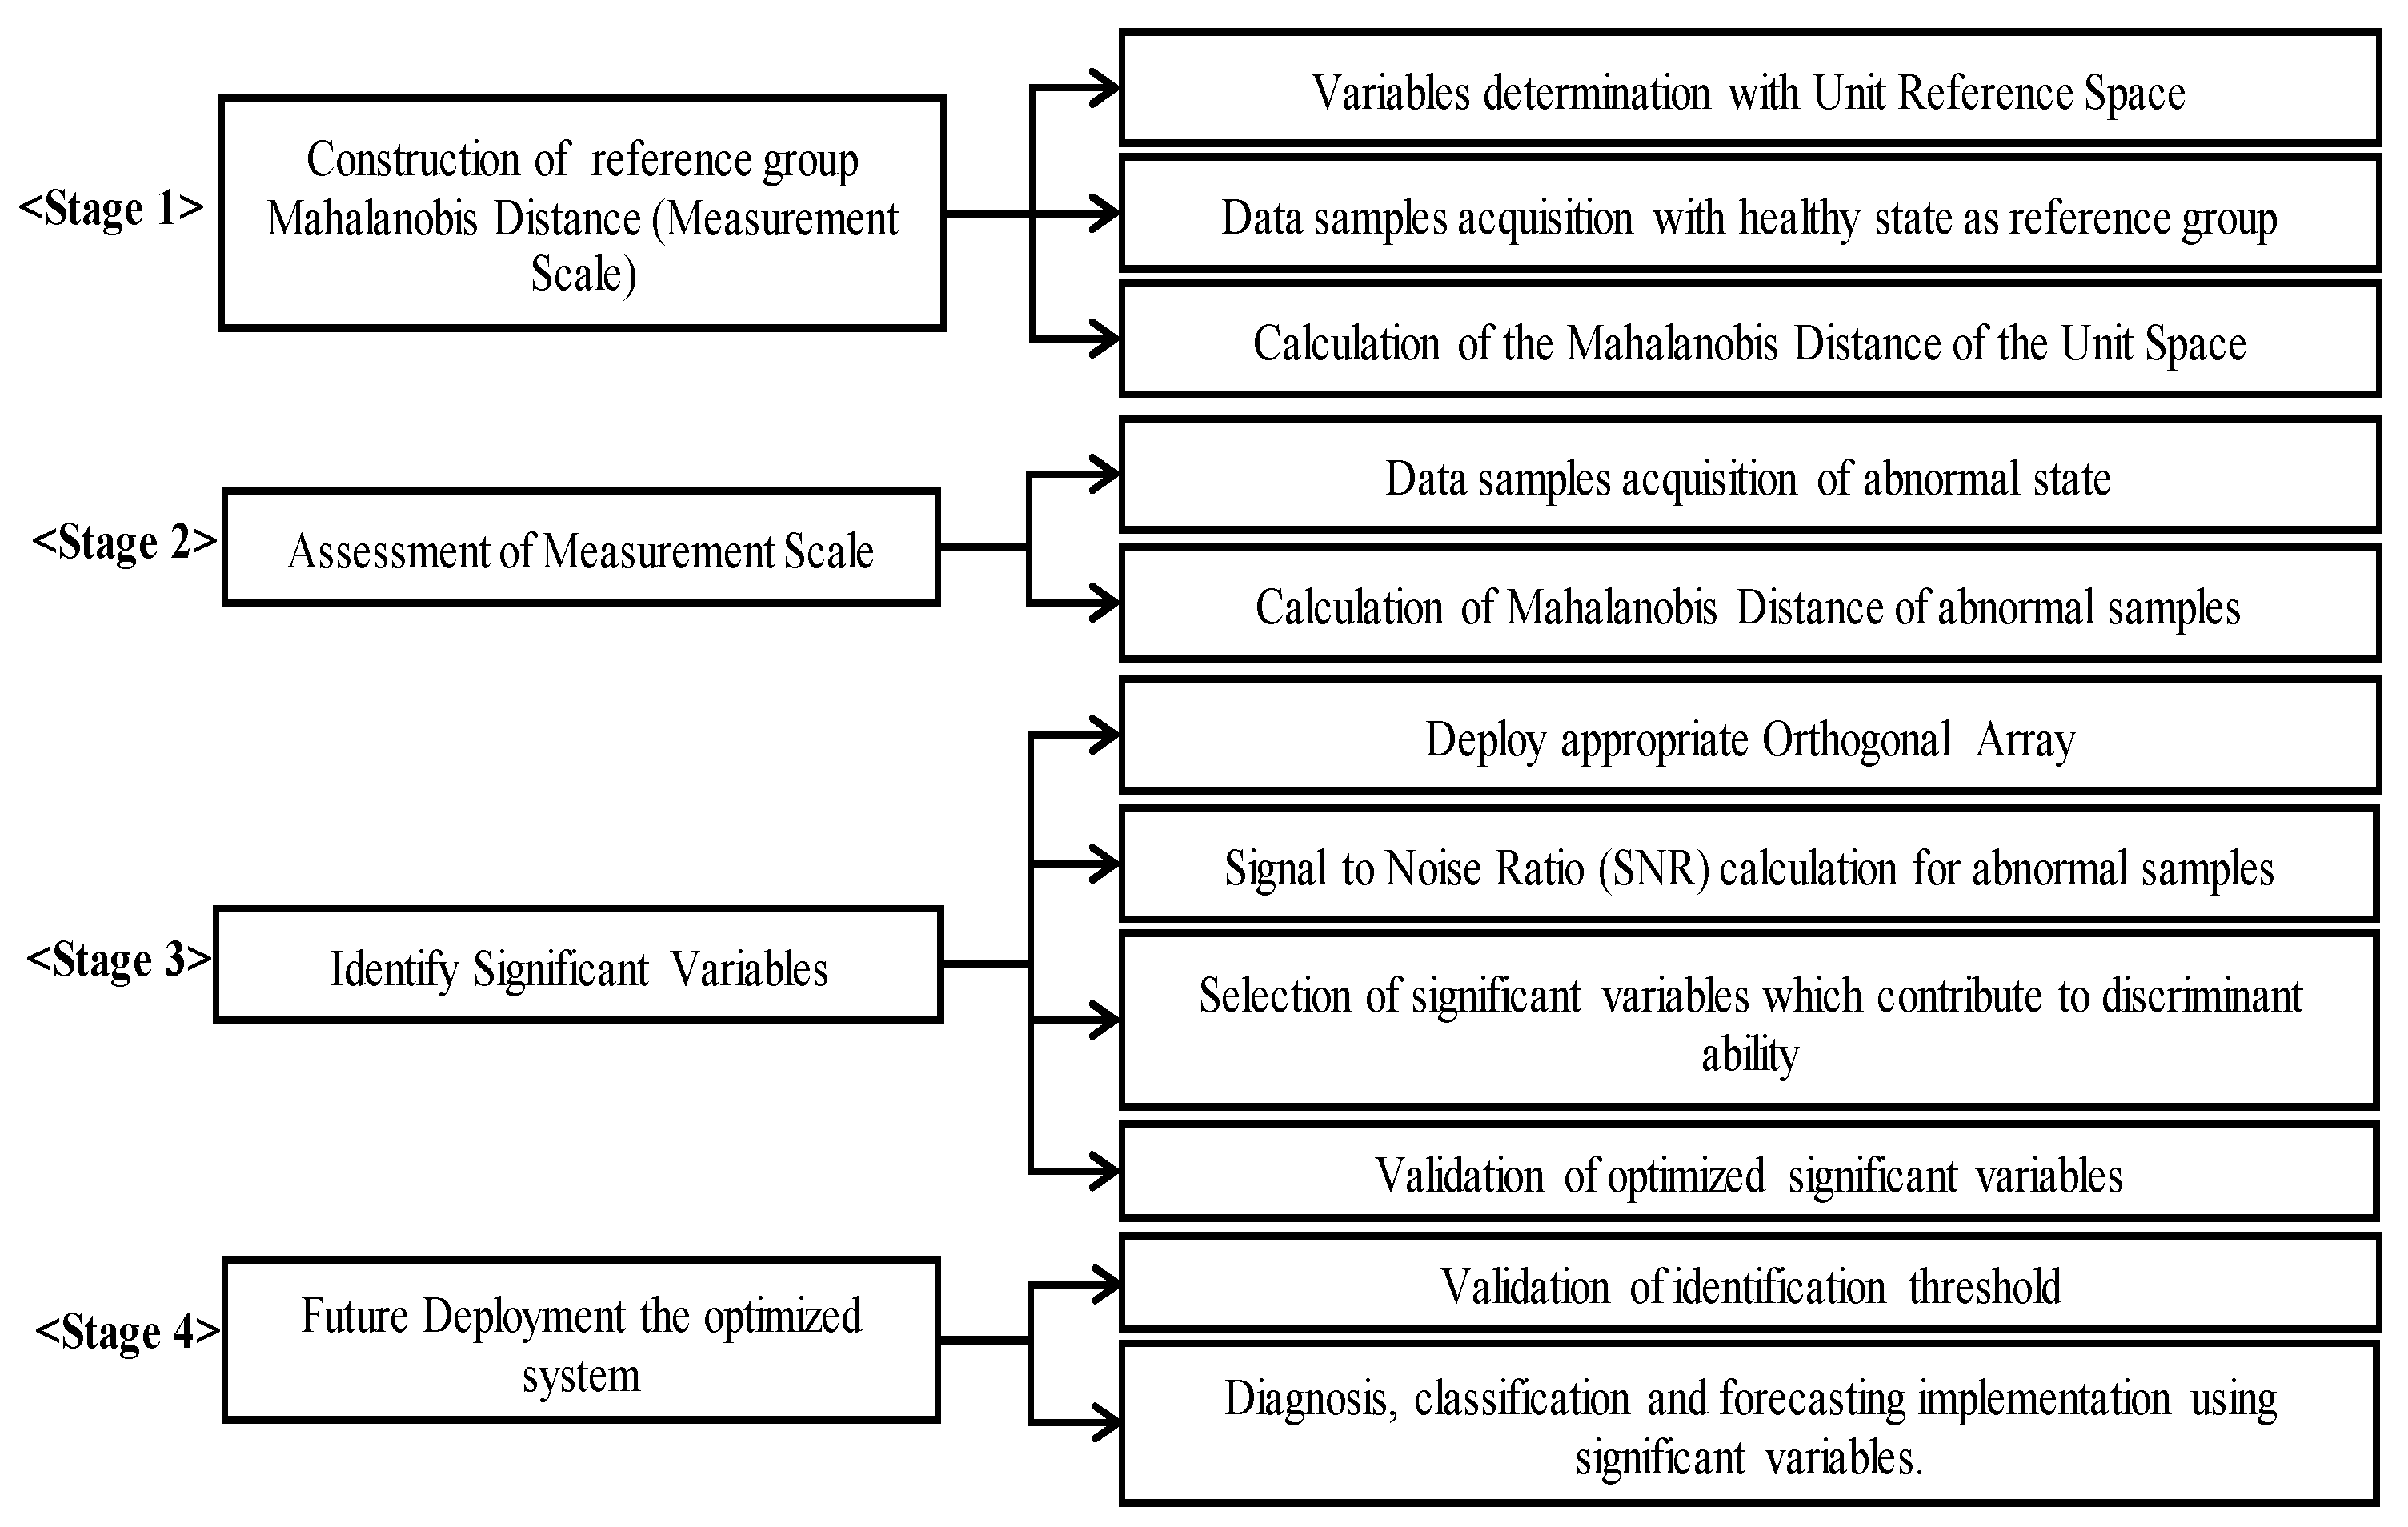
2.2. Mahalanobis–Taguchi System (MTS) Procedures
- ●
- Calculate the mean characteristic in the normal dataset as:
- ●
- Then, calculate the standard deviation for each characteristic:
- ●
- Next, standardise each characteristic to form the normalized data matrix (Zij) and its transpose ():
- ●
- Then, verify that the mean of the normalized data is zero:
- ●
- Verify that the standard deviation of the normalized data is one:
- ●
- Form the correlation coefficient matrix (C) of the normalized data. The element matrix (cij) is calculated as follows:
- ●
- Compute inverse correlation coefficient matrix (C−1)
- n is the number of samples,
- X and Y are two different features being correlated,
- X bar and Y bar are the averages among the data in each variable, and
- V(X) and V(Y) are the variances of X and Y.
- ●
- Finally, calculate the MDj using Equation (2).
2.2.1. The Role of the Orthogonal Array (OA) in MTS
2.2.2. The Role of the SNR in MTS
2.2.3. Larger-the-Better SNR
3. Overview on Common Thresholding Methods in the Mahalanobis Taguchi System
3.1. Quadratic Loss Function
- ●
- MDT = the threshold (in MD term)
- ●
- A = the cost of the complete examination of patients who diagnose as unhealthy (including loss of time),
- ●
- A0 = the monetary loss caused by not taking the complete examination and having the disease show up before the next examination or the loss increase after having subjective symptoms followed by taking a complete examination,
- ●
- D = the mid-value of the MD of a patient group having the subjective symptoms
3.2. Probabilistic Thresholding Method
- ●
- is the average of the MDs of the normal group,
- ●
- sMD is the standard deviation of the MDs of the normal group,
- ●
- λ is a small parameter or the confidence level (typically 5% or 0.05)
- ●
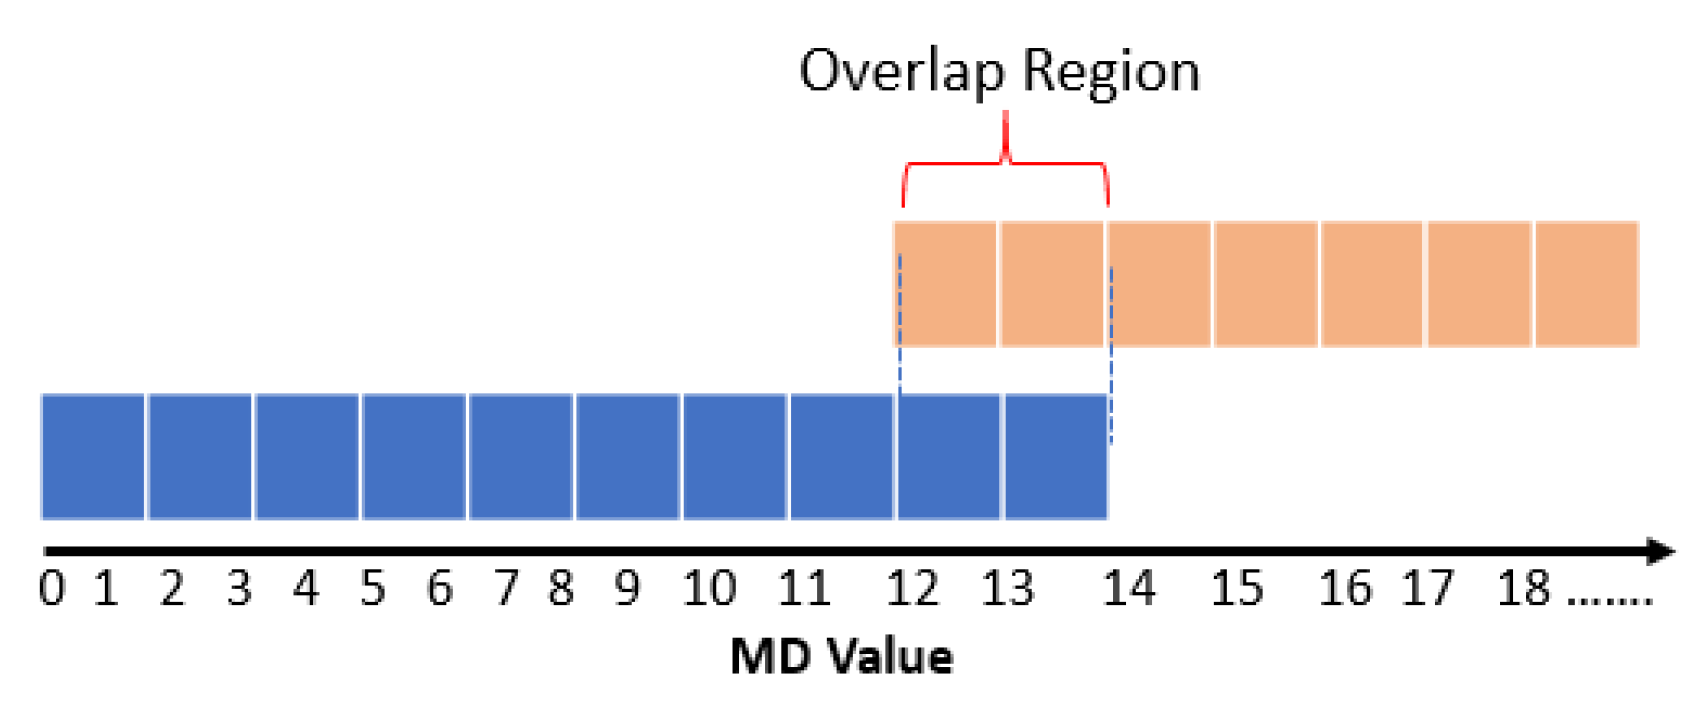
- ω is the percentage of the normal examples whose MDs are smaller than the minimum MD of the remainder abnormal examples and do not overlap with the abnormal MDs.
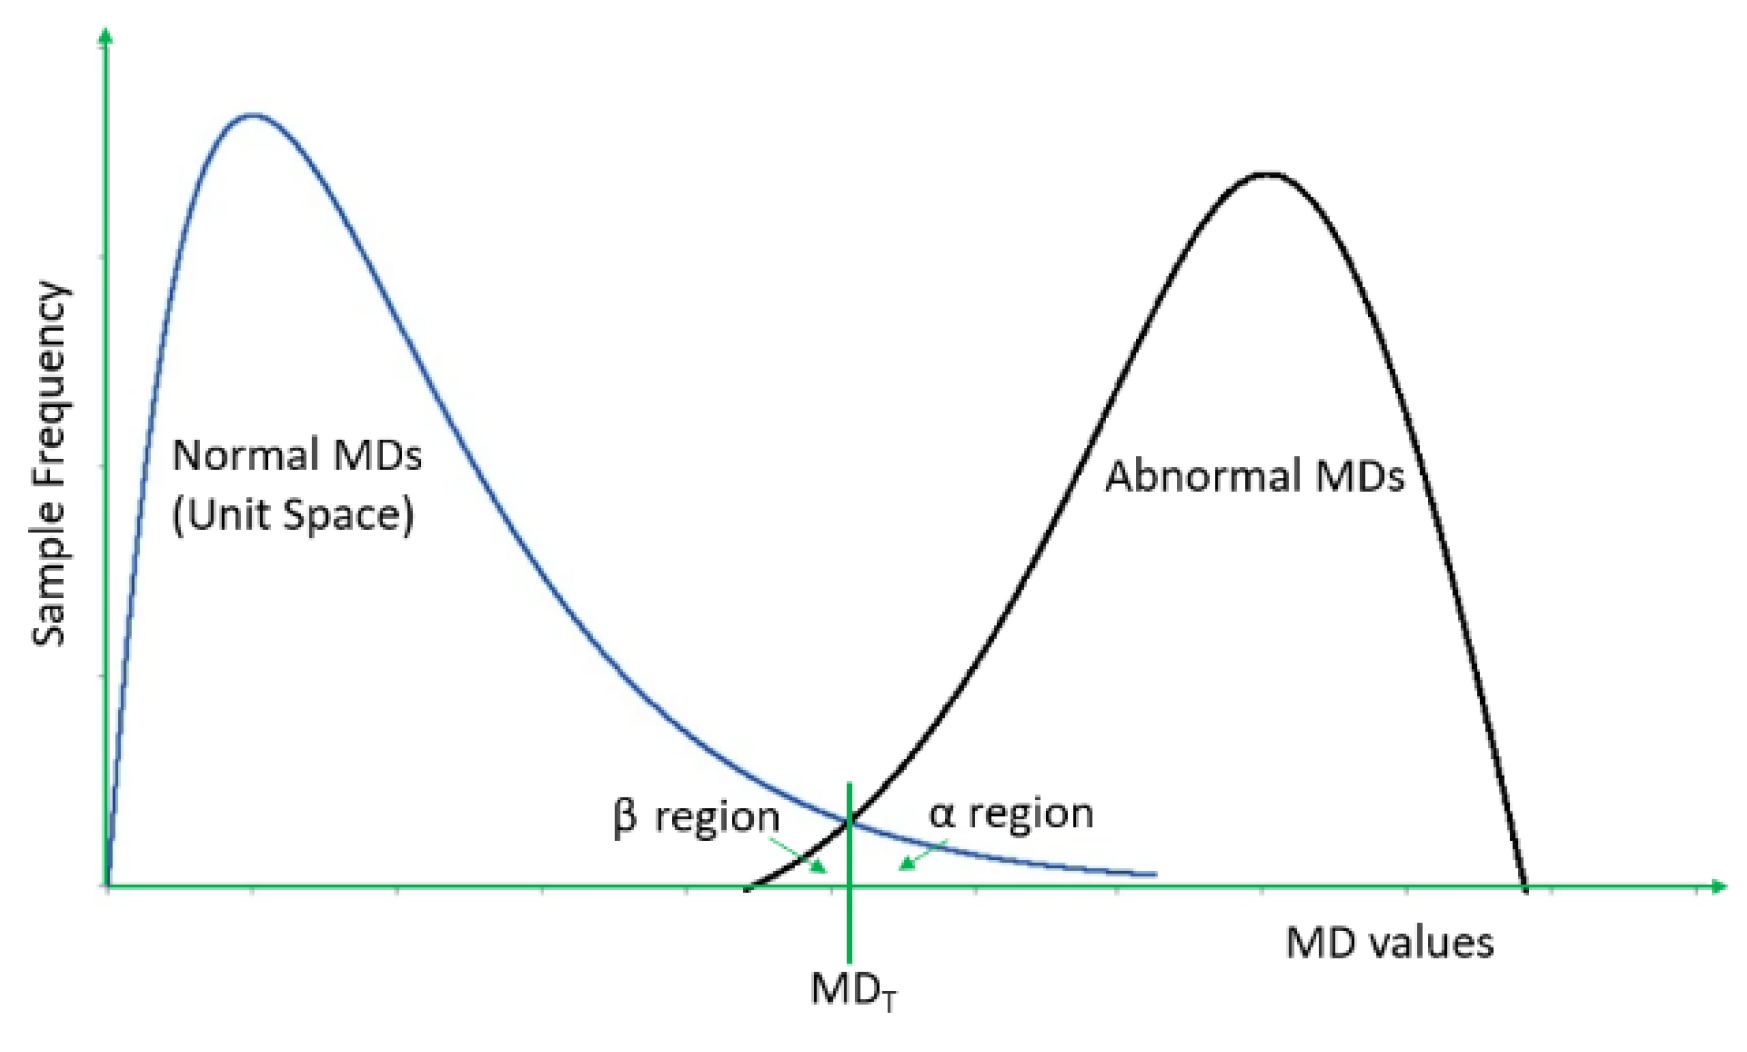
3.3. Type-I and Type-II Errors Method
- TP (True Positive) = an observation is positive and predicted as positive,
- FP (False Positive) = an observation is negative but predicted as positive,
- TN (True Negative) = an observation is negative and predicted as negative, and
- FN (False Negative) = an observation is positive but predicted as negative.
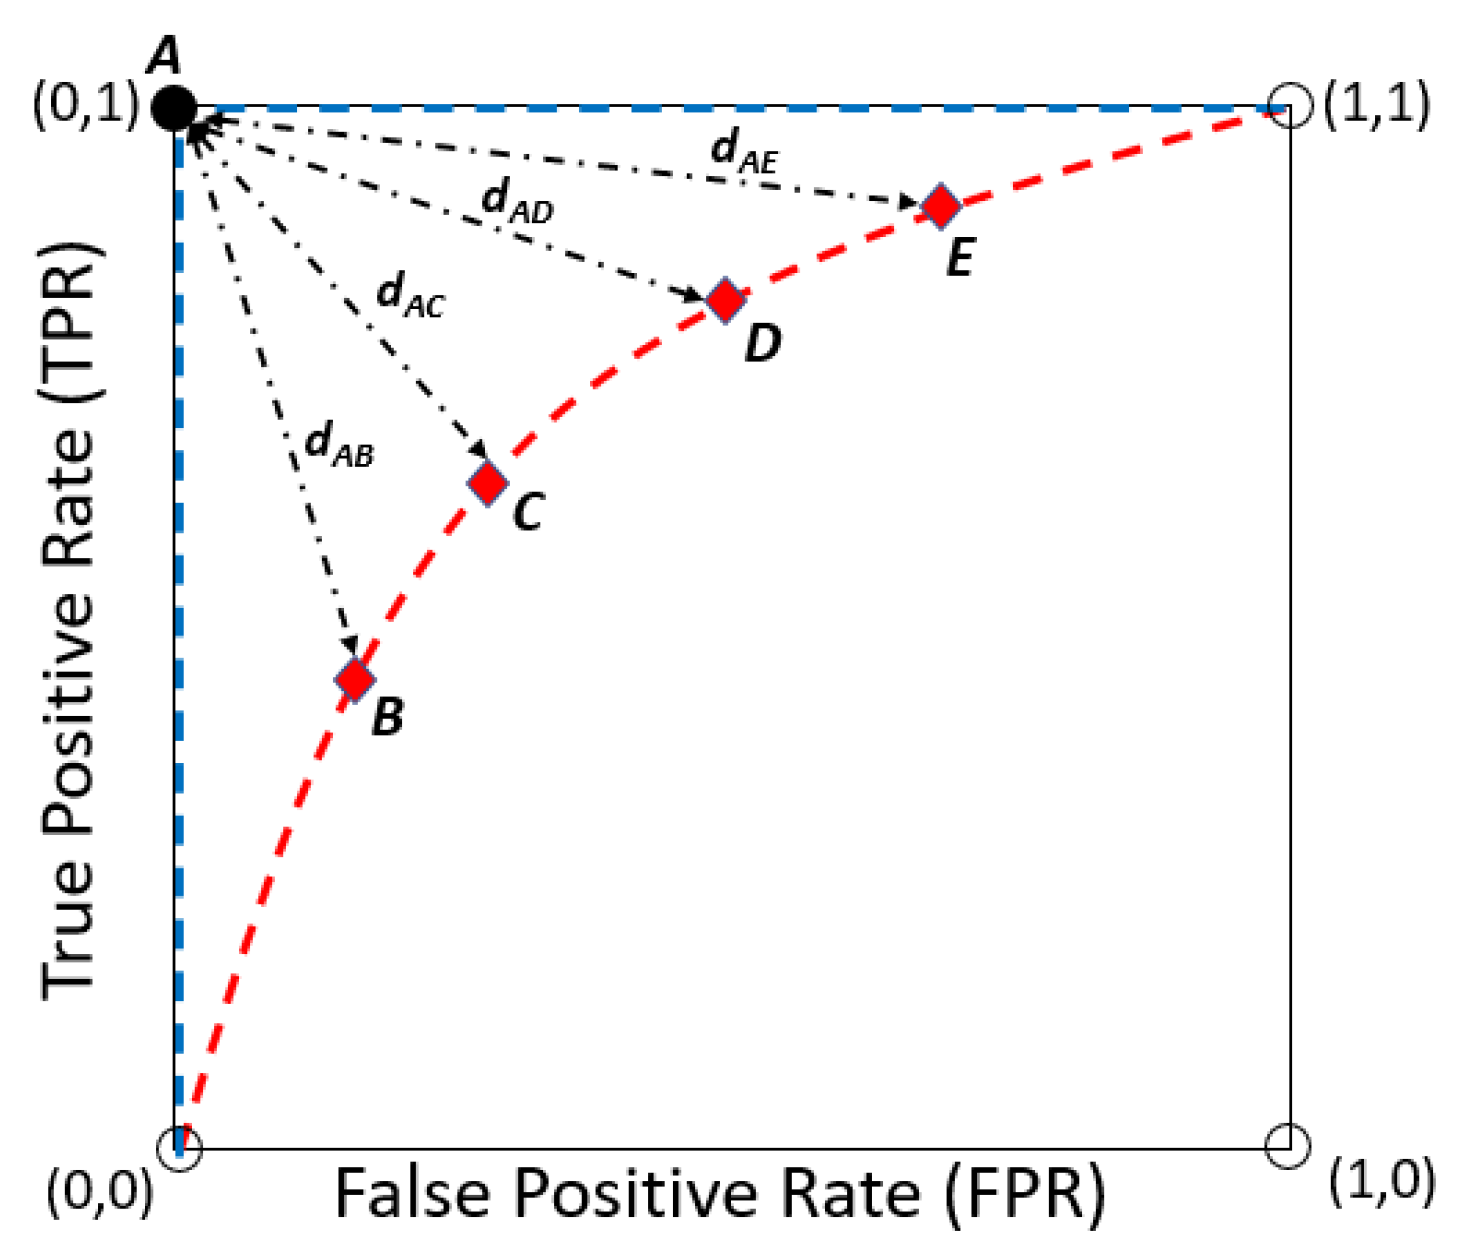
3.4. ROC Curve Method
3.5. Box–Cox Transformation
4. Datasets
4.1. Medical Diagnosis of Liver Disease Data
4.2. Taguchi’s Character Recognition
5. Results and Discussion
5.1. Variable Reduction Using Mahalanobis–Taguchi System
5.2. Optimum Thresholds
5.3. Classification Accuracy Results
6. Conclusions
Author Contributions
Funding
Institutional Review Board Statement
Informed Consent Statement
Data Availability Statement
Acknowledgments
Conflicts of Interest
References
- Ramlie, F.; Jamaludin, K.R.; Dolah, R. Optimal Feature Selection of Taguchi Character Recognition in the Mahalanobis-Taguchi System. Glob. J. Pure Appl. Math. 2016, 12, 2651–2671. [Google Scholar]
- Mahalanobis, P.C. On the generalised distance in statistics. Natl. Inst. Sci. India 1936, 2, 49–55. [Google Scholar]
- Muhamad, W.Z.A.W.; Ramlie, F.; Jamaludin, K.R. Mahalanobis-Taguchi System for Pattern Recognition: A Brief Review. Far East J. Math. Sci. (FJMS) 2017, 102, 3021–3052. [Google Scholar] [CrossRef]
- Abu, M.Y.; Jamaludin, K.R.; Ramlie, F. Pattern Recognition Using Mahalanobis-Taguchi System on Connecting Rod through Remanufacturing Process: A Case Study. Adv. Mater. Res. 2013, 845, 584–589. [Google Scholar] [CrossRef]
- Muhamad, W.Z.A.W.; Jamaludin, K.R.; Ramlie, F.; Harudin, N.; Jaafar, N.N. Criteria selection for an MBA programme based on the mahalanobis Taguchi system and the Kanri Distance Calculator. In Proceedings of the 2017 IEEE 15th Student Conference on Research and Development (SCOReD), Putrajaya, Malaysia, 13–14 December 2017; pp. 220–223. [Google Scholar] [CrossRef]
- Ghasemi, E.; Aaghaie, A.; Cudney, E.A. Mahalanobis Taguchi system: A review. Int. J. Qual. Reliab. Manag. 2015, 32, 291–307. [Google Scholar] [CrossRef]
- Sakeran, H.; Abu Osman, N.A.; Majid, M.S.A.; Rahiman, M.H.F.; Muhamad, W.Z.A.W.; Mustafa, W.A.; Osman, A.; Majid, A. Gait Analysis and Mathematical Index-Based Health Management Following Anterior Cruciate Ligament Reconstruction. Appl. Sci. 2019, 9, 4680. [Google Scholar] [CrossRef]
- Taguchi, G.; Rajesh, J. New Trends in Multivariate Diagnosis. Sankhyā Indian J. Stat. Ser. B 2000, 62, 233–248. [Google Scholar]
- Liparas, D.; Angelis, L.; Feldt, R. Applying the Mahalanobis-Taguchi strategy for software defect diagnosis. Autom. Softw. Eng. 2011, 19, 141–165. [Google Scholar] [CrossRef]
- Chang, Z.P.; Li, Y.W.; Fatima, N. A theoretical survey on Mahalanobis-Taguchi system. Measurement 2019, 136, 501–510. [Google Scholar] [CrossRef]
- El-Banna, M. A novel approach for classifying imbalance welding data: Mahalanobis genetic algorithm (MGA). Int. J. Adv. Manuf. Technol. 2015, 77, 407–425. [Google Scholar] [CrossRef]
- Huang, C.-L.; Hsu, T.-S.; Liu, C.-M. Modeling a dynamic design system using the Mahalanobis Taguchi system—Two steps optimal based neural network. J. Stat. Manag. Syst. 2010, 13, 675–688. [Google Scholar] [CrossRef]
- Su, C.-T.; Hsiao, Y.-H. An Evaluation of the Robustness of MTS for Imbalanced Data. IEEE Trans. Knowl. Data Eng. 2007, 19, 1321–1332. [Google Scholar] [CrossRef]
- Huang, C.-L.; Chen, Y.H.; Wan, T.-L.J. The mahalanobis taguchi system—Adaptive resonance theory neural network algorithm for dynamic product designs. J. Inf. Optim. Sci. 2012, 33, 623–635. [Google Scholar] [CrossRef]
- Huang, C.-L.; Hsu, T.-S.; Liu, C.-M. The Mahalanobis–Taguchi system—Neural network algorithm for data-mining in dynamic environments. Expert Syst. Appl. 2009, 36, 5475–5480. [Google Scholar] [CrossRef]
- Wang, N.; Saygin, C.; Sun, S.D. Impact of Mahalanobis space construction on effectiveness of Mahalanobis-Taguchi system. Int. J. Ind. Syst. Eng. 2013, 13, 233. [Google Scholar] [CrossRef]
- Muhamad, W.Z.A.W.; Jamaludin, K.R.; Zakaria, S.A.; Yahya, Z.R.; Saad, S.A. Combination of feature selection approaches with random binary search and Mahalanobis Taguchi System in credit scoring. AIP Conf. Proc. 2018, 1974, 20004. [Google Scholar] [CrossRef]
- Kumar, S.; Chow, T.W.S.; Pecht, M. Approach to Fault Identification for Electronic Products Using Mahalanobis Distance. IEEE Trans. Instrum. Meas. 2010, 59, 2055–2064. [Google Scholar] [CrossRef]
- Hwang, I.-J.; Park, G.-J. A multi-objective optimization using distribution characteristics of reference data for reverse engineering. Int. J. Numer. Methods Eng. 2010, 85, 1323–1340. [Google Scholar] [CrossRef]
- Feng, S.; Hiroyuki, O.; Hidennori, T.; Yuichi, K.; Hu, S. Qualitative and quantitative analysis of gmaw welding fault based on mahalanobis distance. Int. J. Precis. Eng. Manuf. 2011, 12, 949–955. [Google Scholar] [CrossRef]
- Guo, W.; Yin, R.; Li, G.; Zhao, N. Research on Selection of Enterprise Management-Control Model Based on Mahalanobis Distance. In The 19th International Conference on Industrial Engineering and Engineering Management; Springer: Berlin, Germany, 2013; pp. 555–564. [Google Scholar] [CrossRef]
- Muhamad, W.Z.A.W.; Jamaludin, K.R.; Yahya, Z.R.; Ramlie, F. A Hybrid Methodology for the Mahalanobis-Taguchi System Using Random Binary Search-Based Feature Selection. Far East J. Math. Sci. (FJMS) 2017, 101, 2663–2675. [Google Scholar] [CrossRef]
- Teshima, S.; Hasegawa, Y. Quality Recognition & Prediction: Smarter Pattern Technology with the Mahalanobis-Taguchi System; Momentum Press: New York, NY, USA, 2012. [Google Scholar]
- Hedayat, A.S.; Sloane, N.J.A.; Stufken, J. Orthogonal Arrays: Theory and Applications, 1st ed.; Springer: New York, NY, USA, 1999. [Google Scholar]
- Ramlie, F.; Muhamad, W.Z.A.W.; Jamaludin, K.R.; Cudney, E.; Dollah, R. A Significant Feature Selection in the Mahalanobis Taguchi System using Modified-Bees Algorithm. Int. J. Eng. Res. Technol. 2020, 13, 117–136. [Google Scholar] [CrossRef]
- Taguchi, G.; Jugulum, R. The Mahalanobis-Taguchi Strategy: A Pattern Technology System, 1st ed.; John Wiley & Sons, Inc.: New York, NY, USA, 2002. [Google Scholar]
- Park, S.H. Robust Design and Analysis for Quality Engineering, 1st ed.; Chapman & Hall: London, UK, 1996. [Google Scholar]
- Menten, T. Quality Engineering Using Robust Design. Technometrics 1991, 33, 236. [Google Scholar] [CrossRef]
- Taguchi, G.; Rajesh, J.; Taguchi, S. Computer-Based Robust Engineering: Essentials for DFSS, 1st ed.; American Society for Quality: Milwaukee, WI, USA, 2004. [Google Scholar]
- Taguchi, G.; Chowdhury, S.; Wu, Y. Taguchi’s Quality Engineering Handbook, 1st ed.; John Wiley & Sons, Inc.: Hoboken, NJ, USA, 2005. [Google Scholar]
- Lee, Y.-C.; Teng, H.-L. Predicting the financial crisis by Mahalanobis–Taguchi system—Examples of Taiwan’s electronic sector. Expert Syst. Appl. 2009, 36, 7469–7478. [Google Scholar] [CrossRef]
- Huang, J.C.Y. Reducing Solder Paste Inspection in Surface-Mount Assembly Through Mahalanobis–Taguchi Analysis. IEEE Trans. Electron. Packag. Manuf. 2010, 33, 265–274. [Google Scholar] [CrossRef]
- Tanner, W.P., Jr.; Swets, J.A. A decision-making theory of visual detection. Psychol. Rev. 1954, 61, 401–409. [Google Scholar] [CrossRef]
- Krzanowski, W.J.; Hand, D.J. ROC Curves for Continuous Data; Chapman and Hall/CRC: London, UK, 2009. [Google Scholar]
- Lantz, B. Machine Learning with R. Birmingham; Packt Publishing Ltd.: Birmingham, UK, 2013. [Google Scholar]
- Alcalá-Fdez, J.; Sánchez, L.; García, S.; Del Jesus, M.J.; Ventura, S.; Garrell, J.M.; Otero, J.; Romero, C.; Bacardit, J.; Rivas, V.M.; et al. KEEL: A software tool to assess evolutionary algorithms for data mining problems. Soft Comput. 2008, 13, 307–318. [Google Scholar] [CrossRef]
- Jain, A.; Duin, R.; Mao, J. Statistical pattern recognition: A review. IEEE Trans. Pattern Anal. Mach. Intell. 2000, 22, 4–37. [Google Scholar] [CrossRef]
- Taguchi, G.; Chowdhury, S.; Wu, Y. The Mahalanobis-Taguchi System, 1st ed.; McGraw-Hill: New York, NY, USA, 2001. [Google Scholar]
- Taguchi, G. Method for Pattern Recognition. U.S. Patent 5,684,892, 4 November 1997. [Google Scholar]
- Ho, Y.C.; Pepyne, D.L. Simple Explanation of the No-Free-Lunch Theorem and Its Implications. J. Optim. Theory Appl. 2002, 115, 549–570. [Google Scholar] [CrossRef]
- Hawkins, D.M. Discussion. Technometrics 2003, 45, 25–29. [Google Scholar] [CrossRef]
- Woodall, W.H.; Koudelik, R.; Tsui, K.-L.; Kim, S.B.; Stoumbos, Z.G.; Carvounis, C.P. A Review and Analysis of the Mahalanobis—Taguchi System. Technometrics 2003, 45, 1–15. [Google Scholar] [CrossRef]
- Abraham, B.; Variyath, A.M. Discussion. Technometrics 2003, 45, 22–24. [Google Scholar] [CrossRef]
- Bach, J.; Schroeder, P.J. Pairwise testing: A best practice that isn’t. In Proceedings of the 22nd Pacific Northwest Software Quality Conference, Portland, OR, USA, 11–13 October 2004; pp. 180–196. [Google Scholar]
- Pal, A.; Maiti, J. Development of a hybrid methodology for dimensionality reduction in Mahalanobis–Taguchi system using Mahalanobis distance and binary particle swarm optimization. Expert Syst. Appl. 2010, 37, 1286–1293. [Google Scholar] [CrossRef]
- Thangavel, K.; Pethalakshmi, A. Dimensionality reduction based on rough set theory: A review. Appl. Soft Comput. 2009, 9, 1–12. [Google Scholar] [CrossRef]
- Blum, C.; Roli, A. Metaheuristics in Combinatorial Optimization: Overview and Conceptual Comparison. ACM Comput. Surv. 2003, 35, 268–308. [Google Scholar] [CrossRef]
- Yang, X.-S. Nature-Inspired Metaheuristic Algorithms, 2nd ed.; Luniver Press: Frome, UK, 2010. [Google Scholar]
- Foster, C.R.; Jugulum, R.; Frey, D.D. Evaluating an adaptive One-Factor-At-a-Time search procedure within the Mahalanobis-Taguchi System. Int. J. Ind. Syst. Eng. 2009, 4, 600. [Google Scholar] [CrossRef]
- Iquebal, A.S.; Pal, A.; Ceglarek, D.; Tiwari, M.K. Enhancement of Mahalanobis–Taguchi System via Rough Sets based Feature Selection. Expert Syst. Appl. 2014, 41, 8003–8015. [Google Scholar] [CrossRef]



| Factor | |||||||
|---|---|---|---|---|---|---|---|
| Run | 1 | 2 | 3 | 4 | 5 | 6 | 7 |
| 1 | 1 | 1 | 1 | 1 | 1 | 1 | 1 |
| 2 | 1 | 1 | 1 | 2 | 2 | 2 | 2 |
| 3 | 1 | 2 | 2 | 1 | 1 | 2 | 2 |
| 4 | 1 | 2 | 2 | 2 | 2 | 1 | 1 |
| 5 | 2 | 1 | 2 | 1 | 2 | 1 | 2 |
| 6 | 2 | 1 | 2 | 2 | 1 | 2 | 1 |
| 7 | 2 | 2 | 1 | 1 | 2 | 2 | 1 |
| 8 | 2 | 2 | 1 | 2 | 1 | 1 | 2 |
| Number of Repetition | |||||
|---|---|---|---|---|---|
| Combinations | Col 1 & Col 2 | Col 1 & Col 3 | Col 1 & Col 7 | Col 3 & Col 6 | |
| 1 | 1 | 2 | 2 | 2 | 2 |
| 1 | 2 | 2 | 2 | 2 | 2 |
| 1 | 2 | 2 | 2 | 2 | 2 |
| 2 | 2 | 2 | 2 | 2 | 2 |
| 2 | 1 | 2 | 2 | 2 | 2 |
| Factor | MD Computation | SNR | ||||||||||
|---|---|---|---|---|---|---|---|---|---|---|---|---|
| Run | 1 | 2 | 3 | 4 | 5 | 6 | 7 | |||||
| 1 | 1 | 1 | 1 | 1 | 1 | 1 | 1 | MD1 | MD2 | MD3 | MD4 | SNR1 |
| 2 | 1 | 1 | 1 | 2 | 2 | 2 | 2 | MD1 | MD2 | MD3 | MD4 | SNR2 |
| 3 | 1 | 2 | 2 | 1 | 1 | 2 | 2 | MD1 | MD2 | MD3 | MD4 | SNR3 |
| 4 | 1 | 2 | 2 | 2 | 2 | 1 | 1 | MD1 | MD2 | MD3 | MD4 | SNR4 |
| 5 | 2 | 1 | 2 | 1 | 2 | 1 | 2 | MD1 | MD2 | MD3 | MD4 | SNR5 |
| 6 | 2 | 1 | 2 | 2 | 1 | 2 | 1 | MD1 | MD2 | MD3 | MD4 | SNR6 |
| 7 | 2 | 2 | 1 | 1 | 2 | 2 | 1 | MD1 | MD2 | MD3 | MD4 | SNR7 |
| 8 | 2 | 2 | 1 | 2 | 1 | 1 | 2 | MD1 | MD2 | MD3 | MD4 | SNR8 |
| Averaging | SNRL1 | SNRL1 | SNRL1 | SNRL1 | SNRL1 | SNRL1 | SNRL1 | |||||
| SNRL2 | SNRL2 | SNRL2 | SNRL2 | SNRL2 | SNRL2 | SNRL2 | ||||||
| Substraction | Gain(+/−) | Gain(+/−) | Gain(+/−) | Gain(+/−) | Gain(+/−) | Gain(+/−) | Gain(+/−) | |||||
| Predicted Class | ||
|---|---|---|
| True Class | Positive | Negative |
| Positive | TP | FN |
| Negative | FN | TN |
| Dataset | No. of Original Variables | No. of Training Data | No. of Testing Data | |||
|---|---|---|---|---|---|---|
| Normal | Abnormal | Normal | Abnormal | |||
| 1 | Appendicitis | 7 | 42 | 10 | 43 | 11 |
| 2 | Banana | 2 | 1188 | 1462 | 1188 | 1462 |
| 3 | Bupa | 6 | 100 | 72 | 100 | 73 |
| 4 | Coil2000 | 85 | 4618 | 293 | 4618 | 293 |
| 5 | Haberman-2 | 3 | 112 | 40 | 113 | 41 |
| 6 | Heart | 13 | 75 | 60 | 75 | 60 |
| 7 | Ionosphere | 32 | 112 | 63 | 113 | 63 |
| 8 | Magic | 10 | 6166 | 3344 | 6166 | 3344 |
| 9 | Monk2 | 6 | 102 | 114 | 102 | 114 |
| 10 | Phoneme | 5 | 1909 | 793 | 1909 | 793 |
| 11 | Pima | 8 | 250 | 134 | 250 | 134 |
| 12 | Ring | 20 | 1868 | 1832 | 1868 | 1832 |
| 13 | Sonar | 60 | 65 | 48 | 46 | 49 |
| 14 | Spambase | 57 | 1392 | 906 | 1393 | 906 |
| 15 | Spectfheart | 44 | 106 | 27 | 106 | 28 |
| 16 | Titanic | 3 | 745 | 355 | 745 | 356 |
| 17 | Wdbc | 30 | 178 | 106 | 179 | 106 |
| 18 | Wisconsin | 9 | 222 | 119 | 222 | 120 |
| 19 | Medical Diagnosis of Liver Disease | 17 | 200 | 17 | 43 | 34 |
| 20 | Taguchi Character Recognition | 14 | 16 | 9 | 2 | 37 |
| S.No | Variables | Notation | Notation for Analysis |
|---|---|---|---|
| 1 | Age | X1 | |
| 2 | Sex | X2 | |
| 3 | Total protein in blood | TP | X3 |
| 4 | Albumin in blood | Alb | X4 |
| 5 | Cholinesterase | Che | X5 |
| 6 | Glutamate O transaminase | GOT | X6 |
| 7 | Glutamate P transaminase | GPT | X7 |
| 8 | Lactate dehydrogenase | LHD | X8 |
| 9 | Alkanline phosphatase | Alp | X9 |
| 10 | r-Glutamy transpeptidase | r-GPT | X10 |
| 11 | Leucine aminopeptidase | LAP | X11 |
| 12 | Total cholesterol | TCH | X12 |
| 13 | Triglyceride | TG | X13 |
| 14 | Phospholipid | PL | X14 |
| 15 | Creatinime | Cr | X15 |
| 16 | Blood urea nitrogen | BUN | X16 |
| 17 | Uric acid | UA | X17 |
| No. of Variables | |||||
|---|---|---|---|---|---|
| Dataset | Before Optimize | After Optimize | Remarks | % Variable Reduction | |
| 1 | Appendicitis | 7 | 4 | Remove 3 variables | 42.86 |
| 2 | Banana | 2 | 2 | Maintain Original Variables | 0 |
| 3 | Bupa | 6 | 5 | Remove 1 variable | 16.67 |
| 4 | Coil2000 | 85 | 48 | Remove 37 Variables | 43.53 |
| 5 | Haberman-2 | 3 | 3 | Maintain Original Variables | 0 |
| 6 | Heart | 13 | 9 | Remove 4 Variables | 30.77 |
| 7 | Ionosphere | 32 | 26 | Remove 6 variables | 18.75 |
| 8 | Magic | 10 | 9 | Remove 1 variable | 10.0 |
| 9 | Monk2 | 6 | 6 | Maintain Original Variables | 0 |
| 10 | phoneme | 5 | 4 | Remove 1 variable | 20 |
| 11 | Pima | 8 | 6 | Remove 2 variables | 25 |
| 12 | Ring | 20 | 20 | Maintain Original Variables | 0 |
| 13 | Sonar | 60 | 58 | Remove 2 variables | 3.33 |
| 14 | Spambase | 57 | 28 | Remove 29 variables | 50.88 |
| 15 | Spectfheart | 44 | 38 | Remove 6 variables | 13.64 |
| 16 | Titanic | 3 | 2 | Remove 1 variable | 33.33 |
| 17 | Wdbc | 30 | 13 | Remove 17 variables | 56.67 |
| 18 | Wisconsin | 9 | 6 | Remove 3 variables | 33.33 |
| 19 | Medical Diagnosis of Liver Disease | 17 | 8 | Remove 9 variables | 52.94 |
| 20 | Taguchi Character Recognition | 14 | 14 | Maintain Original Variables | 0 |
| Training Dataset | Suggested MDT | |||||||||
|---|---|---|---|---|---|---|---|---|---|---|
| Dataset | Optimum Variables after Optimize | Normal Samples | Abnormal Samples | TypeI-TypeII | ROC Curve | Chebyshev’s Theorem | Box-Cox (λ Value) | Box-Cox (MD Transformed) | Box-Cox (MD Term) | |
| 1 | Appendicitis | 4 | 42 | 10 | 2.27 | 2.27 | 1.98 | 0.30 | 0.90 | 2.22 |
| 2 | Banana | 2 | 1188 | 1462 | 0.44 | 0.76 | 1.93 | 0.80 | −0.60 | 0.44 |
| 3 | Bupa | 5 | 100 | 72 | 0.37 | 0.57 | 2.27 | 0.20 | −0.90 | 0.37 |
| 4 | Coil2000 | 48 | 4618 | 293 | 0.90 | 0.90 | 1.79 | −0.30 | −0.10 | 0.91 |
| 5 | Haberman-2 | 3 | 112 | 40 | 1.16 | 1.16 | 2.07 | 0.30 | 0.10 | 1.10 |
| 6 | Heart | 9 | 75 | 60 | 1.33 | 1.33 | 1.56 | 0.50 | 0.30 | 1.32 |
| 7 | Ionosphere | 26 | 112 | 63 | 3.64 | 3.64 | 2.92 | 0.30 | 1.90 | 3.55 |
| 8 | Magic | 9 | 6166 | 3344 | 1.19 | 1.11 | 2.58 | 0.00 | 0.10 | 1.22 |
| 9 | Monk2 | 6 | 102 | 114 | 1.39 | 1.32 | 1.23 | 1.60 | 0.40 | 1.36 |
| 10 | phoneme | 4 | 1909 | 793 | 0.83 | 1.00 | 1.91 | 0.50 | −0.20 | 0.81 |
| 11 | Pima | 6 | 250 | 134 | 1.15 | 1.15 | 1.98 | 0.30 | 0.10 | 1.10 |
| 12 | Ring | 20 | 1868 | 1832 | 0.73 | 0.97 | 1.33 | 0.70 | 0.80 | 1.89 |
| 13 | Sonar | 58 | 65 | 48 | 4.39 | 4.39 | 1.38 | 10.80 | 19.90 | 1.65 |
| 14 | Spambase | 28 | 1392 | 906 | 1.10 | 1.10 | 3.85 | 0.20 | 0.10 | 1.10 |
| 15 | Spectfheart | 38 | 106 | 27 | 2.31 | 0.86 | 1.45 | 0.30 | 0.90 | 2.22 |
| 16 | Titanic | 2 | 745 | 355 | 3.08 | 3.08 | 2.49 | 0.30 | 1.30 | 3.00 |
| 17 | Wdbc | 13 | 178 | 106 | 2.02 | 2.02 | 2.56 | 0.00 | 0.70 | 2.01 |
| 18 | Wisconsin | 6 | 222 | 119 | 2.80 | 3.19 | 6.08 | 0.30 | 1.20 | 2.79 |
| 19 | Medical Diagnosis of Liver Disease | 8 | 200 | 17 | 11.52 | 11.52 | 3.63 | 0.20 | 3.10 | 11.16 |
| 20 | Taguchi Character Recognition | 14 | 16 | 9 | 11.44 | 11.44 | 1.53 | 211.00 | 211.00 | 1.05 |
| Testing Dataset | Classification Accuracy (%) Based on MDT Obtained Via: | |||||||
|---|---|---|---|---|---|---|---|---|
| S.No | Dataset | Optimum Variables after Optimize | Normal Samples | Abnormal Samples | TypeI-TypeII (%) | ROC Curve (%) | Chebyshev’s Theorem (%) | Box-Cox Transformation (%) |
| 1 | Appendicitis | 4 | 43 | 11 | 70.37 | 70.37 | 66.67 | 70.37 |
| 2 | Banana | 2 | 1188 | 1462 | 68.49 | 62.11 | 44.91 | 68.49 |
| 3 | Bupa | 5 | 100 | 73 | 50.87 | 55.49 | 57.23 | 50.87 |
| 4 | Coil2000 | 48 | 4618 | 293 | 57.95 | 57.95 | 87.62 | 58.79 |
| 5 | Haberman-2 | 3 | 113 | 41 | 65.58 | 65.58 | 74.68 | 61.69 |
| 6 | Heart | 9 | 75 | 60 | 74.81 | 74.81 | 75.56 | 74.81 |
| 7 | Ionosphere | 26 | 113 | 63 | 95.45 | 95.45 | 93.75 | 95.45 |
| 8 | Magic | 9 | 6166 | 3344 | 74.13 | 73.14 | 75.87 | 74.17 |
| 9 | Monk2 | 6 | 102 | 114 | 55.09 | 53.24 | 53.24 | 53.70 |
| 10 | phoneme | 4 | 1909 | 793 | 62.84 | 65.06 | 72.13 | 62.36 |
| 11 | Pima | 6 | 250 | 134 | 65.36 | 65.36 | 67.97 | 65.89 |
| 12 | Ring | 20 | 1868 | 1832 | 60.05 | 74.95 | 92.41 | 98.14 |
| 13 | Sonar | 58 | 46 | 49 | 52.63 | 52.63 | 51.58 | 51.58 |
| 14 | Spambase | 28 | 1393 | 906 | 82.51 | 82.51 | 78.60 | 82.51 |
| 15 | Spectfheart | 38 | 106 | 28 | 64.18 | 29.85 | 49.25 | 63.43 |
| 16 | Titanic | 2 | 745 | 356 | 74.21 | 74.21 | 74.21 | 74.21 |
| 17 | Wdbc | 13 | 179 | 106 | 91.23 | 91.23 | 92.63 | 91.23 |
| 18 | Wisconsin | 6 | 222 | 120 | 96.20 | 90.63 | 90.31 | 96.20 |
| 19 | Medical Diagnosis of Liver Disease | 8 | 43 | 34 | 100 | 100 | 84.00 | 100 |
| 20 | Taguchi Character Recognition | 14 | 2 | 37 | 97.44 | 97.44 | 94.87 | 94.87 |
Publisher’s Note: MDPI stays neutral with regard to jurisdictional claims in published maps and institutional affiliations. |
© 2021 by the authors. Licensee MDPI, Basel, Switzerland. This article is an open access article distributed under the terms and conditions of the Creative Commons Attribution (CC BY) license (https://creativecommons.org/licenses/by/4.0/).
Share and Cite
Ramlie, F.; Muhamad, W.Z.A.W.; Harudin, N.; Abu, M.Y.; Yahaya, H.; Jamaludin, K.R.; Abdul Talib, H.H. Classification Performance of Thresholding Methods in the Mahalanobis–Taguchi System. Appl. Sci. 2021, 11, 3906. https://doi.org/10.3390/app11093906
Ramlie F, Muhamad WZAW, Harudin N, Abu MY, Yahaya H, Jamaludin KR, Abdul Talib HH. Classification Performance of Thresholding Methods in the Mahalanobis–Taguchi System. Applied Sciences. 2021; 11(9):3906. https://doi.org/10.3390/app11093906
Chicago/Turabian StyleRamlie, Faizir, Wan Zuki Azman Wan Muhamad, Nolia Harudin, Mohd Yazid Abu, Haryanti Yahaya, Khairur Rijal Jamaludin, and Hayati Habibah Abdul Talib. 2021. "Classification Performance of Thresholding Methods in the Mahalanobis–Taguchi System" Applied Sciences 11, no. 9: 3906. https://doi.org/10.3390/app11093906
APA StyleRamlie, F., Muhamad, W. Z. A. W., Harudin, N., Abu, M. Y., Yahaya, H., Jamaludin, K. R., & Abdul Talib, H. H. (2021). Classification Performance of Thresholding Methods in the Mahalanobis–Taguchi System. Applied Sciences, 11(9), 3906. https://doi.org/10.3390/app11093906


