Article

Investigation of Seal Cavity Leakage Flow Effect on Multistage Axial Compressor Aerodynamic Performance with a Circumferentially Averaged Method

1
Aeroengine Simulation Research Center, School of Energy and Power Engineering, Beihang University, Beijing 100191, China
2
Jiangxi Research Institute, Beihang University, Nanchang 330096, China
*
Author to whom correspondence should be addressed.
Appl. Sci. 2021, 11(9), 3937; https://doi.org/10.3390/app11093937
Submission received: 7 March 2021 / Revised: 23 April 2021 / Accepted: 24 April 2021 / Published: 27 April 2021
(This article belongs to the Section Mechanical Engineering)

Abstract

:

Featured Application

This method can be used to quickly analyze the seal cavity leakage effect during compressor design as well as performance degradation caused by labyrinth wear in multistage axial-flow compressors. After being verified in turbine, it can be further used to consider the influence of seal cavity leakage flow in whole aero-engine simulation.

Abstract

The seal cavity leakage flow has a considerable impact on the performance of the aeroengine, especially on the multistage compressor. Thus, a quasi-three-dimensional simulation program named CAM is developed basing on circumferentially averaged throughflow method. The program enables a rapid diagnosis for the performance degradation of multistage compressor caused by labyrinth wear. The coupling flow field between the seal cavity leakage flow and the main flow field at the root of the shrouded stator of a high-loading three-stage compressor with inlet guide vanes (IGV) was simulated by CAM and the results indicate that seal cavity leakage flow has a significant impact on the overall performance of the compressor. That is, for a 1% increase in the seal-tooth clearance-to-span ratio, the decrease in total pressure ratio was 2.6%, and the reduction in efficiency was 0.6%. Stage performance shows that the seal cavity leakage flow reduces the pressurization capacity of the current stator and the work capacity of the downstream rotor, but has little effect on the upstream blade row. Spanwise distribution of blade element performance shows that the leakage flow leads to an increased flow blockage near the hub, resulting in spanwise migration. The incidence of the stator and rear rotor then change through the entire span. The leakage flow leads to the flow blockage and migration and hence changes the incidence angle, which results in the deterioration of compressor performance.

1. Introduction

Deterioration, induced by operational and environmental effects, leads to a gradual decline of the performance of an aircraft engine [1,2,3]. Therefore, requirements for rapid full-engine simulations occur. Numerical calculation methods for aeroengines can be divided into three different types: zero-dimensional, two-dimensional/quasi three-dimensional and three-dimensional. The zero-dimensional calculation does not need detailed geometric parameters, has very low requirements in terms of computer resources and is very fast. It is suitable for scheme evaluation and preliminary design. However, the accuracy of such a calculation depends on the characteristic lines of the existing components and reliable experimental data. At the same time, the flow field of the main channel and the secondary air system (SAS) of the engine cannot be simulated, so the flow field information cannot be used in the optimization of specific components.
Compared with the zero-dimensional simulation, 3D simulation can describe the three-dimensional relationship between the components and the whole flow channel, and can be used to discuss the complex physical phenomena and flow field structure inside the components. However, in order to obtain such abundant flow field details, a large amount of computer resources are required. In the current literature, there are a few published studies on 3D high fidelity simulation calculation of an aeroengine. The center for turbulence simulation (CITS) of Stanford University has carried out a series of research aimed at developing integrated high fidelity aeroengine simulation technology and has been able to achieve preliminary simulation of the whole aircraft engine [4,5]. Medic et al. [6] completed the simulation of a 20 degrees sector of a gas turbine engine including the fan, compressors, turbines, the exit nozzle and the combustor. The simulation was performed on two different meshes; one was fine, and the other was coarse. For the coarse mesh which contained 14 million cells, the simulation was performed on 700 processors and required around two weeks to converge [7,8,9,10]. Three-dimensional simulation of the aeroengine main channel requires a computational speed of more than 1012 per second [11]. Full 3D simulation requires enormous amounts of relatively accurate data such as boundary conditions and initial conditions, which is not easy to obtain. Wang et al. [12] pointed out that even if the current computing capabilities can meet these requirements, considering the large number of resources required for full 3D calculations, it is still difficult to use the full 3D simulation as a tool for conventional research in Aeroengine Design in the short term.
In contrast with 0D and 3D simulation, quasi three-dimensional simulation exhibits unique advantages. First of all, quasi-3D simulation can provide more abundant S2 flow field information. Secondly, quasi-3D simulation is easy to implement due to the small amount of calculation. Finally, for specific cases, the quasi-3D simulation can use empirical or semi-empirical models, such as loss and blockage models obtained from the experimental data, to modify the flow field results, so as to avoid the amplification of the flow field calculation error caused by the limitations of the turbulence model.
Last but not least, the simulations of full-engine in the literature mentioned above have not included the SAS, which is known to have a considerable impact on the engine performance [13]. As a part of the SAS, seal cavity leakage flow occurs in the seal cavity at shrouded stator root (in compressors and turbines) or shrouded rotor tip (usually in turbines). Figure 1 shows the seal cavity leakage in a compressor with shrouded stator. Although the flow exchange between the main channel and the cavity below the axial gap is often suppressed by engineering measures such as a labyrinth seal, it is difficult to fully eliminate the leakage from the axial gap. In recent years, more and more studies have shown that seal cavity leakage flow will obviously deteriorate the performance of axial compressor and turbine in aeroengines, and such influence cannot be ignored. Usually, for every 1% increase in seal-tooth clearance-to-span ratio, the decrease in pressure rise is 3%, and the reduction in efficiency is 1% [14,15]. As a reference, a usual relationship between efficiency deterioration and blade tip clearance in an axial compressor is that the compressor efficiency decreases by 1.5% when the rotor tip clearance increases by 1% with respect to the span [15,16,17,18]. For a cantilevered stator, the decrease ranges from 1.0% to 2.0% [15,17,19]. Mahmood and Turner [20] investigated the effect of seal cavity leakage flow on 1.5 stages of a 10 stage axial flow compressor. Numerical results indicate 0.86% efficiency reduction for a seal clearance of 1.3% span. Kato et al. [21] have performed a full three-dimensional unsteady calculation for a high-speed six-stage advanced axial-flow compressor. The calculation results with a sealed cavity under the stator blade reduce the efficiency by 1.7% compared with the results without a cavity. Similar to compressors, losses caused by leakage through the shrouded cavity contribute significantly to the overall losses of turbines [22]. Rosic et al. [23] compared experimental data and numerical simulations in a three-stage turbine and pointed out that calculation of the leakage flows and cavities is necessary in order to get good agreement between calculation and measurement. The flow in a two-stage LP-turbine at relatively low Reynolds numbers is simulated by Kuerner et al. [24] with an in-house 3D code. The overall isentropic efficiency derived from computations with cavities lies within 0.2% of the experimental result, and that is 1.3% closer than computations without cavities.
Considering the advantages of the two-dimensional method in the simulation of full-aeroengine and the non-negligible influence of the seal cavity leakage flow on the performance of turbomachinery, we have reason to believe that a two-dimensional throughflow program considering seal cavity leakage flow can undoubtedly assist in the performance prediction of an aeroengine. Adopting the model of Morns and Hoare [25] and Roberts et al. [26], Banjac and Petrovic [27] introduced the mixing loss, the secondary flow loss and the change of the flow angle caused by seal cavity leakage flow into their throughflow program based on a stream function approach. Ricci et al. [28] introduced the effect of seal cavity leakage flow into their flow through program based on axisymmetric Euler equations in the form of source terms. Their program can reflect the impact of seal cavity leakage flow on the mainstream, but cannot directly reflect the flow field inside the labyrinth sealed cavity.
Our goal is to develop a two-dimensional steady-state simulation software for aeroengine design and quick analysis using a circumferentially averaged method. While the coupled simulation of the main flow and the leakage flow can be conducted for both compressor and turbine stages, this paper focuses on the compressor side. In our previous work [29], the IGV and the first stage of a multistage axial-flow compressor is the research object, on which the grid independence has been verified and the influence of the seal cavity leakage flow on the main flow and its mechanism has been investigated. In this paper, the research object is the IGV plus the first three stages of the same multistage axial-flow. The work of this article can be divided in three parts. First, to investigate the influence of seal cavity leakage flow on the multistage compressor performance. Second, to investigate the influence of seal cavity leakage flow on a certain stage or a certain blade row. Third, to investigate the propagation of this influence in multistage compressor.

2. Numerical Model and Research Object

The governing equations of CAM are the circumferentially averaged Navier-Stokes equations. Spalart-Allmaras (S-A) one equation model is adopted for turbulence modelling. Since the Mach number is below 0.3 in the shrouded cavity and above 0.3 in the main passage, the preconditioning technique proposed by Merkle and Choi [30] is applied to avoid the stiffness of compressible equations at low speed. A time-marching finite volume method is chosen to solve equations. The validation of CAM by NASA Rotor 67 and a high-loaded low speed fan TA36 can be found in references [31,32]. More details for CAM can also be reviewed in references [33,34].
In the calculation of labyrinth leakage flow, the accuracy of CAM is validated by the data of Prasad [35]. Prasad et al. tested the straight-through labyrinth shown in Figure 2, and obtained the flow characteristics of the labyrinth under 12 working conditions (pressure ratio from 1.0031 to 1.8974). See reference [35] for details of test pieces and test equipment. For the case that the clearance between the labyrinth teeth Cl = 0.36 mm, they also calculated with Fluent. The calculation results of CAM are compared with their experimental results and Fluent calculation results.
The computational mesh of CAM is shown in Figure 3. The number of grid points is 5123. The total temperature T 0 * , total pressure p 0 * and flow direction (horizontal intake) are given at the inlet. The static pressure p b is given at the outlet. Adiabatic no-slip condition is applied at wall surface. The relationship between mass flow parameter and inlet/outlet pressure ratio is shown in Figure 4. It can be seen that the calculated results of CAM are in good agreement with the experimental results, and the errors are basically within the range of experimental uncertainty (4.00~4.90%). When the inlet/outlet pressure ratio is in the range of 1.48 to 1.88, the calculation accuracy of CAM is higher than that of the Fluent calculation performed by Prasad et al.
The throughflow program CAM has been applied to the first three stages of a high-loading transonic six-stage compressor with inlet guide vanes (IGV). The flow path with sealing cavity is shown in Figure 5, where the geometric structure of the channel, cavity and labyrinth is simplified to some extent. Table 1 provide the values of specific blade parameters. In Figure 6, the computational mesh is shown. The channel and the mainstream flow path grid are matched at the junction interface. In order to study the influence of seal leakage flow on the compressor as a whole and on each row of blades, six configurations were set up to adjust the leakage flow by changing the size of the tip clearance (c) of the labyrinth. The setting of each configuration is described in Table 2. When the tip clearance is 0, the seal cavity of the corresponding stage is removed, and only the mainstream flow path grid is retained. The silhouettes for different configurations are shown in Figure 7.
The boundary conditions are as follows: for the main flow of the compressor, the total temperature, total pressure and flow direction are given at the inlet, i.e., standard atmospheric conditions and horizontal intake. For different working conditions, given the corresponding static pressure at the outlet hub, the static pressure distribution along the spanwise direction at the outlet is obtained by using the simplified radial equilibrium equation. The numerical simulation was carried out at the design speed, i.e., 12,302 rpm. Table 3 shows the number of grid points of configuration 4, and the convergence time is about 1.5 h.

3. Results and Discussion

3.1. Compressor Performance

Figure 8 shows the flow field at near-stall operation point of configuration 4 of the compressor with seal cavity leakage flow. Figure 8b shows that, forced by pressure difference, the leakage flows into the seal cavity from the stator trailing edge gap, and then flows into the mainstream from the stator leading edge gap after dissipated in vortex form for many times. It can be seen from Figure 8c,d that the labyrinth (the part marked with black box in Figure 8c) is the main sealing part in the cavity flow. When the leakage flows through the labyrinth tip clearance, the flow path contracts, the velocity increases and the static pressure decreases. After passing through the tip clearance, the flow path expands rapidly. The kinetic energy of the fluid dissipates in the cavity between the teeth, during which the velocity decreases, and the pressure change is not obvious. After that, the fluid enters into the next labyrinth tip clearance, and the above process is repeated. After the leakage flow through the multi-stage labyrinth structure, the pressure is significantly reduced, and the sealing process is completed. Such a low-energy leakage flow converges into the main stream at the leading edge of the stator, causing losses by mixing with the main stream. As a result, the flow field at the root of the stator is affected and a low Mach number region is formed.
With the increase of labyrinth tip clearance, the overall performance of the compressor decreases. The compressor characteristics of each configuration are shown in Figure 9. It can be seen that, on the one hand, the change in labyrinth tip clearance causes flow rate change near the stall point of the compressor. This is due to the different leakage flow rate in the sealing cavity under different configurations, which makes the stall position of the compressor change. Figure 10 shows the streamlines at near-stall point for 3 different configurations. The minimum compressor inlet flow rate of the configuration 2 is close to that of the configuration 1. It is found in Figure 10 that in both configurations 1 and 2, compressor stall occurs at the root of the third stage stator (S3). When c1 increases to 0.5 mm (configurations 3 and 4), the flow rate near the stall point increases significantly, which means the stall margin decreases. At this time, in contrast to what happens in the first two configurations, the location where stall occurs first moves to the S1 root. It can be seen that when the seal cavity leakage flow increases to a certain extent, the flow field structure of S1 root is destroyed, and the compressor stall occurs ahead of time. With the increase of c2, the minimum flow rate increases further, and the stall starting point becomes S2 root (configurations 5 and 6).
On the other hand, in a specific flow rate range, the compressor performance gradually decreases with the increase of the clearance. The same flow point of each configuration is selected for further analysis. For configurations 1 to 3, only the size of c1 changes, and the compressor performance of configuration 1 is taken as the benchmark. For configurations 3–6, only the size of c2 changes, and configuration 3 is taken as the benchmark. The variation trend of compressor efficiency attenuation with the tip clearance is obtained, as shown in Figure 11. It can be seen from this figure that for cavity 1, when the tip-to-span ratio (the ratio of tip clearance to stator blade height) increases by 1%, the compressor efficiency decreases by 0.4%; for cavity 2, the efficiency decreases by 0.6%, and as the gap continues to increase, the extent of efficiency decrease has an increasing trend. It is in the same order of magnitude as 1% efficiency decay in reference [15].

3.2. Stage Performance

In order to explore the influence of flow rate of seal cavity leakage on the performance of all stages of the compressor, the pressure coefficient ( ψ ) and work coefficient ( ψ ) of each stage under the corresponding state were calculated by using the flow field data of selected working points. The definition of ψ and ψ are as follows
ψ = ( H o u t * H i n * ) i s e n U m 2
ψ = ( H o u t * H i n * ) U m 2
where Um is the tangential speed of the rotor at 50% of the span at the leading edge of the stage. Referring to the analysis method in Figure 11, configurations 1–3 are a group and configuration 1 is considered as a benchmark to study the effect of changes in c1 on the characteristics of each stage. Configurations 3–6 are another group and configuration 3 is considered as a benchmark to study the effect of changes in c2 on the characteristics of each stage. Figure 12 and Figure 13 show the variation of work coefficient attenuation and pressure coefficient attenuation with respect to tip clearance, respectively. From the first stage characteristic attenuation (blue line) of Figure 12b and Figure 13b, it can be seen that the leakage flow in the seal cavity 2 under the second stage stator has little effect on the performance of the first stage compressor. As it can be seen from Figure 12a, the leakage flow caused by the seal cavity 1 has little influence on the work capacity of the first stage (current stage), but has a relatively large impact on the latter two stages, thus reducing its work capacity. From Figure 12b, it can be concluded that seal cavity 2 has little effect on the work capacity of the current stage, almost no effect on the front stage (the first stage), and reduces the work capacity of the later stage (the third stage). On the other hand, as it can be seen from Figure 13, the seal cavity leakage flow has little effect on the pressurization capacity of the front stage (the change of cavity 2 in Figure 13b does not affect pressure coefficient of the first stage), but reduces the pressurization capacity of the current stage and the next one. Considering that the work capacity is mainly related to the rotor blades, and the pressurization capacity is affected by both the rotor and stator, the following conclusion can be drawn: Seal cavity leakage flow affects the performance of the stator row and the blade row located at downstream, but the impact on the upstream blade row (including the rotor blade row of the same stage and the more upstream blade row) is minimal. This conclusion will be further confirmed in the analysis of the spanwise distribution of the flow parameters of the blade row.

3.3. Spanwise Parameters

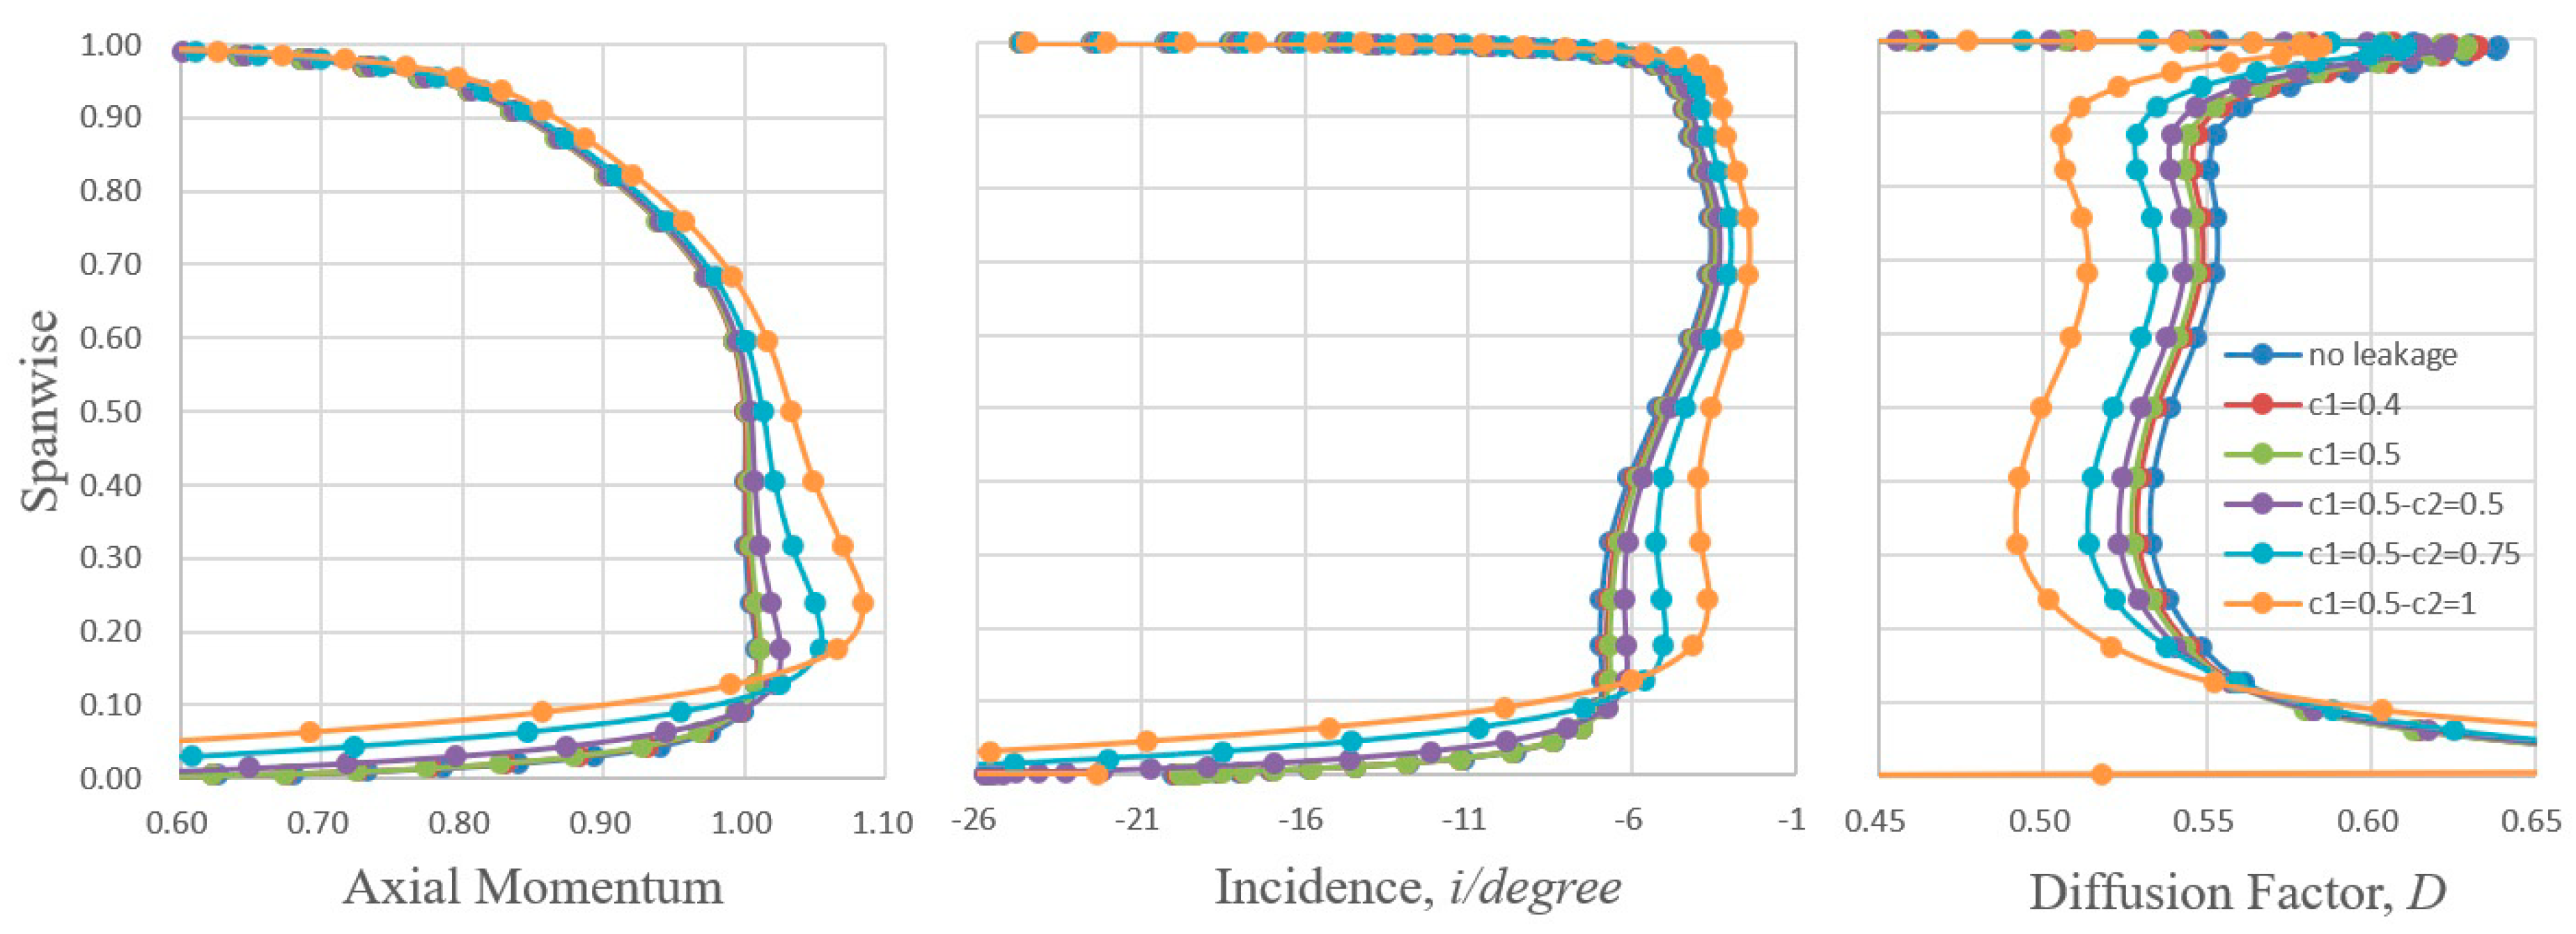
In order to further analyze the flow mechanism of the change of compressor stage characteristics caused by seal cavity leakage flow, the distribution of spanwise parameters reflecting the performance of blade row under different tip clearance conditions were analyzed and compared. Figure 14 shows the inlet axial momentum of the second stage stator S2 (normalized by the inlet axial momentum at the middle span of the second stage rotor when there is no gap leakage), incidence angle, diffusion factor and loss coefficient. The definition of diffusion factor D and loss coefficient ϖ and are as follows
D = 1 w 2 w 1 + Δ w u 2 τ w 1
ϖ = p 1 * p 2 * p 1 * p 1
where w 1 is the average velocity at the blade inlet, w 2 is the average velocity at the blade outlet, Δ w u = | w 1 u - w 2 u | is the torsional velocity, τ is the blade solidity, p 1 * is the average total pressure at blade inlet, p 2 * is the average total pressure at blade outlet, and p 1 is the average static pressure at blade inlet.
In general, the change of cavity 1 clearance has little effect on S2, but with the increase of cavity 2 clearance c2, the inlet axial momentum of S2 blade below 15% span decreases, reflecting the increase of flow blockage; the incidence angle also increases obviously. The difference of incidence angle between c2 maximum clearance and non-clearance case reaches 6° at 0.25% span, which also confirms the increase of flow blockage and blade load. The flow blockage forces the fluid to migrate to the middle of the span, resulting in a decrease of the incidence angle of the blade above 15% of the span. The difference in the incidence angle between 20% and 40% relative span is the largest. The leakage flow of the seal cavity with an increase of c2 from 0 to 1 mm reduces the incidence angle by 1.6°. The decrease of incidence angle leads to the decrease of blade load. In contrast to the other parameters, the change of loss mainly occurs at the root of the stator blade, which is shown as a pronounced bulge in the figure. With the increase of c2, the maximum loss coefficient of stator root increases from 0.2 to 0.55, and the spanwise range of bulge also expands from 5% to 18%.
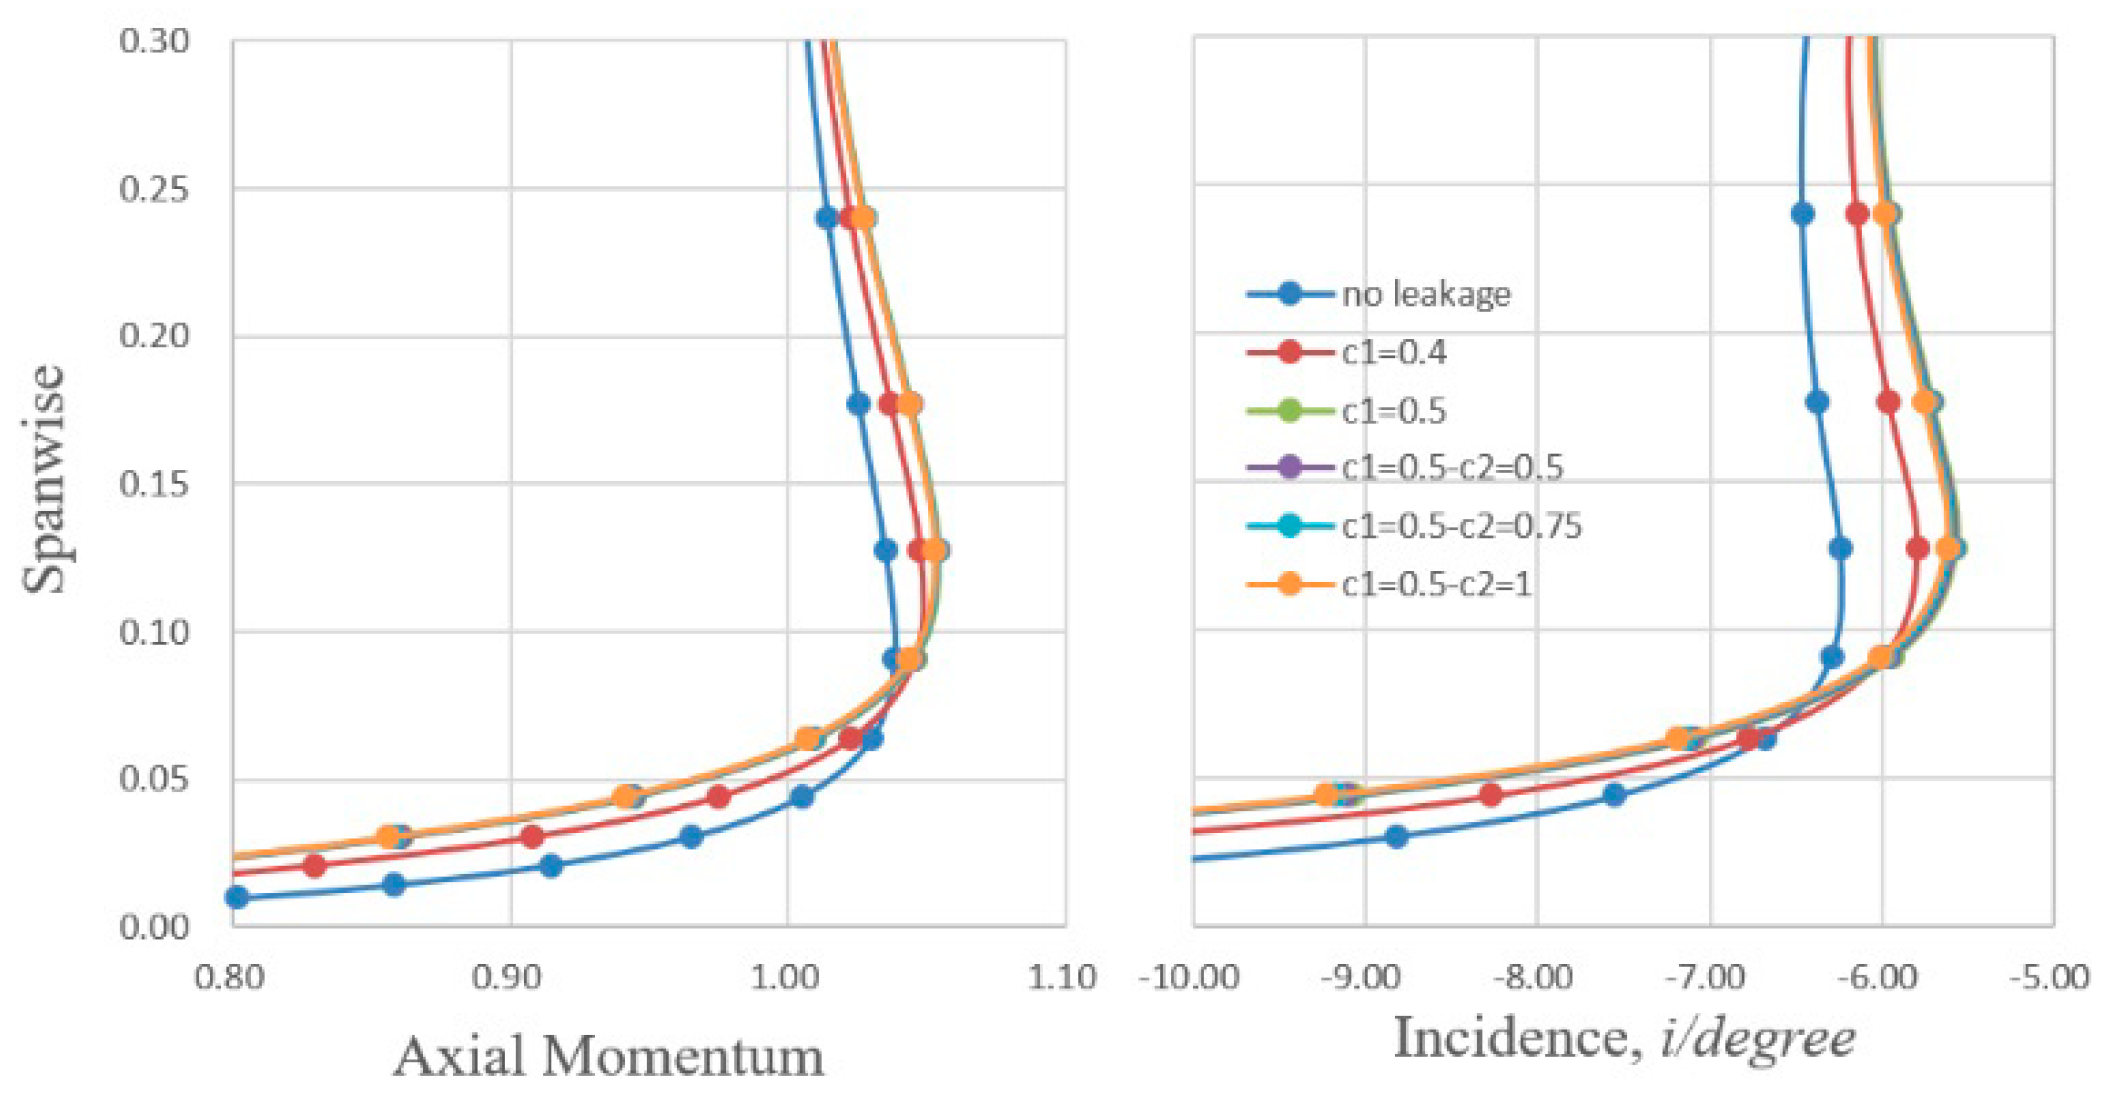
Figure 15 and Figure 16 show the spanwise distribution of blade row parameters of rotors R2 and R3, respectively. The diffusion factor of R2 and the loss coefficient of both rotor blade rows are not shown since they change little. In addition, in order to make the contrast more obvious, Figure 15 only shows the distribution of R2 below 30% span. It should be pointed out that since the rotation direction of the rotor is defined as the positive direction of the circumferential angle in the calculation process, it can be seen from the velocity triangle of the elementary flow that when the axial momentum of the rotor inlet is small, the incidence angle is numerically negative, which is different from that of the stator. From Figure 15 it can be seen that the inlet axial momentum and incidence angle of R2 is basically unchanged with the change of c2, that is, the leakage flow from the seal cavity has little effect on the performance of upstream blade row. With the increase of c1, the inlet axial momentum of R2 root (below 8% span) decreases, and the incidence angle increases, which reflects that the flow is blocked. The blockage causes the flow to migrate to the middle of the span. In consequence, the inlet axial momentum above 10% span increases, and the incidence angle decreases. It can be seen that the change of leakage flow in the S1 root also affects the performance of downstream R2 blade row. Similar to Figure 15, Figure 16 shows that, with the increase of the tip clearance c2 of the seal cavity, the leakage flow also causes root blockage of R3. The blockage further causes the flow to migrate to the middle of the span. In most spanwise range, the incidence angle of R3 decreases, as well as the load and the work capacity. The change of load is also reflected in the diagram of the diffusion factor.
Based on the performance of R2, S2 and R3 blade rows, it can be seen that the influence of leakage flow of seal cavity on upstream blades in multistage axial-flow compressor can be ignored. On the other hand, it will cause flow blockage at the root of current stator and downstream rotor, and further lead to flow migration to the middle span. The deterioration of the root flow field makes the loss of the stator root increase obviously. The spanwise migration makes the incidence angle of the stator and the downstream rotor decrease in most of the spanwise range, resulting in the load decreases, so does the pressurization capacity of the blade row and the work capacity of the rotor. These results are consistent with those in Section 3.2.

4. Conclusions

In this paper, the circumferentially averaged method is used to calculate the coupling flow field between the seal cavity leakage flow and the main flow field at the root of the shrouded stator in a multistage axial-flow compressor. The influence of the leakage flow of the seal cavity on the compressor performance and flow field details is studied by changing the tip clearance of the labyrinth. In addition to the analysis of the effect of seal leakage flow on flow field and compressor performance, the effect of seal leakage flow on a particular blade row in multistage environment and its propagation in multistage axial flow compressor are also studied through the analysis of stage characteristics. The significant findings of this study can be summarized as follows:
(1)
With the increase of leakage flow, the total pressure ratio and efficiency of the compressor decrease to some extent. The labyrinth clearance-to-span ratio of cavity 1 increases by 1%, and the compressor efficiency decreases by 0.4%. For cavity 2, the decrease in efficiency is 0.6% when labyrinth clearance-to-span ratio increases by 1%. Therefore, in order to predict the performance of the compressor correctly, the effect of leakage flow in the seal cavity should not be ignored.
(2)
The leakage flow in the seal cavity has little effect on the performance of the upstream blade row, but will deteriorate the flow field and performance of the stator and the downstream rotor where the leakage occurs. Reflected in the stage characteristics, it has no effect on the front stage, but has a little influence on the work capacity of the current stage, while the work capacity of the later stage and the pressurizing capacity of the current stage and the rear stage reduces significantly. This is reflected in the performance of blade row that the total pressure loss at the root of stator increases obviously, and the load of stator and downstream rotor decreases in most of the span ranges.
(3)
The seal cavity leakage flow causes the blockage of the flow at the root of the blade, which leads to the spanwise migration of the flow. The blockage and spanwise migration further change the incidence angle characteristics of the blade row. As a consequence, the incidence angle increases at the hub, which induces an increase of total pressure loss. At midspan, on the other hand, the incidence angle decreases, resulting in a decrease of blade load.
Generally, the circumferentially averaged throughflow program CAM used in this paper reasonably reflects the influence of seal cavity leakage flow on the performance and flow field details of a three-stage axial-flow compressor. The leakage flow from the sealed cavity will deteriorate the performance of the stator, and this effect will propagate downstream. This program can be used to quickly analyze the seal cavity leakage effect during compressor design as well as performance degradation caused by labyrinth wear in a multistage axial-flow compressor. The study lays a solid foundation for further considering the influence of seal cavity leakage flow in the calculation of aeroengine.

Author Contributions

Conceptualization, D.L. and X.G.; methodology, D.L.; software, D.L.; validation, D.L.; formal analysis, D.L.; investigation, D.L.; resources, D.L.; data curation, D.L.; writing—original draft preparation, D.L.; writing—review and editing, D.L., D.J. and X.G.; project administration, D.J. All authors have read and agreed to the published version of the manuscript.

Funding

This research was funded by National Science and Technology Major Project (2017-I-0005-0006).

Institutional Review Board Statement

Not applicable.

Informed Consent Statement

Not applicable.

Data Availability Statement

Data sharing is not applicable to this article.

Acknowledgments

The authors would like to thank Fang-fei Ning for the guidance and kind advice, and the fellow apprentices in the research group for their help.

Conflicts of Interest

The authors declare no conflict of interest.

Abbreviations

Nomenclature
bthrottle clearance length (tooth tip thickness)
clabyrinth clearance
ddiameter of labyrinth tooth tip
Ddiffusion factor
hblade height
h L labyrinth tooth height
H * total enthalpy
iincidence
p * total pressure
Slabyrinth pitch
T * total temperature
Umtangential speed of the rotor at 50% of the span at the leading edge of the stage
w relative velocity
w u tangential component of relative velocity
Δ w u torsional velocity
Greek letters
η adiabatic efficiency
ψ pressure coefficient
ψ work coefficient
ϖ total pressure loss coefficient
τ blade solidity
Subscripts
inthe inlet of stage
outthe outlet of stage
isenisentropic

References

  1. Marx, J.; Städing, J.; Reitz, G.; Friedrichs, J. Investigation and analysis of deterioration in high pressure compressors due to operation. CEAS Aeronaut. J. 2014, 5, 515–525. [Google Scholar] [CrossRef] [Green Version]
  2. Reitz, G.; Friedrichs, J. Impact of Front- and Rear-Stage High Pressure Compressor Deterioration on Jet Engine Performance. Int. J. Turbomach. Propuls. Power 2018, 3, 15. [Google Scholar]
  3. Reitz, G.; Kellersmann, A.; Friedrichs, J. Full High Pressure Compressor Investigations to Determine Aerodynamic Changes due to Deterioration. In Proceedings of the ASME Turbo Expo 2018: Turbomachinery Technical Conference and Exposition, Oslo, Norway, 11–15 June 2018; ASME: New York, NY, USA, 2018. [Google Scholar]
  4. Yao, J.; Jameson, A.; Alonso, J.J.; Liu, F. Development and Validation of a Massively Parallel Flow Solver for Turbomachinery Flows. J. Propul. Power 2001, 17, 659–668. [Google Scholar] [CrossRef]
  5. Mahesh, K.; Constantinescu, G.; Apte, S.; Iaccarino, G.; Ham, F.; Moin, P. Large-Eddy Simulation of Reacting Turbulent Flows in Complex Geometries. J. Appl. Mech. Trans. ASME 2006, 73, 374–381. [Google Scholar] [CrossRef]
  6. Medic, G.; You, D.; Kalitzin, G.; Herrmann, M.; Ham, F.; Pitsch, H.; van der Weide, E.; Alonso, J. Intergrated Computations of an Entire Jet Engine. In Proceedings of the ASME Turbo Expo 2007: Power for Land, Sea, and Air, Montreal, QC, Canada, 14–17 May 2007; ASME: New York, NY, USA, 2007. ASME Paper No. GT2007-27094. [Google Scholar]
  7. Schlüter, J.U.; Pitsch, H.; Moin, P.; Shankaran, S.; Kim, S.; Alonso, J. Towards Multi-Component Analysis of Gas Turbines by CFD: Integration of RANS and LES Flow Solvers. In Proceedings of the ASME Turbo Expo 2003, Collocated with the 2003 International Joint Power Generation Conference, Atlanta, GA, USA, 16–19 June 2003; ASME: New York, NY, USA, 2003. ASME Paper No. GT2003-38350. [Google Scholar]
  8. Schlüter, J.U.; Pitsch, H.; Moin, P. Large-eddy Simulation Inflow Conditions for Coupling with Reynolds-averaged Flow Solvers. AIAA J. 2004, 42, 478–484. [Google Scholar] [CrossRef]
  9. Medic, G.; Kalitzin, G.; You, D.; Herrmann, M.; Ham, F.; van der Weide, E.; Pitsch, H.; Alonso, J. Integrated RANS/LES Computations of Turbulent Flow through a Turbofan Jet Engine. Center for Turbulence Research. Annu. Res. Briefs 2006, 275–285. [Google Scholar]
  10. Schlüter, J.U.; Wu, X.; Kim, S.; Shankaran, S.; Alonso, J.J.; Pitsch, H. A Framework for Coupling Reynolds-Averaged with Large-Eddy Simulations for Gas Turbine Applications. J. Fluids Eng. Trans. ASME 2005, 127, 806–815. [Google Scholar] [CrossRef]
  11. Lytle, J.K. The Numerical Propulsion System Simulation: An Overview; NASA/TM-2000-209915; NASA: Washington, DC, USA, 2000.
  12. Wang, Z.X.; Song, F.; Zhou, L.; Zhang, X.B.; Zhang, C.Y. Research Progress in Numerical Zooming Technology of Aeroengine. J. Propul. Technol. 2018, 39, 1441–1454. [Google Scholar]
  13. Denton, J.D.; Dawes, W.N. Computational Fluid Dynamics for Turbomachinery Design. Proc. Inst. Mech. Eng. Part C J. Eng. Mech. Eng. Sci. 1998, 213, 107–124. [Google Scholar] [CrossRef]
  14. Wellborn, S.R. Effects of Shrouded Stator Cavity Flows on Multistage Axial Compressor Aerodynamic Performance. Ph.D. Thesis, Iowa State University, Ames, IA, USA, 1996. [Google Scholar]
  15. Ludwig, L.P.; Bill, R.C. Gas Path Sealing in Turbine Engines. J. ASLE Trans. 1980, 23, 1–22. [Google Scholar] [CrossRef] [Green Version]
  16. Wisler, D.C. Advanced Compressor and Fan Systems, GE Aircraft Engines, Cincinnati, Ohio, 1988; (Also 1986 Lecture to ASME Turbomachinery Institute, Ames, Iowa); ASME Turbomachinery Institute: Ames, IA, USA, 1986. [Google Scholar]
  17. Mahler, F.H. Advanced Seal Technology; Pratt and Whitney Aircraft Division Tech. Rep. PWA-4372; Pratt and Whitney Aircraft Division: Hartford, CO, USA, 1972. [Google Scholar]
  18. Cumpsty, N.A. Compressor Aerodynamics; Longman Scientific & Technical, Longman Group: Harlow, UK, 1989. [Google Scholar]
  19. Freeman, C. Effect of Tip Clearance Flow on Compressor Stability and Performance. VKM Lecture Ser. 1985, 5, 5. [Google Scholar]
  20. Mahmood, S.M.H.; Turner, M.G. Modeling Capability for Cavity Flows in an Axial Compressor. In Proceedings of the ASME Turbo Expo 2017: Turbomachinery Technical Conference and Exposition, Charlotte, NC, USA, 26–30 June 2017; ASME: New York, NY, USA, 2017. ASME Paper, GT2017-64040. [Google Scholar]
  21. Kato, D.; Yamagami, M.; Tsuchiya, N.; Kodama, H. The Influence of Shrouded Stator Cavity Flows on the Aerodynamic Performance of a High-Speed Multistage Axial-Flow Compressor. In Proceedings of the ASME Turbo Expo 2011: Turbine Technical Conference and Exposition, Vancouver, BC, Canada, 6–10 June 2011; ASME: New York, NY, USA, 2011. ASME Paper, GT2011-46300. [Google Scholar]
  22. Gier, J.; Stubert, B.; Brouillet, B.; Vito, L.D. Interaction of Shroud Leakage Flow and Main Flow in a Three-Stage LP Turbine. J. Turbomach. 2005, 127, 649–658. [Google Scholar] [CrossRef]
  23. Rosic, B.; Denton, J.D.; Pullan, G. The Importance of Shroud Leakage Modeling in Multistage Turbine Flow Calculations. J. Turbomach. 2006, 128, 699–707. [Google Scholar] [CrossRef]
  24. Kuerner, M.; Reichstein, G.A.; Schrack, D.; Rose, M.G.; Staudacher, S.; Gier, J.; Engel, K. Low Pressure Turbine Secondary Vortices Reynolds Lapse. J. Turbomach. 2012, 134, 061022. [Google Scholar] [CrossRef]
  25. Morris, A.W.H.; Hoare, R.G. Secondary Loss Measurements in a Cascade of Turbine Blades with Meridional Wall Profiling. In Proceedings of the ASME, Winter Annual Meeting, Houston, TX, USA, 30 November–5 December 1975; ASME: New York, NY, USA, 1975. ASME Paper No. 75-WA/GT-13. [Google Scholar]
  26. Roberts, W.B.; Serovy, G.K.; Sandercock, D.M. Modeling the 3-D Flow Effects on Deviation Angle for Axial Compressor Middle Stages. J. Eng. Gas Turbines Power 1986, 108, 131–137. [Google Scholar] [CrossRef]
  27. Banjac, M.; Petrovic, M.V. Secondary flows, endwall effects, and stall detection in axial compressor design, In Proceedings of the ASME Turbo Expo 2014: Turbine Technical Conference and Exposition, Düsseldorf, Germany, 16–20 June 2014; ASME: New York, NY, USA, 2014; ASME Paper, GT2014-25115.
  28. Ricci, M.; Pacciani, R.; Marconcini, M.; Macelloni, P.; Cecchi, S.; Bettini, C. CFD-Based Throughflow Analysis of Transonic Flows in Steam Turbines. In Proceedings of the ASME Turbo Expo 2019: Turbomachinery Technical Conference and Exposition, Phoenix, Arizona, USA, 17–21 June 2019; ASME: New York, NY, USA, 2019. ASME Paper, GT2019-90851. [Google Scholar]
  29. Liang, D.; Gui, X.M.; Jin, D.H. Influence of Seal Cavity Leakage Flow on Compressor Performance Investigated with a Circumferentially Averaged Method. Appl. Sci. 2021, 11, 780. [Google Scholar] [CrossRef]
  30. Merkle, C.L.; Choi, Y.H. Computation of Low-Speed Compressible Flows with time Marching Procedures. Int. J. Numer. Methods Eng. 1988, 25, 293–311. [Google Scholar] [CrossRef]
  31. Jin, H.L.; Jin, D.H.; Li, X.J.; Gui, X.M. A Time-Marching Throughflow Model and its Application in Transonic Axial Compressor. J. Therm. Sci. 2010, 19, 519–525. [Google Scholar]
  32. Liu, X.H.; Wan, K.; Jin, D.H.; Gui, X.M. Development of a Throughflow-Based Simulation Tool for Preliminary Compressor Design Considering Blade Geometry in Gas Turbine Engine. Appl. Sci. 2021, 11, 422. [Google Scholar] [CrossRef]
  33. Tang, M.Z.; Jin, D.H.; Gui, X.M. Modeling and numerical investigation of the inlet circumferential fluctuations of swept and bowed blades. J. Therm. Sci. 2017, 26, 1–10. [Google Scholar] [CrossRef]
  34. Liu, X.H.; Jin, D.H.; Gui, X.M. Throughflow Method for a Combustion Chamber with Effusion Cooling Modelling. In Proceedings of the ASME Turbo Expo 2018: Turbomachinery Technical Conference and Exposition, Oslo, Norway, 11–15 June 2018; ASME: New York, NY, USA, 2018. [Google Scholar]
  35. Prasad, B.V.S.S.S.; Manavalan, V.S.; Rao, N.N. Computational and Experimental Investigations of Straight-Through Labyrinth Seals. In Proceedings of the ASME 1997 International Gas Turbine and Aeroengine Congress and Exhibition, Orlando, FL, USA, 2–5 June 1997; ASME: New York, NY, USA, 1997. ASME Paper No. 97-GT-326. [Google Scholar]
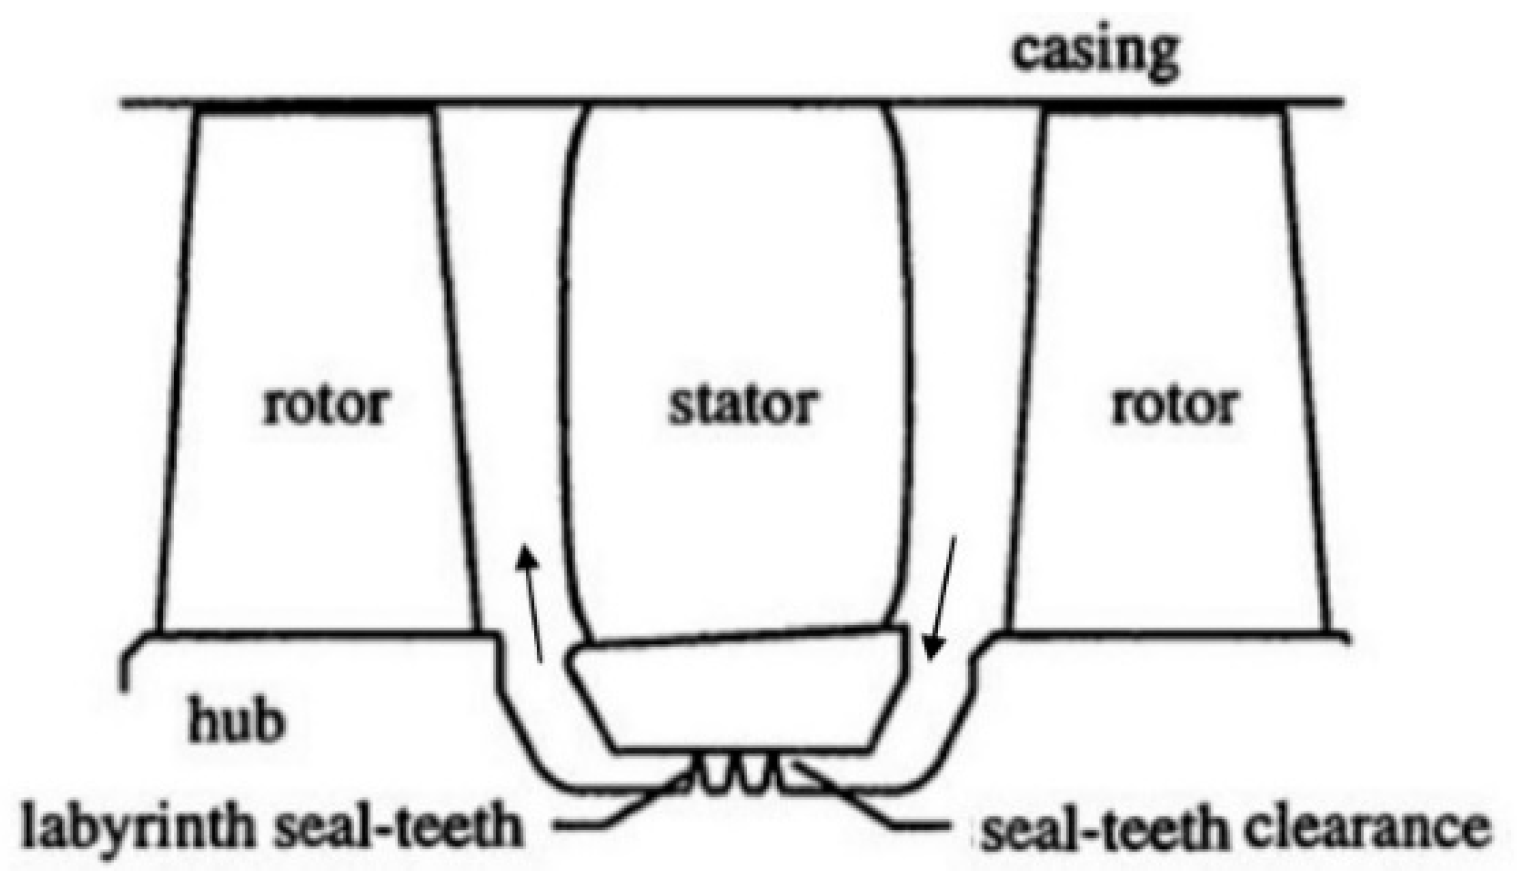
Figure 1. The seal cavity leakage in a compressor with shrouded stator.
Applsci 11 03937 g001
Figure 2. Geometry of labyrinth.
Applsci 11 03937 g002
Figure 3. Computational mesh of CAM.
Applsci 11 03937 g003
Figure 4. Relationship between mass flow parameter and inlet/outlet pressure ratio.
Applsci 11 03937 g004
Figure 5. Flow path.
Applsci 11 03937 g005
Figure 6. The computational mesh of compressor with seal cavity leakage.
Applsci 11 03937 g006
Figure 7. Silhouettes for different configurations.
Applsci 11 03937 g007
Figure 8. Flow field at near-stall point of configuration 4.
Applsci 11 03937 g008
Figure 9. Overall performance of the compressor.
Applsci 11 03937 g009
Figure 10. Streamlines at near-stall point for 3 different configurations.
Applsci 11 03937 g010aApplsci 11 03937 g010b
Figure 11. Efficiency penalty for varying seal-tooth clearance.
Applsci 11 03937 g011
Figure 12. Stage work coefficient penalty for varying seal-tooth clearance.
Applsci 11 03937 g012
Figure 13. Stage pressure coefficient penalty for varying seal-tooth clearance.
Applsci 11 03937 g013
Figure 14. Spanwise distribution of blade element performance for Stator 2.
Applsci 11 03937 g014
Figure 15. Spanwise distribution of blade element performance for Rotor 2.
Applsci 11 03937 g015
Figure 16. Spanwise distribution of blade element performance for Rotor 3.
Applsci 11 03937 g016
Table 1. Main blading parameters of the compressor.
ParametersS0R1S1R2S2R3S3
No. of Airfoils32285038685082
Chord/mm51.65103.2646.2768.5133.3750.4228.38
Solidity0.861.741.351.491.271.391.27
Aspect ratio3.651.672.911.682.781.592.39
Inlet metal angle/(°)0.47−51.2244.76−54.1244.37−55.2145.89
Outlet metal angle/(°)8.16−40.499.60−42.9611.51−43.2814.21
Table 2. Clearance values for the different configurations.
Configuration123456
c1/mm00.40.50.50.50.5
c2/mm0000.50.751
c1/h1 × 10000.300.370.370.370.37
c2/h2 × 1000000.540.811.08
Table 3. Number of grid points of configuration 4.
PositionS0 with InletR1S1R2S2R3S3 with OutletCavity 1Cavity 2Sum
No. of grid points67 × 4929 × 4929 × 4936 × 4939 × 4932 × 4951 × 496975875329,595
Publisher’s Note: MDPI stays neutral with regard to jurisdictional claims in published maps and institutional affiliations.