1. Introduction
In industry, reciprocating compressors are widely used [
1], for instance, in refrigeration [
2], air compression [
3,
4], petrochemical industry [
5], and liquefied natural gas [
6].
During the working process of the reed valve, the reed valve will deform and move under the action of the pressure difference on both sides of the reed. The deformation and movement of the reed, in turn, affect the flow field around the valve and then change the pressure difference acting on the surface of the valve. The movement of the valve and the flow of the gas couple with each other. Therefore, the mathematical model of the dynamic characteristics of the reed valve should include two parts: the simulation of the gas flow through the valve and the dynamic model of the valve, as shown in
Figure 1.
The flow field distribution on the upper and lower surfaces of the valve determines the dynamic characteristics of the valve. According to the analysis method of the flow field around the valve, the simulation of the valve can be divided into two methods, namely the lumped parameter model and the computational fluid dynamics (CFD) model. In the lumped parameter model, the valve is simplified as a single particle model or a cantilever beam model. The working chamber of the compressor is taken as the control volume. Combined with the dynamic equation of the valve, the continuous equation, and energy conservation equation in the control volume, the control equations are established to describe the dynamic characteristics of the reed valve.
Costagliola [
7,
8] first proposed a relatively complete valve dynamic model. The valve is simplified as a single degree-of-freedom spring mass system, and on this basis, the force acting on the valve plate is simplified. The gas flow in the valve is considered a one-dimensional, adiabatic, quasi-static flow through the orifice; that is, the transient mass flow through the valve is calculated by the subcritical steady state flow equation of the orifice. Since then, the model has been constantly modified to establish a more accurate valve dynamic model to meet the needs of engineering [
9,
10].
When calculating the mass flow rate through the valve and the dynamic characteristics of valve, the effective force area and effective flow area are introduced, which are closely related to the dynamic characteristics of the valve. It is very important to obtain the effective flow area and effective force area for simulating the dynamic characteristics of the gas valve. Due to the complexity of the valve clearance flow, the research on the effective force area and effective flow area of the valve mainly depended on the experiment. The experimental test of the effective flow area of the valve is carried out under steady and dynamic conditions [
11,
12].
The quasi-dimensional model can accurately simulate the volumetric efficiency, adiabatic efficiency, and valve movement of the compressor from a macro level. However, it cannot analyze the flow process of the compressor in more detail, such as temperature distribution [
13], the coupling characteristics of the valve gap flow, and the valve dynamics. At the same time, this method also introduced a large number of empirical coefficients [
14]. The flow in the gap between the reed and valve seat had a significant influence on the performance of the compressor.
With the development of methods and techniques to study fluid–structure interaction [
15,
16,
17] and the great improvement in computing ability, the FSI method [
18], which can reveal the physical essence of the coupling between the valve gap flow and the dynamic characteristics of the valve, had been gradually applied to the study of reciprocating compressors [
19,
20].
Hwang et al. [
21,
22] established an FSI model to study the performance of the discharge valve. Moreover, the results showed that the valve lift obtained from the 3D fluid–structure interaction model was basically consistent with the experimental results. Zhao et al. [
23] proposed a 3D CFD model of a reciprocating compressor to research the interaction between valve motion and pressure pulsation and the transient flow in the compressor. Wang et al. established an FSI model to study the influences of the valve parameters and rotation speed on the delayed closure and oscillation of the reed valve. They obtained an empirical correlation formula to predict the rotation speed when the maximum backflow and delay closure occurred [
24]. Qin Tan et al. [
25] proposed a 3D FSI model of the rolling rotor compressor to study the movement of the discharge valve.
A 3D FSI model of reciprocating compressors with a reed valve has been presented to study the dynamic characteristics of the suction reed valve and the flow rate characteristic of the reciprocating compressors in this paper. Moreover, experimental research is implemented to verify the model. The pressure sensor is used to record the p-θ diagram, and an eddy current displacement sensor is adopted to measure the motion of the suction valve. The influence of the surface pressure distribution of the reed valve on the dynamic characteristics of the compressor is identified based on the FSI model. The research provides a new perspective to reveal the key factors affecting the dynamic characteristics of the valve and improve the performance of reciprocating compressors.
2. The FSI Model of Reciprocating Compressors
In the analysis, the FSI model of reciprocating compressors includes the structural domain (the valve) and the corresponding fluid domain. The schematic diagram of the compressor with a reed valve is shown in
Figure 2. In this paper, a 3D FSI model was proposed to investigate the working process of compressors by using the commercial code ADINA version 9.3.
2.1. The Fluid Domain
The fluid domain model is established based on the actual flow field structure of the compressor, as shown in
Figure 3. The fluid domain of the compressor can be divided into three main parts: the suction part, the discharge part, and the cylinder part. The discharge part includes the discharge hole, discharge chamber, and discharge pipe. The suction part consists of the suction chamber and suction hole.
The governing equations for the fluid domain in the FSI model are shown in Equations (1)–(3):
where
ρ is the density,
t is the time,
fB is the body force vector of the fluid medium,
v is the velocity vector,
E is the specific total energy,
τ is the stress tensor,
qB is the specific rate of heat generation, and
q is the heat flux.
In this paper, the physical properties of the working fluid are calculated by the Redlich–Kwong (R–K) model. The R–K equation can be successfully used in the calculation of the gas phase P-V-T, and the accuracy of the R–K equation in the calculation of the gas phase volume is greatly improved compared with the Van der Waals equation [
26]. It needs to be pointed out that the calculation accuracy of the gas phase volume is very important in compressor work. The model not only has high accuracy, but also is widely used as a two-parameter model in engineering calculations.
The general form of the R–K model is expressed in Equation (4):
The expressions of
a,
b, and
c are
where
Tc is the critical temperature,
Rsp is the gas constant, and
pc is the critical pressure.
The working medium is air, and the physical parameters of the air are shown in
Table 1.
The gap boundary conditions are applied between these parts to separate the cylinder from the discharge part and the suction part [
24]. Different initial temperature and pressure conditions are set for these three parts, respectively.
In the fluid domain, the model adopts a low-speed compressible flow. The pressure at the suction part is set to 0.103 MPa, and the temperature at the suction part is set to 293.15 K. The initial temperature and pressure in the discharge and cylinder part are set to 338.15 K and 0.4 MPa, respectively.
The RNG k-ε model has been used to simulate the turbulent flow in the cylinder of the reciprocating compressors—where the standard pressure interpolation scheme was adopted—while the SIMPLE method was used to solve the pressure–velocity coupling problem. The eight-node 3D element is used to discretize the fluid domain.
2.2. The Structural Domain
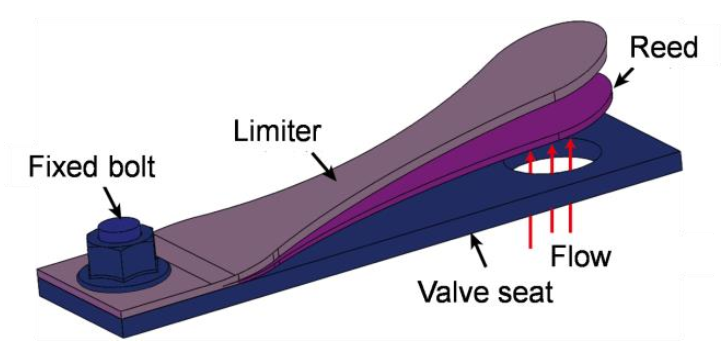
The structural domain in the FSI model of the reciprocating compressor includes suction valves, discharge valves, lift limiters, and valve seats, as shown in
Figure 4. Furthermore, the contact conditions between the reed valves, valve seats, and lift limiters are also set.
The structural domain in the FSI model adopts nonlinear dynamic analysis due to the large deformation of reed valve, and the incremental finite element equation is shown in Equation (5):
where
F is the nodal point force vector equivalent to the element stress,
K is the constant stiffness matrix,
M is the constant mass matrix,
C is the constant damping matrix,
R is the external load vector,
U is the vector of the nodal point displacement increment,
is the vector of the nodal point velocity, and
is the vector of the nodal point acceleration.
The material of the reed was Swedish steel (Sandvik 7C). Therefore, the linear elastic material model was adopted. The material properties of the reed are shown in
Table 2.
A contact condition between the valve seat and the reed valve is introduced in the proposed model. The structural domain is also discredited by using an eight-node 3D element.
2.3. The FSI Modeling of the Reciprocating Compressors
The complete FSI model includes the structural domain, the corresponding fluid domain, and the surface of fluid–structure interaction. The FSI boundary conditions are imposed on the surface of the suction valve and discharge valve as shown in
Figure 5.
The calculation process of the structure field and fluid field decoupling is shown in
Figure 6 [
27].
2.4. Convergence Judgment and Grid Independence Verification
Since the simulation of the compressor is an unsteady state issue, the simulation of full working cycles (including compression, discharge, expansion, and suction) based on the complete fluid–structure interaction model of the reciprocating compressor was executed to ensure the convergence of simulation results. The simulation results showed that the pressure variation of the third and fourth cycles were almost identical, as shown in
Figure 7. Therefore, the dynamic convergence of the grid can be guaranteed by simulating the compressor for three working cycles [
23,
24,
28].
In order to verify grid independence, four groups of flow field grids and four groups of structure field grids were selected [
29,
30]. The mesh numbers of the flow field were 8838, 25,416, 35,352, and 70,704. The mesh numbers of the structure field were 1056, 1568, 2646, and 3376. The maximum pressure in the cylinder was used as an index to characterize the grid independence. The results are shown in
Table 3.
The results indicate that when the mesh numbers of the flow field were 35,352 and 70,704, the difference of the simulation results was less than 0.32%. When the mesh numbers of structure field were 2645 and 5290, the difference of the simulation results was less than 0.64%. Considering the calculation speed and accuracy, the mesh numbers of the flow field and structure field were 35,352 and 2645, respectively.
By comparing the simulation results of different time steps, the independence of the time step was verified. Three kinds of time steps were selected in this paper, such as 10
−6 s, 10
−5 s, and 10
−4 s. As shown in
Figure 8, there was little difference in the pressure variation of the cylinder under three kinds of time steps, and the trend of the pressure variation was identical. Therefore, the time step of 10
−4 s could be selected to achieve better accuracy and a higher computing speed.
3. The Experimental Method
Experimental verification for the FSI model of the reciprocating compressor is carried out in this section. The p-θ diagram and the lift of suction valve have been acquired through experiments.
As shown in
Figure 9, in order to adjust the operating condition of the compressor, this paper built up a compressed air loop. The main compressed air loop consisted of a compressor, air storage tank, needle valve, and other additional components. The structure parameters of the air compressor in the experiment are listed in
Table 4. The pressure in the storage tank was controlled by the needle valve. In addition, the inlet working conditions of the compressor were the atmospheric pressure and ambient temperature.
In order to measure the transient pressure together with the rotation angle, a high-precision pressure sensor was adopted. Considering the practical compressor structure and sensor dimensions, the installation of the dynamic pressure sensor (Kulite, XT-190(M)) embedded in the valve seat is shown in
Figure 9. The uncertainty of the dynamic pressure sensor was less than ±0.1%, and its frequency was as high as 1400 kHz. The maximum working pressure was 1.9 MPa, and the working temperature ranged from −55 °C to 175 °C.
In order to measure the movement of the suction valve, an eddy current displacement sensor was used. The eddy current displacement sensor (Sensor type: KAMAN, KD-2300-2S) was installed with a measurement accuracy of ±0.3 μm (reading), as shown in
Figure 9.
The NI 9205 was used to acquire signals from the pressure sensor and displacement sensor, whose sampling rate was set to 50 kHz and measurement accuracy was 0.1%.
4. Results and Analysis
4.1. Comparison between the Simulation and Experimental Results
In this section, the FSI model is verified from two aspects. On the one hand, the flow field is verified by the pressure variation in the cylinder. On the other hand, the structural field is verified by the movement of the suction valve. The compressor operating conditions were as follows: the suction temperature was 20 °C, the suction pressure was 0.103 MPa (atmospheric pressure), and the discharge pressure was 0.4 MPa.
The difference of the p-θ diagram between the experiment and simulation is shown in
Figure 10a. The pressure variation of the FSI model was coincident with the experiment results. In particular, there were three pressure fluctuations during the discharge phase in both the simulation and experiment results. It was proven that the flow field simulation results of the FSI model were reliable. In addition to the p-θ diagram, the movement of the reed valve was another key point for verifying the FSI model, as shown in
Figure 10b. In the suction phase, the opening and closing angles of the suction reed valve were almost identical. Moreover, the simulation results of the reed valve flutter were in good agreement with the experimental results. It was proven that the simulation results of the structure field of the FSI model were reliable.
4.2. The Bernoulli Effect in the Valve Gap
The Bernoulli effect (Bernoulli’s principle) reflects the relationship between the pressure and the flow rate. When the flow velocity increases, the pressure on the interface between the object and the fluid decreases, whereas the pressure increases.
It was stated in [
10] that the Bernoulli effect in the valve gap was one of the reasons for delayed opening of the valve, because low pressure on the reed surface was caused by the Bernoulli effect. The low pressure prevents the valve from opening until the pressure in the cylinder increases enough to overcome the low pressure. Due to the complex structure of the compressor, it is impossible to observe the flow field in the valve gap through the experiment. In this paper, the Bernoulli effect in the valve gap is studied by using the validated FSI method.
The movement of the valve was controlled by the pressure difference between the upper and lower sides of the reed.
Figure 11 shows the pressure distribution on the upper and lower surface of the reed when the suction valve was opened. Because the flow velocity on the lower surface of the reed was low, it had little influence on the pressure distribution. Consequently, the pressure distribution on the lower surface of the reed was more uniform.
Since the flow velocity in the narrow valve gap was high, the Bernoulli effect led to a distinct low-pressure zone on the upper surface of the reed. Therefore, the pressure distribution on the upper surface of the reed was investigated in this paper.
In order to quantitatively express the pressure distribution in the flow field, as shown in
Figure 11, horizontal and vertical coordinate systems were established. The Y direction represents the width direction of the reed valve, and the X direction represents the length direction of the suction reed valve.
To observe the Bernoulli effect of the valve gap more clearly, the slice pressure contour along the Y direction was established, as shown in
Figure 12. Due to the Bernoulli effect caused by high-speed flow through the valve gap, there ias an obvious low-pressure zone in the gap between the top of the cylinder and the reed.
In order to study the variation of the pressure distribution of the upper surface of the reed with time, three characteristic crank angles were selected to study the pressure distribution, as shown in
Figure 13, such as the crank angle (41.4°) when the valve started to open, the crank angle (55.8°) when the valve lift reached its maximum for the first time, and the crank angle (90.0°) when the valve was fully opened.
The pressure distribution on the reed at three characteristic crank angles along the X direction is shown in
Figure 14a. The pressure on the reed was the highest at the O point, while the pressure decreased on both sides of the O point. In the
Figure 14, with the increase of the characteristic crank angle, the pressure distribution on surface of the reed tended to be more even. The reason for this phenomenon is that with the increase of lift, the velocity in the narrow region between the upper surface of the reed and the valve plate decreases, and the Bernoulli effect weakens.
The pressure distribution along the Y direction is also shown in
Figure 14b, and the position of the maximum pressure on the reed surface appears opposite the suction hole. On account of the Bernoulli effect in the narrow region between the valve plate and the upper surface of the reed, the pressure at the edge of the suction hole dropped sharply, forming a low-pressure zone. However, after passing through the low-pressure zone, the pressure increased due to the decrease of the flow velocity and weakening of the Bernoulli effect. With the increase of the reed valve lift, the pressure distribution along the Y direction of the suction reed valve also tended to be flat. Therefore, the Bernoulli effect had a significant effect on the pressure distribution on the surface of the reed valve. In addition, the influence of the Bernoulli effect on the dynamic characteristics of the reed valve will be further studied.
4.3. The Effect of the Rotation Speed on the Motion of the Suction Valve
The flow velocity is the key factor affecting the low-pressure region, and the compressor rotation speed directly determines the flow velocity through the valve. Therefore, the low-pressure region at various rotation speeds is investigated. To eliminate the influence of other factors on the flow field, as shown in
Figure 15, the pressure distribution on the surface of the suction reed valve was studied when the suction reed valve was fully open (i.e., the crank angle was at 90.0°) at different rotation speeds.
With the rotation speed increasing from 1050 r·min−1 to 1950 r·min−1, the low-pressure zone on both sides of the position opposite the suction hole increased gradually, and the minimum pressure value decreased from 98,100 Pa to 95,667 Pa. The conclusion can be drawn that the Bernoulli effect in the valve gap strengthened with the increase of the rotation speed.
When the valve was fully opened, as shown in
Figure 16a, the pressure distribution along the X direction of the reed valve was investigated at different rotation speeds. It is obvious that the pressure fluctuation increased with the increase of the rotation speed. The pressure distribution along the Y direction had the same trend, as shown in
Figure 16b.
The movement of the valve determines the flow capacity and backflow characteristics of the valve [
23], which has a great influence on the performance of compressor. Therefore, the movement characteristics of the valve under various working conditions were studied in depth.
Figure 17a shows the lift of the suction valve at various rotation speeds under the same working conditions. With the increase of the rotation speed, the opening delay of the suction valve increased, caused by the high-speed flow in the narrow region between the upper surface of the reed and the valve plate, while the closing time of the suction valve decreased first and then increased. The low-pressure region in the narrow region caused by the Bernoulli effect was beneficial to the quick closure of the valve. When the rotation speed was low, the flow velocity in the narrow region was low, which resulted in a longer delay closing time, such as at 1050 r·min
−1. With the increase of the rotation speed, the Bernoulli effect was strengthened, and the valve was closed in time, such as at 1500 r·min
−1. However, when the rotation speed was excessively high, the air flow velocity through the valve was overly high, which led to a stronger Bernoulli effect in the narrow region and premature closure of the valve. When the piston reached the bottom dead center (BDC), the insufficient flow region of the valve would cause the valve to reopen and eventually lead to a longer delay during the closure of the valve, such as at 1950 r·min
−1.
The mass flow rate through the suction valve was investigated as shown in
Figure 17b. The backflow through the suction reed valve was at its minimum at 1500 r·min
−1. The results show that the backflow characteristics of the suction valve were consistent with the movement characteristics of the suction reed valve. Furthermore, the low-pressure region in the pressure distribution had a direct impact on the capacity of the compressor.
4.4. The Effect of the Limiter Height on the Dynamic Characteristics of the Suction Valve
The valve limiter had an important influence on dynamic characteristics of the reed.
Figure 18a shows the lift of the suction reed valve at various limiter heights, indicating that the delayed closing time of the suction reed valve became longer as the limiter height increased from 2.0 mm to 3.6 mm. When the lift was higher, both the deformation of the reed and the restoring force became larger, but the closure of the valve was not entirely dependent on the elastic force. The pressure difference between the lower and upper surfaces of the reed was the critical factor for valve closure. The fluid flow velocity in the narrow region between the valve plate and the upper surface of the suction reed valve was higher when the valve lift was lower, the low-pressure region in the pressure distribution became more prominent, and the pressure difference was larger.
When the limiter height decreased from 2.0 mm to 1.2 mm, an excessively high flow velocity in the narrow region was caused by the excessive low lift, and the low-pressure region in the pressure distribution made the reed valve close prematurely. This directly caused less flow rate suctions into the cylinder, and the pressure in the cylinder was lower than the suction pressure. As shown in
Figure 18b, when the piston reached BDC, the reed valve opened again, resulting in a more serious backflow.
Therefore, 2.0 mm was a more reasonable limiter height for the test compressor. The low-pressure region in the pressure distribution between the upper surface of the reed and the valve plate should be fully considered in valve design.


