Article

Study on the Evaluation Methods of the Vertical Ride Comfort of Railway Vehicle—Mean Comfort Method and Sperling’s Method

by
Mădălina Dumitriu
1,* and
Dragoș Ionuț Stănică
2
1
Department of Railway Vehicles, University Politehnica of Bucharest, 060042 Bucharest, Romania
2
Doctoral School of Transport, University Politehnica of Bucharest, 060042 Bucharest, Romania
*
Author to whom correspondence should be addressed.
Appl. Sci. 2021, 11(9), 3953; https://doi.org/10.3390/app11093953
Submission received: 4 April 2021 / Revised: 23 April 2021 / Accepted: 26 April 2021 / Published: 27 April 2021
(This article belongs to the Section Acoustics and Vibrations)

Abstract

:
The paper herein analyzes the ride comfort at the vertical vibrations of the railway vehicle, evaluated by two methods—mean comfort method and Sperling’s method. The two methods have in common that the estimation of the comfort sensation is conducted with the comfort indices, namely ride comfort index NMVZ and ride comfort index Wz. The values of these indices are derived from numerical simulations. The advantage of using the results of the numerical simulations versus using experimental results, on which most previous research is based, resides in the fact that the ride comfort indices can be examined while taking into account the influence of velocity and certain parameters altering the behavior of vertical vibrations of the carbody, i.e., carbody flexibility and the suspension damping. The numerical simulation applications have been developed based on a theoretical model of the vehicle that considers important factors affecting the behavior of vertical vibrations of the carbody, by means of a ‘flexible carbody’ type model and an original model of the secondary suspension. The results presented mainly show that the two assessment methods lead to significantly different outcomes, in terms of ride comfort, under identical running conditions of the vehicle.

1. Introduction

During train travel, the passengers’s comfort can be affected by several factors, some due to the movement of the railway vehicle, such as vibrations and noise, while others come from the environment conditions inside the vehicle, e.g., temperature, humidity and air speed, lighting, or the interior fittings and decor (for instance, the shape and placement of chairs) [1,2,3,4]. All of these fall under the category of physical factors, to which social factors (interaction with the other passengers, management of services inside the vehicle, general organization of the transport service) and time factors (integration time, travel time) can be added [5].
It is a difficult task to establish an assessment method for the passengers’ comfort to include all these factors simultaneously because it would involve a great amount of test data, which incurs a very high cost [1,2]. Moreover, more preliminary stages would be required, as in associating one or more criteria with each factor, defining a comfort index for each criterion and partnering these indices with a comfort scale and combining these comfort indices to define a global indicator [5].
Among all factors affecting the passengers’ comfort, vibrations are paid a special attention because their effect upon the human body is very important [6,7,8]. As a function of vibrations’ intensity, direction and frequency value they occur at, as well as the exposure time, vibrations can perturb the comfort and the ability of passengers to conduct certain sedentary activities and can even affect their health condition. Generally, the vibrations of the railway vehicle are considered to be the main factor in determining the ride comfort [1,2,3,9,10].
Ride comfort counts as one of the criteria for evaluating the dynamic behavior of railway vehicles [1,11]. It is used to describe the degree of the passengers’ comfort from the perspective of mechanical vibrations, taking into account the physiological characteristics of the human body [12].
In practice, it is necessary to have a method to assess the passengers’ comfort state over vibrations during running of the railway vehicle. A difficult situation happens in this case—different circumstances claim different assessment methods, and therefore, it is impossible to set up a universally applicable method [13]. One of the explanations is that each country has variable characteristics of the vibrations of railway vehicles, due to the conditions in vehicles and tracks or exploitation conditions [1].
Different assessment methods for the ride comfort have been independently developed in time, with a selective applicability depending on the traffic type, namely urban, suburban, underground, long distance, etc. To evaluate the ride comfort of the railway vehicles, methods based on ISO 2631 [14,15,16,17,18,19] and Sperling’s [20,21], known as Sperling’s method or Wz ride index method are frequently used.
The ride index Wz method was brought in Germany by Sperling [20,21] in the mid-20th century, and it represents the most known assessment method for the ride comfort and ride quality of the railway vehicles [22]. The method advanced by Sperling introduces the concept of ride comfort index (Wz ride comfort index).
The International Union of Railways (UIC) and the European Committee for Standardization (CEN), along with ISO, have established through the European Rail Research Institute (ERRI) [23,24] standards of ride comfort assessment of the railway vehicles, based on ISO 2631, respectively, the UIC 513R [25] leaflet, the standards EN 12299 [26] and ISO 10056 [27].
As seen earlier, it is rather difficult to establish a universally applicable method to assess the ride comfort, so it would be quite useful to set up a relation among the ride comfort indices derived from different methods in order to convert one index to another immediately, as well as to be aware of the strengths and limitations of each assessment method. However, each of the assessment methods above has different formulations, and the ride comfort assessment parameters to be derived depend on how the acceleration data are measured and processed. It is, consequently, problematic to build a correlation among different ride comfort assessment methods, which is why research in this direction is scarce [1,10,13,28,29].
A reference paper, belonging to Kim et al. [1], examines the relations among several evaluation methods—Sperling’s method, the statistical method according to the UIC 513 leaflet and the r.m.s. acceleration-based method as per ISO 2631. For this, a vibration model resulting from the frequency analysis and the statistical analysis of acceleration measurements in the railway vehicles is used. Munawir et al. [10] compared the level of ride comfort via two methods, namely the method based on the standard EN 12299 and Sperling’s method. The former method is used to evaluate the ride comfort in two positions, sitting and standing, and the latter to validate and compare the derived data. Dumitriu and Leu [13] have set up a correlation among the comfort indices at the vertical vibrations corresponding to EN 12299 and Sperling’s method, based on the connection between the comfort sensation and the values of these indices. The strengths and limitations of the continuous comfort indices, mean comfort indices and the Sperling’s index in three directions are examined in Jiang et al.’s paper [28]. Based on the experimental results, similarities and benefits among these ride comfort methods are examined and discussed. Haladin et al. [29] have studied and compared three methods for evaluating the ride comfort—equivalent level of vibrations, Sperling ride index, and several other methods included in EN 12299, based on the vibration data recorded by using an inservice tram—to find an optimum procedure for the tramway comfort evaluation.
With the exception of reference [13], all the research presented above is based on experimental results. However, in the literature of review there are numerous researches developed on the basis of the ride comfort evaluation methods that use results obtained through numerical simulations. For instance, such studies concern the influence of the suspension [30,31,32,33] of the carbody flexibility [34,35], the suspended equipment [36,37] or of the track [38,39] upon the ride comfort, as well as the studies regarding the possibilities to improve the ride comfort of the railway vehicles [32,33,40,41,42,43,44,45,46].
In this paper, we analyzed two methods of evaluating ride comfort in the vertical direction, namely themean comfort method (according to standard EN 12299) and Sperling’s method, in an original manner, using the results of numerical simulations. The most important difference between the two methods lies in the frequency weighting function which takes into account the higher sensitivity of the human body to vertical vibrations.
The ride comfort assessment based on results from numerical simulations involves the representation of the railway vehicle through an equivalent mechanical model, which will consider the important factors affecting the behavior of vibrations of the vehicle in the vertical plan. One of these factors is the structural flexibility of the vehicle carbody. For the high-speed trains, the ride comfort can be strongly influenced by the resonance phenomenon of the flexible vibration modes in the carbody—mainly the first vertical bending mode, which is more pronounced in the center of the carbody [47,48]. Therefore, to assess the ride comfort performance of the railway vehicles, it is consequently necessary to adopt a ’flexible carbody’ type model. Another important element, which affects the behavior of vibrations in the vertical plan of the railway vehicle carbody, is the longitudinal traction system between the carbody and the bogie, through which the pitch vibrations of the bogie are conveyed to the carbody to excite its first vertical bending mode.
In light of the above, the model of the vehicle adopted in the paper is a rigid-flexible coupled model, where the carbody is represented by an equivalent Euler-Bernoulli beam, and the bogies and wheelsets are modeled through rigid bodies. The model of the secondary suspension is an original model, comprising a set of three Kelvin-Voigt systems, which take into account both the actual elements of the vertical suspension and the longitudinal traction system [3,35,43].
The advantage of using the results from numerical simulations versus experimental lies in the fact that the ride comfort assessment methods can be examined for various values of the vehicle parameters. For the case herein, the comfort indices for the vertical vibrations are calculated in three reference points of the carbody, depending on velocity, while considering the influence of the carbody vertical flexibility and the suspension damping. The three carbody points are considered critical points from the perspective of ride comfort [3,47,48] and are found at the carbody center and against the two wheelsets. The results derived are correlated with the dynamic response of the vehicle carbody following the frequency weighting specific to each of the two methods.
The original elements of the paper are found in the approach to the problem—the analysis of ride comfort assessment methods based on the numerical simulations results—and in the railway vehicle model, which includes elements that influence the vertical vibrations of the carbody, represented by a model original of the suspension.

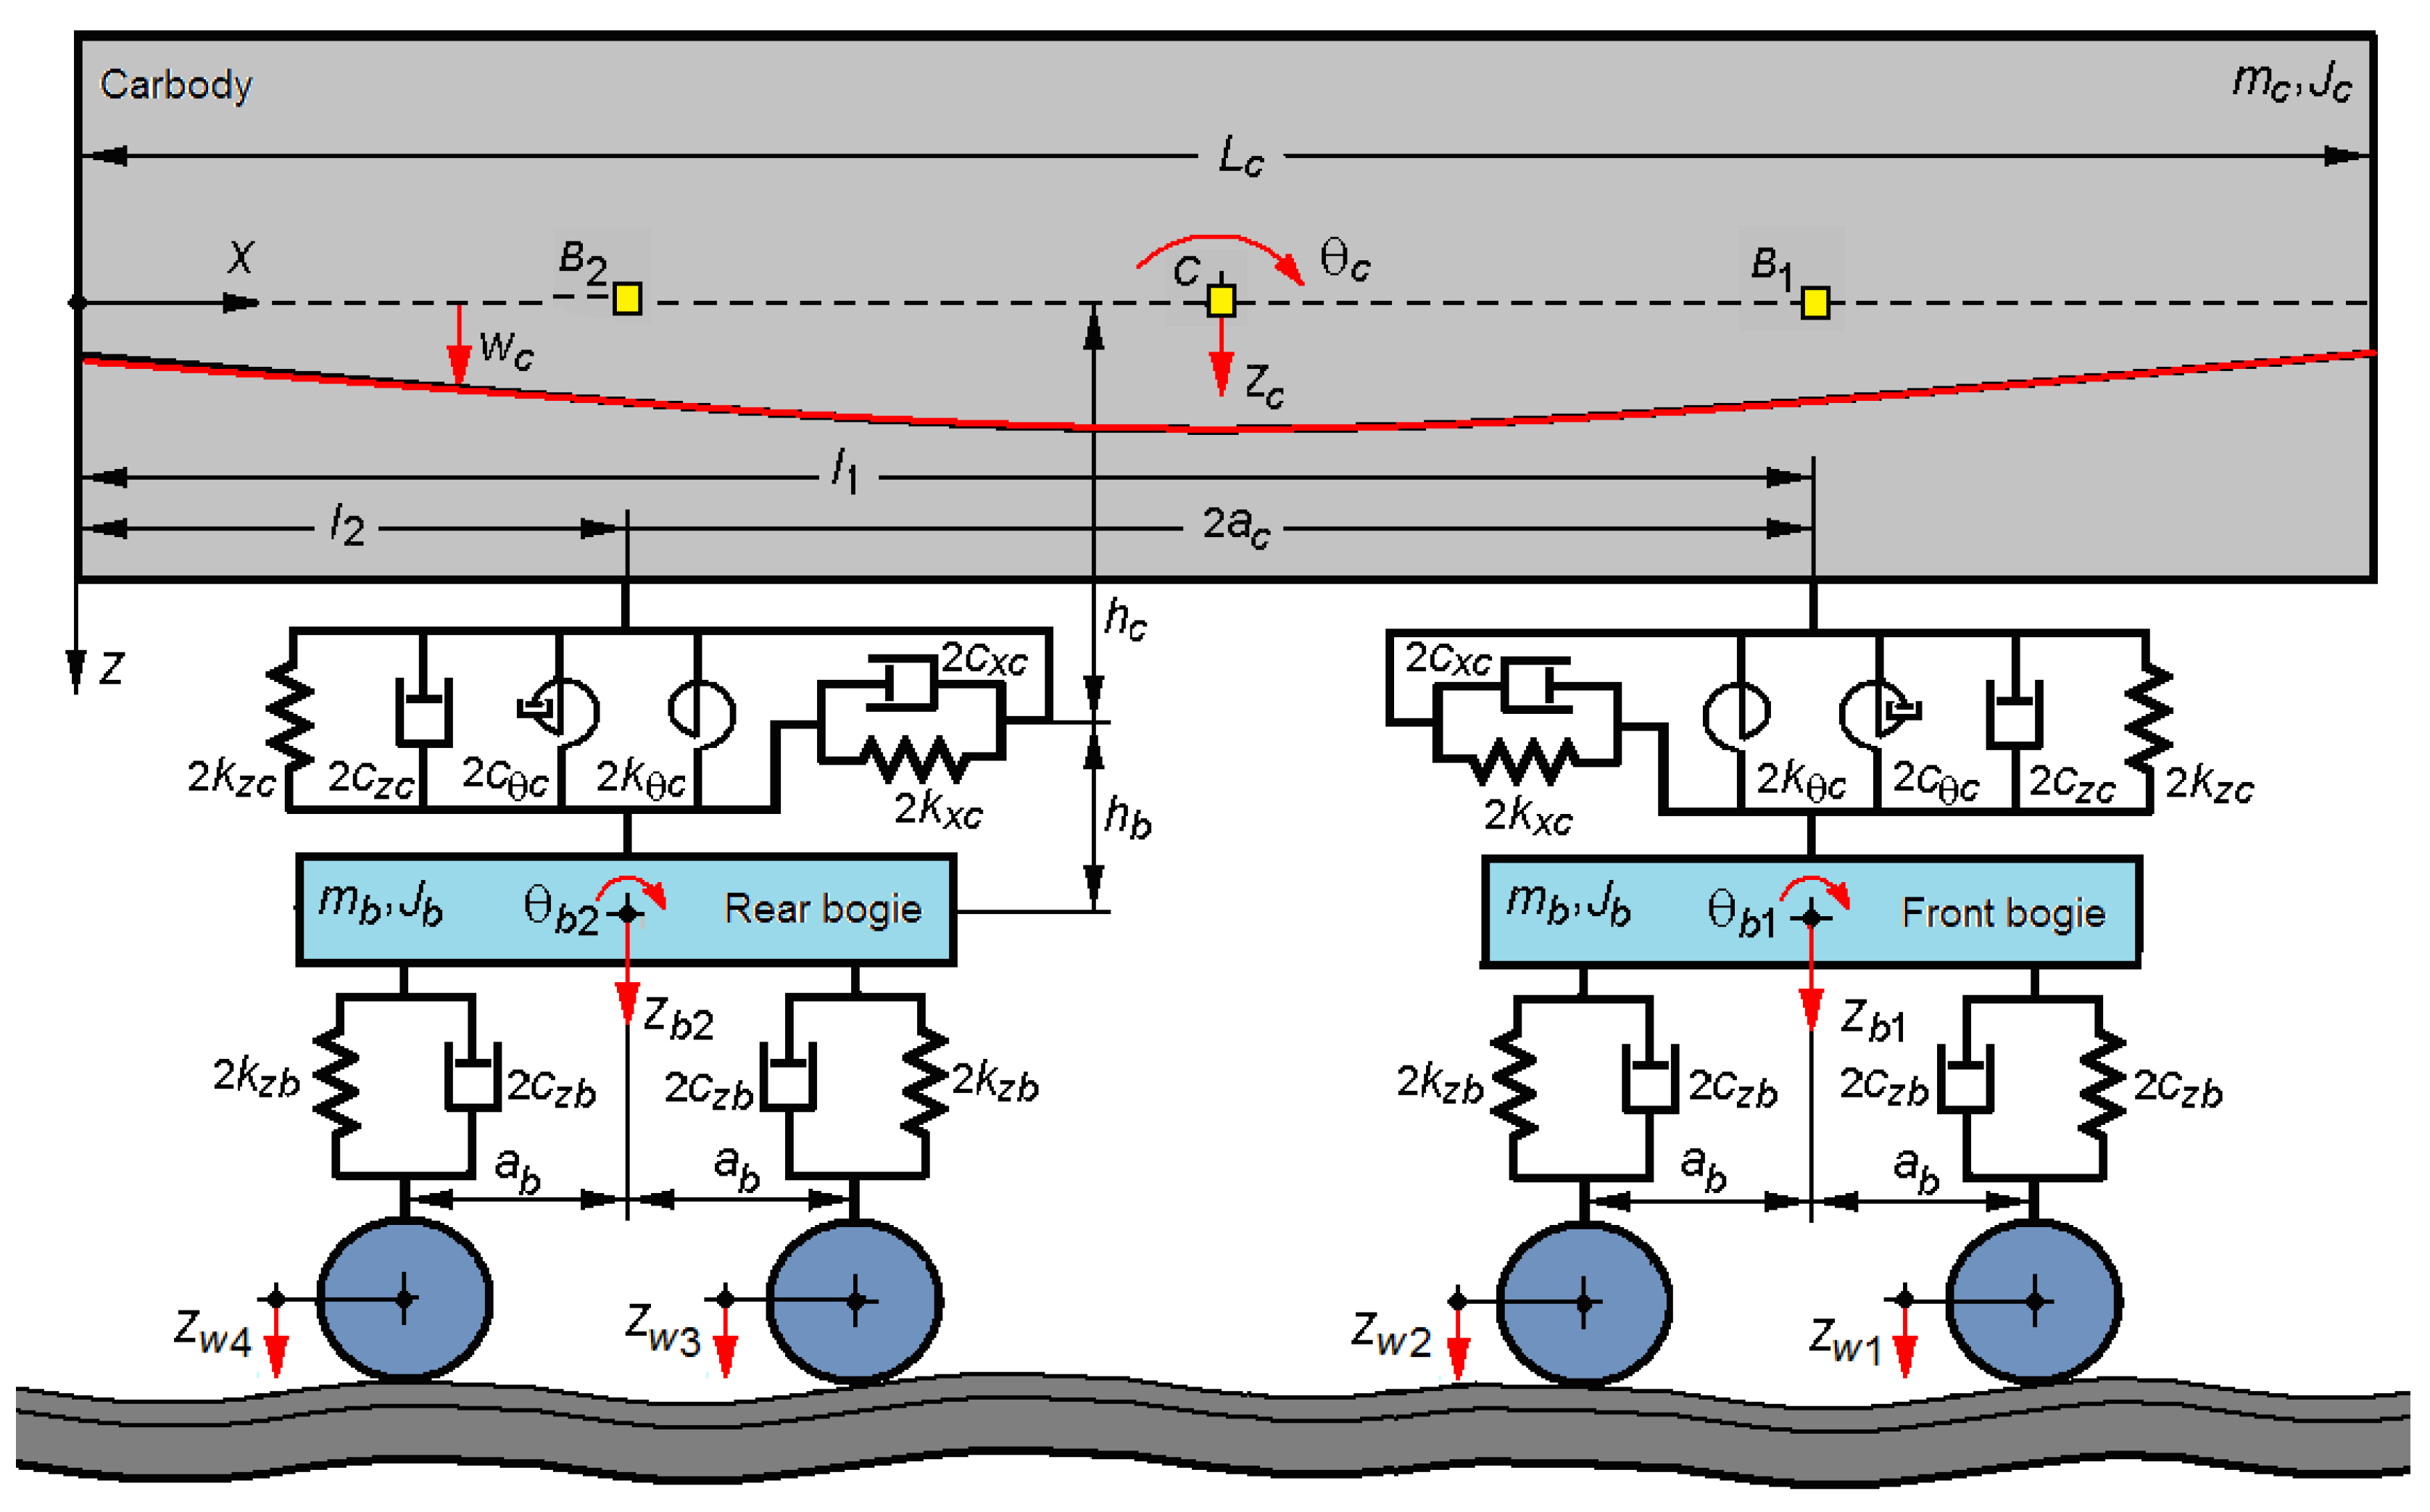
2. Model of the Railway Vehicle for Ride Comfort Assessment at Vertical Vibrations

To evaluate the ride comfort during running at a constant velocity on a track with vertical irregularities, a model of the rigid-flexible coupled vehicle is being used. This model is featured in Figure 1 [35,43], and Table 1 contains the model parameters.
In terms of the track model, the rigid track hypothesis is adopted. This simple approach is justified by the fact that the eigenfrequencies of the vertical vibrations modes of the vehicle carbody, relevant for the ride comfort, are much lower than the wheelset-track system frequencies.
Because bogies and wheelsets have a reduced elastic deformation, they are represented through rigid bodies. The vibration modes of the two bogies in the vertical plan are bounce zb1,2 and pitch θb1,2. The vertical displacements of the four wheelsets zw1...4 are equal with the vertical track irregularities.
z w 1 , 2 = η ( x + a c ± a b ) ,   z w 3 , 4 = η ( x a c ± a b )
where η(x) is the function of the vertical track irregularity and x = V t is the coordinate for the carbody center.
The vehicle carbody is represented by a free-free equivalent beam of constant section and uniformly distributed mass, Euler-Bernoulli type. This model gives the possibility to consider the vertical vibration modes of the carbody that are relevant for the ride comfort, namely the rigid modes vibration—bounce zc, pitch θc—and the first vertical bending mode.
The vertical displacement of the carbody medium fiber wc(x, t) is the result of overlapping of the three vibration modes
w c ( x , t ) = z c ( t ) + ( x L c 2 ) θ c ( t ) + X c ( x ) T c ( t )
where Tc(t) is the coordinate of the carbody bending and Xc(x) represents the natural function of this vibration mode, described in the equation
X c ( x ) = sin β x + sinh β x ( sin β L c sinh β L c ) ( cos β x + cosh β x ) cos β L c cosh β L c
with   β = ω c 2 ρ c E I 4   and   cos β L c cosh β L c = 1
where ωc is the natural angular frequency of the carbody bending, and ρc = mc/Lc—beam mass per length unit.
Each wheelset is connected to the bogie frame through a Kelvin-Voigt system modeling the primary suspension. The bogie is linked to the carbody through the secondary suspension, modeled via an ensemble of three Kelvin-Voigt systems, two for translation (vertical and longitudinal) and one for rotation.The Kelvin-Voigt system for translation in the longitudinal direction models the longitudinal traction system between carbody and bogie, while the elements in the Kelvin-Voigt system for rotation take over the relative angular displacement between carbody and bogie. The secondary suspension plan is found at distance hc from the carbody medium fiber and at distance hb from the bogie gravity center.
The motion equation of the carbody vehicle has the general form
E I 4 w c ( x , t ) x 4 + μ I 5 w c ( x , t ) x 4 t + ρ c 2 w c ( x , t ) t 2 = i = 1 2 F z c i δ ( x l i ) + i = 1 2 ( M c i h c F x c i ) d δ ( x l i ) d x
where EI is bending modulus (E—longitudinal modulus of elasticity, and I—inertia moment of the beam’s transversal section), μ—structural damping coefficient, and δ(.) is Dirac’s delta function. Fzci, Fxci and Mci noted the forces and moments, respectively, due to the secondary suspension of bogie i (with i = 1, 2). In applying the modal analysis method and considering the orthogonality property of the eigenfunction of the carbody vertical bending, the Equation (5) turns into three two-order differential equations with ordinary derivatives, which describe the movements of bounce, pitch and bending of the carbody.
m c z ¨ c = i = 1 2 F z c i
J c θ ¨ c = i = 1 2 F z c i ( l i L c 2 ) i = 1 2 ( M c i h c F x c i )
m m c T ¨ c + c m c T ˙ c + k m c T c = i = 1 2 F z c i X c ( l i ) + i = 1 2 ( M c i h c F x c i ) d X c ( l i ) d x
where kmc is the carbody modal stiffness, cmc—carbody modal damping and mmc—carbody modal mass.
k m c = E I 0 L ( d 2 X c d x 2 ) 2 d x ,   c m c = μ I 0 L ( d 2 X c d x 2 ) 2 d x ,   m m c = ρ c 0 L X c 2 d x
The equations describing the bounce and pitch motions of the bogies are
m b z ¨ b 1 = i = 1 2 F z b i F z c 1 ,   m b z ¨ b 2 = i = 3 4 F z b i F z c 2
J b θ ¨ b 1 = ± a b i = 1 2 F z b i h b F x c 1 ,   J b θ ¨ b 2 = ± a b i = 3 4 F z b i h b F x c 2
where Fzb1...4 stands for the forces due to the primary suspension.
Details regarding the forces and moments, respectively, due to the secondary suspension and primary suspension, as well as the final form of the motion equations are to be found in the Appendix A.
The motion equations for the carbody and bogies make up a seven-equation system with ordinary derivatives. The system can be matrix-like, written
M p ¨ + C p ˙ + K p = P z ˙ w + R z w
where M, C and K are the inertia, damping and stiffness matrices, P and R are the displacement and velocity input matrices, with zw the vector of the heterogeneous terms.

3. The Dynamic Response of the Railway Vehicle to the Track Vertical Irregularities

The track vertical irregularities are considered to be represented as a stationary stochastic process, which can be described via the power spectral density. The theoretical curve of the power spectral density is representative for the average statistical properties of the European railway, as in the relation [49]
S ( Ω ) = A Ω c 2 ( Ω 2 + Ω r 2 ) ( Ω 2 + Ω c 2 )
where Ω is the wavelength, Ωc = 0.8246 rad/m, Ωr = 0.0206 rad/m, and A is a coefficient depending on the track quality. For a high-quality track, A = 4.032× 10⁻⁷rad∙m, whereas for a low-quality, the coefficient A is 1.080 × 10⁻⁶rad∙m.
As a function of the angular frequency ω = VΩ, where V is the vehicle velocity, the power spectral density of the track irregularities can be written in the below form
G ( ω ) = S ( ω / V ) V = A Ω c 2 V 3 [ ω 2 + ( V Ω c ) 2 ] [ ω 2 + ( V Ω r ) 2 ]
In terms of ride comfort, what interests us is the dynamic response in three carbody reference points, located at the carbody center and against the two bogies. These points are shown in Figure 1 as C—at the carbody center, B1 and B2—above the bogies, against the leaning points of the carbody on the secondary suspension.
The frequency response functions of the vertical acceleration at the carbody center and in the points above the two bogies, respectively, are expressed in the below equations
H ¯ C ( ω ) = ω 2 [ H ¯ z c ( ω ) + X c ( L c / 2 ) H ¯ T c ( ω ) ]
H ¯ B 1 , 2 ( ω ) = ω 2 [ H ¯ z c ( ω ) ± a c H ¯ θ c ( ω ) + X c ( l 1 , 2 ) H ¯ T c ( ω ) ]
where H ¯ z c ( ω ) , H ¯ θ c ( ω ) , H ¯ T c ( ω ) are the frequency response functions corresponding to the rigid vibration modes of bounce and pitch, and to the vertical bending of the carbody.
Starting from the frequency response functions of the vertical acceleration of the carbody and the power spectral density of the track irregularities, the power spectral density of the carbody vertical acceleration in three carbody reference points can be calculated as
G C ( ω ) = ω 4 G ( ω ) | H ¯ z c ( ω ) + X c ( L c / 2 ) H ¯ T c ( ω ) | 2
G B 1 , 2 ( ω ) = ω 4 G ( ω ) | H ¯ z c ( ω ) ± a c H ¯ θ c ( ω ) + X c ( l 1 , 2 ) H ¯ T c ( ω ) | 2
To determine the ride comfort indices, it is required to calculate the root mean square of the carbody vertical acceleration. This is calculated based on the dynamic response of the vehicle carbody, expressed as the power spectral density of acceleration.
a C = 1 π f 1 f 2 G C ( ω ) d ω ,   a B 1 , 2 = 1 π f 1 f 2 G B 1 , 2 ( ω ) d ω
where the frequencies f1 and f2 depend on the comfort assessment method. For the mean comfort method, f1 = 0.4 Hz and f2 = 80 Hz, while f1 = 0.5 Hz and f2 = 30 Hz are considered for the index method Wz.

4. Ride Comfort Assessment Methods

4.1. Mean Comfort Method

The mean comfort method was initially presented in UIC 513R leaflet [25], then in the standard of railway applications EN 12299 [26]. The UIC 513R leaflet is a guide to assess the mean comfort in the railway vehicles. The standard EN 12299 completes the UIC 513R leaflet by considering the effects from discrete events and running on connection curves upon the instantaneous comfort.
The quantification of the mean comfort to vibrations is made with ride comfort index (NMV) and with a conventional scale linking the values of this index and the comfort sensation (see Table 2).
The ride comfort index is calculated with the general relation [25,26]
N M V = 6 ( a X 95 W a d ) 2 + ( a Y 95 W a d ) 2 + ( a Z 95 W a b ) 2
where aX, aY and aZ is the root mean square of the longitudinal, lateral and vertical carbody acceleration, 95 refers to the quantile of order 95%, and Wad, Wab represent the weighting filters of the longitudinal, lateral, respectively vertical acceleration.
According to ref. [26] and depending on application, the following partial comfort indexes can be used: NMVX—for ride comfort at longitudinal vibration, NMVY—for ride comfort at lateral vibration and NMVV—for ride comfort at vertical vibration. In this standard, there is no distinction regarding the conventional comfort scale (see Table 2) for NMV or NMVX, respectively NMVY and NMVZ. In other words, the comfort scale is general for the ride comfort index and any partial ride comfort index.
To evaluate the vertical ride comfort, the partial comfort index is used, through the general relation [26]
N M V Z = 6 a Z 95 W a b
where Wab = Wa∙Wb stands for the weighting filter of the vertical acceleration.
The filter Wa is a passband filter with the following frequency weighting function
H a ( s ) = s 2 ( 2 π f 2 ) 2 [ s 2 + 2 π f 1 Q 1 s + ( 2 π f 1 ) 2 ] [ s 2 + 2 π f 2 Q 1 s + ( 2 π f 2 ) 2 ] ,
where s = iω (with i2 = −1), f1 = 0.4 Hz, f2= 100 Hz and Q1 = 0.71.
The filter Wb takes into account the high human sensitivity to the vertical vibrations and has the frequency weighting function in the form of
H b ( s ) = ( s + 2 π f 3 ) [ s 2 + 2 π f 5 Q 3 s + ( 2 π f 5 ) 2 ] 2 π K f 4 2 f 6 2 [ s 2 + 2 π f 4 Q 2 s + ( 2 π f 4 ) 2 ] [ s 2 + 2 π f 6 Q 4 s + ( 2 π f 6 ) 2 ] f 3 f 5 2 ,
where f3 = 16 Hz, f4 = 16 Hz, f5 = 2.5 Hz, f6 = 4 Hz, Q2 = 0.63, Q4 = 0.8 and K = 0.4.
Figure 2 shows the frequency weighting functions of the two weighting filters, whereas the Figure 3 showcases the frequency weighting function H a b = H a H b of the filter Wab. The latter shows that the mean comfort takes into account the higher sensitivity of the human body to vertical vibrations within the frequency interval of 4 Hz and 16 Hz [28].

4.2. Sperling’s Method

As Sperling’s method is concerned, the passengers’ perception on the vibrations occuring during the running of the railway vehicle is based on the comfort index Wz. The scale of values of the comfort index Wz and the significance of each value is featured in Table 3.
Assuming that the spectrum of accelerations is a continuous frequency function and the energy of vibrations is concentrated between 0.5 and 30 Hz, the following equation can be used to calculate the comfort index Wz,
W z = 0 , 5 30 a 3 ( f ) B 3 ( f ) d f 10 ,
where a is the acceleration amplitude in cm/s2, B represents the frequency weighting function that expresses human vibration sensitivity, and f= ω/2π. Figure 4 shows the frequency weighting function and highlights the fact that the higher sensitivity of the human body to vertical vibrations is manifested in the frequency interval of 3 to 7 Hz [28].
To assess the ride comfort at the vertical vibrations, the weighting function B comes from
B ( f ) = 0.588 1.911 f 2 + ( 0.25 f 2 ) 2 ( 1 0.277 f 2 ) 2 + ( 1.563 f 0.0368 f 3 ) 2 .
Figure 5 presents a correlation between the ride comfort index NMV and the ride comfort index Wz, established through the comfort sensation [13].

5. Results and Discussion

This section analyzes the two ride comfort assessment methods for the railway vehicle—mean comfort and Sperling’s—using the results from the numerical simulations for the ride comfort indices in the carbody reference points, obtained using MATLAB codes. Numerical simulations are developed based on the vehicle model presented in Section 2 and the ride comfort evaluation methods included in Section 4. The reference parameters of the vehicle model are shown in Table 4 and they are similar to those of a passenger car operating on the Railway Romanian. Bending stiffness and damping coefficient of the Euler-Bernoulli beam correspond to the natural frequency of the first bending mode of 8 Hz and damping ratio of 0.015. We took note of the vehicle’s running on a low-quality track.
The analysis of the ride comfort indices is extended ower a large velocity range, between 20 and 240 km/h and takes into account the influence of the carbody vertical flexibility, the secondary suspension damping and the primary suspension damping. The results for the ride comfort indices are correlated with the dynamic response of the vehicle carbody expressed as the power spectral density of the frequency weighting acceleration corresponding to each of the two methods, with the weighting filter Wab and the weighting filter B, respectively.

5.1. Analysis of the Dynamic Response of the Vehicle Carbody

In this section, we analyze the dynamic response of the vehicle carbody expressed as the power spectral density of the vertical acceleration before and after weighting with the weighting function corresponding to the mean comfort method and the weighting function corresponding to Sperling’s method, respectively. The results of this analysis will be the basis for explanations regarding the significant results obtained via the two methods of assessing ride comfort (ride comfort index NMVZ and ride comfort index Wz), under the same conditions of vehicle running. The purpose of this analysis is to highlight the dominant vibration modes of the carbody and their effect upon the dynamic response of the carbody before and after frequency weighting.
The diagrams (a) in Figure 6, Figure 7 and Figure 8 display the dynamic response in the carbody reference points, expressed as the power spectral density of the vertical acceleration.At the carbody center (Figure 6), thepower spectral density of the acceleration is dominated by the bounce vibration (at 1.17 Hz). In the reference points located above the two bogies (Figure 7 and Figure 8), the dominant vibration modes of the carbody are the pitch (at 1.53 Hz) and the bounce. At high velocities, the peaks corresponding to the carbody bending can be seen in all the carbody reference points (at 8 Hz). This vibration mode has a more important weight at the carbody center [46]. The resonance frequency of the carbody bending is noticed to be in the maximum area of the sensitivity interval of the human body to the vertical vibrations considered by the mean comfort method. Consequently, the ride comfort assessed on the basis of the ride comfort index NMVZ is expected to be greatly affected when the weight of such vibration mode is important.
The diagrams (b) of the Figure 6, Figure 7 and Figure 8 feature the power spectral density of the carbody vertical acceleration weighted with the weighting function Hab, corresponding to the mean comfort method.Due to this weighting filter, bending becomes the dominant vibration mode at the carbody center, at high velocities (see Figure 6), which creates the premise that the ride comfort may be greatly affected. The frequency weighting does not modify the dominant vibration modes in the reference points above the two bogies, namely bounce and pitch (see Figure 7 and Figure 8), yet lowers their effect upon the dynamic response of the carbody.
The diagrams (c) of the Figure 6, Figure 7 and Figure 8 present the power spectral density of the carbody vertical acceleration weighted with the weighting function B, corresponding to Sperling’s method. At the carbody center (Figure 6), the frequency weighting does not change the dominant vibration modes. In this case, the influence of the carbody bending is only visible at high velocities, without dominating the spectrum of the power spectral density of the acceleration. In the reference points located above the two bogies, the dominant vibration modes remain the pitch and bounce (see Figure 7 and Figure 8). Similar to the weighting with the weighting function Hab (see diagrams (b)), the effect of the dominant vibration modes upon the dynamic response of the carbody is visibly lowered after weighting with the weighting function B.
The role of the diagrams in Figure 9, Figure 10 and Figure 11 is to highlight the changes of the dynamic response in the carbody reference points at the dominant resonance frequencies as a result of weighting with the frequency weighting functions Hab and B,respectively. They also highlight an important feature of the vertical vibrations behavior of the railway vehicle—the geometric filtering effect, extensively analyzed in many papers [34,50,51,52,53,54]. Thanks to this effect, a succession of maximum and minimum values occur in the carbody dynamic response, depending on the vehicle wheelbase, frequency and velocity. The geometric filtering is more pronounced at the carbody center, where the effect comes from both the vehicle wheelbase and the bogie wheelbase. The geometric filtering effect has a character nature conditioned by frequency and velocity, with a more important efficiency at high frequencies and low velocities (see Figure 9, diagram (b)).
The diagram (a) in Figure 9 shows that the influence of the bounce vibrations upon the dynamic response at the carbody center is reduced more after weighting with the weighting function Hab only after applying function B. Based on this observation, it can be estimated that Sperling’s method will indicate a weaker ride comfort than the one derived from the mean comfort method, within the velocity range where bounce is the dominant vibration mode.
The diagram (b) of Figure 9 points out at the amplification of the carbody dynamic response at the bending resonance frequency, as a result of the weighting with the weighting function Hab, an aspect already noticed above (see Figure 6, diagram (b)). On the other hand, the weighting function B is noticed to reduce the influence of this vibration mode.
The diagrams in Figure 10 and Figure 11 emphasize the fact that the bounce and pitch vibrations in the carbody reference points located above the two bogies are lowered more due to the weighting with the weighting function Hab compared to the same action with the weighting function B. Therefore, a weaker ride comfort is expected to occur in these carbody reference points while applying Sperling’s method versus the mean comfort method.

5.2. Analysis of the Ride Comfort Indices

Figure 12 features the ride comfort indices in the carbody reference points, calculated for the reference parameters of the model vehicle (see Table 4), depending on velocity. Generally, the ride comfort indices increase along with the velocity in all the carbody reference points. This rise is not continuous, due to the geometric filtering effect. According to both methods of ride comfort assessment, the values of the ride comfort indices in all three carbody reference points are very close, up to 80 km/h. As velocity is going up, the highest values of the ride comfort indices are recorded in the reference points above the two bogies. The ride comfort index NMVZ shows that the comfort index at the carbody center increases, at high velocities, reaching almost the same values with the indices in the points above the bogies. For instance, at 240 km/h, the ride comfort indices are 1.68 at the carbody center, 1.72 above bogie 1 and 1.86 above bogie 2. These readings can be correlated with the results in Figure 6, diagrams (a) and (b), based on which the ride comfort index NMVZ at the carbody center was anticipated to be affected by the bending vibration at high velocities, which is the dominant vibration mode.
The diagrams in Figure 12 highlight another important aspect—under the same running conditions for the vehicle, the two ride comfort assessment methods lead to significantly different results. The values for the ride comfort indices Wz prove a weaker ride comfort than the one indicated by the ride comfort indices NMVZ, which was estimated based on the analysis of the Figure 9, Figure 10 and Figure 11. For instance, the ride comfort index NMVZ implies a very good comfort and good comfort, while Wz shows that the ride comfort is just noticeable at a low velocity, yet becomes strong irregular or very irregular at velocities higher than 160 km/h. Moreover, at the same velocity, there are also large differences in terms of ride comfort of the carbody reference points. At 240 km/h, for example, the ride comfort index indicates good comfort in all three points, whereas Wz marks that the ride comfort is very irregular above bogie 1, strong irregular, but still tolerable above bogie 2 and cleary noticeable at the carbody center. The explanation lies in the frequency weighting that is different for the two ride comfort assessment methods; in all the carbody reference points, the weighting function corresponding to Sperling’s method reduces the influence of the dominant vibration modes—bounce and pitch—less than the corresponding function for the mean comfort method.
Based on the Figure 13 and Figure 14, the influence of the carbody bending frequency upon the ride comfort indices is analyzed. Practically, the change in the bending frequency within the 6–12 Hz interval leads to a reduction in the carbody flexibility by an increase of the bending modulus (EI) from 2.42 × 10⁹Nm2 to 7.11 × 10⁹Nm2. The ride comfort index NMVZ is more affected by the value of the carbody bending frequency, which is visible irrespective of velocity, in all the carbody reference points. Sensitive changes in the ride comfort index NMVZ occur at the carbody center, at high velocities, where the weighting of the carbody bending vibrations is important (see Figure 6, diagram (b)). Unlike the ride comfort index NMVZ, the changes of the ride comfort Wz only take place at the carbody center at velocities higher than 160 km/h, which is consistent with the observations in Figure 7c. All the above also comply with the remarks made for Figure 9b. Nevertheless, both methods demonstrate that the carbody rigidization has positive effects upon the ride comfort, at high velocities.
Further on, the influence of the secondary suspension damping and of the primary suspension damping upon the ride comfort indices is analyzed. To make the analysis simpler, the damping ratios corresponding to the two levels of suspension that are introduced, as follows:
ζ c = 4 c z c 2 4 k z c m c ;   ζ b = 4 c z b 2 4 k z b m b
where ζc is the damping ratio of the secondary suspension and ζb is the damping ratio of the primary suspension. In accordance with the reference parameters of the model vehicle (see Table 4), the reference values of the suspension damping ratios are ζc = 0.12 and ζb = 0.22.
The diagrams in Figure 15 and Figure 16 show the variation of the ride comfort indices due to the change of the damping ratio of the secondary suspension. The general trend in the increase of the damping ratio of the secondary suspension is to have the ride comfort indices decrease to a certain value. Once having reached this value, the ride comfort indices start going up again. Consequently, a value of the damping ratio of the secondary suspension leading to the best ride comfort for a certain velocity can be identified. This value differs among the reference points for the same velocity and the ride comfort assessment method.
As seen in the diagrams in Figure 17 and Figure 18, the ride comfort indices decrease continually along with the increase in the damping ratio of the primary suspension.
The diagrams in Figure 15, Figure 16, Figure 17 and Figure 18 also illustrate that, irrespective of the ride comfort assessment method, the ride comfort indices similarly depend on the velocity in all three reference points. Above the front bogie, the ride comfort indices increase continually, while these indices present a variation in ‘N’ (increase-decrease-increase) at the carbody center and above the rear bogie.

6. Conclusions

This paper examines two methods for assessing ride comfort of railway vehicles, namely the mean comfort methods and Sperling’s method, in order to assess the ride comfort of the railway vehicle at vertical vibrations. The two methods have in common the fact that for estimating the comfort sensation they use comfort indices, ride comfort index NMVZ and ride comfort index Wz, respectively. The analysis of the two methods of ride comfort assessment is conducted by using ride comfort indices in three important carbody points, derived from numerical simulations.
The conclusions highlighted based on the results obtained make important contributions to an open problem of research—correlation between different methods of evaluating ride comfort.
A first important conclusion concerns this: under the same conditions of vehicle running, the ride comfort indices Wz values indicate a weaker ride comfort than in the case of the ride comfort indices NMVZ. This conclusion has been correlated with the results of the dynamic response analysis of the vehicle carbody, expressed as the power spectral density of the weighted frequency acceleration corresponding to the two ride comfort assessment methods. These results highlighted another important conclusion of the paper—the frequency weighting does not change the dominant vibration modes, i.e., bounce and pitch, yet reduces their effect upon the dynamic response of the carbody; the weighting functioncorresponding to Sperling’s method reduces less the influence of the dominant vibration modes upon the dynamic response of the carbody than the weighting function associated with the mean comfort method.
Another conclusion of the work refers to the increase of the comfort index NMVZ at the carbody center at high velocities. This conclusion is explained by the fact that the weighting function corresponding to the mean comfort method amplifies the dynamic response at the carbody center to the bending resonance frequency, which is in the maximum area in the sensitivity interval of the human body to the vertical vibrations. The carbody bending becomes the dominant vibration mode at high velocities, significantlyaffecting the ride comfort.
The last conclusion shows that, as a rule, the variation of the two comfort indices with the change of the damping ratios of the secondary and primary suspensions is similar. When the damping ratio of the secondary suspension increases, the ride comfort indices tend to lower to a value for which the best ride comfort occurs, after which they start rising again. A higher damping ratio of the primary suspension leads to a continuous decrease in the ride comfort indices.

Author Contributions

Conceptual approach, M.D.; Methodology, M.D.; Software, M.D. and D.I.S.; Validation, M.D.; Formal analysis, M.D. and D.I.S.; Writing—original draft, M.D.; Writing—review and editing, D.I.S. All authors have read and agreed to the published version of the manuscript.

Funding

This research received no external funding.

Institutional Review Board Statement

Not applicable.

Informed Consent Statement

Not applicable.

Data Availability Statement

Not applicable.

Conflicts of Interest

The authors declare no conflict of interest.

Appendix A

The forces and moments, respectively, due to the secondary suspension of bogie i (with i = 1, 2) are as below
F z c i = 2 c z c ( w c ( l i , t ) t z ˙ b i ) 2 k z c [ w c ( l i , t ) z b i ]
F x c i = 2 c x c ( h c 2 w c ( l i , t ) x t + h b θ ˙ b i ) + 2 k x c ( h c w c ( l i , t ) x + h b θ b i )
M c i = 2 c θ c ( 2 w c ( l i , t ) x t θ ˙ b i ) 2 k θ c [ w c ( l i , t ) x θ b i ]
The carbody motion equations are in the form of
m c z ¨ c + 2 c z c [ 2 z ˙ c + 2 ε T ˙ c ( z ˙ b 1 + z ˙ b 2 ) ] + 2 k z c [ 2 z c + 2 ε T c ( z b 1 + z b 2 ) ] = 0
J c θ ¨ c + 2 c z c a c [ 2 a c θ ˙ c ( z ˙ b 1 z ˙ b 2 ) ] + 2 k z c a c [ 2 a c θ c ( z b 1 z b 2 ) ] + + 2 c x c h c [ 2 h c θ ˙ c + h b ( θ ˙ b 1 + θ ˙ b 2 ) ] + 2 k x c h c [ 2 h c θ c + h b ( θ b 1 + θ b 2 ) ] + + 2 c θ c [ 2 θ ˙ c ( θ ˙ b 1 + θ ˙ b 2 ) ] + 2 k θ c [ 2 θ c ( θ b 1 + θ b 2 ) ] = 0  
m m c T ¨ c + c m c T ˙ c + k m c T c + + 2 c z c ε [ 2 z ˙ c + 2 ε T ˙ c ( z ˙ b 1 + z ˙ b 2 ) ] + 2 k z c ε [ 2 z c + 2 ε T c ( z b 1 + z b 2 ) ] + + 2 c x c h c λ [ 2 h c λ T ˙ c + h b ( θ ˙ b 1 θ ˙ b 2 ) ] + 2 k x c h c λ [ 2 h c λ T c + h b 2 ( θ b 1 θ b 2 ) ] + + 2 c θ c λ [ 2 λ T ˙ c ( θ ˙ b 1 θ ˙ b 2 ) ] + 2 k θ c λ [ 2 λ T c ( θ b 1 θ b 2 ) ] = 0  
where the following notations were introduced, based on the symmetry properties of the eigenfunction Xc(x).
ε = X c ( l 1 ) = X c ( l 2 )
λ = d X c ( l 1 ) d x = d X c ( l 2 ) d x
The forces due to the primary suspension are
F z b 1 , 2 = 2 c z b ( z ˙ b 1 + a b θ ˙ b 1 z ˙ w 1 , 2 ) 2 k z b ( z b 1 + a b θ b 1 z w 1 , 2 )
F z b 3 , 4 = 2 c z b ( z ˙ b 2 a b θ ˙ b 2 z ˙ w 3 , 4 ) 2 k z b ( z b 2 a b θ b 2 z w 3 , 4 )
The final form of the bogie motion equations is
m b z ¨ b 1 + 4 c z b z ˙ b 1 + 4 k z b z b 1 + 2 c z c ( z ˙ b 1 z ˙ c a c θ ˙ c ε T ˙ c ) + + 2 k z c ( z b 1 z c a c θ c ε T c ) = 2 c z b ( z ˙ w 1 + z ˙ w 1 2 ) + 2 k z b ( z w 1 + z w 2 )
J b θ ¨ b 1 + 4 c z b a b 2 θ ˙ b 1 + 4 k z b a b 2 θ b 1 + 2 c x c h b [ h b θ ˙ b 1 + h c ( θ ˙ c + ε T ˙ c ) ] + + 2 k x c h b [ h b θ b 1 + h c ( θ c + ε T c ) ] = 2 c z b a b ( z ˙ w 1 z ˙ w 2 ) + 2 k z b a b ( z w 1 z w 2 )
m b z ¨ b 2 + 4 c z b z ˙ b 2 + 4 k z b z b 2 + 2 c z c ( z ˙ b 2 z ˙ c + a c θ ˙ c ε T ˙ c ) + + 2 k z c ( z b 2 z c + a c θ c ε T c ) = 2 c z b ( z ˙ w 3 + z ˙ w 1 4 ) + 2 k z b ( z w 3 + z w 4 )
J b θ ¨ b 2 + 4 c z b a b 2 θ ˙ b 2 + 4 k z b a b 2 θ b 2 + 2 c x c h b [ h b θ ˙ b 2 + h c ( θ ˙ c ε T ˙ c ) ] + + 2 k x c h b [ h b θ b 2 + h c ( θ c ε T c ) ] = 2 c z b a b ( z ˙ w 3 z ˙ w 4 ) + 2 k z b a b ( z w 3 z w 4 )

References

  1. Kim, Y.G.; Kwon, H.B.; Kim, S.W.; Park, C.K.; Park, T.W. Correlation of ride comfort evaluation methods for railway vehicles. Proc. Inst. Mech. Eng. Part F J. Rail Rapid Transit 2003, 217, 73–88. [Google Scholar] [CrossRef]
  2. Kim, Y.G.; Choi, S.; Kim, S.W.; Kim, Y.M.; Park, T.W. An experimental study on the ride comfort of the Korean high-speed train. Techniques 2009, 33, 30–37. [Google Scholar] [CrossRef]
  3. Stănică, D.I.; Dumitriu, M. Critical points numerical analysis of ride comfort of the flexible railway carbody. IOP Conf. Ser. Mater. Sci. Eng. 2019, 682, 012007. [Google Scholar] [CrossRef]
  4. Kardas-Cinal, E. Ride comfort for various passenger positions in a railwayvehicle—Simulations tudy. Arch. Transp. 2010, 22, 189–199. [Google Scholar] [CrossRef]
  5. Vincent, J. Etude du Concept de Suspensions Actives. Applications Aux Voitures Ferroviaires. Ph.D. Thesis, Ecole Doctorale de Mécanique de Lyon, Lyon, France, 1999. [Google Scholar]
  6. Mansfield, N.J. Human Response to Vibration; CRC Press LLC: Boca Raton, FL, USA, 2005. [Google Scholar]
  7. Griffin, M.J. Handbook of Human Vibration; Academic Press: London, UK, 1990. [Google Scholar]
  8. Richards, G.L. On the Psychology of Passenger Comfort. In Human Factors in Transport Research; Academic Press: New York, NY, USA, 1980; Volume 2. [Google Scholar]
  9. Suzuki, H. Effects of the range and frequency of vibrations on the momentary riding comfort evaluation of a railway vehicle. Jpn. Psychol. Res. 1998, 40, 156–165. [Google Scholar] [CrossRef]
  10. Munawir, T.I.T.; Samah, A.A.A.; Rosle, M.A.A.; Azlis-Sani, J.; Hasnan, K.; Sabri, S.M.; Ismail, S.M.; Yunos, M.N.A.M.; Bin, T.Y. A comparison study on the assessment of ride comfort for LRT passengers. IOP Conf. Ser. Mater. Sci. Eng. 2017, 226, 012039. [Google Scholar] [CrossRef] [Green Version]
  11. Wei, X.; Liu, Y.; Sun, Q.; Jia, L.; Wang, Y. Rail vehicle ride comfort prediction based on bogie acceleration measurements. In Proceedings of the 2013 25th Chinese Control and Decision Conference (CCDC), Guiyang, China, 25–27 May 2013; pp. 3810–3815. [Google Scholar]
  12. Iwnicki, S. Handbook of Railway Vehicle Dynamics; Taylor&Francis Group: Milton Park, UK, 2006. [Google Scholar]
  13. Dumitriu, M.; Leu, M. Correlation between ride comfort index and Sperling’s index for evaluation ride comfort in railway vehicles. Appl. Mech. Mater. 2018, 880, 201–206. [Google Scholar] [CrossRef]
  14. ISO 2631. Guide for the Evaluation of Human Exposure to Whole-Body Vibration; ISO: Geneva, Switzerland, 1974. [Google Scholar]
  15. ISO 2631-1. Mechanical Vibration and Shock—Evaluation of Human Exposure to Whole-Body Vibration. Part 1: General Requirements; ISO: Geneva, Switzerland, 1985. [Google Scholar]
  16. ISO2631-3. Evaluation of Human Exposure to Whole-Body Vibration—Part 3: Evaluation of Exposure to Whole-Body Z-Axis Vertical Vibration in the Frequency Range 0.1 to 0.63 Hz; ISO: Geneva, Switzerland, 1985. [Google Scholar]
  17. ISO 2631-1. Mechanical Vibration and Shock—Evaluation of Human Exposure to Whole-Body Vibration. Part 1: General Requirements; ISO: Geneva, Switzerland, 1997. [Google Scholar]
  18. AS 2670-1. Evaluation of Human Exposure to Whole-Body Vibration. General Requirements; Standards Australia: Sydney, Australia, 1983. [Google Scholar]
  19. BS 6841. Guide to Measurement and Evaluation of Human Exposure to Whole-Body Mechanical Vibration and Repeated Shock; BSI: London, UK, 1987. [Google Scholar]
  20. Helbig, W.; Sperling, E. Verfahren zur beurteilung der laufeigenschaften von eisenbahnwagen (Process for the evaluation of the running behavior of railway vehicles). Organ Für Die Fortschr. Des Eisenb. 1941, 96, 177–187. [Google Scholar]
  21. Sperling, E. Beitrag zur beurteilung des fahrkomforts in schienenfahrzeugen (Contribution to the evaluation of ride comfort in rail vehicles). Glas. Ann. 1956, 80, 314–320. [Google Scholar]
  22. Dumitriu, M.; Gheţi, M.A. Evaluation of the ride quality and ride comfort in railway vehicles based on the index Wz. Ann. Fac. Eng. Hunedoara 2015, 13, 123–132. [Google Scholar]
  23. B153/RP21. Application of ISO Standard to Railway Vehicles: Comfort Index Nmv—Comparison with the ISO/SNCF Comfort Note and with the Wz; European Rail Research Istitute: Utrecht, The Netherlands, 1993. [Google Scholar]
  24. B153/RP1-RP20. Application of ISO Standard to Railway Vehicles; European Rail Research Istitute: Utrecht, The Netherlands, 1981. [Google Scholar]
  25. UIC 513R. Guidelines for Evaluating Passenger Comfort in Relation to Vibration in Railway Vehicles; International Union of Railways: Paris, France, 1994. [Google Scholar]
  26. EN 12299. Railway Applications. Ride Comfort for Passengers. Measurement and Evaluation; British Standard: London, UK, 1999. [Google Scholar]
  27. ISO 10056. Mechanical Vibration-Measurement and Analysis of Whole-Body Vibration to Which Passengers and Crew are Exposed in Railway Vehicles; ISO: Geneva, Switzerland, 2001. [Google Scholar]
  28. Jiang, Y.; Chen, B.K.; Thompson, C. A comparison study of ride comfort indices between Sperling’s method and EN 12299. Int. J. Rail Transp. 2019, 7, 279–296. [Google Scholar] [CrossRef]
  29. Haladin, I.; Lakušić, S.; Bogut, M. Overview and analysis of methods for assessing ride comfort on tram tracks. Građevinar 2019, 71, 901–921. [Google Scholar]
  30. Dumitriu, M.; Stănică, D.I. Influence of the primary suspension damping on the ride comfort in the railway vehicles. Mater. Sci. Forum 2019, 957, 53–62. [Google Scholar] [CrossRef]
  31. Dumitriu, M. Influence of the suspension damping on ride comfort of passenger railway vehicles. Upb Sci. Bull. Ser. D Mech. Eng. 2012, 74, 75–90. [Google Scholar]
  32. Corradi, R.; Mazzola, L.; Ripamonti, F. Optimisation of secondary suspension dampers to improve the ride comfort of high-speed rail vehicles. In Proceedings of the 23rd International Congress on Sound and Vibration, ICSV 2016, Athens, Greece, 10–14 July 2016. [Google Scholar]
  33. Johnsson, A.; Berbyuk, V.; Enelund, M. Pareto optimisation of railway bogie suspension damping to enhance safety and comfort. Veh. Syst. Dyn. 2012, 50, 1379–1407. [Google Scholar] [CrossRef]
  34. Zhou, J.; Goodall, R.; Ren, L.; Zhang, H. Influences of car body vertical flexibility on ride quality of passenger railway vehicles. Proc. Inst. Mech. Eng. Part F J. Rail Rapid Transit 2009, 223, 461–471. [Google Scholar] [CrossRef] [Green Version]
  35. Dumitriu, M.; Cruceanu, C. Influences of carbody vertical flexibility on ride comfort of railway vehicles. Arch. Mech. Eng. 2017, 64, 119–238. [Google Scholar] [CrossRef]
  36. Shi, H.L.; Luo, R.; Wu, P.B. Application of DVA theory in vibration reduction of carbody with suspended equipment for high-speed EMU. Sci. China Technol. Sci. 2014, 57, 1425–1438. [Google Scholar] [CrossRef]
  37. Dumitriu, M. Numerical analysis on the influence of suspended equipment on the ride comfort in railway vehicles. Arch. Mech. Eng. 2018, 65, 477–496. [Google Scholar]
  38. Kargarnovin, M.H.; Younesian, D.; Thompson, D.; Jones, C. Ride comfort of high-speed trains travelling over railway bridges. Veh. Syst. Dyn. 2005, 43, 173–199. [Google Scholar] [CrossRef]
  39. Sadeghi, J.; Rabiee, S.; Khajehdezfuly, A. Effect of rail irregularities on ride comfort of train moving over ballast-less tracks. Int. J. Struct. Stab. Dyn. 2019, 19, 1950060. [Google Scholar] [CrossRef]
  40. Lewis, T.D.; Jiang, J.Z.; Neild, S.A.; Gong, C.; Iwnicki, S.D. Using an inerter-based suspension to improve both passenger comfort and track wear in railway vehicles. Veh. Syst. Dyn. 2020, 58, 472–493. [Google Scholar] [CrossRef]
  41. Ripamonti, F.; Chiarabagliom, A. A smart solution for improving ride comfort in high-speed railway vehicles. J. Vib. Control 2019, 25, 1958–1973. [Google Scholar] [CrossRef]
  42. Dumitriu, M. Study on improving the ride comfort in railway vehicles using anti-bending dampers. Appl. Mech. Mater. 2018, 880, 207–212. [Google Scholar] [CrossRef]
  43. Dumitriu, M. Ride comfort enhancement in railway vehicle by the reduction of the carbody structural flexural vibration. IOP Conf. Ser. Mater. Sci. Eng. 2017, 227, 012042. [Google Scholar] [CrossRef] [Green Version]
  44. Graa, M. Modeling and control for vertical rail vehicle dynamic vibration with comfort evaluation. Int. J. Math. Models Methods Appl. Sci. 2017, 11, 240–245. [Google Scholar]
  45. Dumitriu, M. A new approach to reducing the carbody vertical bending vibration of railway vehicles. Veh. Syst. Dyn. 2017, 55, 1787–1806. [Google Scholar] [CrossRef]
  46. Schandl, G.; Lugner, P.; Benatzky, C.; Kozek, M.; Stribersk, M. Comfort enhancement by an active vibration reduction system for a flexible railway car body. Veh. Syst. Dyn. 2007, 45, 835–847. [Google Scholar] [CrossRef]
  47. Dumitriu, M. On the critical points of vertical vibration in a railway vehicle. Arch. Mech. Eng. 2014, 61, 115–140. [Google Scholar] [CrossRef]
  48. Dumitriu, M.; Crăciun, C. Modelling of structural flexibility of the carbody railway vehicles. MATEC Web Conf. 2017, 112, 07007. [Google Scholar] [CrossRef] [Green Version]
  49. C116. Interaction between Vehicles and Track, RP 1, Power Spectral Density of Track Irregularities, Part 1: Definitions, Conventions and Available Data; UIC: Utrecht, The Netherlands, 1971. [Google Scholar]
  50. Gong, D.; Zhou, J.; Sun, W.J. On the resonant vibration of a flexible railway car body and its suppression with a dynamic vibration absorber. J. Vib. Control 2013, 19, 649–657. [Google Scholar] [CrossRef]
  51. Dumitriu, M. Analysis of the dynamic response in the railway vehicles to the track vertical irregularities. Part II: The numerical analysis. J. Eng. Sci. Technol. Rev. 2015, 8, 32–39. [Google Scholar] [CrossRef]
  52. Zhou, J.; Wenjing, S. Analysis on geometric filtering phenomenon and flexible car body resonant vibration of railway vehicles. J. Tongji Univ. 2009, 37, 1653–1657. [Google Scholar]
  53. Gong, D.; Gu, Y.J.; Song, Y.J.; Zhou, J. Study on geometry filtering phenomenon and flexible car body resonant vibration of articulated trains. Adv. Mater. Res. 2013, 787, 542–547. [Google Scholar] [CrossRef]
  54. Cheli, F.; Corradi, R. On rail vehicle vibrations induced by track unevenness: Analysis of the excitation mechanism. J. Sound Vib. 2011, 330, 3744–3765. [Google Scholar] [CrossRef]
Figure 1. The mechanical model of the railway vehicle.
Applsci 11 03953 g001
Figure 2. The frequency weighting functions: (a) of the filter Wa; (b) of the filter Wb.
Applsci 11 03953 g002
Figure 3. The frequency weighting function of the filter Wab.
Applsci 11 03953 g003
Figure 4. The frequency weighting function B.
Applsci 11 03953 g004
Figure 5. Correlation between ride comfort index NMV and ride comfort index Wz.
Applsci 11 03953 g005
Figure 6. Correlation between ride comfort index NMV and ride comfort index Wz.Power spectral density of acceleration (PSD acceleration) in reference point C in (m/s2)2/Hz: (a) unweighted; (b) weighted with weighting function Hab; (c) weighted with weighting function B.
Applsci 11 03953 g006
Figure 7. Correlation between ride comfort index NMV and ride comfort index Wz.Power spectral density of acceleration (PSD acceleration) in reference point B1 in (m/s2)2/Hz: (a) unweighted; (b) weighted with weighting function Hab; (c) weighted with weighting function B.
Applsci 11 03953 g007
Figure 8. Correlation between ride comfort index NMV and ride comfort index Wz.Power spectral density of acceleration (PSD acceleration) in reference point B2 in (m/s2)2/Hz: (a) unweighted; (b) weighted with weighting function Hab; (c) weighted with weighting function B.
Applsci 11 03953 g008
Figure 9. Effect of the frequency weighting upon the carbody dynamic response in the reference point C: (a) at the bounce resonance frequency (1.17 Hz); (b) at the bending resonance frequency (8 Hz).
Applsci 11 03953 g009
Figure 10. Effect of the frequency weighting upon the carbody dynamic response in the reference point B1: (a) at the bounce resonance frequency (1.17 Hz); (b) at the pitch resonance frequency (1.53 Hz).
Applsci 11 03953 g010
Figure 11. Effect of the frequency weighting upon the carbody dynamic response in the reference point B2: (a) at the bounce resonance frequency (1.17 Hz); (b) at the pitch resonance frequency (1.53 Hz).
Applsci 11 03953 g011
Figure 12. Ride comfort indices depending on the vehicle velocity.
Applsci 11 03953 g012
Figure 13. Ride comfort index NMVZ depending on the carbody bending frequency: (a) in point C; (b) in point B1; (c) in point B2.
Applsci 11 03953 g013
Figure 14. Ride comfort index Wz depending on the carbody bending frequency: (a) in point C; (b) in point B1; (c) in point B2.
Applsci 11 03953 g014
Figure 15. Ride comfort index NMVZ depending on the damping ratio of secondary suspension: (a) in point C; (b) in point B1; (c) in point B2.
Applsci 11 03953 g015
Figure 16. Ride comfort index Wz depending on the damping ratio of secondary suspension: (a) in point C; (b) in point B1; (c) in point B2.
Applsci 11 03953 g016
Figure 17. Ride comfort index NMVZ depending on the damping ratio of primary suspension: (a) in point C; (b) in point B1; (c) in point B2.
Applsci 11 03953 g017
Figure 18. Ride comfort index Wz depending on the damping ratio of primary suspension: (a) in point C; (b) in point B1; (c) in point B2.
Applsci 11 03953 g018
Table 1. The parameters of the model vehicle.
The Parameters of the Carbody and Bogie
SymbolDefinitionSymbolDefinition
mccarbody massLccarbody length
mbbogie suspended mass2accarbody wheelbase
Jccarbody inertia moment2abbogie wheelbase
Jbbogie inertia momentl1,2 = Lc/2 ± acsupporting points position of the carbody on the suspension
The parameters of the secondary suspension per bogie
2czcvertical damping2kzcvertical stiffness
2cxclongitudinal damping2kxclongitudinal stiffness
2cθcangular damping2kθcangular stiffness
The parameters of the primary suspension per wheelset
2czbvertical damping2kzbvertical stiffness
Table 2. The significance of the ride comfort index NMV.
Ride Comfort Index NMVSignificance
NMV < 1Very good comfort
1 ≤ NMV < 2Good comfort
2 ≤ NMV < 4Acceptable comfort
4 ≤ NMV < 5Poor comfort
NMV ≥ 5Very poor comfort
Table 3. Scale for the ride comfort index Wz.
Ride Comfort IndexWzVibration Sensitivity
1.0Just noticeable
2.0Clearly noticeable
2.5More pronounced, but not unpleasant
3.0Strong, irregular, but still tolerable
3.25Very irregular
3.5Extremely irregular, unpleasant, annoying, prolonged exposure intolerable
4.0Extremely unpleasant; prolonged exposure harmful
Table 4. Reference parameters of the vehicle model.
mc = 34,000 kg2kzc = 1.2 MN/m
mb = 3200 kg2kxc = 4MN/m
Jc= 1,963,840 kg∙m22kθc = 256 kN/m
Jb= 2048 kg∙m22czc = 34.28 kNs/m
EI = 3.158 × 10⁹ Nm22cxc = 50 kNs/m
mmc = 35224 kg2cθc = 2 kNs/m
Lc = 26.4 m4kzb = 4.4 MN/m
2ac = 19 m4czb = 52.21 kNs/m
2ab = 2.56 mkm2 = 88.998 MN/m
hc = 1.3 m; hb = 0.2 mcmc = 53.117 kNs/m
Publisher’s Note: MDPI stays neutral with regard to jurisdictional claims in published maps and institutional affiliations.

