
Permeability of Coking Coals and Patterns of Its Change in Leninsky Area, Kuznetsk Coal Basin, Russia

Abstract
:1. Introduction
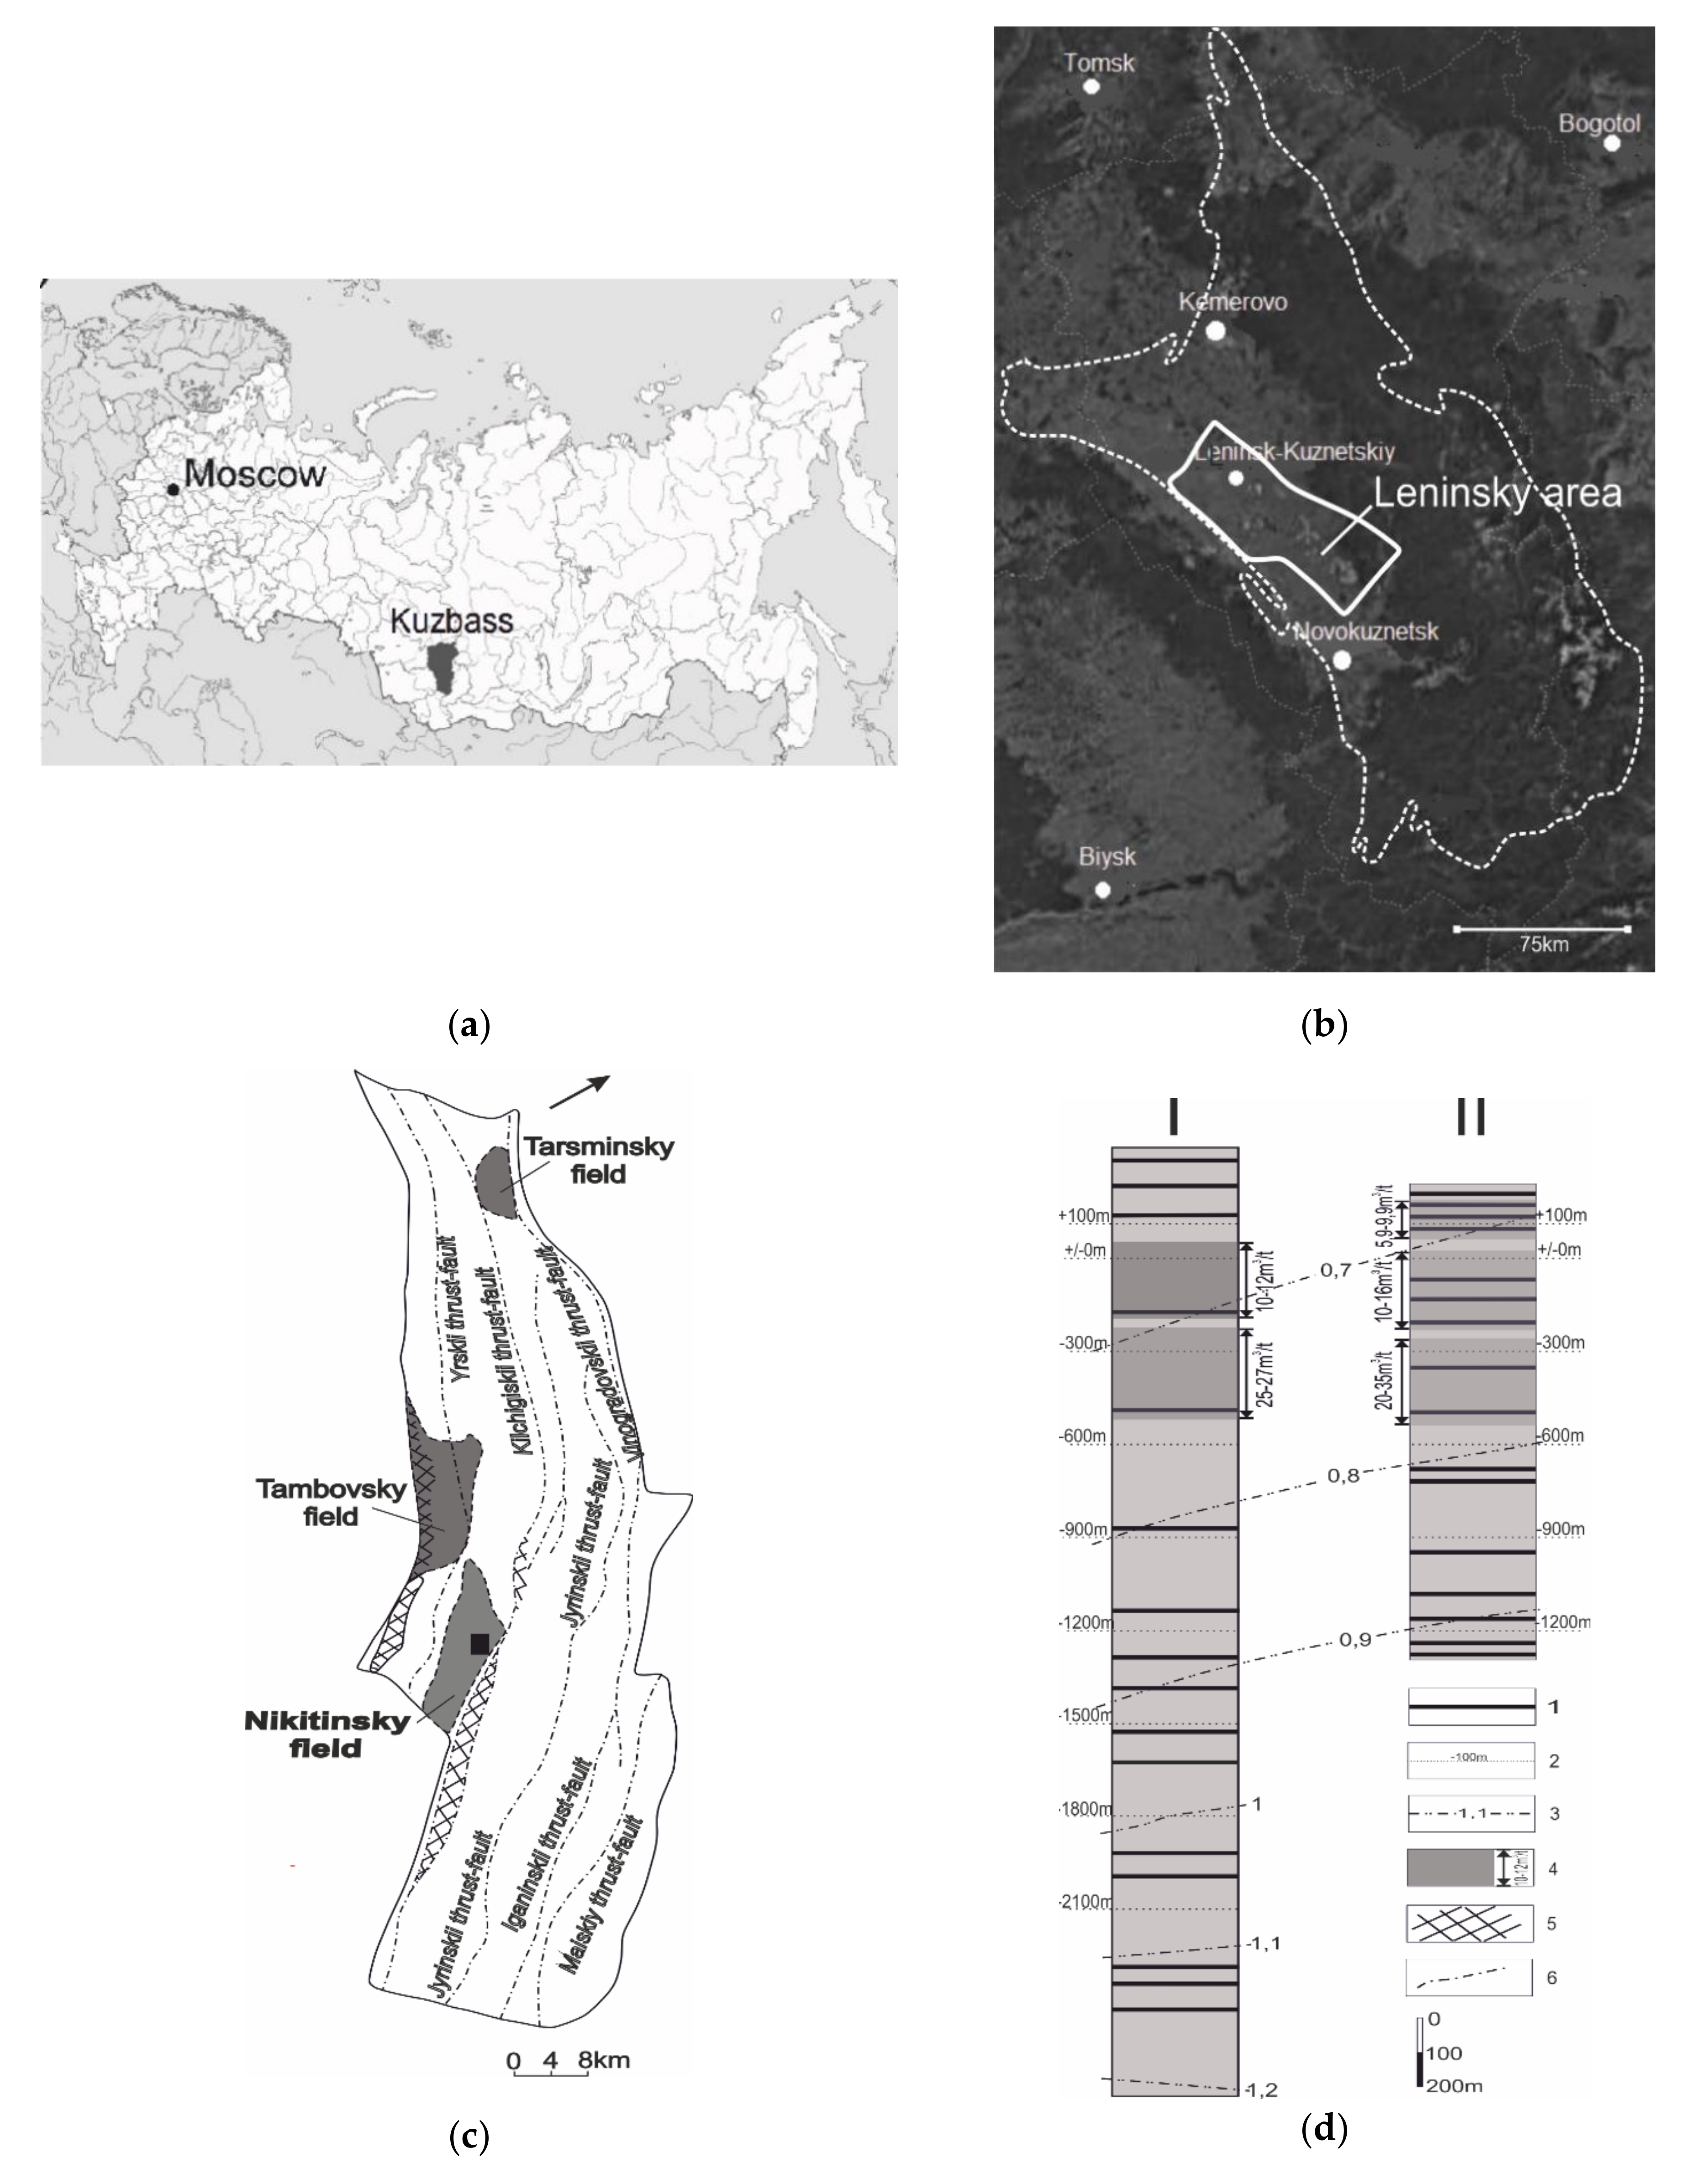
2. Study Site
3. Materials and Methods
3.1. Experiments to Determine Coal Permeability and Cleat Compressibility
3.2. Microstructural Analysis of Coal Cleats
3.3. Data Analysis
4. Results
4.1. Coal Permeability and Cleat Compressibility
4.2. Coal Cleats
4.3. Coal Permeability Anisotropy
4.4. Coal Permeability Dependence on Depth
5. Discussion
6. Conclusions
Author Contributions
Funding
Institutional Review Board Statement
Informed Consent Statement
Conflicts of Interest
References
- Lin, B.; Song, H.; Zhao, Y.; Liu, T.; Kong, J.; Huang, Z. Significance of gas flow in anisotropic coal seams to underground gas drainage. J. Pet. Sci. Eng. 2019, 180, 808–819. [Google Scholar] [CrossRef]
- Guo, P.; Cheng, Y.; Jin, K.; Li, W.; Tu, Q.; Liu, H. Impact of Effective Stress and Matrix Deformation on the Coal Fracture Permeability. Transp. Porous Media 2014, 103, 99–115. [Google Scholar] [CrossRef]
- Karacan, C.Ö.; Ruiz, F.A.; Cotè, M.; Phipps, S. Coal mine methane: A review of capture and utilization practices with benefits to mining safety and to greenhouse gas reduction. Int. J. Coal Geol. 2011, 86, 121–156. [Google Scholar] [CrossRef]
- Guo, X.; Yan, Q.; Wang, A. Evaluation of Relative Permeability in Coalbed Methane Reservoirs Based on Production Data: A Case Study in Qinshui Basin, China. Nat. Resour. Res. 2018, 28, 187–198. [Google Scholar] [CrossRef]
- Liu, Q.; Chu, P.; Hao, C.; Cheng, Y.; Wang, H.; Wang, L. Non-uniform Distributions of Gas Pressure and Coal Permeability in Coalbed Methane Reservoirs Induced by the Loess Plateau Geomorphology: A Case Study in Ordos Basin, China. Nat. Resour. Res. 2019, 29, 1639–1655. [Google Scholar] [CrossRef]
- Pan, Z.; Connell, L.D. Modelling permeability for coal reservoirs: A review of analytical models and testing data. Int. J. Coal Geol. 2012, 92, 1–44. [Google Scholar] [CrossRef]
- Cui, X.; Bustin, R.M. Volumetric strain associated with methane desorption and its impact on coalbed gas production from deep coal seams. AAPG Bull. 2005, 89, 1181–1202. [Google Scholar] [CrossRef]
- Thakur, P. Advanced Reservoir and Production Engineering for Coal Bed Methane; Elsevier BV: Amsterdam, The Netherlands, 2017. [Google Scholar]
- Seidle, J. Fundamentals of Coalbed Methane Reservoir Engineering; PennWell Books: Tulsa, OK, USA, 2011. [Google Scholar]
- Serdyukov, S.V.; Kurlenya, M.V.; Rybalkin, L.A.; Shilova, T.V. Hydraulic Fracturing Effect on Filtration Resistance in Gas Drainage Hole Area in Coal. J. Min. Sci. 2019, 55, 175–184. [Google Scholar] [CrossRef]
- Tan, Y.; Pan, Z.; Liu, J.; Zhou, F.; Connell, L.D.; Sun, W.; Haque, A. Experimental study of impact of anisotropy and heterogeneity on gas flow in coal. Part II: Permeability. Fuel 2018, 230, 397–409. [Google Scholar] [CrossRef]
- Gash, B.W.; Volz, R.F.; Potter, G.; Corgan, J.M. The effect of cleat orientation and confining pressure on cleat porosity, permeability and relative permeability in coal. In Proceedings of the International Coalbed Methane Conference, SPWLA/SCA Symposium, Oklahoma City, OK, USA, 14–17 June 1992; pp. 15–16. [Google Scholar]
- Zhang, Y.; Xu, X.; Lebedev, M.; Sarmadivaleh, M.; Barifcani, A.; Iglauer, S. Multi-scale x-ray computed tomography analysis of coal microstructure and permeability changes as a function of effective stress. Int. J. Coal Geol. 2016, 165, 149–156. [Google Scholar] [CrossRef] [Green Version]
- Kurlenya, M.V.; Serdyukov, S.V.; Patutin, A.V.; Shilova, T.V. Stimulation of Underground Degassing in Coal Seams by Hydraulic Fracturing Method. J. Min. Sci. 2017, 53, 975–980. [Google Scholar] [CrossRef]
- Pan, Z.; Connell, L.D. Modelling of anisotropic coal swelling and its impact on permeability behaviour for primary and enhanced coalbed methane recovery. Int. J. Coal Geol. 2011, 85, 257–267. [Google Scholar] [CrossRef]
- Wang, D.; Lv, R.; Wei, J.; Zhang, P.; Yu, C.; Yao, B. An experimental study of the anisotropic permeability rule of coal containing gas. J. Nat. Gas. Sci. Eng. 2018, 53, 67–73. [Google Scholar] [CrossRef]
- Wang, J.; Liu, J.; Kabir, A. Combined effects of directional compaction, non-Darcy flow and anisotropic swelling on coal seam gas extraction. Int. J. Coal Geol. 2013, 109–110, 1–14. [Google Scholar] [CrossRef]
- Somerton, W.; Söylemezoḡlu, I.; Dudley, R. Effect of stress on permeability of coal. Int. J. Rock Mech. Min. Sci. Géomeéch. Abstr. 1975, 12, 129–145. [Google Scholar] [CrossRef]
- Palmer, I. Permeability changes in coal: Analytical modeling. Int. J. Coal Geol. 2009, 77, 119–126. [Google Scholar] [CrossRef]
- Shi, J.-Q.; Durucan, S. A Model for Changes in Coalbed Permeability during Primary and Enhanced Methane Recovery. SPE Reserv. Eval. Eng. 2005, 8, 291–299. [Google Scholar] [CrossRef]
- Palmer, I.; Mansoori, J. How Permeability Depends on Stress and Pore Pressure in Coalbeds: A New Model. SPE Reserv. Eval. Eng. 1998, 1, 539–544. [Google Scholar] [CrossRef]
- Avdeev, A.P.; Cherepovskiy, V.F.; Sharov, G.N.; Uzvickiy, A.Z. Coal Base of Russia. Volume II. Coal Basins and Deposits of Western Siberia (Kuznetsk, Gorlovsky, West.-Siberian Basins; Deposits of Altai Region. and Altai Republic); Geoinform Center: Moscow, Russia, 2003. (In Russian) [Google Scholar]
- Serdyukov, S.V.; Shilova, T.V.; Drobchik, A.N. Laboratory Installation and Procedure to Determine Gas Permeability of Rocks. J. Min. Sci. 2017, 53, 954–961. [Google Scholar] [CrossRef]
- Sander, R.; Pan, Z.; Connell, L.D.; Camilleri, M.; Heryanto, D. Experimental Investigation of Gas Diffusion in Coal–Comparison Between Crushed and Intact Core Samples. In Proceedings of the SPE Asia Pacific Oil & Gas Conference and Exhibition, Society of Petroleum Engineers, Perth, Australia, 25–27 October 2016. [Google Scholar] [CrossRef]
- Laubach, S.E.; Marrett, R.A.; Olson, J.E.; Scott, A.R. Characteristics and origins of coal cleat: A review. Int. J. Coal Geol. 1998, 35, 175–207. [Google Scholar] [CrossRef]
- Pan, Z.; Connell, L.D.; Camilleri, M. Laboratory characterisation of coal reservoir permeability for primary and enhanced coalbed methane recovery. Int. J. Coal Geol. 2010, 82, 252–261. [Google Scholar] [CrossRef]
- McKee, C.R.; Bumb, A.C.; Koenig, R.A. Stress-Dependent Permeability and Porosity of Coal and Other Geologic Formations. SPE Form. Eval. 1988, 3, 81–91. [Google Scholar] [CrossRef]
- Karimpouli, S.; Tahmasebi, P.; Ramandi, H.L. A review of experimental and numerical modeling of digital coalbed methane: Imaging, segmentation, fracture modeling and permeability prediction. Int. J. Coal Geol. 2020, 228, 103552. [Google Scholar] [CrossRef]
- Ramandi, H.L.; Mostaghimi, P.; Armstrong, R.T.; Saadatfar, M.; Pinczewski, W.V. Porosity and permeability characterization of coal: A micro-computed tomography study. Int. J. Coal Geol. 2016, 154–155, 57–68. [Google Scholar] [CrossRef]
- Bandyopadhyay, K.; Mallik, J.; Ghosh, T. Dependence of fluid flow on cleat aperture distribution and aperture–length scaling: A case study from Gondwana coal seams of Raniganj Formation, Eastern India. Int. J. Coal Sci. Technol. 2019, 7, 133–146. [Google Scholar] [CrossRef] [Green Version]
- Tanaino, A.S.; Sivolap, B.B.; Maksimovsky, E.A.; Persidskaya, O.A. Method and means to estimate porosity distribution on the surface of polished section of coal. J. Min. Sci. 2016, 52, 1216–1223. [Google Scholar] [CrossRef]
- Analyzers of Fragments of the Microstructure of Solids. Available online: https://all-pribors.ru/opisanie/27438-10-26089 (accessed on 30 April 2020). In Russian.
- Seidle, J.P.; Jeansonne, M.W.; Erickson, D.J. Application of Matchstick Geometry to Stress Dependent Permeability in Coals. In Proceedings of the SPE Rocky Mountain Regional Meeting, Casper, WY, USA, 18–21 May 1992; pp. 433–444. [Google Scholar] [CrossRef]
- Robertson, E.P.; Christiansen, R.L. A Permeability Model for Coal and Other Fractured, Sorptive-Elastic Media. In Proceedings of the SPE Eastern Regional Meeting, Canton, OH, USA, 11–13 October 2006; pp. 1–12. [Google Scholar] [CrossRef]
- Parsons, R. Permeability of Idealized Fractured Rock. Soc. Pet. Eng. J. 1966, 6, 126–136. [Google Scholar] [CrossRef]


| Parameter | Range | Interval of Measurements |
|---|---|---|
| Flow time, s | 0.001–432,000 | 0.001 |
| Inlet gas pressure, MPa | 0–5 | 0.02 |
| Pressure difference ΔP, MPa | 0–0.3 | 0.001 |
| Gas | N2, CH4, CO2 | — |
| Temperature, °C | From −10 to + 150 | 0.01 |
| Lateral compression, MPa | 0–50 | 0.05 |
| Axial compression, MPa | 0–50 | 0.05 |
| Permeation volume per measurement, cm3 | 0.02–0.05 | — |
| Weight of the cell, kg | 0.7 | — |
| Experimental Conditions | Coking Coals (S.D. Tihov Mine) |
|---|---|
| Axial compression, P, MPa | 1, 3, 5, 7, 8 |
| Confining lateral compression, P, MPa | 1, 3, 5, 7, 8 |
| Pressure at inlet 1 of the test cell, P1, MPa | 0.11, 0.12, 0.14, 0.16, 0.18, 0.2 |
| Pressure at outlet 3 of the test cell, P3, MPa | 0.1 |
| Pressure difference, ΔP, MPa | 0.01, 0.02, 0.04, 0.06, 0.08, 0.1 |
| Temperature, T, °C | 26–27 °C |
| Range of Measurement of Linear Dimensions, μm | From 0.5 to 2000 |
|---|---|
| The relative value of the standard deviation of the random component of the error (considering the contribution of the analyzer software), %: | |
| -with an increase up to ×500 inclusive | 0.2 |
| -with an increase over ×500 | 0.4 |
| Relative error of measurement (considering the contribution of the analyzer software), %: | |
| -with an increase up to ×500 inclusive | +/−0.25 |
| -with an increase over ×500 | +/−0.65 |
| Coal Seam Name | Depth, m | The Predicted Permeability of the Coking Coals Perpendicular to the Butt Cleat Direction, mD | The Predicted Permeability of the Coking Coals Perpendicular to the Face Cleat Direction, mD |
|---|---|---|---|
| Nikitinsky field | |||
| 18 | 815 | 13.9 | 9.4 |
| 19 | 850 | 12.9 | 8.7 |
| 22 | 1050 | 8.6 | 5.8 |
| 26 | 1175 | 6.6 | 4.5 |
| 30 | 1245 | 5.7 | 3.9 |
| 32 | 1315 | 5 | 3.4 |
| 33 | 1350 | 4.6 | 3.1 |
| Tambovsky field | |||
| 18 | 1090 | 7.9 | 5.3 |
| 22 | 1330 | 4.8 | 3.2 |
| n/a | 1460 | 3.7 | 2.5 |
| 30 | 1550 | 3.1 | 2.1 |
| 32 | 1675 | 2.4 | 1.6 |
| 33 | 1760 | 2 | 1.3 |
| 45 | 1915 | 1.4 | 1 |
| Coal Seam Name | Depth, m | The Predicted Permeability of the Coking Coals Perpendicular to the Butt Cleat Direction, mD | The Predicted Permeability of the Coking Coals Perpendicular to the Face Cleat Direction, mD |
|---|---|---|---|
| Nikitinsky field | |||
| 18 | 815 | 23.4 | 15.8 |
| 19 | 850 | 22.3 | 15.1 |
| 22 | 1050 | 16.8 | 11.3 |
| 26 | 1175 | 14.1 | 9.5 |
| 30 | 1245 | 12.7 | 8.6 |
| 32 | 1315 | 11.5 | 7.8 |
| 33 | 1350 | 11 | 7.4 |
| Tambovsky field | |||
| 18 | 1090 | 15.9 | 10.7 |
| 22 | 1330 | 11.3 | 7.6 |
| n/a | 1460 | 9.4 | 6.3 |
| 30 | 1550 | 8.3 | 5.6 |
| 32 | 1675 | 6.9 | 4.7 |
| 33 | 1760 | 6.1 | 4.1 |
| 45 | 1915 | 4.9 | 3.3 |
Publisher’s Note: MDPI stays neutral with regard to jurisdictional claims in published maps and institutional affiliations. |
© 2021 by the authors. Licensee MDPI, Basel, Switzerland. This article is an open access article distributed under the terms and conditions of the Creative Commons Attribution (CC BY) license (https://creativecommons.org/licenses/by/4.0/).
Share and Cite
Shilova, T.; Serdyukov, S. Permeability of Coking Coals and Patterns of Its Change in Leninsky Area, Kuznetsk Coal Basin, Russia. Appl. Sci. 2021, 11, 3969. https://doi.org/10.3390/app11093969
Shilova T, Serdyukov S. Permeability of Coking Coals and Patterns of Its Change in Leninsky Area, Kuznetsk Coal Basin, Russia. Applied Sciences. 2021; 11(9):3969. https://doi.org/10.3390/app11093969
Chicago/Turabian StyleShilova, Tatiana, and Sergey Serdyukov. 2021. "Permeability of Coking Coals and Patterns of Its Change in Leninsky Area, Kuznetsk Coal Basin, Russia" Applied Sciences 11, no. 9: 3969. https://doi.org/10.3390/app11093969