Article

Fine Activated Carbon from Rubber Fruit Shell Prepared by Using ZnCl2 and KOH Activation

Department of Mechanical Engineering, Southern Taiwan University of Science and Technology, Tainan City 71005, Taiwan
*
Author to whom correspondence should be addressed.
Appl. Sci. 2021, 11(9), 3994; https://doi.org/10.3390/app11093994
Submission received: 23 March 2021 / Revised: 23 April 2021 / Accepted: 24 April 2021 / Published: 28 April 2021
(This article belongs to the Special Issue Composts and Organic Wastes: Analytical Methods and Applications)

Abstract

:
Fine activated carbon (FAC) is prepared from rubber fruit shells (RFS) using two chemical activating agents (ZnCl2 and KOH) and three impregnation ratios (1:3, 1:4, and 1:5). The Brunauer–Emmett–Teller (BET) results show that for a constant impregnation ratio, the ZnCl2 activating agent yields a higher specific surface area than the KOH agent. In particular, for the maximum impregnation ratio of 1:5, the FAC prepared using ZnCl2 has a BET surface area of 456 m2/g, a nitrogen absorption capacity of 150.38 cm3/g, and an average pore size of 3.44 nm. Moreover, the FAC structure consists of 70.1% mesopores and has a carbon content of 80.05 at.%. Overall, the results confirm that RFS, activated using an appropriate quantity of ZnCl2, provides a cheap, abundant, and highly promising precursor material for the preparation of activated carbon with high carbon content and good adsorption properties

1. Introduction

Nowadays, activated carbon is used in many industrial applications, including gas storage/adsorption [1,2], wastewater treatment [3,4,5], catalyst support [6], air purification [7], and supercapacitors [8,9]. In recent years, biomass has attracted significant attention for the preparation of activated carbon [10], due to its renewable nature, low price, minimal environmental impact, and abundant supply [11]. Many different biomass materials have been proposed, including coconut shell [12], cashew shells [13], rice husks [14,15], durian skin [16], sugarcane trash and corn crops [17,18,19], potato starch [20], and banana skin [21] However, these materials typically have low carbon content, high volume-to-weight ratio, and high ash content [22]. Accordingly, studies on developing alternative, low-cost carbon sources continue to attract significant attention from researchers.
According to the Republic of Indonesia Ministry of Agriculture [23], Indonesia has an estimated 3.671.387 ha of rubber plantations. On average, a rubber plantation produces around 1000 kg/ha/yr of rubber seed or fruit [24]; equivalent to roughly 3.6 million tons of rubber fruit shells (RFSs) per year. While rubber seeds can be used to produce rubber seed oil [25], the majority of the shells are left as plantation waste, and hence pose a major environmental concern. Accordingly, in this study, we explore the feasibility of using RFS as a precursor material for the preparation of fine activated carbon (FAC).
The preparation of activated carbon generally involves two steps, namely pyrolysis (or precursor carbonization) and activation [25]. The activation step may be performed using either physical or chemical methods [25]. Chemical methods use many different activators, including alkali (e.g., KOH and NaOH), acidic (e.g., H3PO4 and H2SO4), and chemical compound salt (e.g., AlCl3 and ZnCl2) [26]. Among these agents, KOH and ZnCl2 are two of the most commonly used agents, since their chemical activation can produce the highest surface area and yield values [26,27]. Generally speaking, the activation performance of chemical agents is strongly dependent on the temperature at which the activation process is performed. For example, the optimal temperatures for KOH and ZnCl2 are around 800 °C [28,29,30,31] and 500 °C [32,33,34], respectively. However, while KOH and ZnCl2 are commonly used in the preparation of activated carbon nowadays, the literature contains little information on their use in preparing FAC with RFS as a precursor.
Accordingly, in the present study, we prepare activated carbon using RFS as raw material and KOH and ZnCl2 as activating agents. In performing the activation process, the temperature is set at 800 °C for the KOH agent and 500 °C for ZnCl2. For both activating agents, the activation process is performed using three different impregnation ratios, namely 1:3, 1:4, and 1:5. Following the activation experiments, the properties of the various RFSFACs (i.e., the element composition, specific surface area, pore size distribution, and structure) are systematically explored to determine the optimal activation agent and processing conditions for large-scale preparation of FAC utilizing RFS as a low-cost, green carbon source.

2. Materials and Methods

2.1. Material Preparation

The RFSs were obtained from Bangka Island (Indonesia). First, 150 g of RFS was immersed in 10% H2SO4 solution for 4 h, washed in distilled water to remove soil impurities, and then dried in an oven at 60 °C for 24 h. The dried precursor was placed in a heating box and carbonized at 450 °C for 1 h in nitrogen (flow rate 20 mL/min). Finally, the carbonized RFSs were crushed and sieved using a 200 mesh/74 µm sieve size.
Three grams of RFS powder were mixed with an activating agent (ZnCl2 or KOH solution) with impregnation ratios of 1:3, 1:4, and 1:5, respectively (see Table 1). The ZnCl2 solution had a composition of 10% ZnCl2 (w/v) aqueous solution [35], while the KOH solution had a composition of 50% (w/v) aqueous solution [36]. Both slurries were mixed at 1000 rpm for 1.5 h to obtain a homogeneous slurry, and then were dried in an oven at 110 °C overnight. In the ZnCl2 activation process, the dried slurry was simply heated at 500 °C for 1 h [32,33,34,37]. By contrast, in the KOH activation process, first, the slurry was heated at 450 °C for 0.5 h, and then at 800 °C for a further 2 h [28,29,30,31,38]. For both activation processes, the obtained RFSFAC was washed with 1M HCl and distilled water repeatedly in order to remove any activation agent residuals, and then was dried in an oven at 110 °C for 24 h.

2.2. Characterization

The proximate analysis was comprised of the mass percentages of moisture, volatile matter, fixed carbon, and ash of the various RFSFACs that were performed using thermogravimetric analysis (TGA) [39]. For each RFSFAC, 10 mg of sample was heated from room temperature to 120 °C at a rate of 50 °C/min and held at 120 °C for 3 min. Then, the sample was heated to 950 °C at a rate of 100 °C/min before being cooled to 450 °C at a rate of −100 °C/min. To prevent oxidation, the heating and cooling processes were performed under nitrogen gas. However, when the temperature reached 450 °C, the protective gas was changed to air and the sample was reheated to 800 °C at a rate of 100 °C/min. Then, it was held at this temperature for 3 min to achieve isothermal conditions, thereby, marking the end of the process. The thermal decomposition behavior of the RFSFACs was likewise investigated by TGA. Briefly, 10 mg of the sample was heated from room temperature to 950 °C at a rate of 10 °C/min under a nitrogen gas flow rate of 20 mL/min. Then, the resulting weight loss curves were replotted using Origin®8 software (OriginLab Corporation, Northampton, England).
The pore volumes and specific surface areas of the RFSFAC products were determined using an accelerated surface area and porosimetry system (ASAP 2020) using 0.2~0.3 g of sample, an automatic degas process, nitrogen working gas, a −196 °C analysis bath temperature, a 10 s equilibration interval, and a 22 °C ambient temperature. The specific surface areas of the products were obtained using the Brunauer–Emmett–Teller (BET) method. Finally, the pore volume was calculated using the Barrett–Joyner–Halenda (BJH) algorithm.
The surface structures and element compositions of the various RFSFAC products were additionally examined using X-ray diffraction and a field emission scanning electron microscope (JEOL JSM-6701F, JEOL Ltd., Tokyo, Japan) integrated with an energy dispersive X-ray spectrometry system (INCA, Vs. 4.14, Oxford Instruments KK, Tokyo, Japan).

3. Results

3.1. Characterization of RFSFACs

Table 2 presents the proximate analysis results for the various RFSFAC products. As shown, the moisture content of the KOH-activated products increases from 16.76 to 23.51 wt.% as the impregnation ratio increases from 1:3 to 1:5. Similarly, the moisture content of the ZnCl2-activated products increases from 13.31 to 14.98 wt.%. Meanwhile, the fixed carbon content increases from 16.26 to 23.84 wt.% for the KOH products and 23.26 to 38.09 wt.% for the ZnCl2 products. The greater moisture content of the RFSFAC products under a greater impregnation ratio implies that a stronger activator concentration is beneficial for increasing the surface area of the activated carbon, and hence for increasing the hygroscopic properties of the product [40]. Meanwhile, the higher fixed carbon content of the activated RFSFACs with a greater impregnation ratio reflects a corresponding reduction in the volatile and ash content of the products. In particular, the volatile content of the KOH-activated products reduces from 56.38 to 42.24 wt.% as the impregnation ratio increases from 1:3 to 1:5, while that of the ZnCl2-activated products reduces from 48.24 to 33.44 wt.%. The reduction in the volatile content arises since the activators degrade the surface structure of the activated carbon, and thus facilitate the easier removal of the volatile substances [41]. There is also a slight reduction in the ash level with an increasing activator concentration, i.e., from 10.59 to 10.41 wt.% for the KOH-activated products and 15.19 to 13.50 wt.% for the ZnCl2 products. It is speculated that the reduction in the ash content is the result of a reaction between the activator and the minerals contained in the RFS raw material. It is noted that this inference is consistent with the findings of a previous study [41] which showed that the ash content produced during pyrolysis depends on both the amount and the composition of the mineral salts in the raw material.
Referring to the EDS analysis results presented in Table 2, it can be observed that the KOH-derived RFSFAC has a carbon content from 72.29 to 78.40 at.%. By contrast, the ZnCl2-derived FAC has a higher carbon content from 65.94 to 81.83 at.%. In other words, while both RFSFACs have a high carbon content, ZnCl2 yields an improved activation effect. The EDS analysis results additionally show that the RFSFACs activated using KOH contain relatively large amounts of potassium, while those activated using ZnCl2 have relatively large contents of chlorine and zinc.
Figure 1 shows the thermal decomposition behaviors of the carbonized RFSFC charcoal and RFSFAC products, respectively. For the RFSFC product, the mass remains approximately constant until 400 °C, and then rapidly decreases, almost to zero at a temperature of 650 °C. The rapid weight loss at temperatures from 400 to 650 °C is associated mainly with the formation of ash as a result of devolatilization. Comparing the weight loss behaviors of the activated RFSFAC products, it can be obsserved that the products activated using KOH (i.e., RFSFAC1~3) decompose more rapidly than those activated using ZnCl2 (RFSFAC4~6). For the RFSFC activated with KOH, the mass loss can be explained as follows: A significant mass loss occurs at around 150 °C as a result of dehydration and moisture evaporation [42]. Then, the mass loss is around 70% of the total weight percentage at a temperature of around 450 °C. The weight loss is primarily attributed to the decomposition of activating agencies. J. Zhang et al. [42] explained that when the temperature is around 200 °C, KHCO3 is rapidly decomposed to H2O and CO2, leading to increased weight loss. At higher temperatures (e.g., from 700 to 900 °C), the mass continues to reduce due to the release of carbon oxide and potassium sublimation [43]. The following equation may describe the reaction on a carbon surface (Cf) using KOH activation [44,45]:
2KOH → K2O + H2O (dehydration)
Cf + H2O → H2 + CO (water-gas reaction)
CO + H2O → H2 + CO2 (water-gas shift reaction)
K2O + CO2 → K2CO3 (carbonate formation)
During the activation process, K2CO3 was formed, and the carbon was simultaneously reduced to K, K2O, and CO2, and a porous carbon surface was also developed. The metal of K was created at a temperature above 700 °C during activation of the K2O. The potential reaction could be as follows [45,46]:
K2O + H2 → 2K + H2O (reduction by hydrogen)
K2O + Cf → 2K + CO (reduction by carbon)
K2CO3 + 2C → 2K + 3CO (reduction by carbon)
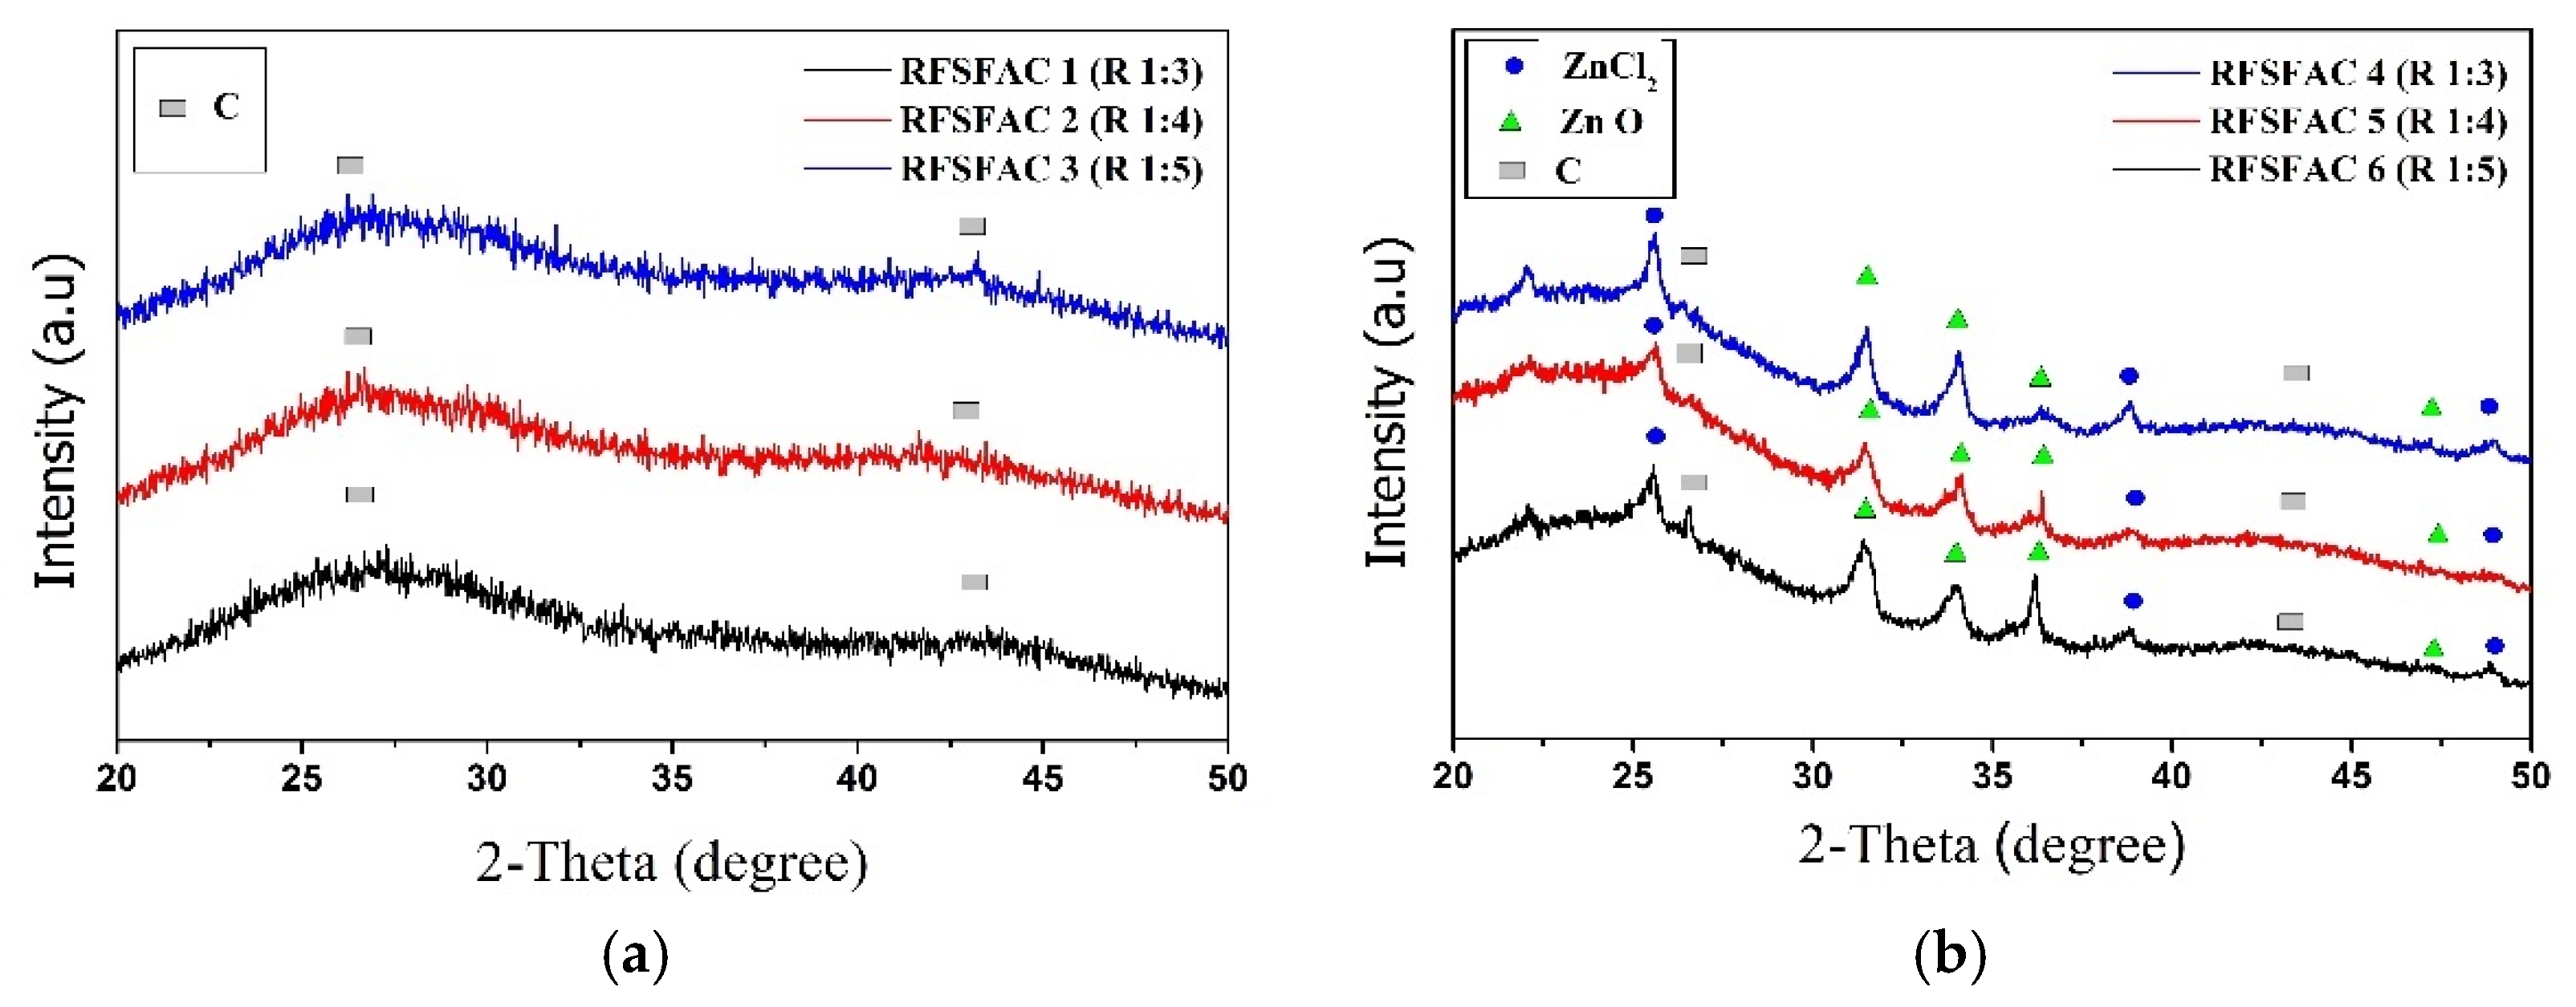
Because the boiling point of K is 780 °C [44] and the activation process was carried out at 800 °C, there is a significant loss of potassium metal in the activated carbon. The XRD patterns, presented in Figure 2a, show that the activated RFSFAC products prepared using KOH have an amorphous carbon structure. The presence of broad peaks at around 26.69° and 43.24° indicates that the carbon layer planes are aligned [47].
Referring to the TGA results in Figure 1, it can be observed that the ZnCl2-activated samples (RFSFAC4-6) experience a weight loss of around 80% by the end of the heating process. The significant reduction in mass that occurs over the temperature range from 150 to 450 °C can be attributed to the release of moisture from the solid-phase ZnCl2. The more gradual reduction in mass from 450 to 650 °C is, then, the result most likely of volatile evolution, while that at temperatures higher than 700 °C reflects the total evaporation of the liquid phase from the ZnCl2. Previous studies have reported that ZnO/carbon compounds are formed at 550 °C and reduce to metallic zinc at temperatures higher than 800 °C [21]. These findings are supported by the XRD patterns shown in Figure 2b for the present RFSFACs activated using ZnCl2. In particular, the sharp diffraction peaks at 31.74°, 34.38°, 36.22°, and 47.48° correspond to ZnO (PDF card 76–704), while those at 25.46°, 29.35°, and 38.29°, respectively, correspond to ZnCl2 (PDF card 74–517). Finally, the peaks at 26°, 62°, and 43.93° correspond to C (PDF card 26–1077) and indicate the existence of graphite in the activated RFSFAC products [48].
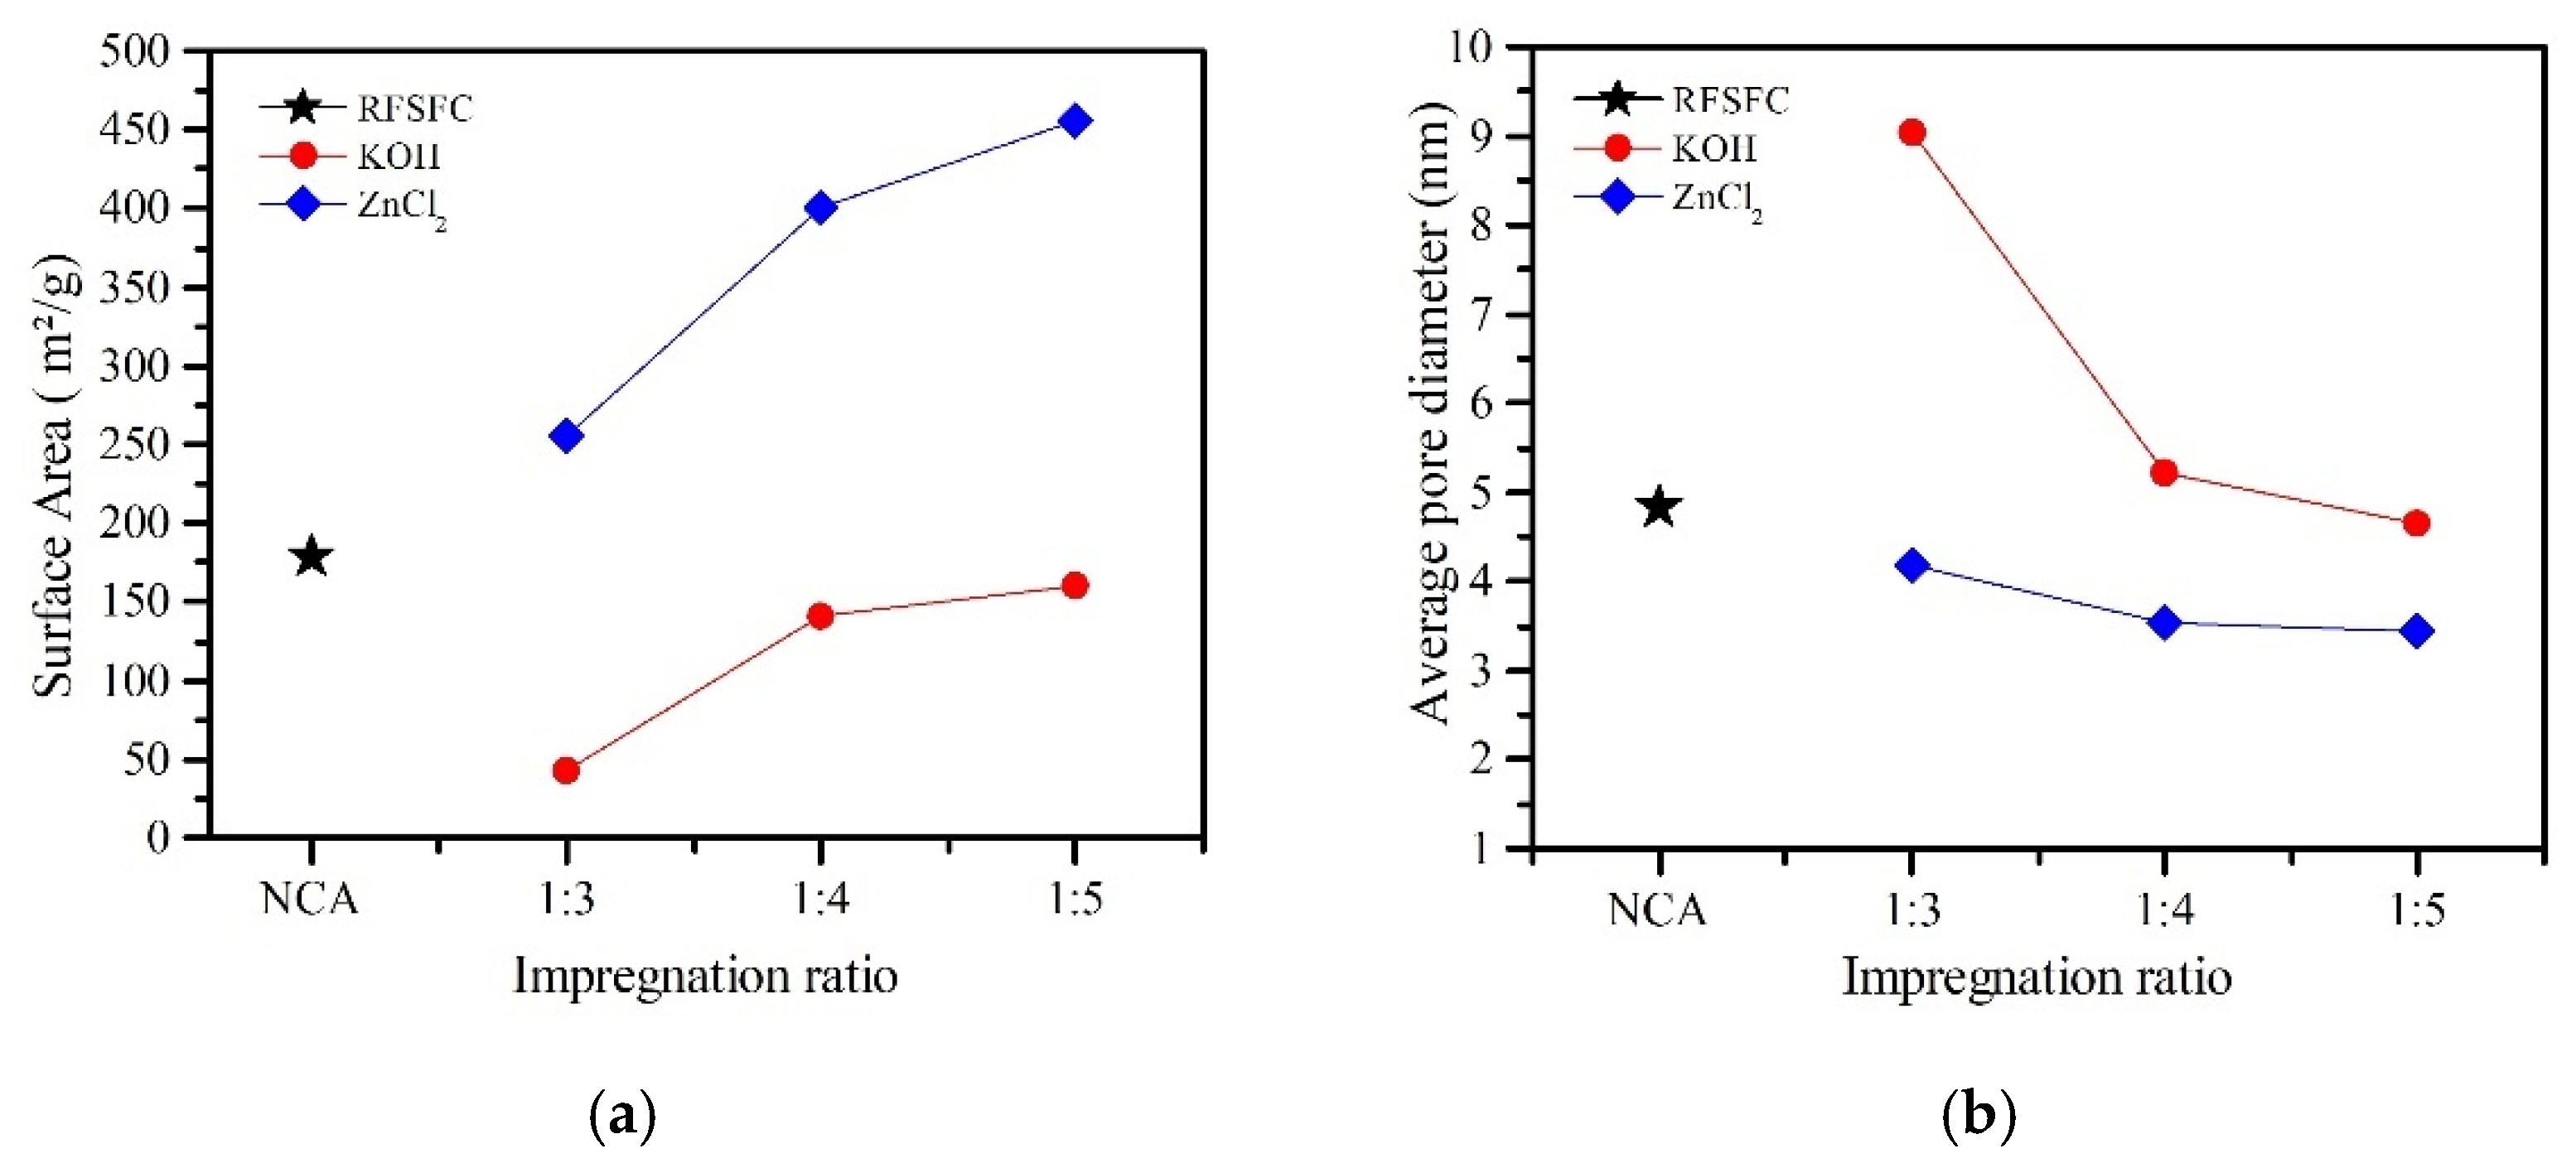
As shown in Figure 3a, the BET surface areas of RFSFACs 1~3 (prepared with KOH) are approximately 42, 141, and 160 m2/g, respectively. Similarly, the BET surface areas of RFSFACs 4~6 (prepared with ZnCl2) are 256, 400, and 456 m2/g, respectively (see also Table 3). For both sets of RFSFACs, the surface area increases with an increasing activator concentration due to the enhanced effect of the activation substance seeping into the RFS charcoal and opening the surface [49]. It can be observed that for a given impregnation ratio, the ZnCl2 activation agent results in a higher specific surface area than that obtained using KOH. In other words, of the two activating agents, ZnCl2 provides a more effective activation performance. This may be because the RFS is lignocellulosic materials [50] with a greater content of oxygen and the ZnCl2 is an acidic reagent capable of interacting with functional oxygen groups in RFS charcoal, thus catalyzing dehydration reactions, resulting in charring and creation of the pore structure [43].
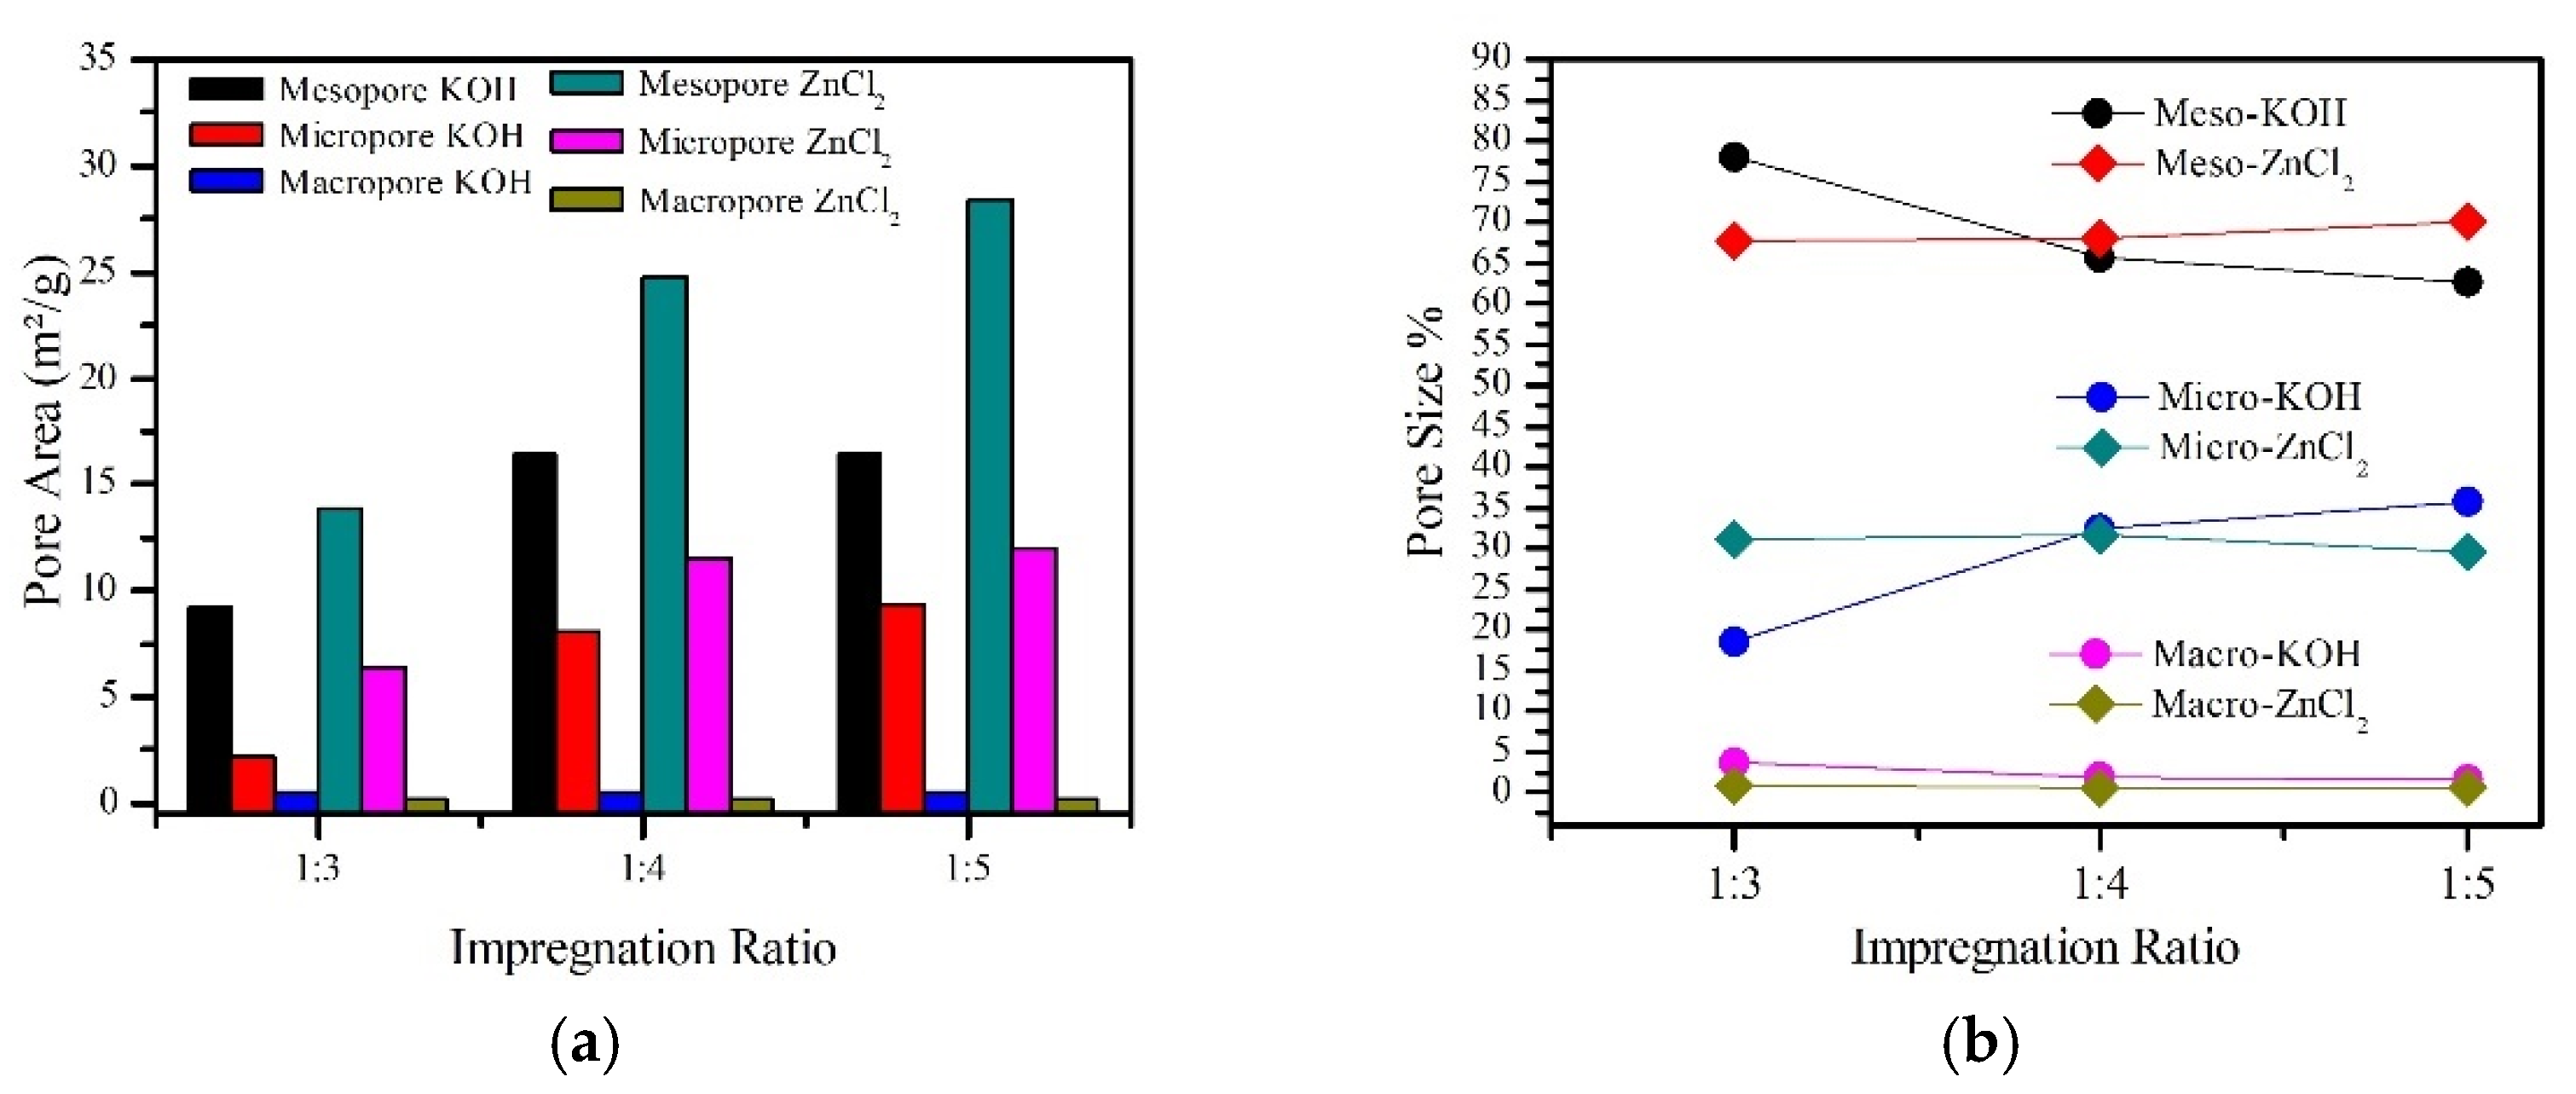
Referring to Figure 4a, the total pore area of the KOH-activated RFSFAC products increases from 11.88 to 26.17 m2/g as the impregnation ratio increases from 1:3 to 1:5 (see also Table 3). Similarly, for the ZnCl2-activated products, the total pore area increases from 20.47 m2/g to 40.61 m2/g. Furthermore, the proportion of mesopores (diameter between 2 and 50 nm) in the KOH products gradually decreases with an increasing impregnation ratio, while the proportion of micropores (diameter < 2 nm) gradually increases. By contrast, for the ZnCl2 products, the proportion of mesopores increases, while the proportion of micropores decreases, as the impregnation ratio increases. It should be noted that these findings for the ZnCl2 products are consistent with those reported in [30] for the production of activated carbon from cocoa pod husks. In general, all of the present RFSFACs have around 60–80% micropores, 18–36% mesopores, and fewer than 4% macropores. However, of all the RFSFACs, RFSFAC6 has the highest pore area (40.61 m2/g) and percentage of mesopores (70.1%).
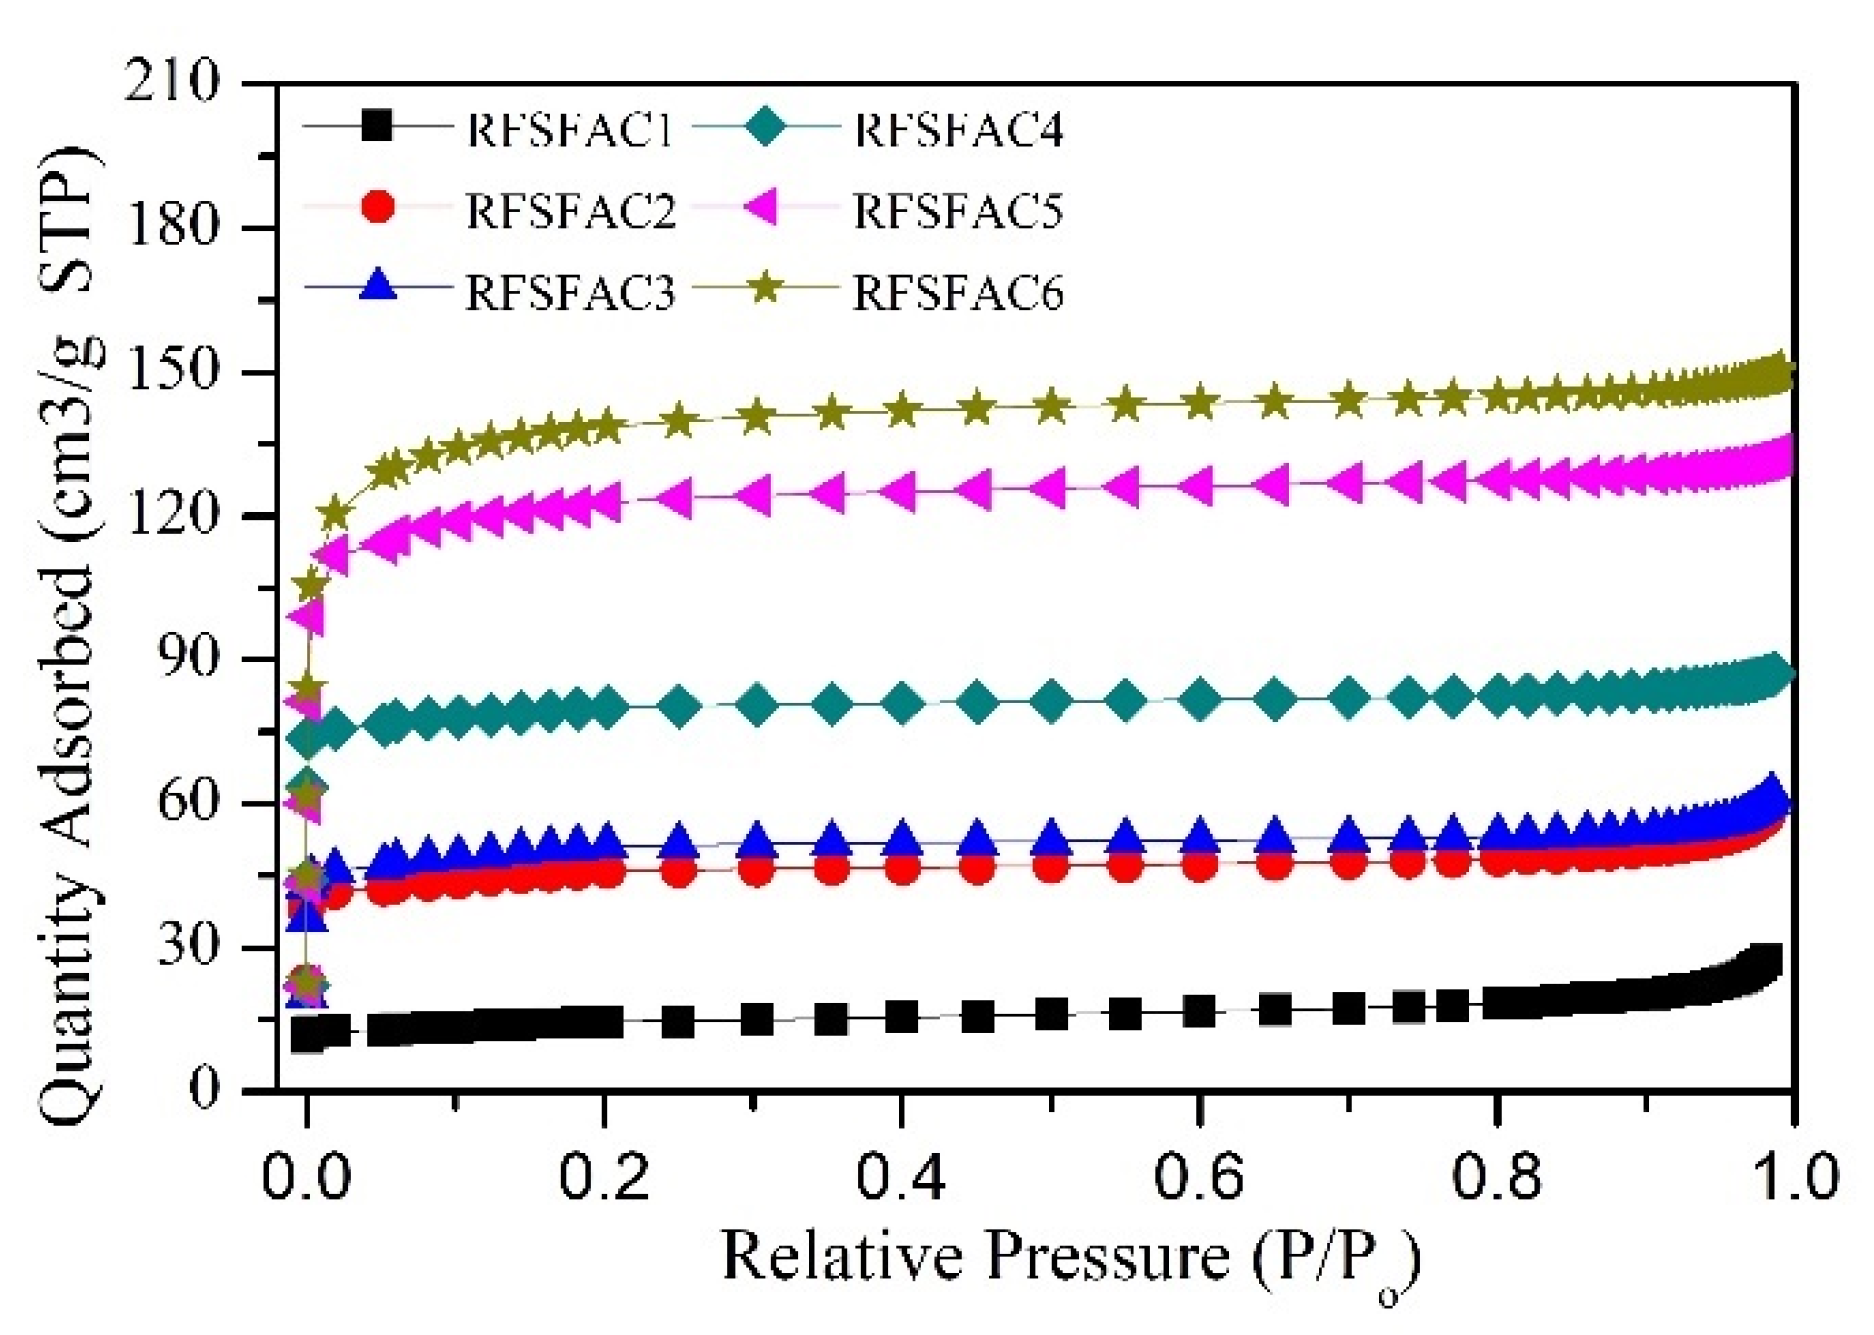
Figure 5 presents the nitrogen adsorption isotherms of the various RFSFAC products. For all of the products, the nitrogen adsorption capacity increases rapidly in the low relative pressure regime (0 < P/P0 < 0.2), but then increases more slowly with an increasing relative pressure before reaching an approximately constant value at a relative pressure of around P/P0 = 0.98. The isotherms are consistent with those reported in [48,51,52,53] and can be classified as type I isotherms based on the IUPAC classification. For both activation agents, the nitrogen adsorption quantity increases with an increasing impregnation ratio due to a widening of the microporosity. Since all of the RFSFACs have a similar isotherm type, it can be inferred that they all contain micropores. However, for a given relative pressure and impregnation ratio, the ZnCl2-activated products yield higher nitrogen adsorption than the KOH-activated samples. This may be due to the pore area and mesoporous structures that were created by ZnCl2 which were higher than KOH. Thus, among all of the present RFSFAC products, the product prepared using the ZnCl2 activating agent with an impregnation ratio of 1:5 yields the highest nitrogen adsorption quantity of 150.38 cm3/g.
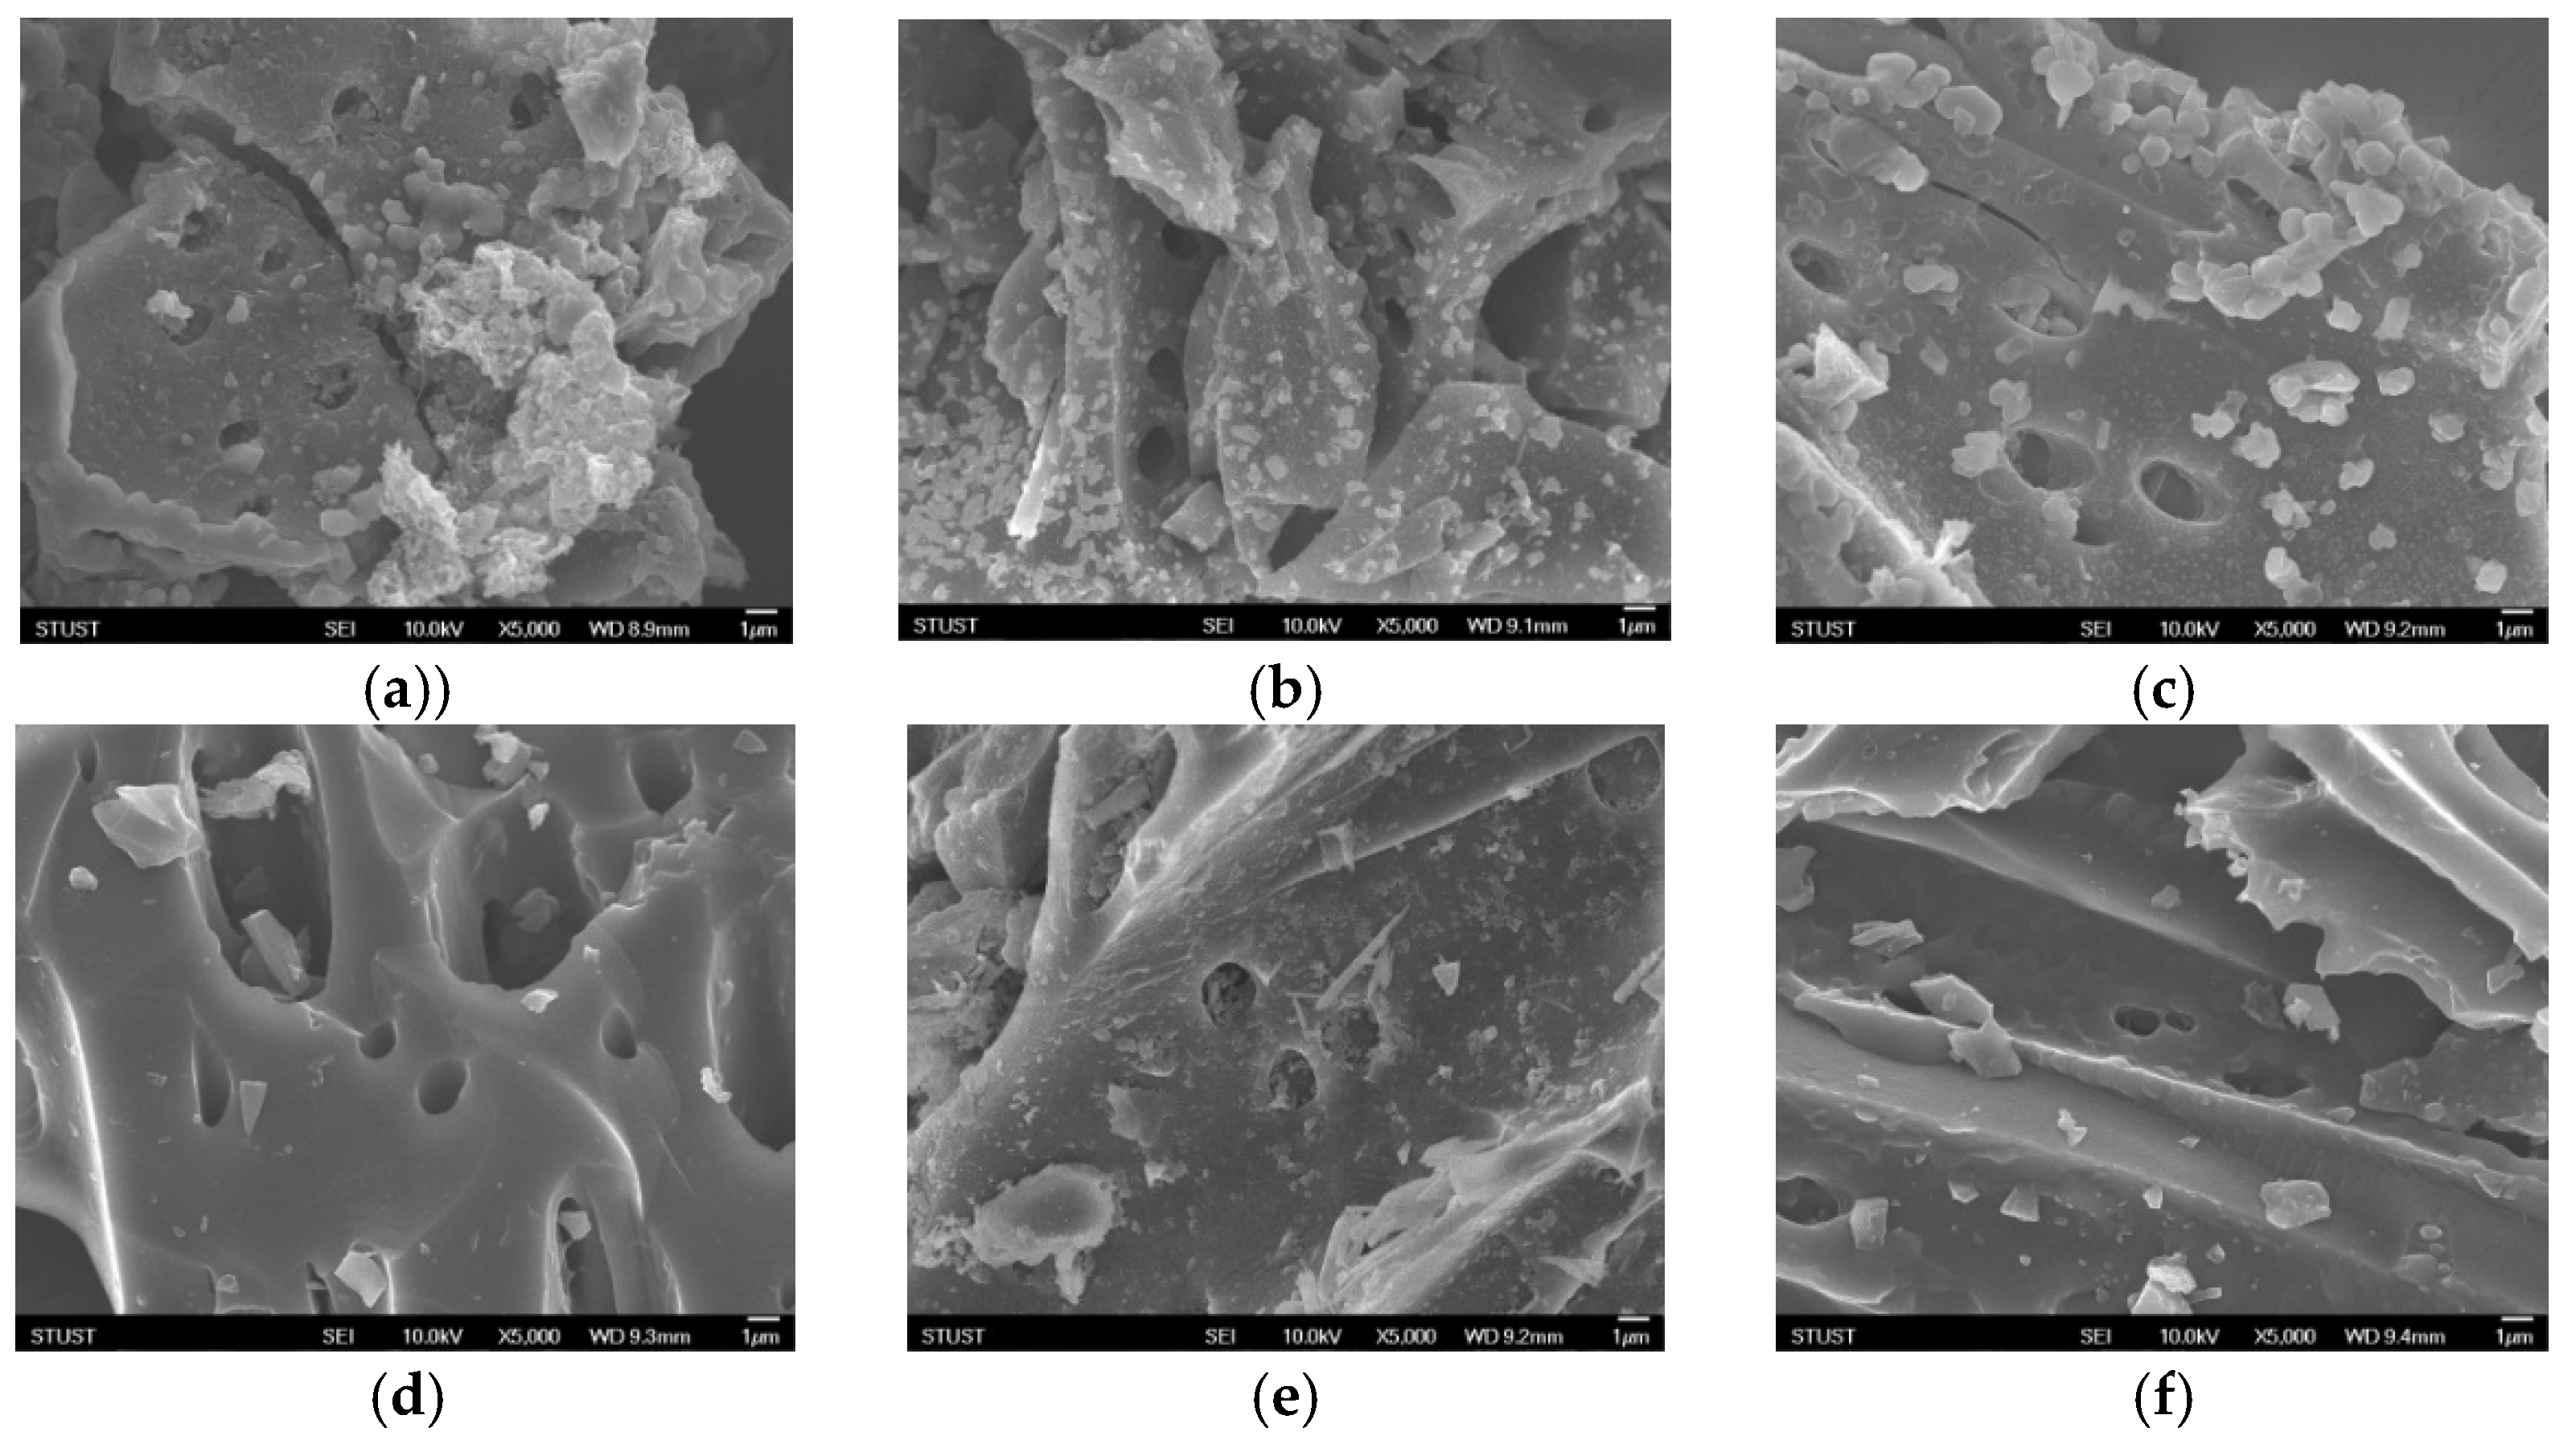
Figure 6 presents SEM micrographs of the various RFSFACs. Large pores or macropores are evident in all of the samples. However, no mesoporous or micropores can be seen due to the relatively low magnification level of the images (5000×). Overall, the images show that for both activating agents, the percentage of macropores remains approximately unchanged as the impregnation ratio increases (see also Figure 4b and Table 3).

3.2. Performance Comparison of Present RFSFACs with Other Biomass Activated Carbons

Table 4 gives an overview of activated carbon characteristic results in this study, and some of the results of previous studies.

4. Discussion

The characteristics of activated carbon are highly dependent on the precursors used, the impregnation ratio, the carbonization time, and the carbonization temperature [59]. In other words, the use of different raw materials and activation treatments can result in activated carbons with very different properties. The RFSFAC6, with a ZnCl2 impregnation ratio of 1:5, surpasses all other samples (seen in Table 3). Using ZnCl2 as an activating agent, RFSAC formed a relatively stable carbon structure below 400 °C, and then began to deteriorate the carbon matrix, resulting in porosity between 400 and 500 °C. At higher temperatures, ZnCl2 has been vaporized and decomposed into zinc and chlorine, which could cause more pores to form [60]. In fact, by increasing the impregnation ratio of the activating agent, more pores would be created. The impregnation ratio increased, the concentration of ZnCl2 attached to the sample surface increased, resulting in a more violent activation reaction, which had a good effect on porosity development. In this study, based on the general results, it can be concluded that RFSFAC treated with ZnCl2 is better than that treated with KOH. This is the same result as previously reported by D. Anis, et al. [61]. Table 4 compares the textural properties of the optimal RFSFAC prepared in the present study (RFSFAC6) with those of 10 other activated carbon materials reported in the literature. As shown, RFSFAC6 has only a moderate surface area (456 m2/g) and pore size (3.4 nm) but has the highest carbon content (80.05 at.%) of all the considered materials. According to the conventions of the International Union of Pure and Applied Chemistry, pore sizes ranging from 2 to 50 nm (mesopores) provide an effective absorption performance for many contaminant materials [62]. For example, RFSFAC6 with a mesopore size of 3.4 nm has significant potential as an absorbent material for wastewater treatment and water purification purposes. Furthermore, with its high carbon content of 80.05 at.%, it also has significant promise for use as a pack carburizing medium in heat treatment processes [63].

5. Conclusions

This study has prepared fine activated carbon (FAC) from rubber fruit shells (RFS) using two different activating agents (KOH and ZnCl2) and three different impregnation ratios (1:3, 1:4, and 1:5). The various products have been systematically characterized and compared by thermogravimetric analysis (TGA), energy dispersive X-ray spectrometry (EDS), X-ray diffraction spectroscopy (XRD), and scanning electron microscopy (SEM). In general, the results have shown that ZnCl2 outperforms KOH as an activator in terms of a higher specific surface area and carbon content. Furthermore, the activation performance of ZnCl2 improves with an increasing impregnation ratio. For the highest impregnation ratio of 1:5, the ZnCl2-activated RFSFAC has a BET surface area of 456 m2/g, an average pore size of 3.44 nm, a nitrogen absorption capacity of 150 cm3/g, a 70% mesoporous structure, and a carbon content of 80.05 at.%. Overall, the results indicate that RFS has significant potential as a low-cost, abundant, and effective precursor for the preparation of FAC with high carbon content.

Author Contributions

Conceptualization, S. and S.-C.W.; methodology, S.; software, S.; validation, S. and S.-C.W.; formal analysis, S.; investigation, S.; resources, S.; data curation, S. and S.-C.W.; writing—original draft preparation, S.; visualization, S.; supervision, S.-C.W.; project administration, S.-C.W.; funding acquisition, S.-C.W. Both authors have read and agreed to the published version of the manuscript.

Funding

This project and APC was financially supported by the Ministry of Science and Technology of the ROC TAIWAN under contract MOST 109-2221-E-218-013.

Institutional Review Board Statement

Not applicable.

Informed Consent Statement

Not applicable.

Data Availability Statement

Not applicable.

Acknowledgments

The authors are grateful to friends and laboratory technicians at the Southern Taiwan University of Science and Technology’s Nano-Functional Ceramics laboratory for assisting in the sample testing process.

Conflicts of Interest

There is no conflict of interest for this research. The funders had no role in the design of the study; in the collection, analyses, or interpretation of data; in the writing of the manuscript, or in the decision to publish the results.

References

  1. Biloé, S.; Goetz, V.; Guillot, A. Optimal design of activated carbon for an adsorbed natural gas storage system. Carbon 2002, 40, 1295–1308. [Google Scholar] [CrossRef]
  2. Gundogdu, A.; Duran, C.; Senturk, H.B.; Soylak, M.; Ozdes, D.; Serencam, H.; Imamoglu, M. Adsorption of phenol from aqueous solution on a low-cost activated carbon produced from tea industry waste: Equilibrium, kinetic, and thermodynamic study. J. Chem. Eng. Data 2012, 57, 2733–2743. [Google Scholar] [CrossRef]
  3. Kårelid, V.; Larsson, G.; Björlenius, B. Pilot-scale removal of pharmaceuticals in municipal wastewater: Comparison of granular and powdered activated carbon treatment at three wastewater treatment plants. J. Environ. Manage. 2017, 193, 491–502. [Google Scholar] [CrossRef] [PubMed]
  4. Triebskorn, R.; Blaha, L.; Gallert, C.; Giebner, S.; Hetzenauer, H.; Köhler, H.-R.; Kuch, B.; Lüddeke, F.; Oehlmann, J.; Peschke, K.; et al. Freshwater ecosystems profit from activated carbon-based wastewater treatment across various levels of biological organisation in a short timeframe. Environ. Sci. Eur. 2019, 31, 85. [Google Scholar] [CrossRef]
  5. Habila, M.A.; ALOthman, Z.A.; Al-Tamrah, S.A.; Ghafar, A.A.; Soylak, M. Activated carbon from waste as an efficient adsorbent for malathion for detection and removal purposes. J. Ind. Eng. Chem. 2015, 32, 336–344. [Google Scholar] [CrossRef]
  6. Patel, M.A.; Luo, F.; Savaram, K.; Kucheryavy, P.; Xie, Q.; Flach, C.; Mendelsohn, R.; Garfunkel, E.; Lockard, J.V.; He, H. P and S dual-doped graphitic porous carbon for aerobic oxidation reactions: Enhanced catalytic activity and catalytic sites. Carbon 2017, 114, 383–392. [Google Scholar] [CrossRef] [Green Version]
  7. Mamaghani, A.H.; Haghighat, F.; Lee, C.S. Photocatalytic oxidation technology for indoor environment air purification: The state-of-the-art. Appl. Catal. B Environ. 2017, 203, 247–269. [Google Scholar] [CrossRef]
  8. Yi, J.; Qing, Y.; Wu, C.T.; Zeng, Y.; Wu, Y.; Lu, X.; Tong, Y. Lignocellulose-derived porous phosphorus-doped carbon as advanced electrode for supercapacitors. J. Power Sources 2017, 351, 130–137. [Google Scholar] [CrossRef]
  9. Li, S.; Han, K.; Si, P.; Li, J.; Lu, C. High-performance activated carbons prepared by KOH activation of gulfweed for supercapacitors. Int. J. Electrochem. Sci. 2018, 13, 1728–1743. [Google Scholar] [CrossRef]
  10. Mahanim, S.M.A.; Asma, I.W.; Rafidah, J. Production of Activated Carbon from Indrustrial Bamboo Wastes. J. Trop. For. Sci. 2011, 23, 417–424. [Google Scholar]
  11. Rashidi, N.A.; Yusup, S. A review on recent technological advancement in the activated carbon production from oil palm wastes. Chem. Eng. J. 2017, 314, 277–290. [Google Scholar] [CrossRef]
  12. Jurewicz, K.; Babeł, K. Efficient capacitor materials from active carbons based on coconut shell/melamine precursors. Energy Fuels 2010, 24, 3429–3435. [Google Scholar] [CrossRef]
  13. Tangjuank, S.; Insuk, N.; Udeye, V.; Tontrakoon, J. Chromium (III) sorption from aqueous solutions using activated carbon prepared from cashew nut shells. Int. J. Phys. Sci. 2009, 4, 412–417. [Google Scholar]
  14. Latiff, M.F.P.M.; Abustan, I.; Ahmad, M.A.; Yahaya, N.K.E.M.; Khalid, A.M. Effect of preparation conditions of activated carbon prepared from corncob by CO2 activation for removal of Cu (II) from aqueous solution. AIP Conf. Proc. 2016, 1774, 45–49. [Google Scholar]
  15. Chen, H.; Wang, H.; Yang, L.; Xiao, Y.; Zheng, M.; Liu, Y.; Fu, H. High specific surface area rice hull based porous carbon prepared for EDLCs. Int. J. Electrochem. Sci. 2012, 7, 4889–4897. [Google Scholar]
  16. Jun, T.Y.; Arumugam, S.D.; Latip, N.H.A.; Abdullah, A.M.; Latif, P.A. Effect of activation temperature and heating duration on physical characteristics of activated carbon prepared from agriculture waste. Environ. Asia 2010, 3, 143–148. [Google Scholar]
  17. Jadhav, A.S.; Salwe, S.; Tambe, M.; Shinde, N.H. Chemical Characterisation of Biomass Waste by Proximate Analysis Method Using Catalyst. Int. J. Adv. Eng. Technol. 2011, 2, 1–19. [Google Scholar]
  18. Balathanigaimani, M.S.; Shim, W.G.; Lee, M.J.; Kim, C.; Lee, J.W.; Moon, H. Highly porous electrodes from novel corn grains-based activated carbons for electrical double layer capacitors. Electrochem. Commun. 2008, 10, 868–871. [Google Scholar] [CrossRef]
  19. Wang, L.; Li, Y.; Yang, K.; Lu, W.; Yu, J.; Gao, J.; Liao, G.; Qu, Y.; Wang, X.; Li, X.; et al. Hierarchical porous carbon microspheres derived from biomass-corncob as ultra-high performance supercapacitor electrode. Int. J. Electrochem. Sci. 2017, 12, 5604–5617. [Google Scholar] [CrossRef]
  20. Li, Q.; Liu, F.; Zhang, L.; Nelson, B.J.; Zhang, S.; Ma, C.; Tao, X.; Cheng, J.; Zhang, X. In situ construction of potato starch based carbon nanofiber/activated carbon hybrid structure for high-performance electrical double layer capacitor. J. Power Sources 2012, 207, 199–204. [Google Scholar] [CrossRef]
  21. Lv, Y.; Gan, L.; Liu, M.; Xiong, W.; Xu, Z.; Zhu, D.; Wright, D.S. A self-template synthesis of hierarchical porous carbon foams based on banana peel for supercapacitor electrodes. J. Power Sources 2012, 209, 152–157. [Google Scholar] [CrossRef]
  22. Ukanwa, K.S.; Patchigolla, K.; Sakrabani, R.; Anthony, E.; Mandavgane, S. A review of chemicals to produce activated carbon from agricultural waste biomass. Sustainability 2019, 11, 6204. [Google Scholar] [CrossRef] [Green Version]
  23. Direktorat Jenderal Perkebunan Kementerian Pertanian Republik Indonesia. Pembangunan Perkebunan 2019. Available online: http://ditjenbun.pertanian.go.id/2019/ (accessed on 14 September 2020).
  24. Eka, H.D.; Tajul Aris, Y.; Wan Nadiah, W.A. Potential use of Malaysian rubber (Hevea brasiliensis) seed as food, feed and biofuel. Int. Food Res. J. 2010, 17, 527–534. [Google Scholar]
  25. Mulyadi, E. Proses Produksi Biodiesel Berbasis Biji Karet. J. Rekayasa Proses 2011, 5, 40–44. [Google Scholar]
  26. Grycova, B.; Pryszcz, A.; Matejova, L.; Lestinsky, P. Influence of activating reagents on the porous structure of activated carbon. Chem. Eng. Trans. 2018, 70, 1897–1902. [Google Scholar]
  27. Ozdemir, I.; Şahin, M.; Orhan, R.; Erdem, M. Preparation and characterization of activated carbon from grape stalk by zinc chloride activation. Fuel Process. Technol. 2014, 125, 200–206. [Google Scholar] [CrossRef]
  28. Basta, A.H.; Fierro, V.; El-Saied, H.; Celzard, A. 2-Steps KOH activation of rice straw: An efficient method for preparing high-performance activated carbons. Bioresour. Technol. 2009, 100, 3941–3947. [Google Scholar] [CrossRef] [PubMed]
  29. Hirunpraditkoon, S.; Tunthong, N.; Ruangchai, A.; Nuithitikul, K. Adsorption Capacities of Activated Carbons Prepared from Bamboo by KOH Activation. World Acad. Sci. Eng. Technol. Int. J. Chem. Mol. Eng. 2011, 5, 477–481. [Google Scholar]
  30. Cruz, G. Production of Activated Carbon from Cocoa (Theobroma cacao) Pod Husk. J. Civ. Environ. Eng. 2012, 2, 2–7. [Google Scholar] [CrossRef]
  31. Abechi, S.E.; Gimba, C.E.; Uzairu, A.; Dallatu, Y.A. Preparation and Characterization of Activated Carbon from Palm Kernel Shell by Chemical Activation. Res. J. Chem. Sci. 2013, 3, 54–61. [Google Scholar]
  32. Gao, J.J.; Qin, Y.B.; Zhou, T.; Cao, D.D.; Xu, P.; Hochstetter, D.; Wang, Y.F. Adsorption of methylene blue onto activated carbon produced from tea (Camellia sinensis L.) seed shells: Kinetics, equilibrium, and thermodynamics studies. J. Zhejiang Univ. Sci. B 2013, 14, 650–658. [Google Scholar] [CrossRef] [Green Version]
  33. Theydan, S.K.; Ahmed, M.J. Optimization of preparation conditions for activated carbons from date stones using response surface methodology. Powder Technol. 2012, 224, 101–108. [Google Scholar] [CrossRef]
  34. Köseoʇlu, E.; Akmil-Başar, C. Preparation, structural evaluation and adsorptive properties of activated carbon from agricultural waste biomass. Adv. Powder Technol. 2015, 26, 811–818. [Google Scholar] [CrossRef]
  35. Chang, B.; Wang, Y.; Pei, K.; Yang, S.; Dong, X. ZnCl2-activated porous carbon spheres with high surface area and superior mesoporous structure as an efficient supercapacitor electrode. RSC Adv. 2014, 4, 40546–40552. [Google Scholar] [CrossRef]
  36. Yang, H.M.; Zhang, D.H.; Chen, Y.; Ran, M.J.; Gu, J.C. Study on the application of KOH to produce activated carbon to realize the utilization of distiller’s grains. IOP Conf. Ser. Earth Environ. Sci. 2017, 69, 012051. [Google Scholar] [CrossRef] [Green Version]
  37. Mozammel, H.M.; Masahiro, O.; Bhattacharya, S.C. Activated charcoal from coconut shell using ZnCl2 activation. Biomass Bioenergy 2002, 22, 397–400. [Google Scholar] [CrossRef]
  38. Baseri, J.R.; Palanisamy, P.N.; Sivakumar, P. Preparation and characterization of activated carbon from Thevetia peruviana for the removal of dyes from textile waste water. Adv. Appl. Sci. Res. 2012, 3, 377–383. [Google Scholar]
  39. García, R.; Pizarro, C.; Lavín, A.G.; Bueno, J.L. Biomass proximate analysis using thermogravimetry. Bioresour. Technol. 2013, 139, 1–4. [Google Scholar] [CrossRef]
  40. Zulfadhli, M. Iriany Pembuatan Karbon Dari Cangkang Buah karet (Hevea brasilliensis) dengan Aktivator H3PO4 dan Aplikasinya Sebagai Penyerap Cr (VI). J. Tek. Kim. USU 2017, 6, 23–28. [Google Scholar] [CrossRef]
  41. Maulina, S.; Iriansyah, M. Characteristics of activated carbon resulted from pyrolysis of the oil palm fronds powder. IOP Conf. Ser. Mater. Sci. Eng. 2018, 309, 012072. [Google Scholar] [CrossRef] [Green Version]
  42. Zhang, J.; Gao, J.; Chen, Y.; Hao, X.; Jin, X. Characterization, preparation, and reaction mechanism of hemp stem based activated carbon. Results Phys. 2017, 7, 1628–1633. [Google Scholar] [CrossRef]
  43. Hsu, L.Y.; Teng, H. Influence of different chemical reagents on the preparation of activated carbons from bituminous coal. Fuel Process. Technol. 2000, 64, 155–166. [Google Scholar] [CrossRef]
  44. Tseng, R.L.; Tseng, S.K.; Wu, F.C.; Hu, C.C.; Wang, C.C. Effects of micropore development on the physicochemical properties of KOH-activated carbons. J. Chin. Inst. Chem. Eng. 2008, 39, 37–47. [Google Scholar] [CrossRef]
  45. Mopoung, S.; Moonsri, P.; Palas, W.; Khumpai, S. Characterization and Properties of Activated Carbon Prepared from Tamarind Seeds by KOH Activation for Fe(III) Adsorption from Aqueous Solution. Sci. World J. 2015, 2015. [Google Scholar] [CrossRef] [Green Version]
  46. Huang, Y.; Ma, E.; Zhao, G. Thermal and structure analysis on reaction mechanisms during the preparation of activated carbon fibers by KOH activation from liquefied wood-based fibers. Ind. Crops Prod. 2015, 69, 447–455. [Google Scholar] [CrossRef]
  47. Chen, Y.D.; Huang, M.J.; Huang, B.; Chen, X.R. Mesoporous activated carbon from inherently potassium-rich pokeweed by in situ self-activation and its use for phenol removal. J. Anal. Appl. Pyrolysis 2012, 98, 159–165. [Google Scholar] [CrossRef]
  48. He, X.J.; Wang, T.; Qiu, J.S.; Zhang, X.Y.; Wang, X.T.; Zheng, M.D. Effect of microwave-treatment time on the properties of activated carbons for electrochemical capacitors. Xinxing Tan Cailiao/New Carbon Mater. 2011, 26, 313–319. [Google Scholar] [CrossRef]
  49. Li, Y.; Li, Y.; Li, L.; Shi, X.; Wang, Z. Preparation and analysis of activated carbon from sewage sludge and corn stalk. Adv. Powder Technol. 2016, 27, 684–691. [Google Scholar] [CrossRef]
  50. Meilianti, M. Karakteristik Karbon Aktif Dari Cangkang Buah Karet Menggunakan Aktivator H3Po4. J. Distilasi 2018, 2, 1. [Google Scholar] [CrossRef]
  51. Yang, H.; Yan, R.; Chen, H.; Lee, D.H.; Zheng, C. Characteristics of hemicellulose, cellulose and lignin pyrolysis. Fuel 2007, 86, 1781–1788. [Google Scholar] [CrossRef]
  52. Arami-Niya, A.; Daud, W.M.A.W.; Mjalli, F.S. Comparative study of the textural characteristics of oil palm shell activated carbon produced by chemical and physical activation for methane adsorption. Chem. Eng. Res. Des. 2011, 89, 657–664. [Google Scholar] [CrossRef]
  53. Sudaryanto, Y.; Hartono, S.B.; Irawaty, W.; Hindarso, H.; Ismadji, S. High surface area activated carbon prepared from cassava peel by chemical activation. Bioresour. Technol. 2006, 97, 734–739. [Google Scholar] [CrossRef] [PubMed]
  54. Subha, R.; Namasivayam, C. ZnCl2-modified activated carbon from biomass coir pith for the removal of 2-chlorophenol by adsorption process. Bioremediat. J. 2010, 14, 1–9. [Google Scholar] [CrossRef]
  55. Hamzah, Y.; Umar, L. Preparation of creating active carbon from cigarette filter waste using microwave-induced KOH activation. J. Phys. Conf. Ser. 2017, 853, 012027. [Google Scholar] [CrossRef] [Green Version]
  56. Hidayu, A.R.; Muda, N. Preparation and Characterization of Impregnated Activated Carbon from Palm Kernel Shell and Coconut Shell for CO2 Capture. Procedia Eng. 2016, 148, 106–113. [Google Scholar] [CrossRef] [Green Version]
  57. Ahmed, S.; Mada, V.V.; Kamath, V.; Jeppu, G.P. Characterization Of Activated Carbon Prepared From Coconut Shell Using Various Reagents For A Low Cost Water- Filter. Int. J. Eng. Technol. 2017, 9, 180–188. [Google Scholar] [CrossRef] [Green Version]
  58. Gawande, P.R.; Kaware, J. Characterization and activation of coconut shell activated carbon Research Paper. Int. J. Eng. Sci. Invent. 2017, 6, 43–49. [Google Scholar]
  59. Alhamed, Y. Activated Carbon from Dates’ Stone by ZnCl2 Activation. J. King Abdulaziz Univ. Sci. 2006, 17, 75–98. [Google Scholar] [CrossRef]
  60. Liu, Z.; Huang, Y.; Zhao, G. Preparation and characterization of activated carbon fibers from liquefied wood by ZnCl2 activation. BioResources 2016, 11, 3178–3190. [Google Scholar] [CrossRef] [Green Version]
  61. Anis, D.; Zaidi, A.G.; Khudzir, I.; Iqbaldin, M.N.; Osman, U.M.; Nawawi, W.I. Production of Rubber Seed Pericarp Based Activated Carbon Using Microwave-Induced Different Chemical Activating Agent. Int. J. Sci. Res. Publ. 2014, 4, 1–8. [Google Scholar]
  62. Koehlert, K. Activated carbon: Fundamentals and new applications. Chem. Eng. 2017, 124, 32–40. [Google Scholar]
  63. Sujita, R.S.; Siswanto, E.; Widodo, T.D. Influence of Reheating in Pack Carburizing Process with Bamboo Charcoal and Cow Bone Powder Media for Hardness Number and Impact Strength Low Carbon Steel. Int. J. Appl. Eng. Res. 2018, 13, 2078–2083. [Google Scholar]
Figure 1. Thermal decomposition analysis results for RFSFAC products prepared using different activating agents and impregnation ratios.
Applsci 11 03994 g001
Figure 2. XRD patterns of RFSFAC products prepared using different impregnation ratios and activating agents. (a) KOH; (b) ZnCl2.
Applsci 11 03994 g002
Figure 3. (a) Brunauer–Emmett–Teller (BET) surface area; (b) average pore diameter of treated RFSFAC, with different activating agents and impregnation ratio. (NCA, non-chemical activation).
Applsci 11 03994 g003
Figure 4. (a) Barrett–Joyner–Halenda (BJH) adsorption pore area distribution; (b) pore size distribution for RFSFACs, prepared with different activating agents and impregnation ratios.
Applsci 11 03994 g004
Figure 5. Nitrogen desorption isotherms for RFSFACs prepared with different activating agents and impregnation ratios.
Applsci 11 03994 g005
Figure 6. SEM micrographs (5000× magnification) of RFSFACs prepared with different impregnation ratios (1:3, 1:4, and 1:5). (ac) with KOH; (df) with ZnCl2.
Applsci 11 03994 g006
Table 1. Chemical activation process parameters.
SampleImpregnation Ratio (wt.%)Chemical SolutionTemperature (°C)
RFSFC---
RFSFAC11:3KOH800
RFSFAC21:4KOH800
RFSFAC31:5KOH800
RFSFAC41:3ZnCl2500
RFSFAC51:4ZnCl2500
RFSFAC61:5ZnCl2500
Table 2. Proximate analysis results and elemental contents before and after the activation process with different activating agents and impregnation ratios.
Proximate Analysis (Weight %)RFSFC PowderKOHZnCl2
RFSFAC
123456
Moisture0.4316.7620.6123.5113.3113.7614.98
Volatile matter97.0656.3847.3742.2448.2434.9033.44
Fixed carbon1.0516.2621.2523.8423.2636.9738.09
Ash1.4610.5910.7710.4115.1914.3813.50
Elemental Contents (Atomic %)
Carbon74.1172.2977.6378.4065.9481.8380.05
Oxygen11.0627.6519.9218.7323.7712.6717.42
Nitrogen13.66------
Silicon0.160.050.610.370.930.030.10
Potassium0.86-1.842.50.080.020.07
Chlorine----4.413.451.25
Zinc----4.862.001.11
Table 3. Textural properties of RFSFACs.
SampleBET (m2/g)Adsorption Quantity (cm3/g)Average Pore Diameter (nm)Pore Area
MesoporesMicroporesMacropores
(m2/g)(%)(m2/g)(%)(m2/g)(%)
RFSFC17855.914.8311.41685.18310.241
RFSFAC14227.359.039.25782.19180.444
RFSFAC214158.035.2116.38668.08320.462
RFSFAC316061.834.6416.39639.34360.442
RFSFAC425687.204.1913.88686.39310.201
RFSFAC5400132.923.5424.746811.50320.201
RFSFAC6456150.383.4428.4670.111.9529.40.200.5
Table 4. Textural properties of activated carbon prepared from various biomass feedstocks.
PrecursorChemical Activation AgentBET (m2/g)Adsorption Quantity (cm3/g)Average Pore Diameter (nm)Carbon Content (at.%)Ref.
Oil palm shellZnCl211183302.250[52]
Tamarind seeds KOH2.72NaNa23[45]
Coir pithZnCl2910NaNa70[54]
Bamboo wastes-719NaNa77[10]
Cassava peelKOH1605NaNa59[53]
Tea industry wasteZnCl2 1066Na2.279[2]
Cigarette filter wasteKOH328743.0169[55]
Coconut shellZnCl2953Na18.2 Å 75[56]
ZnCl2251NaNaNa[57]
H2SO4435NaNaNa[58]
RFSFACZnCl24561513.480.05This work
Note: Na, not available.
Publisher’s Note: MDPI stays neutral with regard to jurisdictional claims in published maps and institutional affiliations.