Article

Estimating the Polytropic Indices of Plasmas with Partial Temperature Tensor Measurements: Application to Solar Wind Protons at ~1 au

by
Georgios Nicolaou
1,*,
George Livadiotis
1 and
Mihir I. Desai
1,2
1
Southwest Research Institute, San Antonio, TX 78238, USA
2
Department of Physics and Astronomy, University of Texas at San Antonio, San Antonio, TX 78249, USA
*
Author to whom correspondence should be addressed.
Appl. Sci. 2021, 11(9), 4019; https://doi.org/10.3390/app11094019
Submission received: 20 March 2021 / Revised: 21 April 2021 / Accepted: 22 April 2021 / Published: 28 April 2021
(This article belongs to the Special Issue Dynamical Processes in Space Plasmas)

Abstract

:
We examine the relationships between temperature tensor elements and their connection to the polytropic equation, which describes the relationship between the plasma scalar temperature and density. We investigate the possibility to determine the plasma polytropic index by fitting the fluctuations of temperature either perpendicular or parallel to the magnetic field. Such an application is particularly useful when the full temperature tensor is not available from the observations. We use solar wind proton observations at ~1 au to calculate the correlations between the temperature tensor elements and the scalar temperature. Our analysis also derives the polytropic equation in selected streamlines of solar wind plasma proton observations that exhibit temperature anisotropies related to stream-interaction regions. We compare the polytropic indices derived by fitting fluctuations of the scalar, perpendicular, and parallel temperatures, respectively. We show that the use of the parallel or perpendicular temperature, instead of the scalar temperature, still accurately derives the true, average polytropic index value, but only for a certain level of temperature anisotropy variability within the analyzed streamlines. The use of the perpendicular temperature leads to more accurate calculations, because its correlation with the scalar temperature is less affected by the anisotropy fluctuations.

1. Introduction

1.1. Temperature Anisotropy

The analysis of plasma particle velocity distribution functions (VDFs) is necessary to understand the kinetic and thermodynamic properties of plasmas. The statistical moments of the VDFs determine the plasma bulk properties, such as the plasma density, velocity and temperature. The plasma temperature, specifically, is analogous to the average kinetic energy of the plasma particles in the reference frame of the plasma and is calculated by the second order velocity moment of the plasma VDF. In several cases, the VDFs of space plasmas exhibit temperature anisotropies, which are organized by the magnetic field direction (e.g., [1,2,3]). In these cases, the complete description of plasmas requires the knowledge of the temperature perpendicular to the magnetic field T and the temperature parallel to the magnetic field T . In order to resolve the full temperature tensor from the data analysis, we need observations of full, three-dimensional (3D) VDFs or observations of 2D pitch-angle distributions of the plasma particles [4,5].
Several studies discuss heating/cooling mechanisms that result in the anisotropic heating of plasmas. For instance, [6] show analytically how the temperature anisotropy is modified across shock waves, accounting for observations of interplanetary and planetary bow shocks. The analysis by [7] shows a perpendicular heating of solar wind ions as they cross the bow Shock of Venus. The anisotropic heating is stronger closer to Venus, where the shocked solar wind interacts with the planet’s ionosphere. In another example, [8] examine ARTEMIS ion observations of a long-duration magnetotail exhaust. The authors show that the parallel temperature dominates far away from the x-line, indicating strong parallel ion heating. Near the neutral plane, however, the perpendicular temperature dominates, indicating that ions undergo a Speiser-like motion.
In gyro-tropic plasmas, the scalar temperature T is the trace of the temperature tensor:
T = 1 3 T + 2 3 T ,
and the temperature anisotropy is the ratio:
α = T T .
Unfortunately, in situ observations are not always optimal to construct 3D VDFs or full pitch-angle distributions from which we can determine the full temperature tensor. For instance, in some occasions, Faraday cup observations obtain 1D VDFs from which we can derive the temperature along one direction only [9]. Therefore, here, we would like to explore the correlations between the temperature tensor elements, the scalar temperature, and the temperature anisotropy. These correlations are useful to understand what plasma dynamics information we lose when accurate temperature measurements occur in only one direction. By combining Equations (1) and (2), we express the scalar temperature as a function of α and T :
T = 1 3 α T + 2 3 T = T [ 1 3 ( 1 α + 2 ) ] log T = log T + log ( 1 + 2 α 3 α ) ,
and as a function of α and T :
T = 1 3 T + 2 3 α T = T ( 1 + 2 α 3 ) log T = log T + log ( 1 + 2 α 3 ) .
We would like to examine how the above relationships apply in solar wind proton observations, and how well T or T can be used to study a specific thermodynamic process; the polytropic process.

1.2. Polytropic Process

The polytropic process describes the transition of a fluid from one thermodynamic state to another through the relationship between the fluid density and temperature (or pressure [10,11]). Through the polytropic equation, we achieve a closure between the higher order moments and the plasma density. In terms of plasma density n and temperature Τ, the polytropic equation is:
T = C n γ 1 ,
where C is a constant characterizing specific streamlines, and γ is the polytropic index. The value of γ is indicative for the energy transfer during the process. The determination of γ in several applications is useful in understanding the physical mechanisms in the system. We take the logarithm of Equation (5):
log ( T ) = ( γ 1 ) log ( n ) + log C ,
so that γ is determined by the slope of the linear relationship between log ( T ) and log ( n ) . The polytropic index is a useful tool to study dynamic plasma fluctuations [12] and describes the heating/cooling of the plasma without the necessity to solve the energy equation, which can be very complicated [13]. Several studies analyze plasma observations and determine the polytropic index of different species in several regions through the heliosphere. For instance, [14] determine the polytropic index of plasma electrons in the Saturnian magnetosphere from Cassini observations, while [15] derive the polytropic index of energetic plasma ions in the magnetosphere of Saturn, observed by the same spacecraft. The studies by [16,17] use a polytropic model to characterize the temperature and density fluctuations in the distant Jovian magnetosheath and boundary layer. In other examples, [18,19] determine the polytropic expansion of the solar wind protons in the inner heliosphere, while [20,21,22] calculate γ of protons at ~1 au. Elliott et al. [23] calculate γ of solar wind protons through the outer heliosphere, and [24] determines the polytropic process in the inner heliosheath. Finally, [25] discuss the radial profile of the polytropic index within the heliosphere.
As mentioned in the previous subsection, in situ plasma measurements cannot always determine the full temperature tensor. Therefore, we would like to determine the polytropic relationship as a function of the temperature in a single direction. For simplicity, we investigate the polytropic relationship with T and T , although we could generalize for any direction. By combining Equations (3), (4) and (6), we can express the polytropic equation in terms of T and α :
T = C ( 3 α 2 α + 1 ) n γ 1 log ( T ) = log C + log ( 3 α 2 α + 1 ) + ( γ 1 ) log ( n ) ,
or in terms of T and α :
T = C ( 3 2 α + 1 ) n γ 1 log ( T ) = log C + log ( 3 2 α + 1 ) + ( γ 1 ) log ( n ) .
According to Equations (7) and (8), we can determine a linear relationship between either log ( T ) and log ( n ) , or log ( T ) and log ( n ) , only if α does not vary within the examined interval. In both cases, the slope of the linear model defines γ . In other words, if we use a temperature element along one direction only and we do not know the temperature anisotropy, we can derive the polytropic index only in intervals with nearly constant temperature anisotropy.
This paper examines the polytropic behavior of solar wind protons in an annual interval, while a future study will expand the analysis in a dataset covering more than 25 years of observations. Our selected time period shows clear evidence of anisotropic heating within stream-interaction regions. We determine the polytropic index by applying three different fittings: one using the scalar temperature, one using the perpendicular temperature T , and one using the parallel temperature T . We compare the derived polytropic indices and discuss their similarities and differences. This paper is organized as follows. In the next section, we explain the data we use. Section 3 describes our analysis methods. In Section 4, we show our results, which are discussed in Section 5. Finally, Section 6 summarizes our conclusions.

2. Data

We use 92 s resolution proton plasma observations obtained by the Wind spacecraft [26] at a heliocentric distance ~1 au in 1995 (see Figure 1). We use the proton plasma density n and its 1-sigma uncertainty σ n , the bulk speed V, the scalar thermal speed, and the thermal speed perpendicular and parallel to the magnetic field and their uncertainties. From these, we calculate the scalar temperature T, the perpendicular temperature T , the parallel temperature T , and their 1-sigma uncertainties σ T , σ T , , and σ T , , respectively. We use the plasma bulk parameters, which are derived from Maxwellian fits to the observed velocity distribution functions [27]. The goodness of each fit is quantified by a chi-squared (χ2) value. In order to increase the statistical significance of our analysis, we exclude data points with χ2 > 5. Additionally, we only analyze data points with relative uncertainties σ n n , σ T T , σ T , T and σ T , T , all smaller than 30%. Finally, for the calculation of the Bernoulli integral (see Section 3), we use magnetic field B measurements, averaged over the time resolution of the plasma data.

3. Methodology

We initially investigate the temperature anisotropy as a function of the bulk speed by examining the histograms of the two parameters. We also calculate the linear Pearson correlation coefficients between T and T , T and T , and T and T . We calculate for slow (V < 500 kms−1) and fast (V > 500 kms−1) solar wind. Additionally, in order to investigate the large-scale correlations between the plasma density and temperature, we plot the 2D histograms of log ( n ) and log ( T ) , log ( n ) and log ( T ) , and log ( n ) and log ( T ) .
We then group the entire time series in subintervals of eight consecutive measurements, which cover ~12 min if there are no data gaps between the data points. We calculate the standard polytropic index γ and its uncertainty σ γ in each subinterval by fitting the polytropic model to ln ( T ) vs. ln ( n ) observations. For the fitting, we use an orthogonal distance regression. The weighted fitting uses σ T T and σ n n as the 1-sigma uncertainties of the fitted ln ( T ) and ln ( n ) data points, respectively. We further quantify the homogeneity of the plasma within each subinterval by calculating the ratio of the standard deviation of the Bernoulli integral over its absolute mean value [20,21,22,28,29]. We exclude time sub-intervals in which this ratio is larger than 0.1. Finally, we repeat the linear regression method to determine the polytropic indices from the slopes between ln ( n ) and ln ( T ) , and between ln ( n ) and ln ( T ) .

4. Results

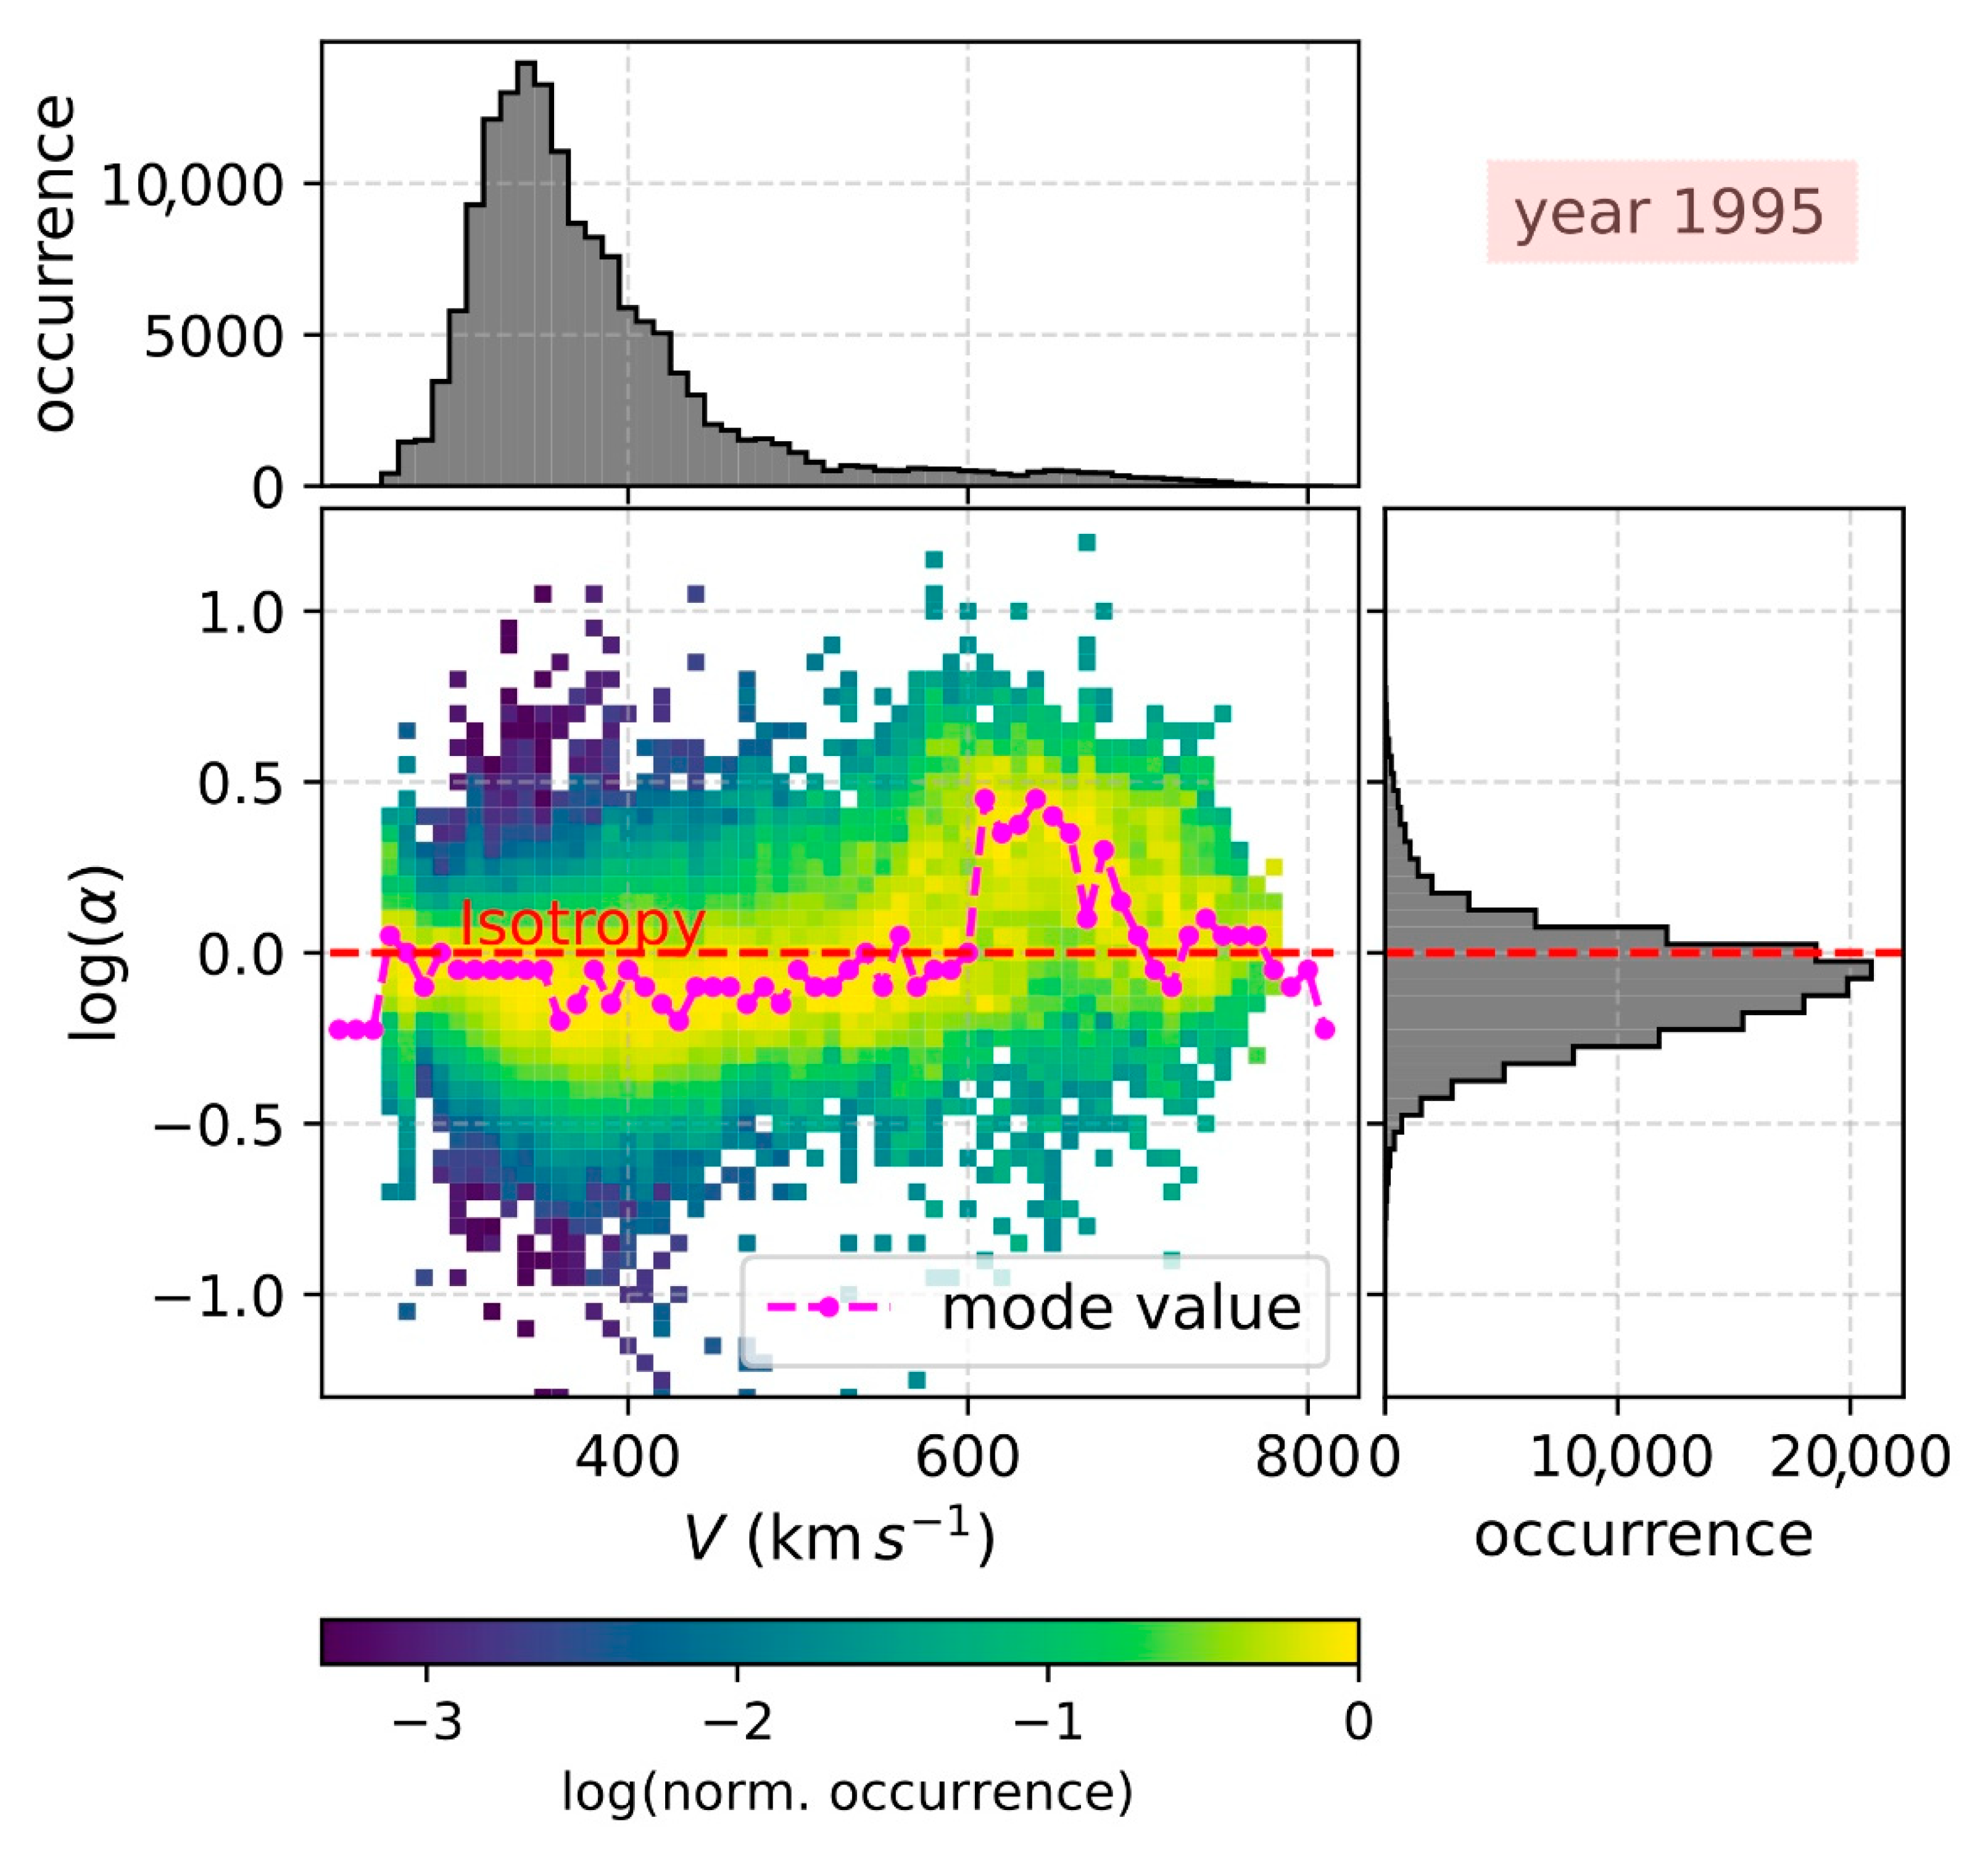
According to Figure 1, Wind observed several stream-interaction regions in 1995. Within these regions, the observed bulk velocity increases to V ~750 kms−1 over the background solar wind speed V ~300 kms−1. The scalar temperature also increases by an order of magnitude within the interaction regions. The temperature anisotropy seems to increase with increasing speed and temperature. In the bottom left panel of Figure 2, we show the 2D histogram of log ( α ) and V, as observed in 1995. We normalize the occurrence in each column (V bin) to its maximum value. The top panel of Figure 2 shows the 1D histogram of V, while the right panel shows the 1D histogram of log(α) for the same interval. Although the most frequent temperature anisotropy is below 1, there is a sharp increase at V ~600 kms−1. The peak of the most frequent value (magenta) is α ~2.5. The anisotropy decreases again for V > 650 kms−1. We interpret this as an anisotropic heating/cooling of the plasma protons within stream-interaction regions.
The top panels of Figure 3 show scatter plots of the logarithms of the temperature tensor elements and the scalar temperature in the slow solar wind (V < 500 kms−1), while the bottom panels show the corresponding plots for the fast solar wind (V > 500 kms−1). In each panel, we plot the identity line (y = x) and show the calculated linear Pearson correlation coefficient of the parameters. We observe that in the slow solar wind, log ( T ) is strongly correlated with both log ( T ) and log ( T ) . The Pearson correlation coefficients are ~0.98 and ~0.96, respectively. Additionally, log ( T ) and log ( T ) are well-correlated (Pearson correlation coefficient ~0.88) in the slow solar wind. In the fast solar wind, the correlation coefficients are smaller than the corresponding coefficients in the slow solar wind. The largest correlation is still observed between log ( T ) and log ( T ) , which gives a Pearson correlation coefficient of ~0.94. The coefficients between the other tensor elements are significantly smaller (<0.64). We note that the number of analyzed data points in the fast solar wind (V > 500 kms−1) is significantly smaller than the number of analyzed data points in the slow solar wind (V < 500 kms−1; see the speed histogram in Figure 2). According to this result, we infer that the proton temperature measured along a single direction could be used successfully in the studies of some of the plasma thermodynamic properties. Such an application will be more accurate in the slow solar wind.
We also investigate the long-term relationship between plasma density and temperature. In the left panel of Figure 4, we show the 2D histogram of log ( n ) and log ( T ) . The middle panel of Figure 4 shows the 2D histogram of log ( n ) and log ( T ) , while the right panel shows the 2D histogram of log ( n ) and log ( T ) . We normalize each column of the histograms to the maximum value within the column. Besides some obvious differences, the three histograms have a similar general structure. The large-scale fluctuations of log ( n ) and the logarithm of the temperature tensor elements are anti-correlated. Specifically, the general trend of the large-scale variations follow the grey dashed lines with a slope of −2. However, we observe short-scale structures with positive slopes. Those appear as smaller, bright regions in the 2D histograms and may be relevant with the polytropic relationship that governs the plasma density and temperature fluctuations within plasma streamlines. We also observe that the histogram of log ( n ) and log ( T ) has many more similarities with the histogram of log ( n ) and log ( T ) than the histogram of log ( n ) and log ( T ) .
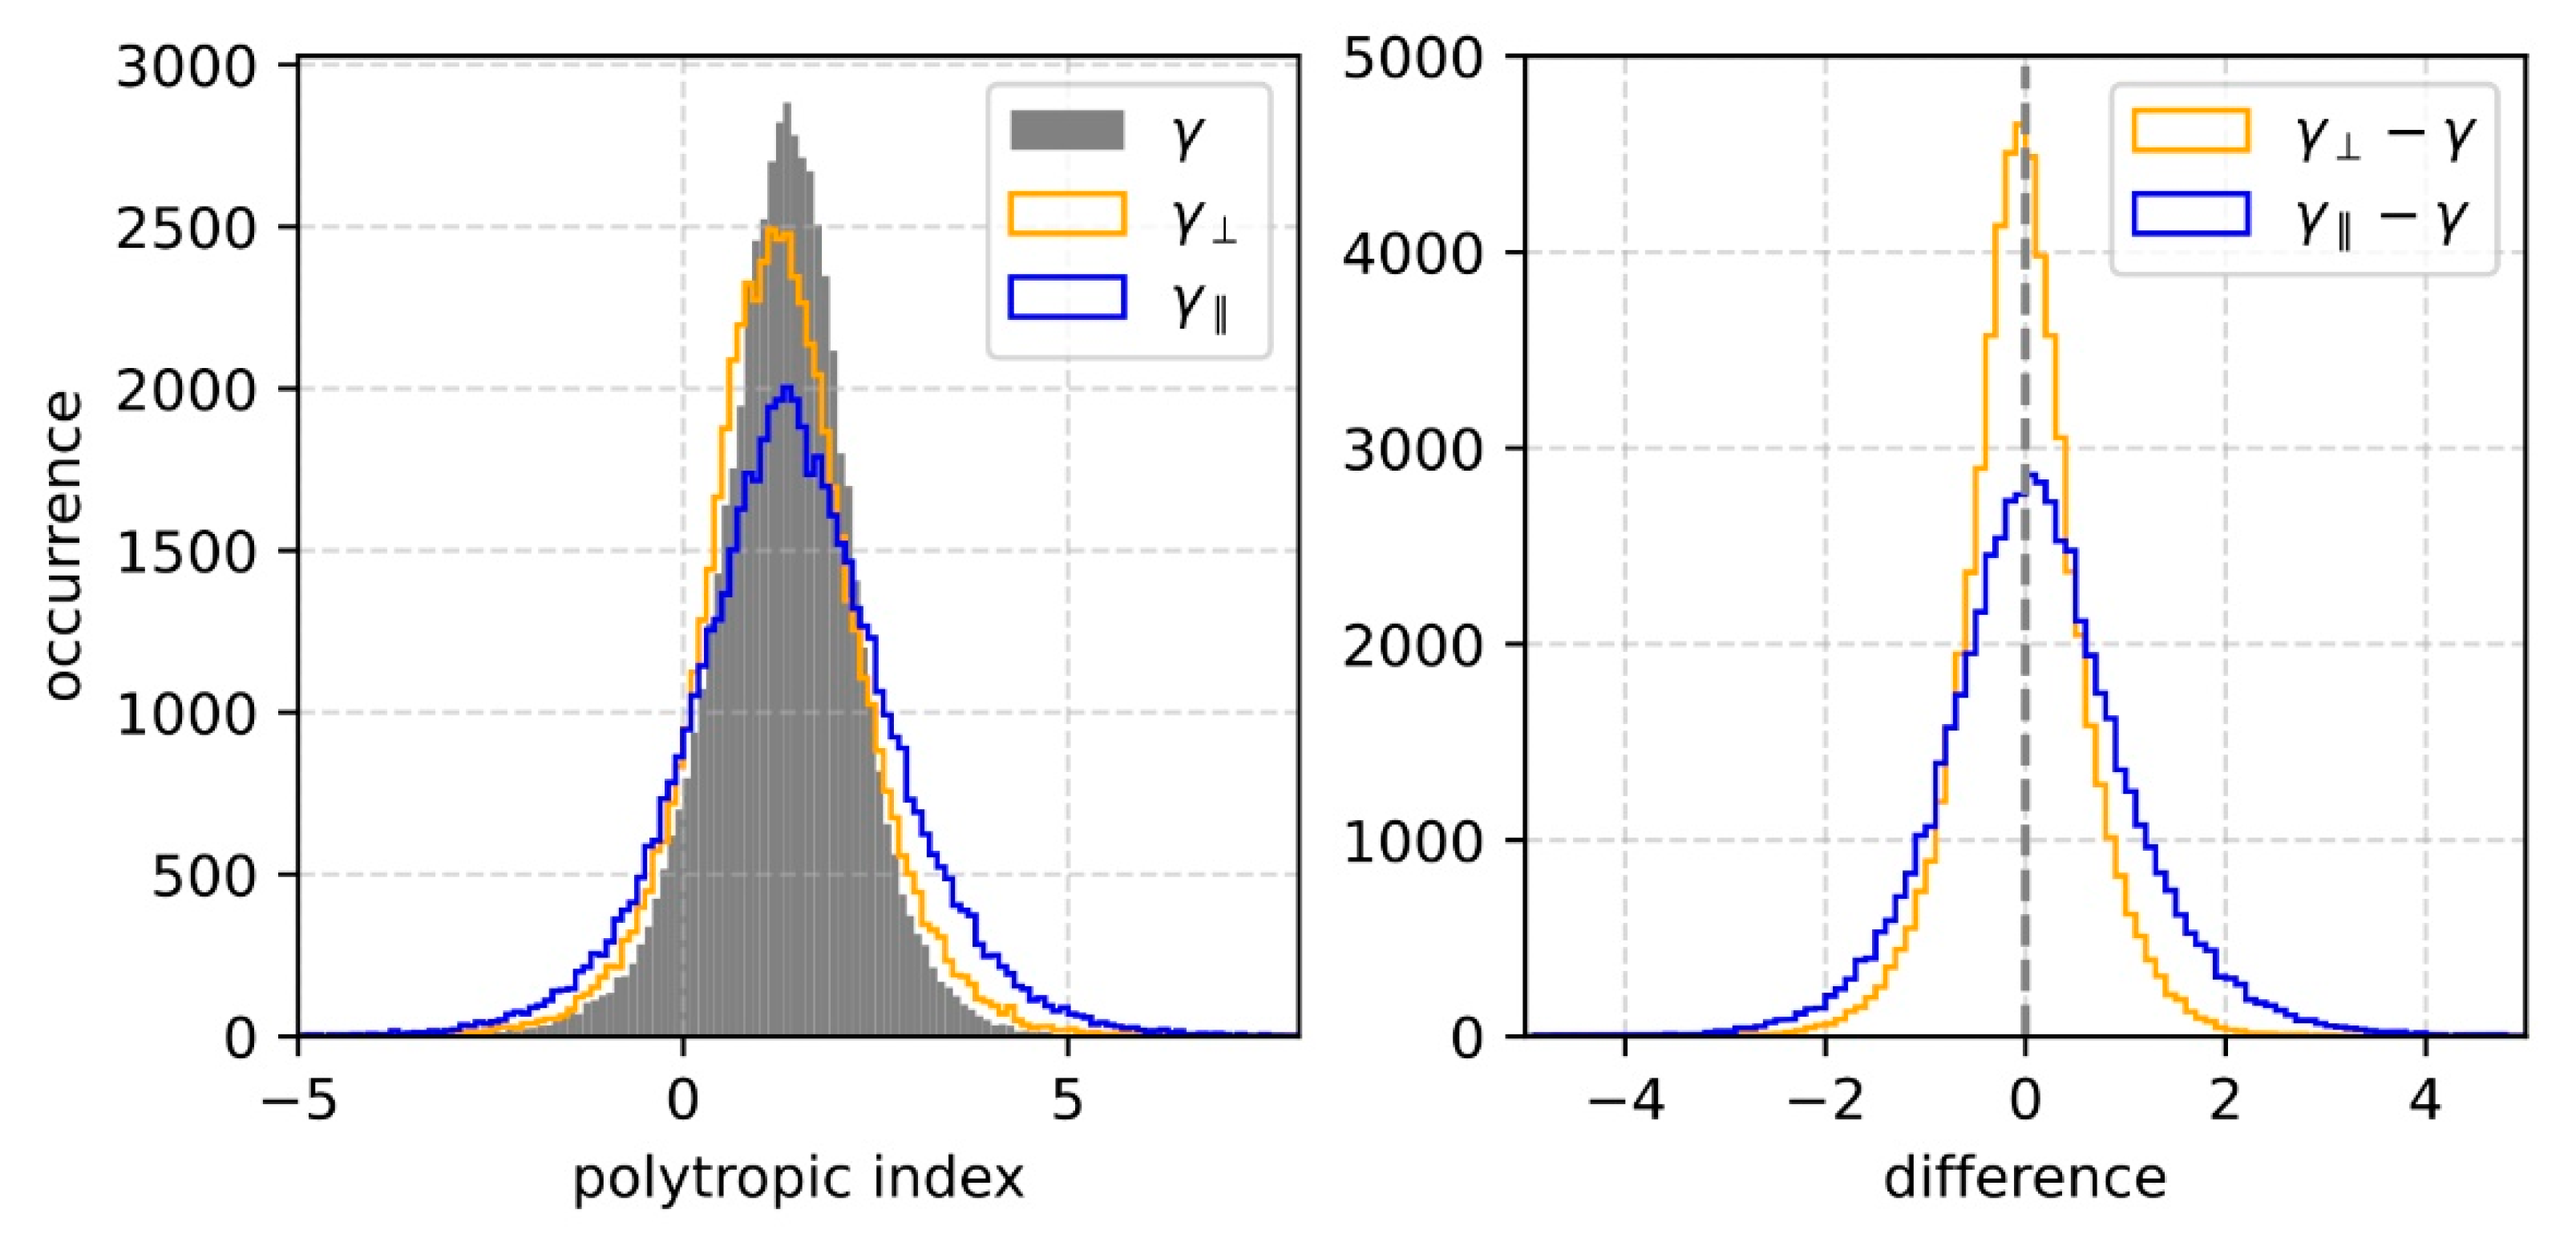
Following a similar technique as in [19,20,21,22,28,29], we determine γ by fitting the polytropic model to ln ( T ) vs. ln ( n ) observations within short-scale subintervals with small (<0.1) relative deviation of the Bernoulli integral. We further determine γ and γ from the slope of a linear fitting to ln ( T ) vs. ln ( n ) and ln ( T ) vs. ln ( n ) , respectively. The left panel of Figure 5 shows the histograms of γ , γ and γ as derived from the 1995 observations. The right panel shows the histograms of the differences γ γ and γ γ . Table 1 shows the mean and standard deviation values for each histogram. Our results suggest that the linear regression between either log ( T ) and log ( n ) , or log ( T ) and log ( n ) , in selected short intervals of solar wind protons at ~1 au, with a quasi-stable Bernoulli integral, can estimate the average actual value of γ . The derived γ is a better estimation of γ than γ . In the next section, we discuss our results in detail.

5. Discussion

We present analytical expressions of the relationships between log ( T ) , log ( T ) and log ( T ) . According to the analytical expressions, these relationships are linear for constant temperature anisotropy. Any anisotropy variations will affect the ordinate of the linear model. The ordinate of the linear model log ( T ) vs. log ( T ) is:
A = log ( 1 + 2 α 3 α ) ,
and we estimate its fluctuations, δ A , due to the anisotropy fluctuations δ α , by using the error propagation formula:
δ A = | ϑ A ϑ α | δ α = δ α α ( 2 α + 1 ) ln ( 10 )
Similarly, the ordinate of the linear model log ( T ) vs. log ( T ) is:
B = log ( 1 + 2 α 3 ) ,
with fluctuations:
δ B = 2 δ α ( 2 α + 1 ) ln ( 10 ) .
Finally, the ordinate of the model log ( T ) vs. log ( T ) is:
Γ = log ( α ) ,
with fluctuations:
δ Γ = δ α α ln ( 10 ) .
The proton plasma parameters we analyze here have a typical temperature anisotropy α ~0.8 (see Figure 2). For this anisotropy value, and according to Equations (10), (12) and (14), we find that δ A < δ B < δ Γ . This explains why the Pearson correlation coefficient is largest for log ( T ) vs. log ( T ) and smallest for log ( T ) vs. log ( T ) within the same plasma population we examine.
In Section 1, we show that the linear regression to log ( T ) vs. log ( n ) , or log ( T ) vs. log ( n ) data can derive the plasma polytropic index only if the temperature anisotropy is constant within the analyzed streamlines. Notably, [30] show that there is a specific relationship between the polytropic index and the temperature anisotropy. Here, we refer to general variations in a that could be statistical variations or measurement errors. If these fluctuations are significant within a streamline, the ordinate in the relationships log ( T ) vs. log ( n ) , and log ( T ) vs. log ( n ) exhibits significant fluctuations as well, and the relationships are not linear. According to Equations (7) and (8), and the propagation of errors, we find that the ordinate fluctuations in log ( T ) vs. log ( n ) are δ A , exactly as given in Equation (10). The ordinate fluctuations in log ( T ) vs. log ( n ) are δ B , given by Equation (12). Therefore, we expect that the linear fitting to log ( T ) vs. log ( n ) derives the polytropic index more accurately than the linear fitting to log ( T ) vs. log ( n ) . The 2D histograms of the plasma temperature and density in Figure 4 verify this expectation, showing that the relationship between log ( T ) and log ( n ) has many more similarities to the relationship between log ( T ) and log ( n ) than the relationship between log ( T ) and log ( n ) . This is not surprising, considering also the definition of T in Equation (1) and that the typical anisotropy value is 0.8, meaning that T ~ 0.8 T .
All three histograms in Figure 4 show evidence that the large-scale variations of the plasma density and temperature follow a linear model log ( T ) 2 log ( n ) . Newbury et al. [31] discuss the specific relationship which is apparent in the ambient solar wind and reflects the differences in the solar wind origins, and that it is not necessarily relevant to the solar wind expansion. On the other hand, the short-scale fluctuations of the scalar, perpendicular, and parallel temperature that we observe in the 2D histograms are positively correlated with the plasma density fluctuations. This positive correlation is possibly due to the polytropic behavior of the plasma protons within plasma streamlines.
We derive the polytropic index γ of the protons by analyzing short subintervals (<15 min) in 1995. Our analysis derives an average value γ ¯ ~1.3 and a standard deviation σ γ ¯ ~0.93. The analysis of [22] derives an average γ ~1.45 for the 1995 observations. The difference is possibly due to the different filters applied to the selected data and the duration of the analyzed subintervals. Finally, we derive the polytropic index by fitting a linear model to the fluctuations of T and T . The average polytropic index values we find with these regressions are γ ¯ ~1.26 and γ ¯ ~1.41, with standard deviations σ γ , ¯ ~1.08 and σ γ , ¯ ~1.39, respectively. Therefore, according to our statistical study, we derive similar (within ~0.1) average polytropic index values regardless of the temperature tensor element we use in our linear regression analysis. We infer that the anisotropic heating within the analyzed streamlines is not significant enough to prevent accurately calculating the average polytropic index of the solar wind plasma protons. We also find that σ γ ¯ < σ γ , ¯ < σ γ , ¯ , which is in agreement with the expected deviations from the linear model that we discuss above. We acknowledge that this result is based on the specific streamline selection criteria. For instance, if we analyze longer subintervals, we will accumulate larger anisotropy fluctuations within the analyzed data. That will reduce the accuracy of the polytropic indices that are calculated with either T or T instead of T.
Finally, we emphasize that our study focuses on solar wind protons at 1 au. It will be of a great interest to examine the same mechanism in solar wind electrons, or even in other solar wind ion species through the heliosphere. The recent ESA’s Solar Orbiter mission is determined to provide high-quality measurements of electron and heavy ion 3D VDFs. These measurements will be ideal to investigate the temperature anisotropy and the polytropic behavior of solar wind species. As has been recently shown by [22,32,33], studies of the polytropic behavior in space and astrophysical plasmas leads to important knowledge about the velocity distribution functions of the plasma particles and the potential energy acting on them.

6. Conclusions

In summary, we find that:
  • The long-term fluctuations of the proton temperature tensor elements are very well correlated in the slow solar wind at ~1au;
  • In fast solar wind protons, the scalar temperature is very well-correlated only with the perpendicular temperature;
  • Fittings to the fluctuations of proton density and any of the proton temperature tensor elements within short intervals (<15 min) derive, on average, very similar polytropic indices;
  • The perpendicular temperature derives the polytropic index more accurately than the parallel temperature does, which is expected considering the definition of the scalar temperature and the typical value of solar wind temperature anisotropy.

Author Contributions

Conceptualization, G.N.; methodology, G.N.; software, G.N.; validation, G.N. and G.L.; formal analysis, G.N.; investigation, G.N. and G.L.; resources, M.I.D.; data curation, G.N.; writing—original draft preparation, G.N.; writing—review and editing, G.N., G.L. and M.I.D.; visualization, G.N.; supervision, G.L. and M.I.D.; project administration, M.I.D.; funding acquisition, M.I.D. All authors have read and agreed to the published version of the manuscript.

Funding

This research was funded by NASA, Grant 80NSSC21K0112.

Institutional Review Board Statement

Not applicable.

Informed Consent Statement

Not applicable.

Data Availability Statement

The dataset we use in this study is publicly available at https://cdaweb.gsfc.nasa.gov/index.html (accessed on 19 May 2020).

Acknowledgments

G.N. thanks Daniel Verscharen and Robert T. Wicks for the helpful discussions.

Conflicts of Interest

The authors declare no conflict of interest.

References

  1. Gary, S.P. Theory of Space Plasma Microinstabilities; Cambridge University Press: Cambridge, UK, 1993. [Google Scholar]
  2. Marsch, E. Kinetic Physics of the Solar Wind. Living Rev. Sol. Phys. 2006, 3, 1. [Google Scholar] [CrossRef] [Green Version]
  3. Verscharen, D.; Klein, K.G.; Maruca, B.A. The multi-scale nature of the solar wind. Living Rev. Sol. Phys. 2019, 16, 5. [Google Scholar] [PubMed] [Green Version]
  4. Olsen, E.L.; Leer, E. A study of solar wind acceleration based on gyrotropic transport equations. J. Geophys. Res. 1999, 104, 9963–9973. [Google Scholar] [CrossRef]
  5. Nicolaou, G.; Wicks, R.T.; Livadiotis, G.; Verscharen, D.; Owen, C.J.; Kataria, D.O. Determining the bulk parameters of plasma electrons from pitch-angle distribution measurements. Entropy 2020, 22, 103. [Google Scholar] [CrossRef] [PubMed] [Green Version]
  6. Liu, Y.; Richardson, J.D.; Belcher, J.W.; Kasper, J.C. Temperature Anisotropy in a Shocked Plasma: Mirror-Mode instabilities in the Heliosheath. Astrophys. J. 2007, 659, L65. [Google Scholar] [CrossRef]
  7. Bader, A.; Stenberg Wieser, G.; André, M.; Wieser, M.; Futaana, Y.; Persson, M.; Nilsson, H.; Zhang, T.L. Proton Temperature Anisotropies in the Plasma Environment of Venus. J. Geophys. Res. 2019, 124, 3312–3330. [Google Scholar] [CrossRef] [Green Version]
  8. Hietala, H.; Drake, J.F.; Phan, T.D.; Eastwood, J.P.; McFadden, J.P. Ion temperature anisotropy across a magnetotail reconnection jet. J. Geophys. Res. 2015, 42, 7239–7247. [Google Scholar] [CrossRef] [Green Version]
  9. Case, A.W.; Kasper, J.C.; Stevens, M.L.; Korreck, K.E.; Paulson, K.; Daigneau, P.; Caldwell, D.; Freeman, M.; Henry, T.; Klingensmith, B.; et al. The Solar Probe Cup on the Parker Solar Probe. Astrophys. J. 2020, 246, 43. [Google Scholar] [CrossRef] [Green Version]
  10. Parker, E.N. Interplanetary Dynamical Processes; Wiley-Interscience: Hoboken, NJ, USA, 1963. [Google Scholar]
  11. Chandrasekhar, S. An Introduction to the Study of Stellar Structure; Dover Publications: New York, NY, USA, 1967. [Google Scholar]
  12. Bavassano, B.; Bruno, R.; Rosenbauer, H. Compressive fluctuations in the solar wind and their polytropic index. Annal. Geophys. 1996, 14, 510–517. [Google Scholar] [CrossRef]
  13. Kartalev, M.; Dryer, M.; Grigorov, K.; Stoimenova, E. Solar wind polytropic index estimates based on single spacecraft plasma and interplanetary magnetic field measurements. J. Geophys. Res. 2006, 111, A10107. [Google Scholar] [CrossRef]
  14. Arridge, C.S.; McAndrews, H.J.; Jackman, C.M.; Forsyth, C.; Walsh, A.P.; Sittler, E.C.; Gilbert, L.K.; Lewis, G.R.; Russell, C.T.; Coates, A.J.; et al. Plasma electrons in Saturn’s magnetotail: Structure, distribution and energisation. Planet. Space Sci. 2009, 57, 2032–2047. [Google Scholar] [CrossRef]
  15. Dialynas, K.; Roussos, E.; Regoli, L.; Paranicas, C.P.; Krimigis, S.M.; Kane, M.; Mitchell, D.G.; Hamilton, D.C.; Krupp, N.; Carbary, J.F. Energetic ion moments and polytropic index in Saturn’s magnetosphere using Cassini/MIMI measurements: A simple model based on κ-distribution functions. J. Geophys. Res. 2018, 123, 8066–8086. [Google Scholar] [CrossRef]
  16. Nicolaou, G.; McComas, D.J.; Bagenal, F.; Elliott, H.A. Properties of plasma ions in the distant Jovian magnetosheath using Solar Wind Around Pluto data on New Horizons. J. Geophys. Res. 2014, 119, 3463–3479. [Google Scholar] [CrossRef]
  17. Nicolaou, G.; McComas, D.J.; Bagenal, F.; Elliott, H.A.; Ebert, R.W. Jupiter’s deep magnetotail boundary layer. Planet. Space Sci. 2015, 111, 116–125. [Google Scholar] [CrossRef]
  18. Totten, T.L.; Freeman, J.W.; Arya, S. An empirical determination of the polytropic index for the free-streaming solar wind using Helios 1 data. J. Geophys. Res. 1995, 100, 13–17. [Google Scholar] [CrossRef]
  19. Nicolaou, G.; Livadiotis, G.; Wicks, R.T.; Verscharen, D.; Maruca, B.A. Polytropic Behavior of Solar Wind Protons Observed by Parker Solar Probe. Astrophys. J. 2020, 901, 26. [Google Scholar] [CrossRef]
  20. Nicolaou, G.; Livadiotis, G.; Moussas, X.D. Long-Term Variability of the Polytropic Index of Solar Wind Protons at 1 AU. Sol. Phys. 2014, 289, 1371–1378. [Google Scholar] [CrossRef]
  21. Livadiotis, G. Long-term independence of solar wind polytropic index on plasma flow speed. Entropy 2018, 20, 799. [Google Scholar] [CrossRef] [Green Version]
  22. Nicolaou, G.; Livadiotis, G. Long-term Correlations of Polytropic Indices with Kappa Distributions in Solar Wind Plasma near 1 au. Astrophys. J. 2019, 884, 52. [Google Scholar] [CrossRef]
  23. Elliott, H.A.; McComas, D.J.; Zirnstein, E.J.; Randol, B.M.; Delamere, P.A.; Livadiotis, G.; Bagenal, F.; Barnes, N.P.; Stern, A.S.; Young, L.A.; et al. Slowing of the Solar Wind in the Outer Heliosphere. Astrophys. J. 2019, 885, 156. [Google Scholar] [CrossRef]
  24. Livadiotis, G.; McComas, D.J.; Schwadron, N.A.; Funsten, H.O.; Fuselier, S.A. Pressure of the proton plasma in the inner heliosheath. Astrophys. J. 2013, 762, 134. [Google Scholar] [CrossRef]
  25. Livadiotis, G. Radial Profile of the Polytropic Index of Solar Wind Plasma in the Heliosphere. Res. Notes AAS 2021, 5, 4. [Google Scholar] [CrossRef]
  26. Lepping, R.P.; Acũna, M.H.; Burlaga, L.F.; Farrel, W.M.; Slavin, J.A.; Schatten, K.H.; Mariani, F.; Ness, N.F.; Neubauer, F.M.; Whang, Y.C.; et al. The WIND magnetic field investigation. Space Sci. Rev. 1995, 71, 207–229. [Google Scholar] [CrossRef]
  27. Kasper, J. Solar Wind Plasma: Kinetic Properties and Micro-Instabilities. Ph.D. Thesis, Massachusetts Institute of Technology, Cambridge, MA, USA, 2003. [Google Scholar]
  28. Nicolaou, G.; Livadiotis, G.; Wicks, R.T. On the Calculation of the Effective Polytropic Index in Space Plasmas. Entropy 2019, 21, 997. [Google Scholar] [CrossRef] [Green Version]
  29. Livadiotis, G.; Desai, M.I. Plasma-field coupling at small length scales in solar wind near 1 au. Astrophys. J. 2016, 829, 88. [Google Scholar] [CrossRef]
  30. Livadiotis, G.; Nicolaou, G. Relationship between polytropic index and temperature anisotropy in space plasmas. Astrophys. J. 2021, 909, 127. [Google Scholar] [CrossRef]
  31. Newbury, J.A.; Russel, C.T.; Lindsay, G.M. Solar wind polytropic index in the vicinity of stream interactions. Geophys. Res. Lett. 1997, 24, 1431–1434. [Google Scholar] [CrossRef]
  32. Livadiotis, G. On the Origin of Polytropic Behavior in Space and Astrophysical Plasmas. Astrophys. J. 2019, 874, 10. [Google Scholar] [CrossRef]
  33. Livadiotis, G. Using Kappa Distributions to Identify the Potential Energy. J. Geophys. Res. 2018, 123, 1050–1060. [Google Scholar] [CrossRef]
Figure 1. Time series of solar wind proton bulk parameters as measured by the Wind spacecraft in 1995. From top to bottom, we show the proton number density, speed, scalar temperature, temperature anisotropy, and the magnetic field.
Applsci 11 04019 g001
Figure 2. Two-dimensional histogram of log ( α ) and V, normalized to the maximum value in each column (V bin). The magenta line shows the most frequent (mode) value in each column. In the top panel, we show the 1D histogram of V; in the right panel, we show the 1D histogram of log ( α ) .
Applsci 11 04019 g002
Figure 3. (Left) log ( T ) as a function of log ( T ) ; (middle) log ( T ) as a function of log ( T ) ; and (right) log ( T ) as a function of log ( T ) for (top panels) slow solar wind with V < 500 kms−1 and (bottom panels) for fast solar wind with V > 500kms−1. In each panel, we show the corresponding Pearson correlation coefficients between the plotted parameters, and the red dashed line shows the identity function.
Applsci 11 04019 g003
Figure 4. Two-dimensional histograms of (left) log ( T ) and log ( n ) , (middle) log ( T ) and log ( n ) , and (right) log ( T ) and log ( n ) . The grey dashed lines show linear models with slopes -2.
Applsci 11 04019 g004
Figure 5. (Left) Histograms of (grey) the polytropic index γ , (orange) the index γ as calculated by a linear regression to log ( T ) and log ( n ) , and (blue) the index γ , which is calculated by the linear regression to log ( T ) and log ( n ) . (Right) Histograms of the differences (orange) γ γ and (blue) γ γ .
Applsci 11 04019 g005
Table 1. Mean values and standard deviations of the histograms in Figure 5.
γ ¯ σ γ ¯ γ ¯ σ γ ¯ , γ ¯ σ γ ¯ , γ γ ¯ σ ( γ γ ) ¯ γ γ ¯ σ ( γ γ ) ¯
1.300.931.261.081.411.39−0.040.620.110.97
Publisher’s Note: MDPI stays neutral with regard to jurisdictional claims in published maps and institutional affiliations.