Article

Reconstructing the Free Energy Profiles Describing the Switching Mechanism of a pH-Dependent DNA Nanodevice from ABMD Simulations

Department of Biology, Interuniversity Consortium, National Institute Biostructure and Biosystem (INBB), University of Rome Tor Vergata, Via della Ricerca Scientifica 1, 00133 Rome, Italy
*
Authors to whom correspondence should be addressed.
Appl. Sci. 2021, 11(9), 4052; https://doi.org/10.3390/app11094052
Submission received: 6 April 2021 / Revised: 26 April 2021 / Accepted: 27 April 2021 / Published: 29 April 2021

Abstract

:

Featured Application

Enhanced sampling molecular dynamics simulation methods for the design and refinement of functional DNA nanodevices.

Abstract

The pH-responsive behavior of six triple-helix DNA nanoswitches, differing in the number of protonation centers (two or four) and in the length of the linker (5, 15 or 25 bases), connecting the double-helical region to the single-strand triplex-forming region, was characterized at the atomistic level through Adaptively Biased Molecular Dynamics simulations. The reconstruction of the free energy profiles of triplex-forming oligonucleotide unbinding from the double helix identified a different minimum energy path for the three diprotic nanoswitches, depending on the length of the connecting linker and leading to a different per-base unbinding profile. The same analyses carried out on the tetraprotic switches indicated that, in the presence of four protonation centers, the unbinding process occurs independently of the linker length. The simulation data provide an atomistic explanation for previously published experimental results showing, only in the diprotic switch, a two unit increase in the pKa switching mechanism decreasing the linker length from 25 to 5 bases, endorsing the validity of computational methods for the design and refinement of functional DNA nanodevices.

Graphical Abstract

1. Introduction

The possibility to synthesize DNA sequences of any length and scale, the specificity of Watson–Crick base pairing and the possibility to introduce chemical modifications has led to the current use of DNA as an efficient nanoscale building material [1,2,3]. Indeed, DNA was exploited to build static three-dimensional structures, based on polyhedral geometries [4,5,6,7], as well as objects with complex shapes, mainly based on the DNA origami assembly technique [8,9,10,11]. DNA nanotechnology is now applied to solve real-world problems, developing functional and dynamic structures such as nanodevices and nanomachines [9,12,13,14,15,16]. One important application concerns biological sensing, where nanosensors have the potential to make simple, cheap, and fast the detection of specific biological materials [17,18,19,20]. DNA triplexes have drawn a lot of attention for their pH-dependent conformational changes, which can be integrated into complex nanomachines [21,22]. Using DNA triplexes as pH-sensitive locks, a selective, reversible and enantioselective control of reconfigurable chiral plasmonic metamolecules assembled by DNA origami was implemented [23]. Similarly, the Linko group designed a DNA origami nanocapsule equipped with DNA triple helix locks, which can be loaded with various types of molecular cargo and is able to switch between open and closed conformational states upon a pH change, and thus expose or protect the encapsulated molecules [24]. Recently, a O6-methyl-guanine (O6-MeG) modified triple helix-based nanoswitch was designed, with the ability to monitor the activity of DNA repair enzymes. [25]
In this context, the full understanding of the DNA triplex-based devices’ atomistic behavior represents an important aspect for a fine prediction of the rules governing their structure/dynamics/function relationship. In the last few years, we demonstrated the importance of Molecular Dynamics (MD) simulations coupled to experiments in describing and predicting the atomistic behavior of DNA nanoswitches [26,27] integrated into complex nanostructures [28]. Recently, it was experimentally shown that the pH-responsive behavior of a nucleic acid nanoswitch, which can form an intramolecular triplex structure through hydrogen bonds (Hoogsteen interactions) between a hairpin double helix (DH) and a single-strand triplex-forming oligo (TFO) with two protonation centers, strongly depends on the length of the linker connecting the two domains (Figure 1A) [29]. Furthermore, it has also been demonstrated that the linker-dependent modulation can be dissipated by the introduction of four protonation centers in the single stranded triplex-forming portion [29]. In this work, we apply Adaptively Biased Molecular Dynamics (ABMD) simulations to describe the effect of varying the length of the linker from 5 to 25 bases in regulating the pH-dependent conformational unbinding of the TFO from the DH, simulating three diprotic and three tetraprotic DNA nanoswitches. The results provide an atomistic depiction of the mechanism of unbinding, and they indicate that enhanced sampling techniques can be a valuable tool to rationally design the function of these devices, allowing a correct prediction of their real-world applications.

2. Materials and Methods

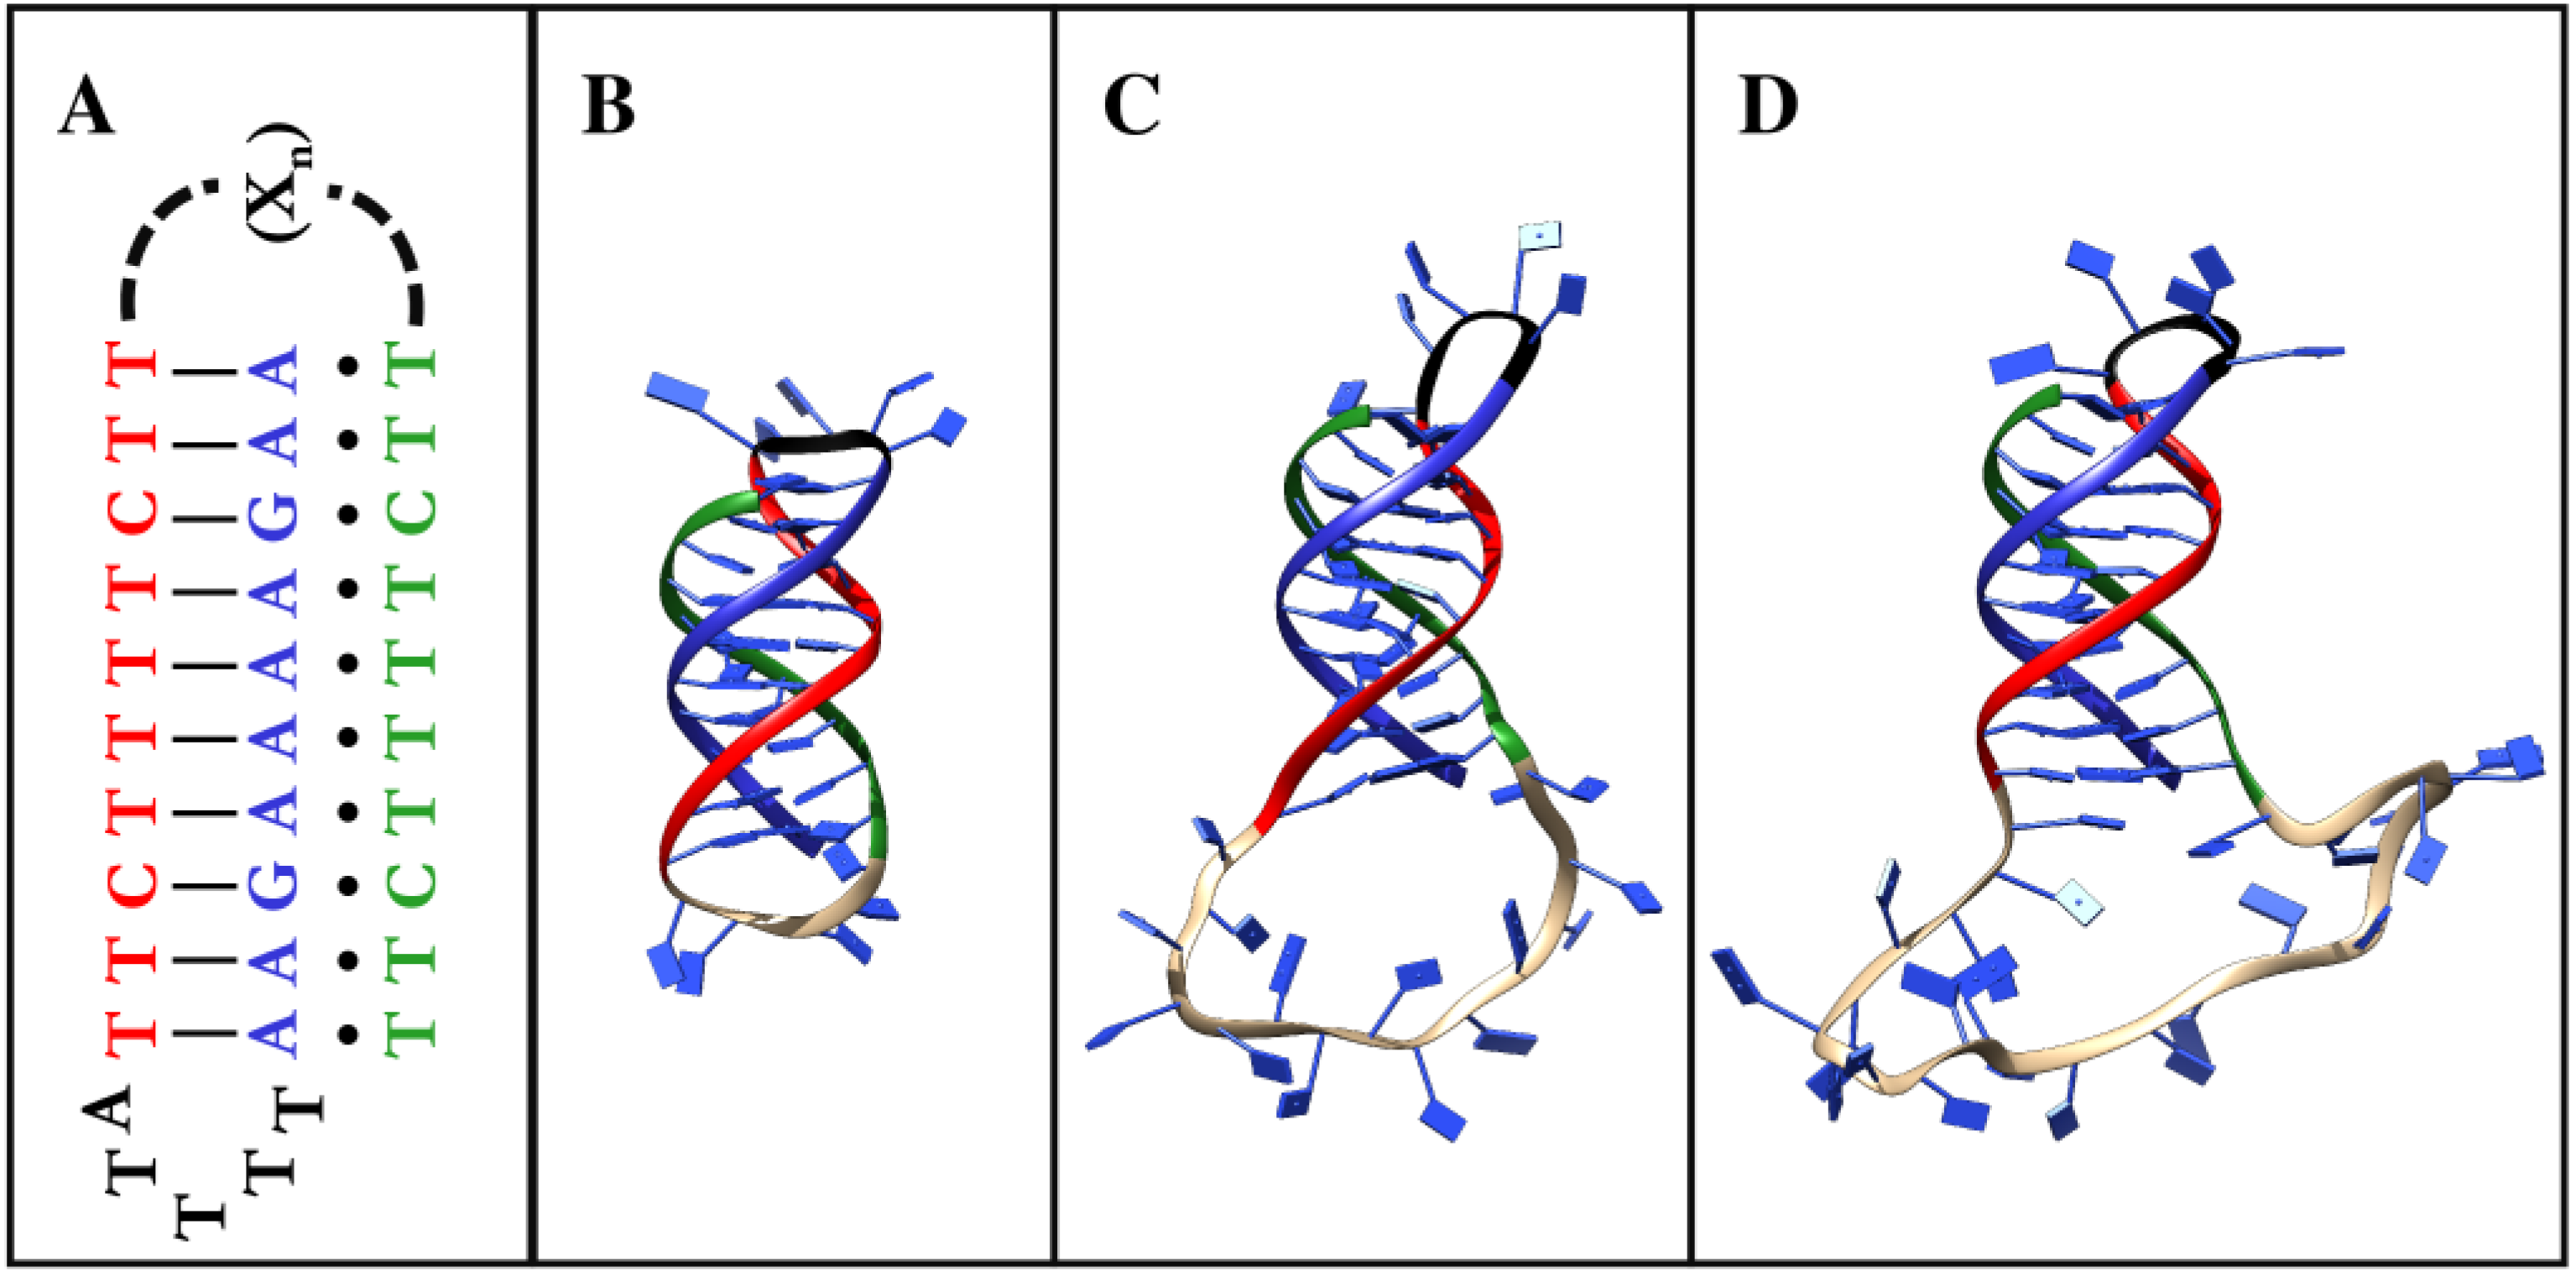
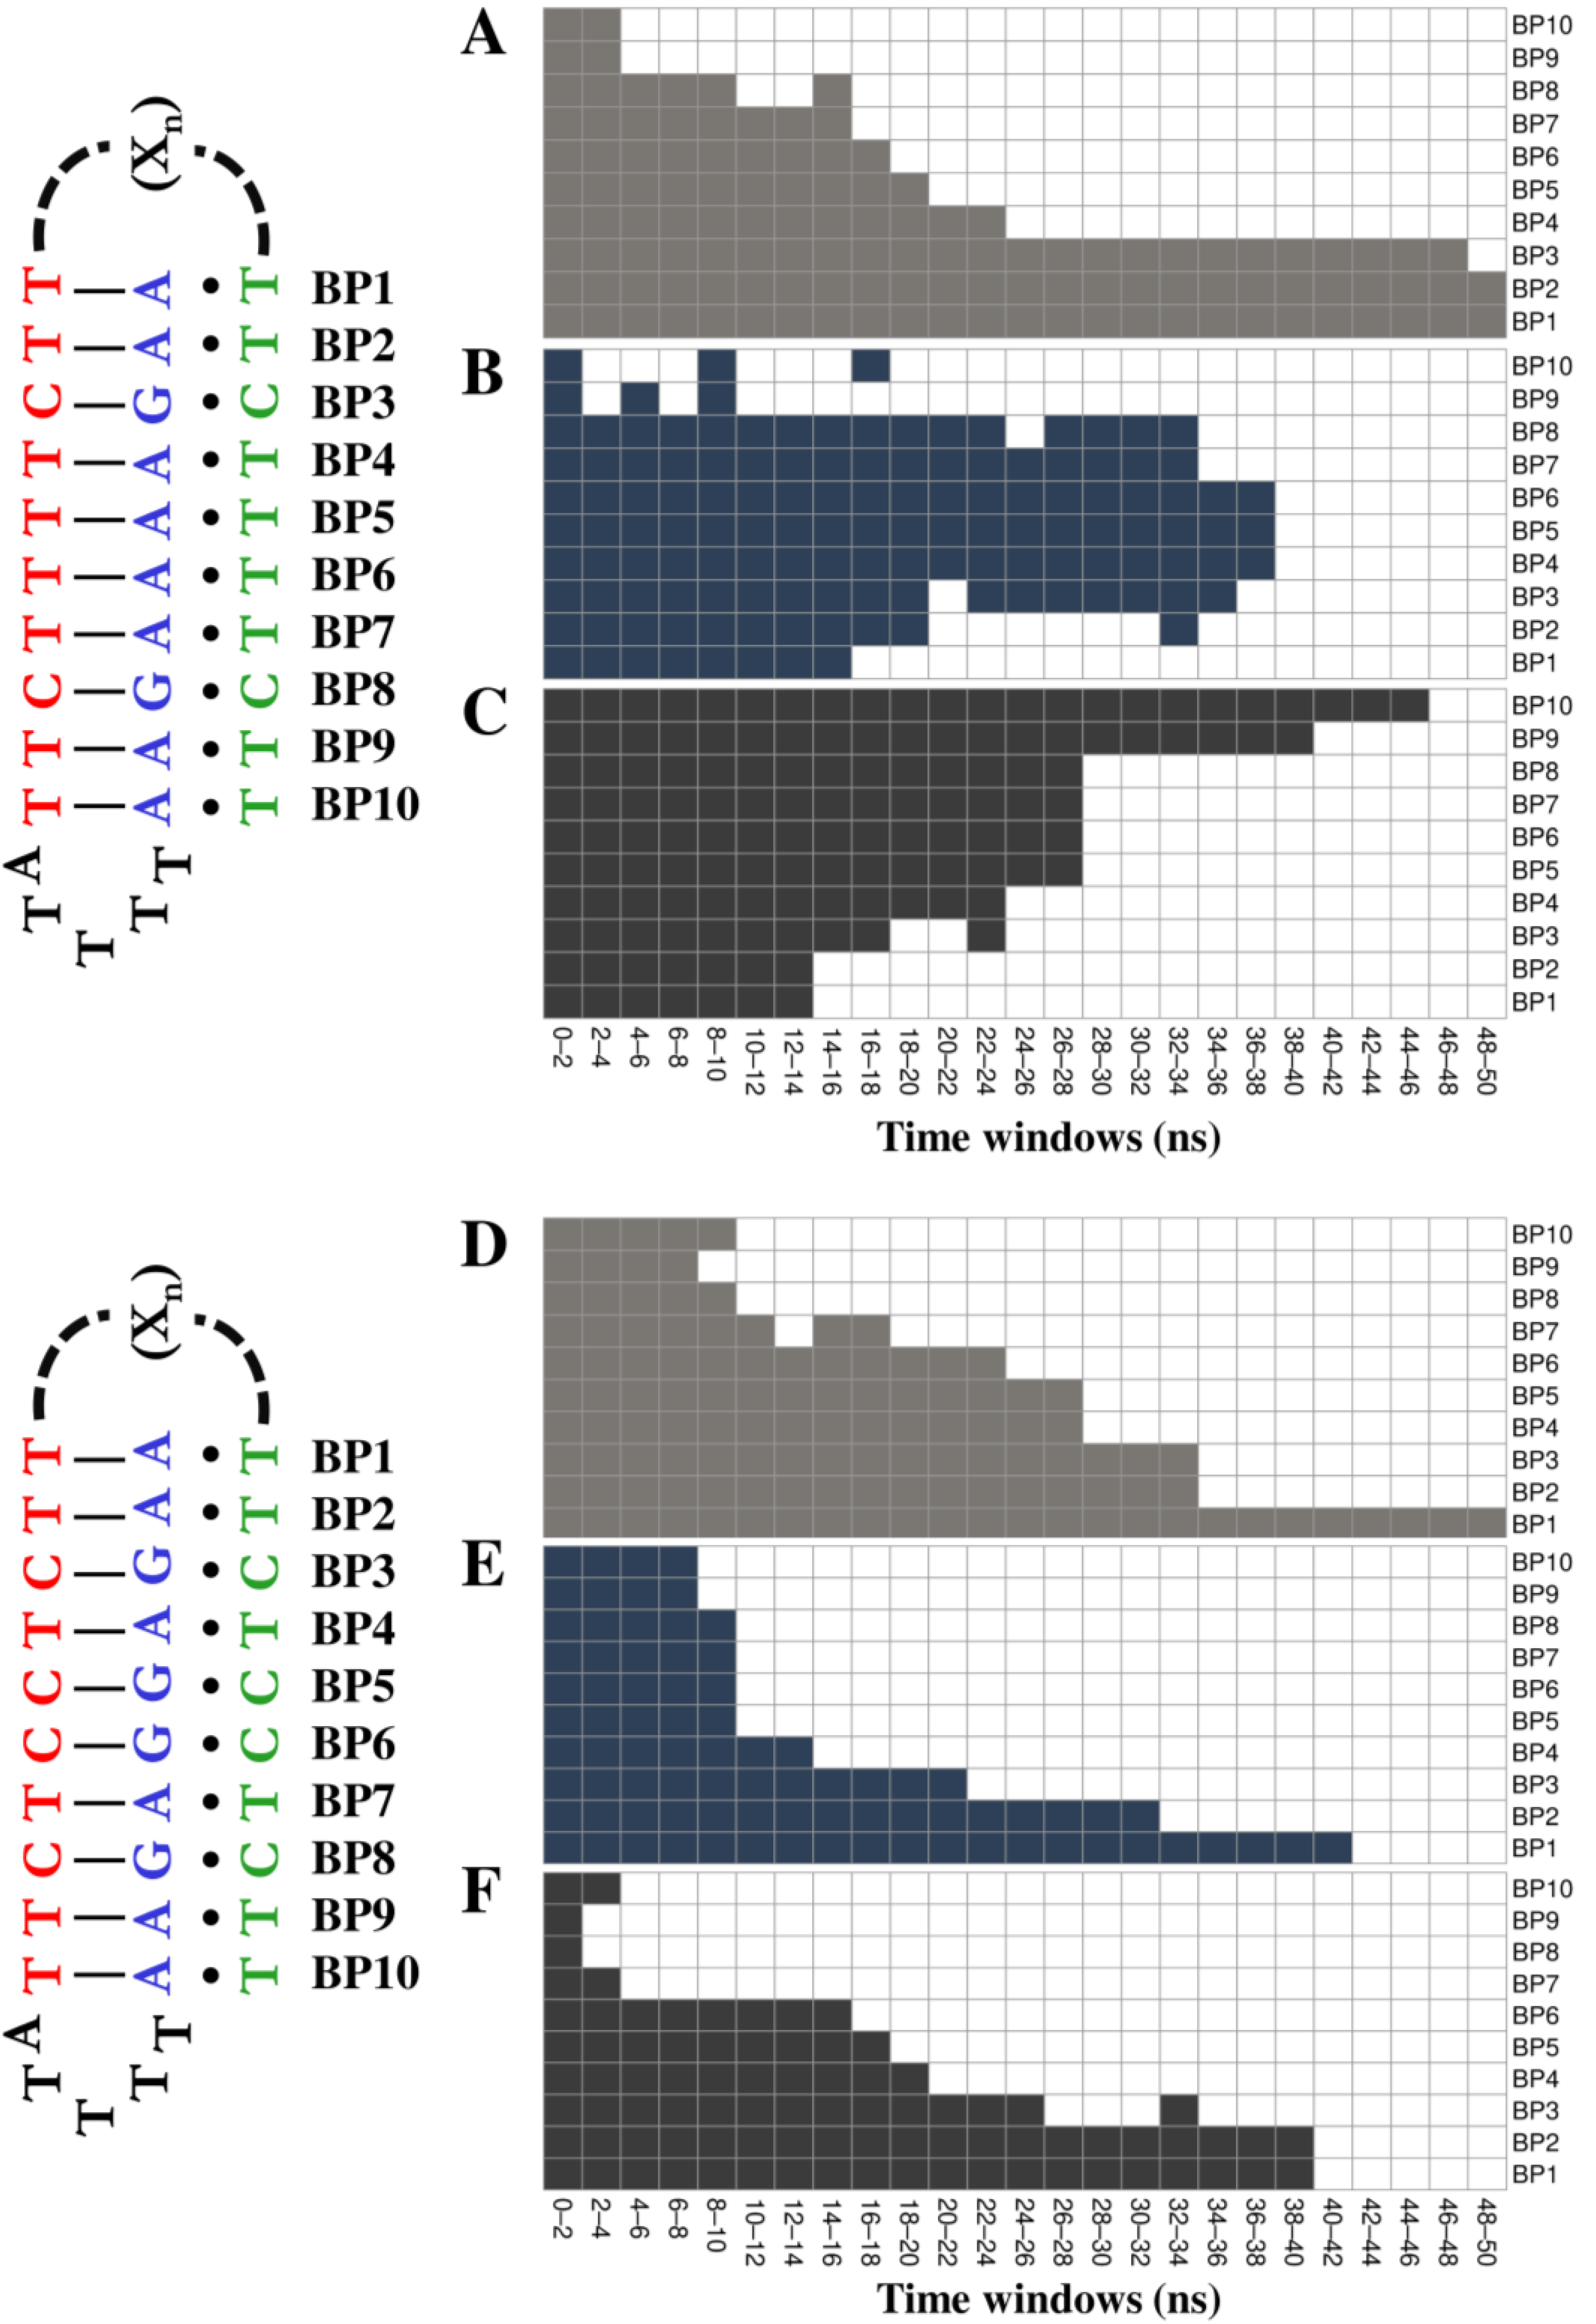
2.1. DNA Nanoswitch Modelling

The scheme of the six simulated diprotic or tetraprotic triplex-based nanoswitches is shown in Figure 1A and in Figure S1A of Supplementary Materials. The diprotic systems share the same three-dimensional structure, except for the loop connecting the DH to the TFO, which is composed of 5, 15 or 25 bases for the DIPRO5 (Figure 1B), DIPRO15 (Figure 1C) and DIPRO25 (Figure 1D) nanoswitches, respectively. The tetraprotic systems share the same structural features but contain four protonation centers in the TETRA5, TETRA15 and TETRA25 nanoswitches (Figure S1B–D of Supplementary Materials, respectively). The sequences used for the model building are identical to those reported in the experimental work [29], and are displayed here:
  • DIPRO5: AAGAAAAGAATTTTATTCTTTTCTTCTTTGTTCTTTTCTT
  • DIPRO15: AAGAAAAGAATTTTATTCTTTTCTTCTTTGGTTTGGTTTGTTCTTTTCTT
  • DIPRO25: AAGAAAAGAATTTTATTCTTTTCTTCTTTGGTTTGGTTTGGTTTGGTTTGTTCTTTTCTT
  • TETRA5: GAAGAAGGAATTTTACTTCTTCCTTCTTTGCTTCTTCCTT
  • TETRA15: GAAGAAGGAATTTTACTTCTTCCTTCTTTGGTTTGGTTTGCTTCTTCCTT
  • TETRA25: GAAGAAGGAATTTTACTTCTTCCTTCTTTGGTTTGGTTTGGTTTGGTTTGCTTCTTCCTT
The bases in bold indicate the duplex-forming regions (red and blue ribbons in Figure 1B–D and in Figure S1B–D of Supplementary Materials), the bases in italics represent the triplex-forming region (green ribbon in Figure 1B–D and in Figure S1B–D of Supplementary Materials), and the underlined bases represent the identical 5-base loop and the loop with a variable length (black and grey ribbons respectively in Figure 1B–D and in Figure S1B–D of Supplementary Materials). The three-dimensional structures of the six nanoswitches were built using the fiber and mutate_bases modules of the X3DNA package [31], which were used to independently produce a 10-base triple helix and the single strands representing the TFO and the loops. The PyMol sculpting module (PyMOL Molecular Graphics System, Version 2.0 Schrödinger, LLC; https://pymol.org, accessed on 3 March 2021) was used to connect the DNA fragments through phosphodiester bonds.

2.2. MD and ABMD Simulations

The topology and coordinate files of the six nanoswitches were generated using the tLeap module of the AmberTools program [32], parametrizing the structures through the AMBER parmbsc1 [33] force field, mimicking high pH values (i.e., deprotonated cytosines). The structures were placed into a rectangular box, solvated with TIP3P water molecules [34] and neutralized by adding Mg2+ ions, forcing a minimum distance between the structure and the box sides of 16 Å. For each structure, a minimization run of 500 steps using the steepest descent algorithm followed by 1500 steps of a conjugate gradient was performed in order to remove any unfavorable interaction. The systems were gradually heated from 0 to 300 K in the NVT ensemble over a period of 500 ps using the Langevin thermostat [35], applying a restraint of 0.5 kcal·mol−1·Å−2 on each nucleotide atom to relax the solvent. Through 1.0 ns-long equilibration runs, the restraint forces were gradually decreased to 0.1 kcal·mol−1·Å−2. The systems were simulated using an isobaric-isothermal (NPT) ensemble for 1.0 ns, setting the temperature to 300 K and the pressure to 1.0 atm using the Langevin barostat [36]. The SHAKE algorithm [37,38] was used to constrain the covalent bonds involving hydrogen atoms. The systems were then subjected to a 10.0 ns equilibration run before starting the ABMD simulations, with a time step of 2.0 fs, using the PME method [39] for long-range interactions and a cut-off of 9.0 Å for the short-range interactions.
The unbinding of the triplex-forming region of the equilibrated systems was simulated by means of 50.0 ns-long WT-ABMD simulations [40,41] using the NFE-toolkit of the Amber suite. ABMD enhances the sampling of the high-energy regions of the free energy surface (FES) by adding a biasing history-dependent term to the total energy of the system, obtained by the sum of the Gaussian hills laying on the subspace described by a set of user-defined collective variables (CVs). The most visited regions of conformational space (low free energy) are slowly filled and the biasing potential boosts the exploration of the less probable (high free energy) regions. The FES can be reconstructed at the end of the simulation as the sum of the added Gaussian hills using the nfe-umbrella-slice tool of the Amber suite. In the simulation, two CVs were used to describe the triplex-forming oligo unbinding from the duplex region: (1) the distance between the center of mass of the C2′ atoms of the nucleotides belonging to the duplex and that of the C2′ atoms belonging to the triplex-forming region; (2) the number of hydrogen bonds between the triplex-forming region and the nucleotides belonging to the duplex, using the coordination number (CN) CV as implemented in AMBER:
C N = i j 1 ( r i j r 0 ) 6 1 ( r i j r 0 ) 12
where r i and r j are the coordinates of the atoms involved in the hydrogen bond interactions. The value of the parameter r 0 was set to 3.2 Å, as calculated from the 10.0 ns MD equilibration. The data here obtained cannot be related to the TFO dissociation constant because a full sampling of the unbound state is required for to calculate Kd. However, the evaluated free energy difference between the transition state (Ts) and the bound state (B) represents an estimate of the ‘activation energy’ for the unbinding process and, therefore, is related to the different pH-dependent behavior of the switches.

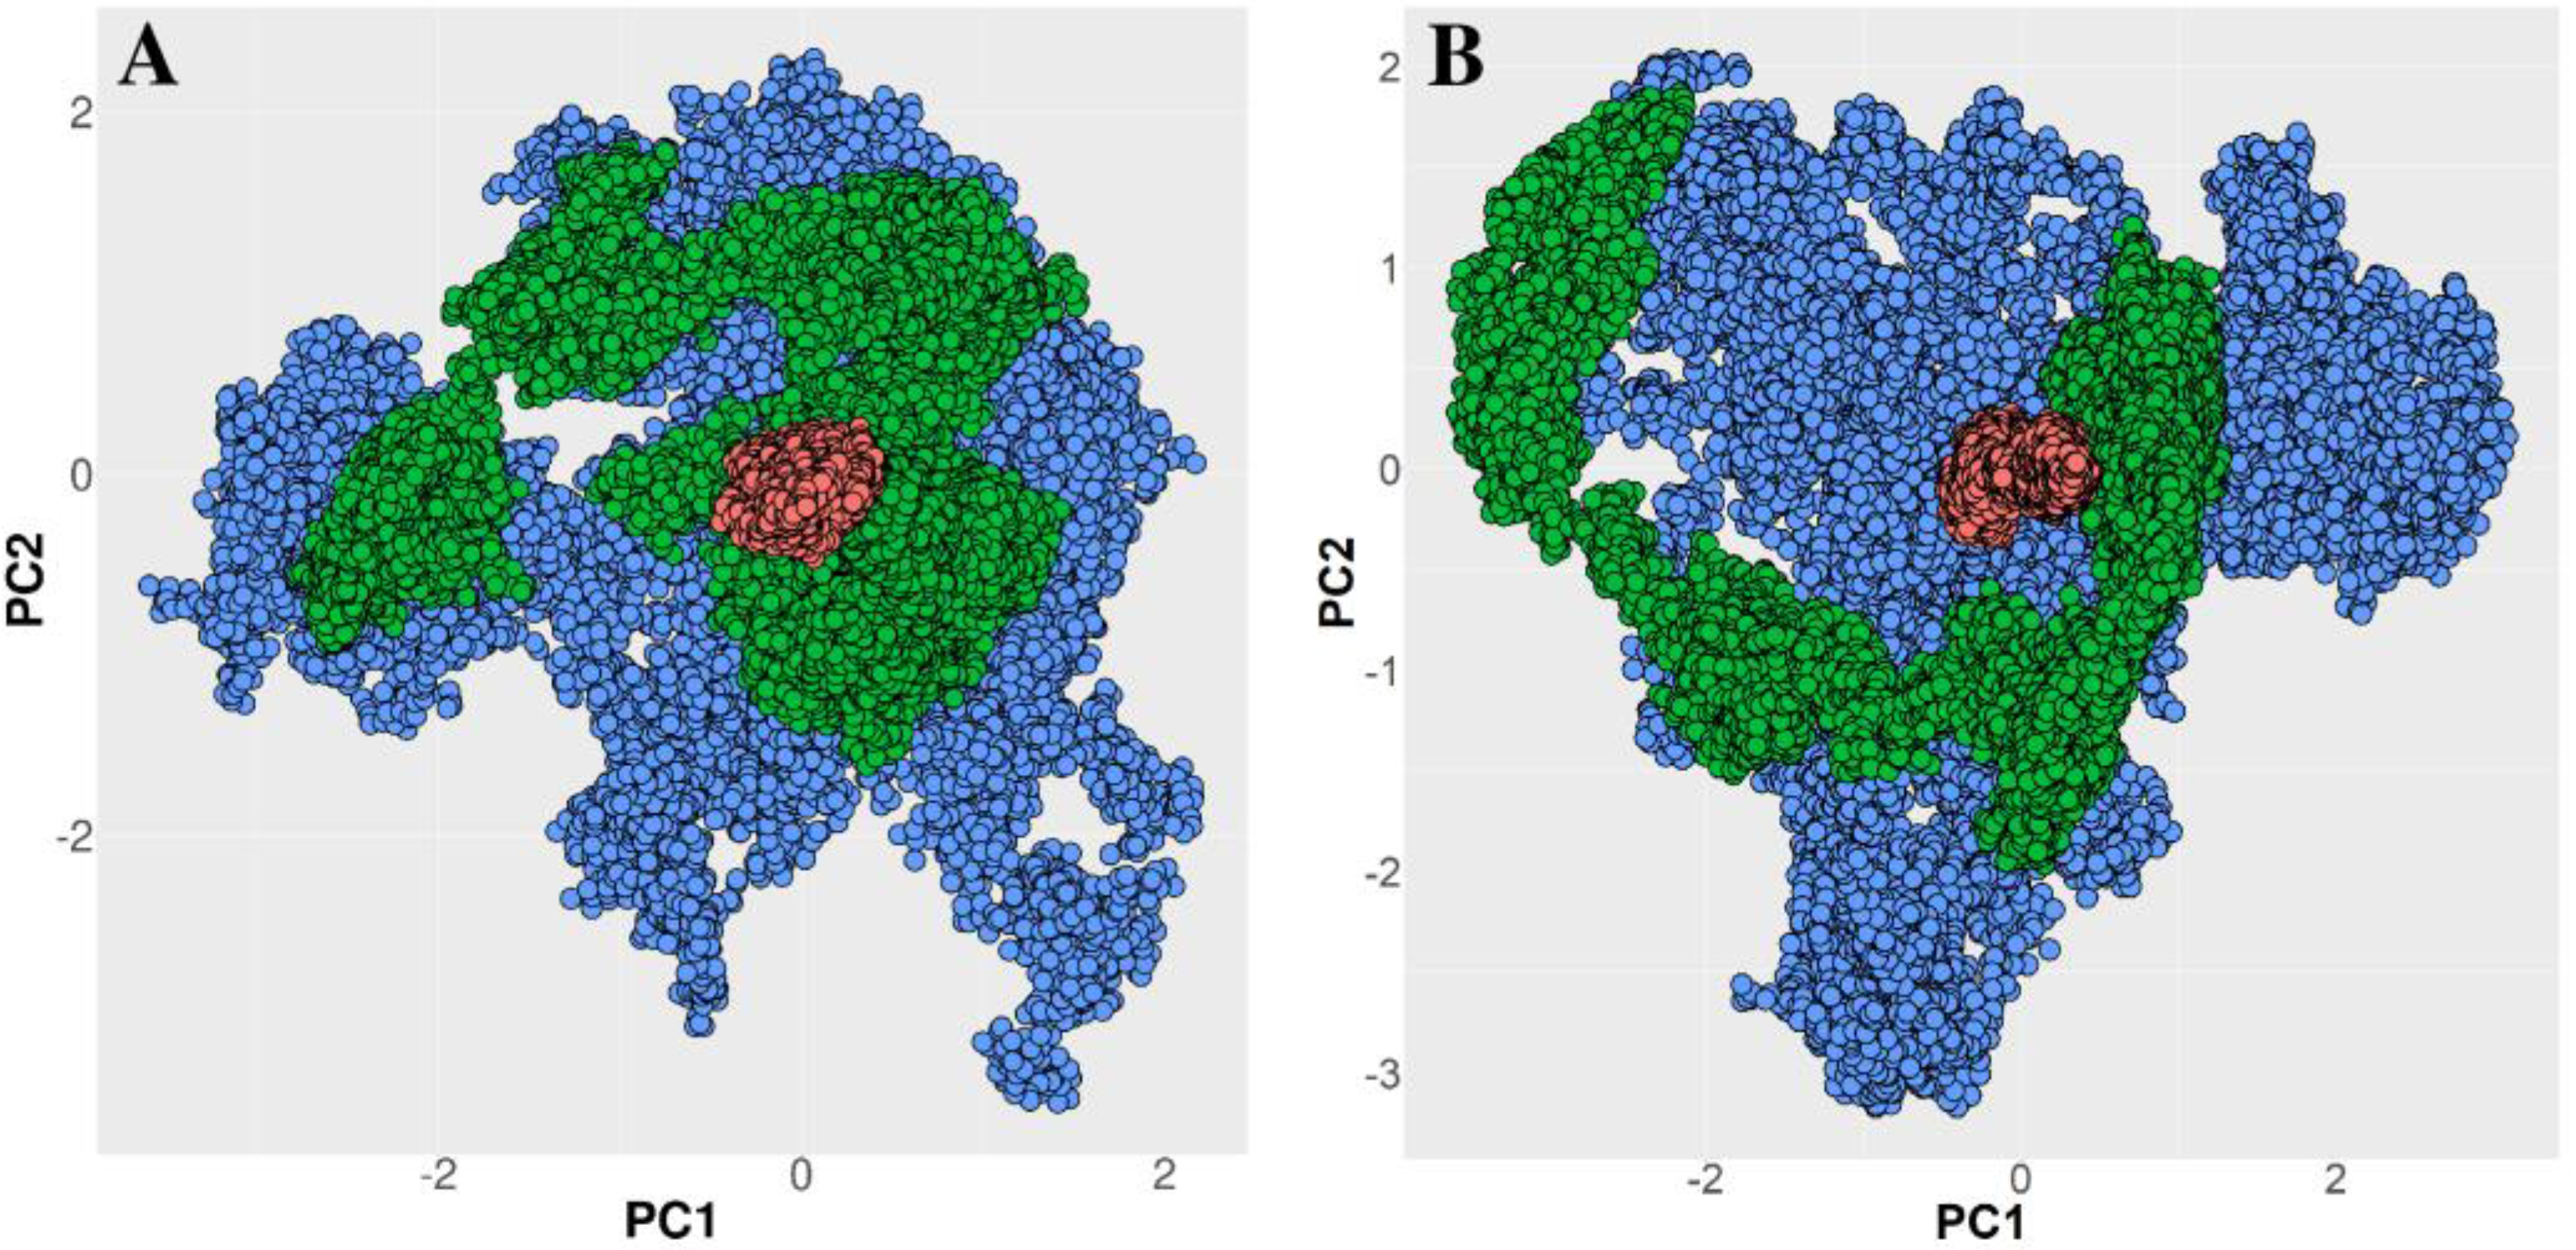
2.3. Trajectory Analyses

RMSF, principal component analyses (PCA), distance, and hydrogen bond percentages were calculated over the entire 50-ns ABMD trajectories using the GROMACS 2020.3 tools [42]. The hydrogen bond number was evaluated through the gmx hbond module, using an angle cut-off (hydrogen-donor-acceptor) of 180 ± 30° and a maximum donor-acceptor distance of 3.5 Å. Cluster analysis was performed through the gmx cluster module of GROMACS, applying the gromos algorithm [43] on all of the saved configurations. The DNA geometrical parameters were estimated using the CURVES+ program [44]. Contour plots in Figure 2 and Figure 3 were generated with the Matplotlib Python library [45]; the plots in Figure 4, Figure 5 and Figure 6 and Figure S2 were produced using R and the ggplot2 package [46], while the structures represented in Figure 1, Figure 2 and Figure 3 and Figure S1 were drawn with UCSF Chimera [30]. The analyses were performed using one node, for a total of 48 CPUs, on the CRESCO6 partition of the ENEA HPC cluster [47].

3. Results

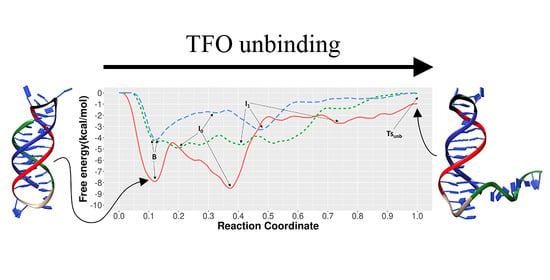
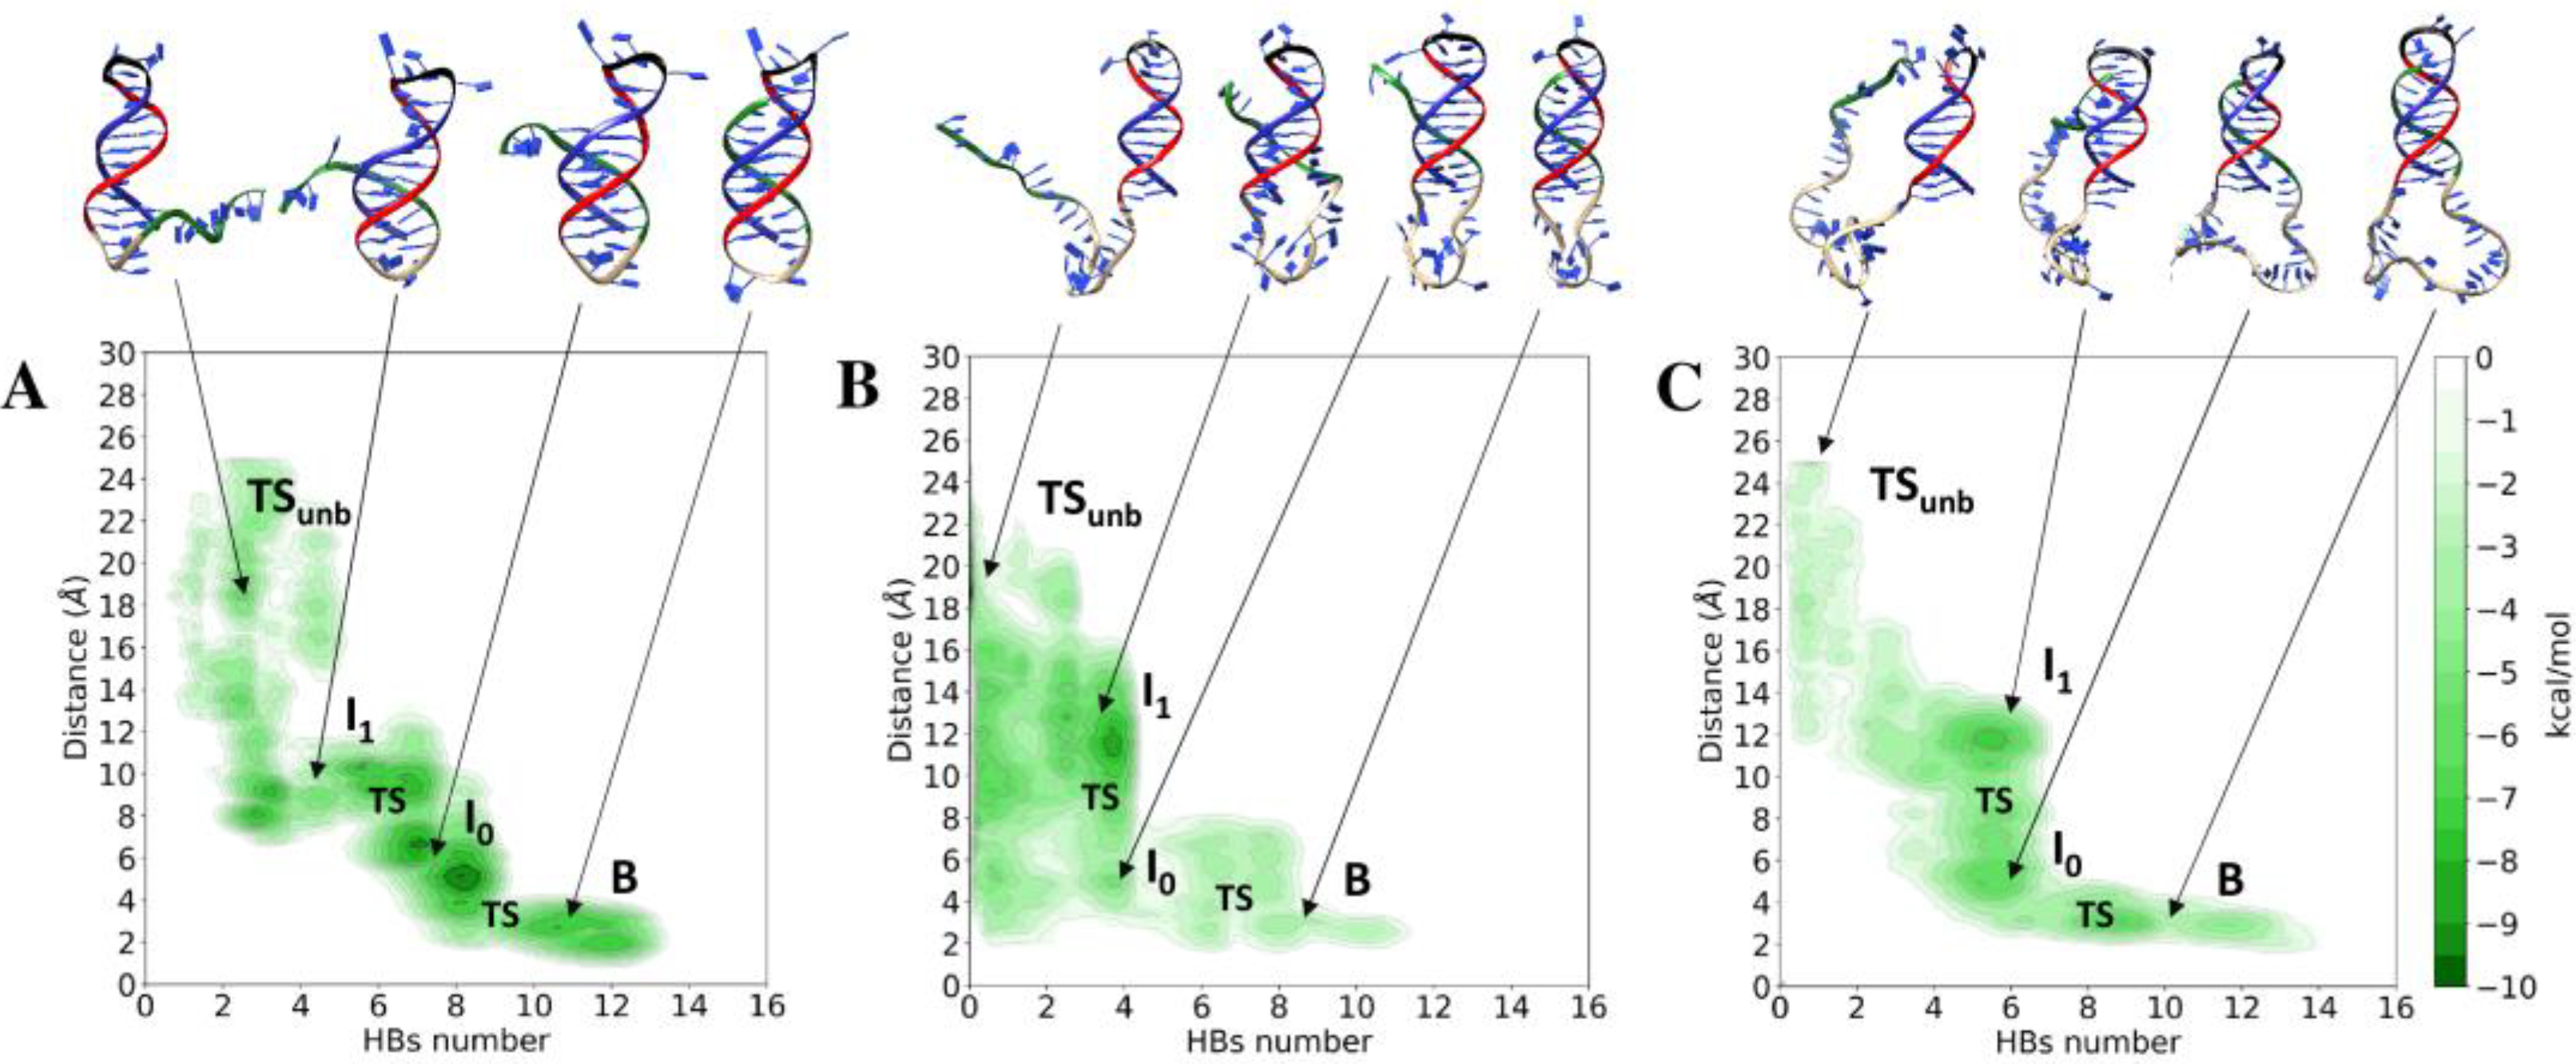
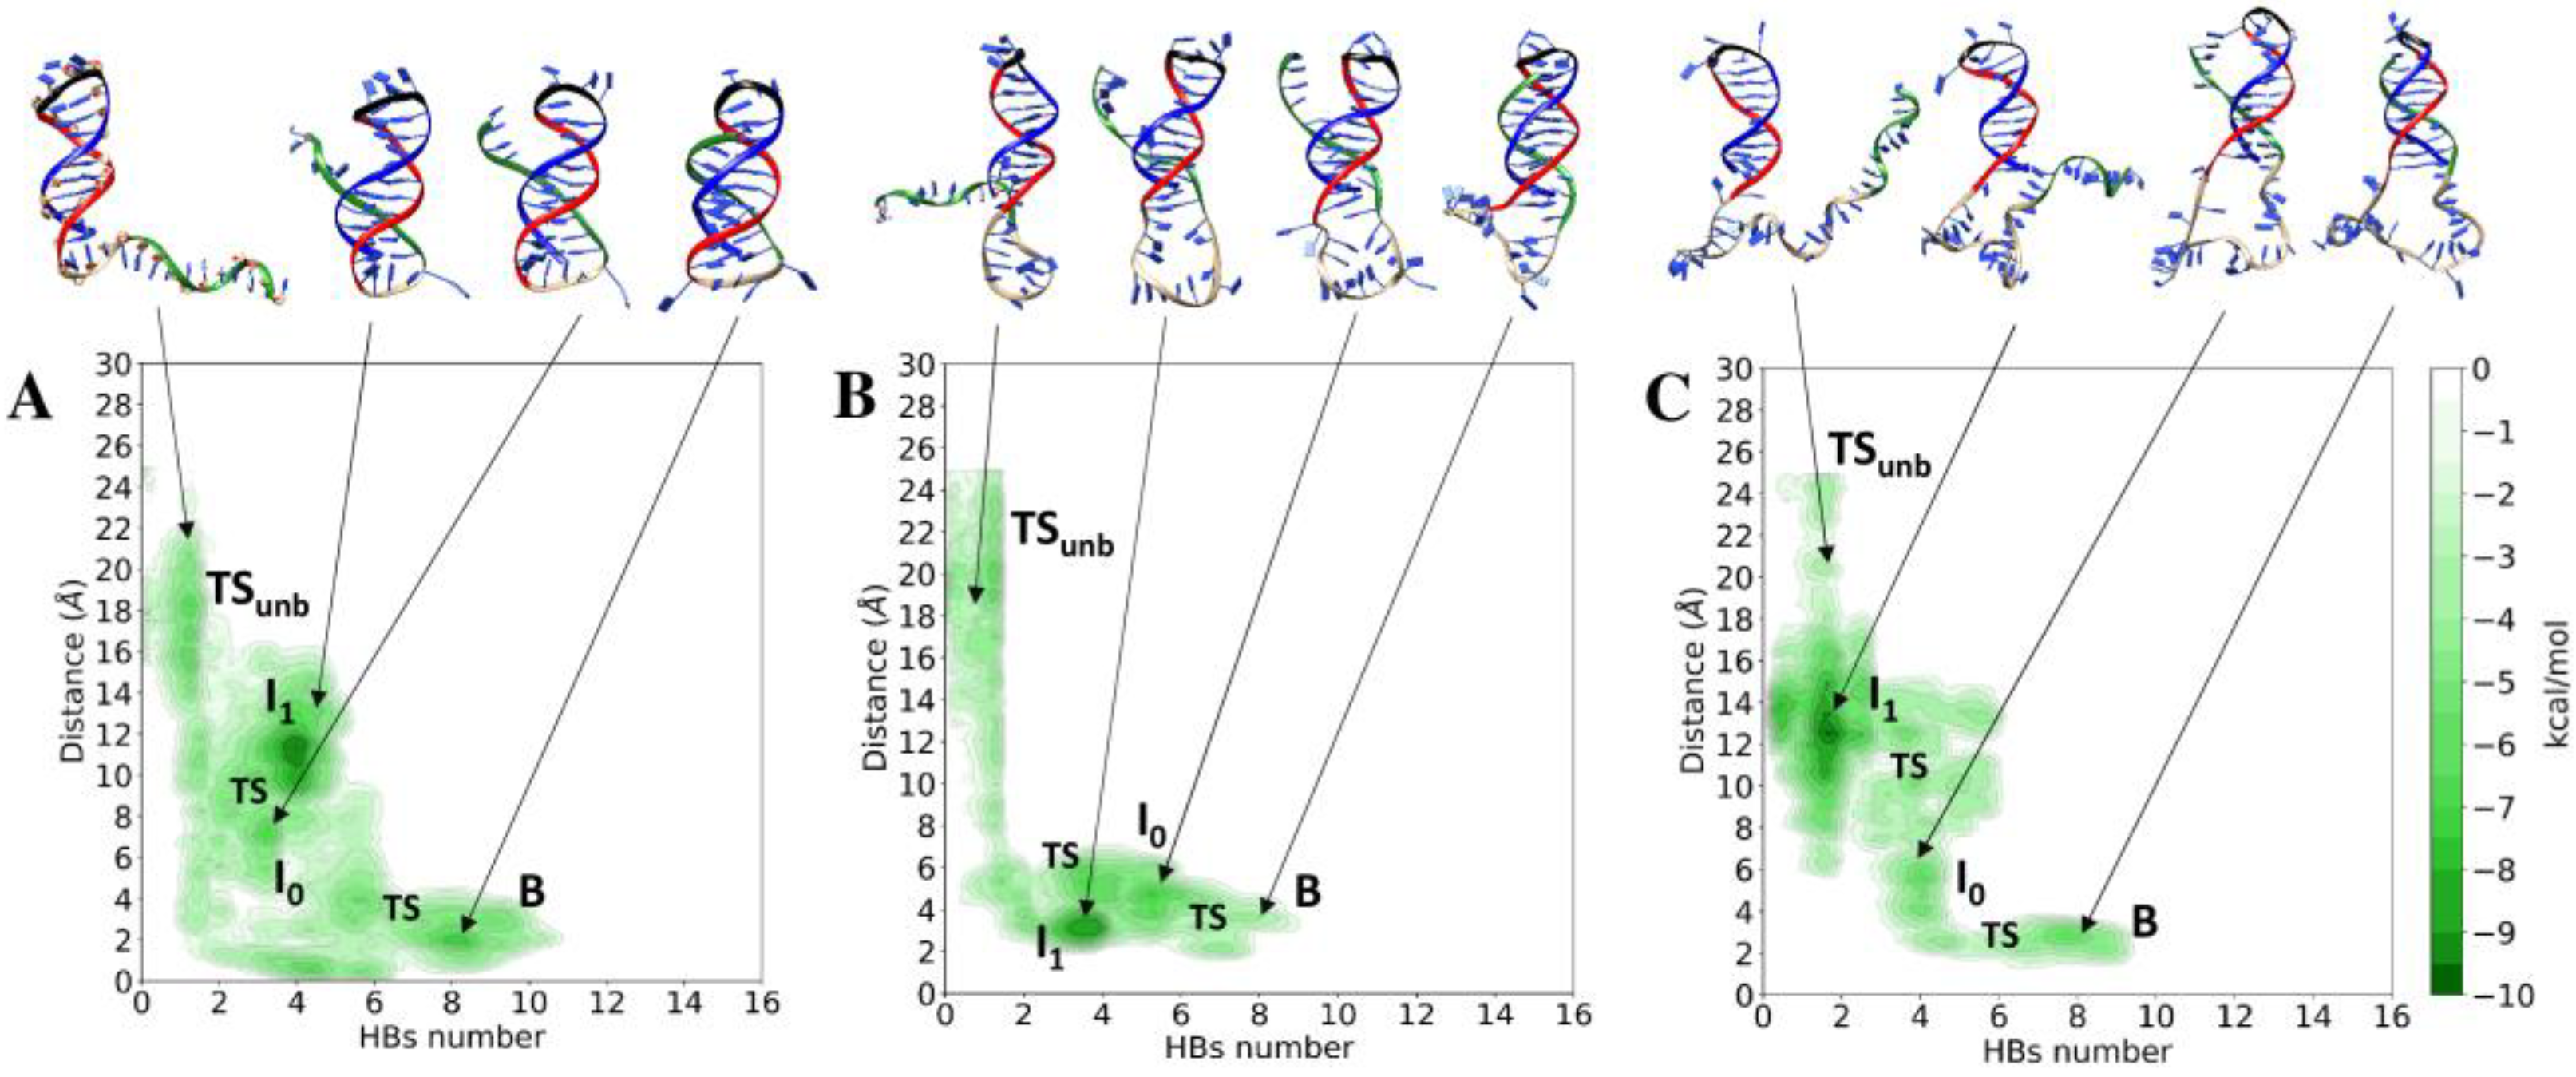
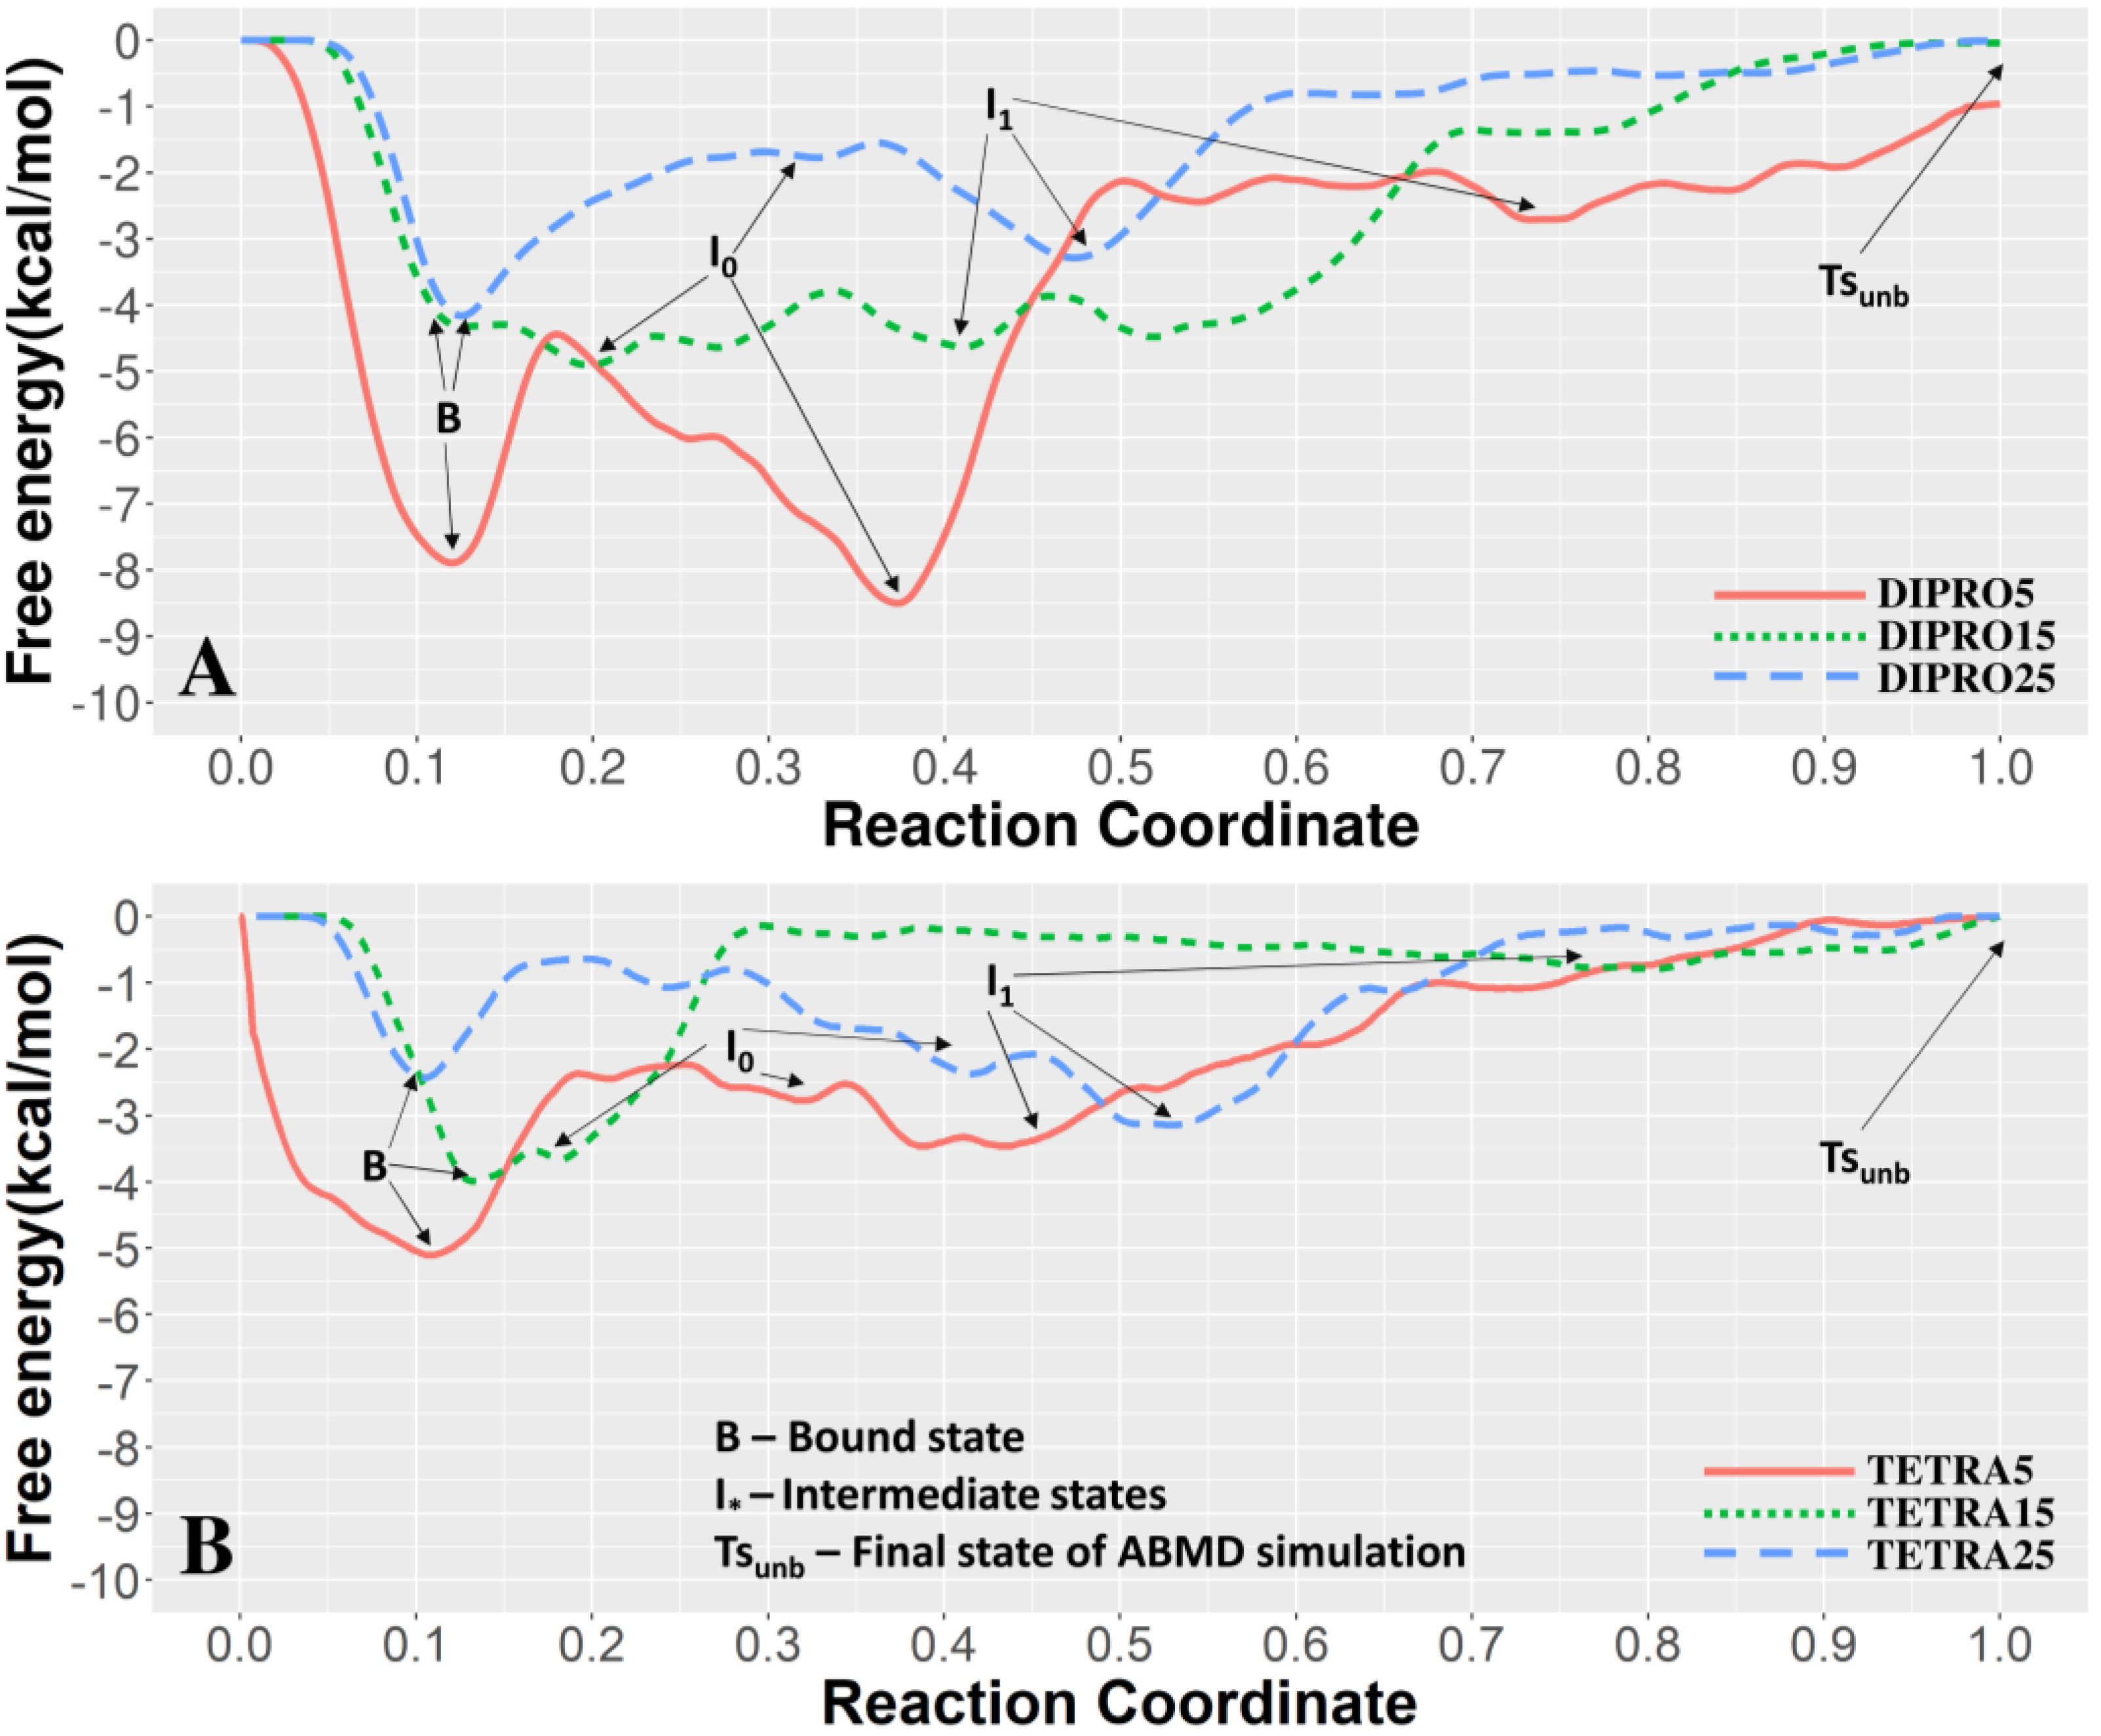
3.1. Unbinding of the TFO from the Double Helix

The TFO unbinding profile from the double helix was analyzed in terms of its free energy surface (FES) and plotted as a function of the number of hydrogen bonds (HBs) established between the TFO and the DH, and of the distance between their centers of mass, as reported in Figure 2 and Figure 3 for the diprotic and tetraprotic switches, respectively. For all of the six systems, the FES shows the presence of three minima corresponding to the bound state (B) and two intermediate (I0 and I1) states, separated by two transition states (Ts and Tsunb). In particular, the Tsunb state represents the final step of the ABMD simulations (Figure 2A–C or Figure 3A–C). For each analyzed structure, conformations belonging to the B, I and Tsunb states were clustered, and the representative structures are shown in the upper part of Figure 2A–C or Figure 3A–C.
For the DIPRO5 switch, the B state is stable, being characterized by the presence of 13–14 HBs and a distance between TFO and DH centers of mass close to 2 Å (Figure 2A). The I0 state has a lower number of HBs and an average TFO-DH distance of 6 Å (Figure 2A) due to the unbinding of three nucleotides at the 3′ end of the TFO. In the I1 state, the number of HB interactions is reduced to four, and in the final Tsunb state only two to three HBs are present. In fact, in the Tsunb state, the TFO is not fully detached because the first three bases at its 5′ end are still interacting with the DH. The per-base unbinding profile of the DIPRO5 switch, reported in Figure 4A, provides a clear view of the detaching mechanism described by the FES, showing the progressive loss of HBs from the 3′ to the 5′ end of the TFO. The DIPRO15 system shows the presence of less stable minima than those observed in the DIPRO5 one (Figure 2B). In detail, the B state shows the presence of 8–10 HBs, although the TFO is still quite close to the DH. The I0 state is similar to that of the DIPRO5 switch, showing the unbinding of the first three nucleotides at the TFO 3′ end. The I1 state samples several loose structures, showing a concurrent loss of three base pair interactions at both the 3′ and 5′ ends of the TFO (Figure 2B). Starting from this configuration, the Tsunb state is reached by an extensive sampling of a high-energy conformational basin, characterized by a TFO-DH distance of about 20 Å and the loss of all HBs (Figure 2B), indicative of a full unbinding of the TFO from the DH. The per-base unbinding profile of the DIPRO15 confirms the removal of the base-pair interactions at both the 3′and 5′ ends of the TFO, followed by the loss of the internal bases’ interactions, leading to the complete detachment of the TFO from the DH (Figure 4B). The DIPRO25 switch is the less stable one, being characterized by high-energy minima, with the B state easily evolving towards the I0 state (Figure 2C). In this case, the unbinding process of the TFO from the DH, as observed through the structures sampled in the I0 and I1 states and from the per-base unbinding profile in Figure 4C, follows an opposite path when compared to the DIPRO5 system because the detachment starts from the TFO 5′ end. The Tsunb state, identified by structures with a TFO-DH distance of 24–25 Å and characterized by a complete loss of HBs interactions, is reached through the sampling of a high-energy conformational basin (Figure 2C).
For all the tetraprotic switches, the B state is characterized by metastable high energy minima, which evolve towards the I0 and I1 states (Figure 3A–C) by sampling several conformations characterized by a rapid loss of HBs. The I1 states of these switches are characterized by low energy minima in which the bases at the 5′ end of the TFO are still interacting with the duplex. The Tsunb state, which is characterized by structures with a TFO-DH distance of 23–24 Å, and by a complete loss of HBs interactions, is reached through the sampling of a high-energy conformational basin, as observed for the diprotic switch (Figure 3A–C).
These observations are confirmed by the per-base unbinding profiles that are similar for all of the three tetraprotic switches, which are characterized by the removal of the base-pair interactions starting from the 3′ to the 5′ end of the TFO (Figure 4D–F), independently of the linker length.
A comparative free energy profile along a minimum energy path, as a function of a generalized reaction coordinate, is plotted in Figure 5A,B for the DIPRO and TETRA switches, respectively. The energy value of the B state for the DIPRO5 switch (Figure 5A red line) is two times lower than those observed for the DIPRO15 and DIPRO25 systems (Figure 5A green and blue lines, respectively). Moreover, the DIPRO5 B and I1 states are separated by a relatively high activation energy (Figure 5A, red line), again almost twice than that required for the TFO unbinding in the DIPRO15 and DIPRO25 systems (Figure 5A, green and blue lines, respectively). In the case of the TETRA5 (Figure 5B, red line), TETRA15 (Figure 5B, blue line) and TETRA25 switches (Figure 5B, green line), the energy values observed for the B state are half of those observed for the diprotic switches, with the I0 and I1 states separated by very low activation energies, which favour the transition towards the unbound states.
These data indicate that the length of the linker connecting DH with TFO has a crucial role in stabilizing the DH–TFO interaction only in the presence of two protonation sites. In this case, the DH–TFO interaction energy strongly decreases upon increasing the loop length, indicating that the entropic contribution related to the loop length has a direct effect on the TFO unfolding energy. This effect is not observed for the tetraprotic switches. It is interesting to note that the experimental results indicate a two unit increase in the pKa switching mechanism only for the diprotic system, when the linker length is reduced from 25 to 5 bases [29], in line with the simulative findings presented here.

3.2. Conformational Variability of the Linker and Stability of the Double Helix

The conformational variability of the linker region connecting the DH to TFO was evaluated through a PCA of the motion, carried out on the C2′ atom trajectories of the six systems. The projection of the loop C2′ atom trajectories on the plane defined by the first and second eigenvectors (Figure 6A,B for the diprotic and tetraprotic switches, respectively) indicates that the loop in the six systems samples a very different conformational space. In the case of the DIPRO5 and TETRA5 systems (red circles), the sampled landscape is highly restricted, while it increases for the DIPRO15 and TETRA15 systems (green circles) and attains the widest space for the DIPRO25 and TETRA25 switches (blue circles). The reduced sampling in the DIPRO5 system is in agreement with the need to provide more energy to this system in order to observe the TFO unbinding, and it is also in line with previous results obtained by simulating the unfolding of similar clamp-triplex nanoswitches with different linker lengths [27].
It is interesting to note that the different conformational variability of the loop does not affect the stability of the double helix portion of the switch in addition to its flexibility. In fact, the DH RMSF are identical for both the diprotic and tetraprotic switches (Figure S2A,B of Supplementary Materials, respectively), with the exception of the 5′ end of the DIPRO25 switch (pink line, Figure S2A of Supplementary Materials), demonstrating that the conformational variability of the loop does not have a destabilizing effect on the double helix. In line with these observations, the averaged geometrical parameters of the 10 base pairs forming the DH in the diprotic and tetraprotic switches, shown in Tables S1 and S2 of Supplementary Materials, are close to those of the standard B-DNA DH, confirming that the duplex geometry is maintained over all of the simulation time, independently of the linker length and protonation centers.

4. Conclusions

In this manuscript, we analyzed the effect of increasing the length of the variable loop integrated on three diprotic and three tetraprotic triple helix nanoswitches, using the same sequences experimentally characterized in a recent work [29]. The atomistic investigation, carried out through ABMD simulations, permitted us to finely describe the unbinding process of the TFO from the double helical portion of the nanoswitch. In detail, the analysis of the six trajectories identified a different TFO unbinding path for the diprotic switch, depending on the length of the variable loop, both in terms of the energy required to switch from the bound to unbound states (Figure 2 and Figure 4) and in terms of the per-base unbinding profile (Figure 5A). In fact, the DIPRO5 switch requires, for the TFO unbinding, more energy than the DIPRO15 and DIPRO25 ones (Figure 5A). Moreover, for the DIPRO5, the unbinding is incomplete because the bases directly connected to the variable loop continue to interact with the DH even in the final state (Figure 4A). Finally, the per-base unbinding profile is different following a 3′ to 5′ direction for the DIPRO5 and a 5′ to 3′ for the DIPRO25 one, while it concomitantly occurs at both the 3′ and 5′ ends of the TFO for the DIPRO15, demonstrating the importance to the loop length in modulating the mechanism. Analyzing the results obtained for the tetraprotic switches, we did not find differences in the per-base unbinding profiles (Figure 4B), and we observed only slight energy differences in the free energy profiles (Figure 5B), confirming that linker-dependent modulation is dissipated upon increasing the number of protonation centers in the TFO.
These results provide an atomistic explanation to the experimental results showing, for the TFO unbinding in the diprotic switches, a decrease of more than two units of the pKa increasing the linker length from 5 to 25 bases, whilst the pH-dependent switching mechanism—dependent on the linker length—is lost when the protonation centers are four. Interestingly, our data indicate that the presence of a longer variable loop does not destabilize the DH, as can be observed in Figure S2A,B and in Tables S1 and S2 of Supplementary Materials. This is an important point to ensure a correct functioning of the switch as a pH-sensing device, because a loss of the DH stability would not permit the reversibility of the pH-dependent switching process.
Computational approaches, such as enhanced sampling MD simulations, proved to be of fundamental importance for the design and tuning of the functional properties of DNA nanoswitches. Software like mfold [48] or NUPACK [49], although allowing the prediction of the thermodynamics of Watson–Crick interactions, are unable to predict the behaviour of DNA nanodevices characterized by the presence of non-canonical interactions or sequence-independent effects. Therefore, the use of complex and advanced simulation techniques has become an essential tool in the field of DNA nanotechnology, which is also thanks to the reduced computational time required to perform MD simulations due to the improvement of the available workstations.

Supplementary Materials

The following are available online at https://www.mdpi.com/article/10.3390/app11094052/s1. Figure S1: Schematic and cartoon representations of the simulated tetraprotic DNA nanoswitches; Figure S2: Per-nucleotide RMSF values calculated for the DH of the six DNA nanoswitches; Table S1: DNA DH geometrical parameters calculated for the diprotic switches; Table S2: DNA DH geometrical parameters calculated for the tetraprotic switches.

Author Contributions

Conceptualization, F.I. and A.D.; methodology, A.R. and F.I.; validation, F.I., A.D. and M.F.; formal analysis, A.R. and F.I.; writing—original draft preparation, F.I., A.D. and M.F.; writing—review and editing, F.I., A.D., A.R., M.F.; supervision, F.I and A.D. All authors have read and agreed to the published version of the manuscript.

Funding

This research received no external funding.

Institutional Review Board Statement

Not applicable.

Informed Consent Statement

Not applicable.

Data Availability Statement

Not applicable.

Acknowledgments

The authors thank the NVIDIA Corporation for the donation of a TITAN XP to A.D., on which the simulations were carried out. The computing resources and the related technical support used for this work were provided by CRESCO/ENEAGRID High Performance Computing infrastructure and its staff [47]. CRESCO/ENEAGRID High Performance Computing infrastructure is funded by ENEA, the Italian National Agency for New Technologies, Energy and Sustainable Economic Development, and by Italian and European research programs: see http://www.cresco.enea.it/english for information.

Conflicts of Interest

The authors declare no conflict of interest.

References

  1. Chidchob, P.; Sleiman, H.F. Recent advances in DNA nanotechnology. Curr. Opin. Chem. Biol. 2018, 46, 63–70. [Google Scholar] [CrossRef] [PubMed]
  2. DeLuca, M.; Shi, Z.; Castro, C.E.; Arya, G. Dynamic DNA nanotechnology: Toward functional nanoscale devices. Nanoscale Horiz. 2020, 5, 182–201. [Google Scholar] [CrossRef]
  3. Keller, A.; Linko, V. Challenges and Perspectives of DNA Nanostructures in Biomedicine. Angew. Chem. Int. Ed. Engl. 2020. [Google Scholar] [CrossRef] [Green Version]
  4. Andersen, F.F.; Knudsen, B.; Oliveira, C.L.P.; Frøhlich, R.F.; Krüger, D.; Bungert, J.; Agbandje-McKenna, M.; Mckenna, R.; Juul, S.; Veigaard, C.; et al. Assembly and structural analysis of a covalently closed nano-scale DNA cage. Nucleic Acids Res. 2008, 36, 1113–1119. [Google Scholar] [CrossRef]
  5. Bhatia, D.; Mehtab, S.; Krishnan, R.; Indi, S.S.; Basu, A.; Krishnan, Y. Icosahedral DNA nanocapsules by modular assembly. Angew. Chem. Int. Ed. 2009, 48, 4134–4137. [Google Scholar] [CrossRef]
  6. Alves, C.; Iacovelli, F.; Falconi, M.; Cardamone, F.; Morozzo della Rocca, B.; de Oliveira, C.L.P.; Desideri, A. A Simple and Fast Semiautomatic Procedure for the Atomistic Modeling of Complex DNA Polyhedra. J. Chem. Inf. Model. 2016, 56, 941–949. [Google Scholar] [CrossRef] [PubMed]
  7. Zimmermann, J.; Cebulla, M.P.J.; Mönninghoff, S.; von Kiedrowski, G. Self-Assembly of a DNA Dodecahedron from 20 Trisoligonucleotides withC3h Linkers. Angew. Chem. Int. Ed. 2008, 47, 3626–3630. [Google Scholar] [CrossRef]
  8. Fan, S.; Wang, D.; Kenaan, A.; Cheng, J.; Cui, D.; Song, J. Create Nanoscale Patterns with DNA Origami. Small 2019, 15, 1805554. [Google Scholar] [CrossRef] [PubMed]
  9. Endo, M.; Sugiyama, H. DNA Origami Nanomachines. Molecules 2018, 23, 1766. [Google Scholar] [CrossRef] [PubMed] [Green Version]
  10. Andersen, E.S.; Dong, M.; Nielsen, M.M.; Jahn, K.; Subramani, R.; Mamdouh, W.; Golas, M.M.; Sander, B.; Stark, H.; Oliveira, C.L.P.; et al. Self-assembly of a nanoscale DNA box with a controllable lid. Nature 2009, 459, 73–76. [Google Scholar] [CrossRef] [PubMed] [Green Version]
  11. Kim, D.N.; Kilchherr, F.; Dietz, H.; Bathe, M. Quantitative prediction of 3D solution shape and flexibility of nucleic acid nanostructures. Nucleic Acids Res. 2012, 40, 2862–2868. [Google Scholar] [CrossRef] [PubMed]
  12. Grossi, G.; Dalgaard Ebbesen Jepsen, M.; Kjems, J.; Andersen, E.S. Control of enzyme reactions by a reconfigurable DNA nanovault. Nat. Commun. 2017, 8, 992. [Google Scholar] [CrossRef] [PubMed] [Green Version]
  13. Madhanagopal, B.R.; Zhang, S.; Demirel, E.; Wady, H.; Chandrasekaran, A.R. DNA Nanocarriers: Programmed to Deliver. Trends Biochem. Sci. 2018, 43, 997–1013. [Google Scholar] [CrossRef]
  14. Juul, S.; Iacovelli, F.; Falconi, M.; Kragh, S.L.; Christensen, B.; Frøhlich, R.; Franch, O.; Kristoffersen, E.L.; Stougaard, M.; Leong, K.W.; et al. Temperature-Controlled Encapsulation and Release of an Active Enzyme in the Cavity of a Self-Assembled DNA Nanocage. ACS Nano 2013, 7, 9724–9734. [Google Scholar] [CrossRef] [PubMed] [Green Version]
  15. Franch, O.; Iacovelli, F.; Falconi, M.; Juul, S.; Ottaviani, A.; Benvenuti, C.; Biocca, S.; Ho, Y.-P.; Knudsen, B.R.; Desideri, A. DNA hairpins promote temperature controlled cargo encapsulation in a truncated octahedral nanocage structure family. Nanoscale 2016, 8, 13333–13341. [Google Scholar] [CrossRef] [PubMed]
  16. Raniolo, S.; Iacovelli, F.; Unida, V.; Desideri, A.; Biocca, S. In Silico and In Cell Analysis of Openable DNA Nanocages for miRNA Silencing. Int. J. Mol. Sci. 2019, 21, 61. [Google Scholar] [CrossRef] [Green Version]
  17. Chandrasekaran, A.R.; Wady, H.; Subramanian, H.K.K. Nucleic Acid Nanostructures for Chemical and Biological Sensing. Small 2016, 12, 2689–2700. [Google Scholar] [CrossRef]
  18. Rutten, I.; Daems, D.; Lammertyn, J. Boosting biomolecular interactions through DNA origami nano-tailored biosensing interfaces. J. Mater. Chem. B 2020. [Google Scholar] [CrossRef]
  19. Mathur, D.; Medintz, I.L. The Growing Development of DNA Nanostructures for Potential Healthcare-Related Applications. Adv. Healthc. Mater. 2019, 8, 1801546. [Google Scholar] [CrossRef] [Green Version]
  20. Yatsunyk, L.A.; Mendoza, O.; Mergny, J.L. Nano-oddities: Unusual nucleic acid assemblies for DNA-based nanostructures and nanodevices. Acc. Chem. Res. 2014, 47, 1836–1844. [Google Scholar] [CrossRef]
  21. Hu, Y.; Cecconello, A.; Idili, A.; Ricci, F.; Willner, I. Triplex DNA Nanostructures: From Basic Properties to Applications. Angew. Chem. Int. Ed. 2017, 56, 15210–15233. [Google Scholar] [CrossRef] [PubMed]
  22. Porchetta, A.; Idili, A.; Vallée-Bélisle, A.; Ricci, F. General Strategy to Introduce pH-Induced Allostery in DNA-Based Receptors to Achieve Controlled Release of Ligands. Nano Lett. 2015, 15, 4467–4471. [Google Scholar] [CrossRef] [PubMed] [Green Version]
  23. Kuzyk, A.; Urban, M.J.; Idili, A.; Ricci, F.; Liu, N. Selective control of reconfigurable chiral plasmonic metamolecules. Sci. Adv. 2017, 3, e1602803. [Google Scholar] [CrossRef] [PubMed] [Green Version]
  24. Ijäs, H.; Hakaste, I.; Shen, B.; Kostiainen, M.A.; Linko, V. Reconfigurable DNA Origami Nanocapsule for pH-Controlled Encapsulation and Display of Cargo. ACS Nano 2019, 13, 5959–5967. [Google Scholar] [CrossRef] [Green Version]
  25. Farag, N.; Mattossovich, R.; Merlo, R.; Nierzwicki, Ł.; Palermo, G.; Porchetta, A.; Perugino, G.; Ricci, F. Folding-upon-Repair DNA Nanoswitches for Monitoring the Activity of DNA Repair Enzymes. Angew. Chem. Int. Ed. 2021, 60, 7283–7289. [Google Scholar] [CrossRef] [PubMed]
  26. Iacovelli, F.; Idili, A.; Benincasa, A.; Mariottini, D.; Ottaviani, A.; Falconi, M.; Ricci, F.; Desideri, A. Simulative and Experimental Characterization of a pH-Dependent Clamp-like DNA Triple-Helix Nanoswitch. J. Am. Chem. Soc. 2017, 139, 5321–5329. [Google Scholar] [CrossRef] [Green Version]
  27. Iacovelli, F.; Cabungcal Hernandez, K.; Desideri, A.; Falconi, M. Probing the Functional Topology of a pH-Dependent Triple Helix DNA Nanoswitch Family through Gaussian Accelerated MD Simulation. J. Chem. Inf. Model. 2019, 59, 2746–2752. [Google Scholar] [CrossRef] [PubMed]
  28. Ottaviani, A.; Iacovelli, F.; Idili, A.; Falconi, M.; Ricci, F.; Desideri, A. Engineering a responsive DNA triple helix into an octahedral DNA nanostructure for a reversible opening/closing switching mechanism: A computational and experimental integrated study. Nucleic Acids Res. 2018, 46, 9951–9959. [Google Scholar] [CrossRef]
  29. Mariottini, D.; Idili, A.; Nijenhuis, M.A.D.; Ercolani, G.; Ricci, F. Entropy-Based Rational Modulation of the p K a of a Synthetic pH-Dependent Nanoswitch. J. Am. Chem. Soc. 2019, 141, 11367–11371. [Google Scholar] [CrossRef]
  30. Pettersen, E.F.; Goddard, T.D.; Huang, C.C.; Couch, G.S.; Greenblatt, D.M.; Meng, E.C.; Ferrin, T.E. UCSF Chimera—A Visualization System for Exploratory Research and Analysis. J. Comput. Chem. 2004, 25, 1605–1612. [Google Scholar] [CrossRef] [Green Version]
  31. Lu, X.-J.; Olson, W.K. 3DNA: A versatile, integrated software system for the analysis, rebuilding and visualization of three-dimensional nucleic-acid structures. Nat. Protoc. 2008, 3, 1213–1227. [Google Scholar] [CrossRef]
  32. Salomon-Ferrer, R.; Case, D.A.; Walker, R.C. An overview of the Amber biomolecular simulation package. Wiley Interdiscip. Rev. Comput. Mol. Sci. 2013, 3, 198–210. [Google Scholar] [CrossRef]
  33. Ivani, I.; Dans, P.D.; Noy, A.; Pérez, A.; Faustino, I.; Hospital, A.; Walther, J.; Andrio, P.; Goñi, R.; Balaceanu, A.; et al. Parmbsc1: A refined force field for DNA simulations. Nat. Methods 2015, 13, 55–58. [Google Scholar] [CrossRef] [Green Version]
  34. Jorgensen, W.L.; Chandrasekhar, J.; Madura, J.D.; Impey, R.W.; Klein, M.L. Comparison of simple potential functions for simulating liquid water. J. Chem. Phys. 1983, 79, 926–935. [Google Scholar] [CrossRef]
  35. Goga, N.; Rzepiela, A.J.; De Vries, A.H.; Marrink, S.J.; Berendsen, H.J.C. Efficient algorithms for langevin and DPD dynamics. J. Chem. Theory Comput. 2012, 8, 3637–3649. [Google Scholar] [CrossRef] [PubMed] [Green Version]
  36. Aoki, K.M.; Yoneya, M.; Yokoyama, H. Constant Pressure Md Simulation Method. Mol. Cryst. Liq. Cryst. 2004, 413, 109–116. [Google Scholar] [CrossRef]
  37. Ryckaert, J.P.; Ciccotti, G.; Berendsen, H.J.C. Numerical integration of the cartesian equations of motion of a system with constraints: Molecular dynamics of nalkanes. J. Comput. Phys. 1977, 23, 327–341. [Google Scholar] [CrossRef] [Green Version]
  38. Miyamoto, S.; Kollman, P.A. SETTLE: An analytical version of the SHAKE and RATTLE algorithm for rigid water models. J. Comput. Chem. 1992, 13, 952–962. [Google Scholar] [CrossRef]
  39. Darden, T.; York, D.; Pedersen, L. Particle mesh Ewald: An N⋅log(N) method for Ewald sums in large systems. J. Chem. Phys. 1993, 98, 10089–10092. [Google Scholar] [CrossRef] [Green Version]
  40. Babin, V.; Roland, C.; Sagui, C. Adaptively biased molecular dynamics for free energy calculations. J. Chem. Phys. 2008, 128, 134101. [Google Scholar] [CrossRef] [Green Version]
  41. Barducci, A.; Bussi, G.; Parrinello, M. Well-tempered metadynamics: A smoothly converging and tunable free-energy method. Phys. Rev. Lett. 2008, 100, 020603. [Google Scholar] [CrossRef] [Green Version]
  42. Abraham, M.J.; Murtola, T.; Schulz, R.; Páll, S.; Smith, J.C.; Hess, B.; Lindahl, E. GROMACS: High performance molecular simulations through multi-level parallelism from laptops to supercomputers. SoftwareX 2015, 1–2, 19–25. [Google Scholar] [CrossRef] [Green Version]
  43. Daura, X.; Gademann, K.; Jaun, B.; Seebach, D.; van Gunsteren, W.F.; Mark, A.E. Peptide Folding: When Simulation Meets Experiment. Angew. Chem. Int. Ed. 1999, 38, 236–240. [Google Scholar] [CrossRef]
  44. Blanchet, C.; Pasi, M.; Zakrzewska, K.; Lavery, R. CURVES+ web server for analyzing and visualizing the helical, backbone and groove parameters of nucleic acid structures. Nucleic Acids Res. 2011, 39, W68–W73. [Google Scholar] [CrossRef] [Green Version]
  45. Hunter, J.D. Matplotlib: A 2D Graphics Environment. Comput. Sci. Eng. 2007, 9, 90–95. [Google Scholar] [CrossRef]
  46. Ginestet, C. Ggplot2: Elegant Graphics for Data Analysis. J. R. Stat. Soc. Ser. A (Stat. Soc.) 2011, 174, 245–246. [Google Scholar] [CrossRef]
  47. Iannone, F.; Ambrosino, F.; Bracco, G.; De Rosa, M.; Funel, A.; Guarnieri, G.; Migliori, S.; Palombi, F.; Ponti, G.; Santomauro, G.; et al. CRESCO ENEA HPC clusters: A working example of a multifabric GPFS Spectrum Scale layout. In Proceedings of the 2019 International Conference on High Performance Computing & Simulation (HPCS), Dublin, Ireland, 15–19 July 2019; pp. 1051–1052. [Google Scholar]
  48. Zuker, M. Mfold web server for nucleic acid folding and hybridization prediction. Nucleic Acids Res. 2003, 31, 3406–3415. [Google Scholar] [CrossRef]
  49. Zadeh, J.N.; Steenberg, C.D.; Bois, J.S.; Wolfe, B.R.; Pierce, M.B.; Khan, A.R.; Dirks, R.M.; Pierce, N.A. NUPACK: Analysis and design of nucleic acid systems. J. Comput. Chem. 2011, 32, 170–173. [Google Scholar] [CrossRef]
Figure 1. Schematic (A) and cartoon (BD) representations of the simulated diprotic DNA nanoswitches. The red and blue colors indicate the two strands forming the double helix region, while the black indicates the conserved five-base loop, and the green indicates the TFO. The black dashed line in (A) and the tan-colored ribbon in (BD) represent the 5 (B), 15 (C) and 25 (D) bases variable loop. The pictures were produced using the UCSF Chimera 1.12 program [30].
Applsci 11 04052 g001
Figure 2. Iso-energetic contour of the free energy surface plotted as a function of the HB number established between the TFO and the DH, and of the distance between their centers of mass for the DIPRO5 (A), DIPRO15 (B) and DIPRO25 (C) systems. The upper structures are the representative configurations of the most populated clusters of the Bound (B), Intermediate (I0 and I1) and Transition (TSunb) states, extracted from the trajectories. The color scheme follows that described in Figure 1.
Applsci 11 04052 g002
Figure 3. Iso-energetic contour of the free energy surface plotted as a function of the HB number established between the TFO and the DH, and of the distance between their centers of mass for the TETRA5 (A), TETRA15 (B) and TETRA25 (C) systems. The upper structures are the representative configurations of the most populated clusters of the Bound (B), Intermediate (I0 and I1) and Transition (TSunb) states, extracted from the trajectories. The color scheme follows that described in Figure 1.
Applsci 11 04052 g003
Figure 4. Per-base unbinding profile of TFO from the DH as a function of time. For each 2-ns time window, the distance between the centers of mass of the TFO and of the DH C2′ atoms was calculated, and the corresponding rectangle in the plot was colored if the average distance was lower than 3.2 Å. A white rectangle indicates the loss of the interaction. The profile is reported for the DIPRO5 (A), DIPRO15 (B), DIPRO25 (C), TETRA5 (D), TETRA15 (E) and TETRA25 (F) switches.
Applsci 11 04052 g004
Figure 5. (A) Free-energy profile of TFO unbinding from the DH, calculated along a minimum energy path, as a function of a generalized ‘Reaction Coordinate’ for the DIPRO5 (red line), DIPRO15 (green line) and DIPRO25 (blue line) switches. (B) Free-energy profile of TFO unbinding from the DH, calculated along a minimum energy path, as a function of a generalized ‘Reaction Coordinate’ for the TETRA5 (red line), TETRA15 (green line) and TETRA25 (blue line) switches. For all the systems, the free energy profile is characterized by the presence of three minima, corresponding to the bound state (B) and two intermediate (I0 and I1) states. The Tsunb state represents the final step of the ABMD simulations.
Applsci 11 04052 g005
Figure 6. (A) 2D projection of the principal component of the motions of the C2′ atoms of the variable loop of the DIPRO5 (red circles), DIPRO15 (green circles) and DIPRO25 (blue circles) switches. (B) 2D projection of the principal component of the motions of the C2′ atoms of the variable loop of the TETRA5 (red circles), TETRA15 (green circles) and TETRA25 (blue circles) switches.
Applsci 11 04052 g006
Publisher’s Note: MDPI stays neutral with regard to jurisdictional claims in published maps and institutional affiliations.

